Mokwa, Cuelho, and Browne TRB 2008 1 Laboratory Testing of Soil Using the Superpave Gyratory Compactor Robert Mokwa, Ph.D., P.E., Eli Cuelho, P.E., and Michael Browne Robert Mokwa (primary contact) Associate Professor Montana State University Department of Civil Engineering 205 Cobleigh Hall Bozeman, MT, 59717 1-406-994-7277 (voice) 1-406-994-6105 (fax) [email protected](e-mail) Eli Cuelho Research Engineer Western Transportation Institute, Montana State University Bozeman, MT Michael Browne Staff Engineer URS Corporation, Denver, CO Published in the Transportation Research Board 2008 Proceedings, Committee AFS10, Transportation Earthworks, Advanced Technologies for Accelerated Earthwork Construction and Performance Monitoring. January 14-17, 2008, Washington, DC. ABSTRACT: Earthwork construction methods have changed substantially over the past 50 years, although the Proctor laboratory test for evaluating compacted densities has remained relatively unchanged. One shortcoming of the Proctor test is that it uses impact loads to compact soil in a stiff non- yielding mold, whereas modern field compaction methods rely on a combination of kneading, vibration, and increased normal pressures to achieve high densities. A suite of laboratory tests were conducted on soils using the Superpave gyratory compactor to analyze the primary variables that influence soil compaction. Gyratory compaction tests were conducted on four soil types that represent a broad range of materials that may be encountered during construction. Gyratory dry densities were compared to standard and modified Proctor maximum dry densities to explore potential differences between gyratory and impact laboratory compaction methods. The results indicate that increasing the confining pressure is the most effective method of increasing the dry density of fine-grained soils, while increasing the number of gyrations is the most effective method of increasing the dry density of non-cohesive, granular soils. Although the gyratory compaction process has been demonstrated to simulate field compaction of hot mix asphalt, results from this study demonstrate that gyratory compacted maximum dry densities are not substantially different than dry density values obtained using traditional laboratory Proctor tests, even though the physical process of achieving compaction are quite different. Furthermore, gyratory compaction encounters many of the same disadvantages as the Proctor test when compacting cohesionless soils at relatively high water contents.
Transcript
Mokwa, Cuelho, and Browne TRB 2008
1
Laboratory Testing of Soil Using the Superpave Gyratory Compactor Robert Mokwa, Ph.D., P.E., Eli Cuelho, P.E., and Michael Browne Robert Mokwa (primary contact) Associate Professor Montana State University Department of Civil Engineering 205 Cobleigh Hall Bozeman, MT, 59717 1-406-994-7277 (voice) 1-406-994-6105 (fax) [email protected] (e-mail) Eli Cuelho Research Engineer Western Transportation Institute, Montana State University Bozeman, MT Michael Browne Staff Engineer URS Corporation, Denver, CO Published in the Transportation Research Board 2008 Proceedings, Committee AFS10, Transportation Earthworks, Advanced Technologies for Accelerated Earthwork Construction and Performance Monitoring. January 14-17, 2008, Washington, DC.
ABSTRACT: Earthwork construction methods have changed substantially over the past 50 years, although the Proctor laboratory test for evaluating compacted densities has remained relatively unchanged. One shortcoming of the Proctor test is that it uses impact loads to compact soil in a stiff non-yielding mold, whereas modern field compaction methods rely on a combination of kneading, vibration, and increased normal pressures to achieve high densities. A suite of laboratory tests were conducted on soils using the Superpave gyratory compactor to analyze the primary variables that influence soil compaction. Gyratory compaction tests were conducted on four soil types that represent a broad range of materials that may be encountered during construction. Gyratory dry densities were compared to standard and modified Proctor maximum dry densities to explore potential differences between gyratory and impact laboratory compaction methods. The results indicate that increasing the confining pressure is the most effective method of increasing the dry density of fine-grained soils, while increasing the number of gyrations is the most effective method of increasing the dry density of non-cohesive, granular soils. Although the gyratory compaction process has been demonstrated to simulate field compaction of hot mix asphalt, results from this study demonstrate that gyratory compacted maximum dry densities are not substantially different than dry density values obtained using traditional laboratory Proctor tests, even though the physical process of achieving compaction are quite different. Furthermore, gyratory compaction encounters many of the same disadvantages as the Proctor test when compacting cohesionless soils at relatively high water contents.
Mokwa, Cuelho, and Browne TRB 2008
2
INTRODUCTION This paper presents the results of a laboratory study that was conducted to evaluate the feasibility of using a Superpave Gyratory Compactor (SGC) to compact soil specimens. Using the SGC to compact soil is attractive because the gyratory compaction process simulates field compaction more closely than traditional impact compaction tests, and the gyratory compactor has an established track record of success with asphalt compaction. An extensive number of gyratory compaction tests were performed on soil in this study to evaluate the effects of soil type, water content, and variation in gyratory machine parameters (confining pressure and gyration count). Gyratory dry densities were compared to standard and modified Proctor maximum dry densities to explore potential differences between gyratory and impact laboratory compaction methods.
Gyratory compactors were initially developed in the late 1930s and have since evolved into the primary laboratory method of compaction for hot mix asphalt (HMA) in the U.S. Gyratory compactors were designed to simulate orientation of aggregate, degradation of aggregate, field compaction, and traffic degradation that occurs in HMA during production, compaction, and traffic loading (1). Today, over 2,000 SGCs are in use in the U.S. for the design and field management of asphalt mixtures. Eight different models of the SGC are available from at least five different companies in the U.S. (2). Most of these models provide a means of adjusting and calibrating the four primary parameters that affect the degree of compaction of laboratory HMA specimens: i) gyratory angle, ii) confining pressure, iii) rate of gyration, and iv) number of gyrations. AASHTO Standard Test Method T312 (Preparing and Determining the Density of Hot-Mix Asphalt (HMA) Specimens by Means of the Superpave Gyratory Compactor) provides specific values for setting or controlling these parameters when testing HMA. However, there are no established guidelines or standards for soil testing using the SGC.
To date, studies conducted in Florida (3) and Rhode Island (4) provide the only published information on the use of a SGC to compact soil. Other studies have used non-Superpave gyratory compactors to compact soil or have used the SGC to compact soils for other purposes, such as to study swell characteristics and shear resistance (5). A study conducted on sandy soils in Florida (3) recommended a test procedure utilizing a 200 kPa confinement pressure, 1.25o gyration angle, 90 gyrations, and a rate of 20 gyrations per minute. The authors of that study surmised that increasing the vertical pressure was not an affective means of increasing the dry unit weight of sandy soils, which was the focus of their study.
For testing HMA, AASHTO T312 specifies placement of 4.5 to 4.7 kg of asphalt into the gyratory mold in one lift. The sample is compacted at a rate of 30 gyrations per minute, a confining pressure of 600 ± 18 kPa, and an angle of gyration of 1.25o ± 0.02o. A set number of gyrations for compacting asphalt samples is not specified. The optimum number of gyrations (or gyration count) is unique to each asphalt mixture and depends on forecasted traffic levels and expected maximum air temperature at the project location. The practical gyration count to achieve adequate compaction of HMA samples spans a range from 68 to 288. The number of required gyrations generally increases with air temperature and the design equivalent single axle load (ESAL) value.
MATERIALS Four different soils were selected to represent a wide range of material types. Testing was first conducted on dry soils, followed by tests on moist soils at water contents that spanned a range from dry to wet of the modified Proctor optimum water content. The four soils were classified in general accordance with the AASHTO classification system, as follows: A-1-a (stone fragments, gravel, and sand), A-3 (fine non-plastic sand), A-4 (silt), and A-7-6 (clay). Geotechnical index properties are provided in Table 1, and grain sizes are shown in Table 2. Additional properties of the soils are described in (6).
Mokwa, Cuelho, and Browne TRB 2008
3
TABLE 1 Index Properties of Test Soils Standard Proctor Modified Proctor Atterberg Limits Soil
EQUIPMENT AND SETTINGS A Pine Instrument Company, Superpave AFGC125X Gyratory Compactor was used for all gyratory compaction tests conducted in this study. The AFGC125X is an automated gyratory compactor that was designed to compact Superpave HMA specimens. Compaction is achieved by applying a static confining pressure while simultaneously gyrating the mold to cause a shearing force. During testing with the AFGC125X; confining pressure, angle of gyration, and rate of gyration are held constant. The confining pressure can be adjusted on the SGC computer interface prior to beginning a test. The angle of gyration must be manually adjusted by changing the roller positions on the carriage body. This is a time and labor intensive process; consequently, for this study an angle of 1.25o degrees was used for all testing. The Pine AFGC125X SGC is only capable of running at the Superpave recommended 30 gyrations per minute; therefore, the effect of gyration rate was not evaluated in this study. The number of gyrations can be preset at the beginning of the test.
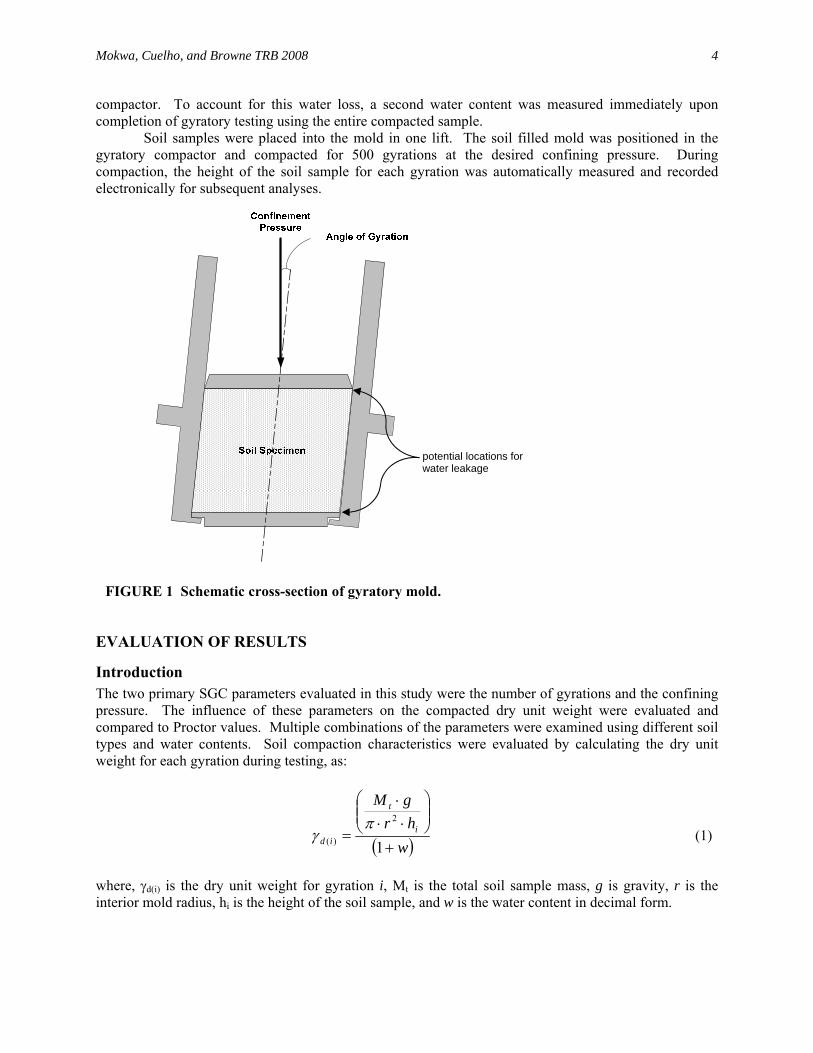
The first step in developing a test procedure for soils involved a trial and error process that started with a combination of settings based on the asphalt gyratory testing standard (AASHTO T312) and recommendations from previous experimental soil compaction procedures conducted by others (3, 5, 7). Multiple SGC confining pressures were used on both dry and moist soil samples. The SGC is capable of applying confining pressures ranging from 200 to 999 kPa. The majority of testing during this study used confining pressures ranging from 200 to 600 kPa. The position and direction of the confining pressure in relation to the gyratory mold is shown in Figure 1.
Gyratory testing was performed in two phases. The initial phase involved testing soils in a dry state at multiple confining pressures. The second phase involved testing soils at various water contents and confining pressures to develop compaction curves (w versus γdry) from the SGC that are similar in format to traditional Proctor compaction curves. Dry soil samples were initially oven dried at 110° C and then cooled to room temperature prior to compaction. Any visible clumps of soil or conglomerated particles were broken down and uniformly distributed prior to compaction. Confining pressures of 200, 300, 400, 500, and 600 kPa were used for each of the four dry soils. Moist gyratory compaction samples were thoroughly mixed with water at water contents ranging from dry to wet of the modified Proctor optimum water content. Soils that contained cohesive fines were covered and stored for at least 24 hours prior to testing. Moist samples were compacted at confining pressures of 200 and 600 kPa. Compaction of the granular soils at high water contents caused water to be forced out of the soil and into the gyratory
Mokwa, Cuelho, and Browne TRB 2008
4
compactor. To account for this water loss, a second water content was measured immediately upon completion of gyratory testing using the entire compacted sample.
Soil samples were placed into the mold in one lift. The soil filled mold was positioned in the gyratory compactor and compacted for 500 gyrations at the desired confining pressure. During compaction, the height of the soil sample for each gyration was automatically measured and recorded electronically for subsequent analyses.
FIGURE 1 Schematic cross-section of gyratory mold.
EVALUATION OF RESULTS
Introduction The two primary SGC parameters evaluated in this study were the number of gyrations and the confining pressure. The influence of these parameters on the compacted dry unit weight were evaluated and compared to Proctor values. Multiple combinations of the parameters were examined using different soil types and water contents. Soil compaction characteristics were evaluated by calculating the dry unit weight for each gyration during testing, as:
( )whr
gM
i
t
id +
⎟⎟⎠
⎞⎜⎜⎝
⎛⋅⋅⋅
=1
2
)(
πγ (1)
where, γd(i) is the dry unit weight for gyration i, Mt is the total soil sample mass, g is gravity, r is the interior mold radius, hi is the height of the soil sample, and w is the water content in decimal form.
potential locations for water leakage
Mokwa, Cuelho, and Browne TRB 2008
5
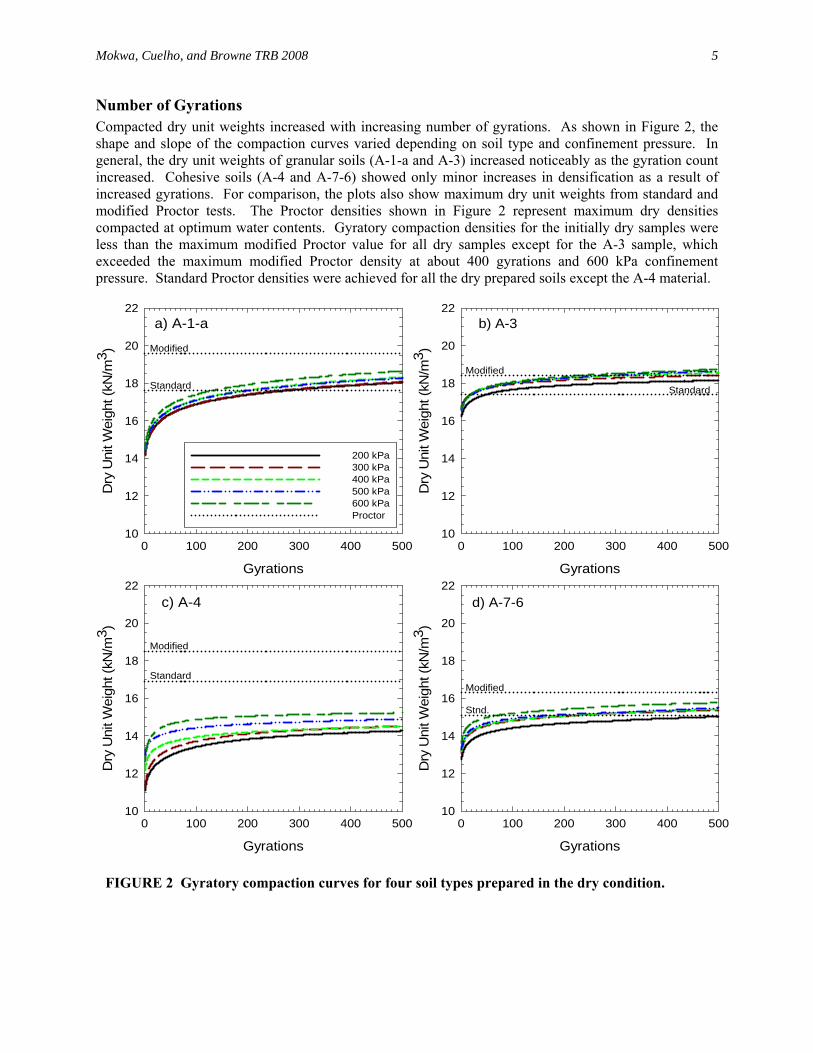
Number of Gyrations Compacted dry unit weights increased with increasing number of gyrations. As shown in Figure 2, the shape and slope of the compaction curves varied depending on soil type and confinement pressure. In general, the dry unit weights of granular soils (A-1-a and A-3) increased noticeably as the gyration count increased. Cohesive soils (A-4 and A-7-6) showed only minor increases in densification as a result of increased gyrations. For comparison, the plots also show maximum dry unit weights from standard and modified Proctor tests. The Proctor densities shown in Figure 2 represent maximum dry densities compacted at optimum water contents. Gyratory compaction densities for the initially dry samples were less than the maximum modified Proctor value for all dry samples except for the A-3 sample, which exceeded the maximum modified Proctor density at about 400 gyrations and 600 kPa confinement pressure. Standard Proctor densities were achieved for all the dry prepared soils except the A-4 material.
FIGURE 2 Gyratory compaction curves for four soil types prepared in the dry condition.
a) A-1-a
Gyrations
0 100 200 300 400 500
Dry
Uni
t Wei
ght (
kN/m
3 )
10
12
14
16
18
20
22b) A-3
Gyrations
0 100 200 300 400 500
Dry
Uni
t Wei
ght (
kN/m
3 )
10
12
14
16
18
20
22
c) A-4
Gyrations
0 100 200 300 400 500
Dry
Uni
t Wei
ght (
kN/m
3 )
10
12
14
16
18
20
22
200 kPa300 kPa400 kPa500 kPa600 kPaProctor
d) A-7-6
Gyrations
0 100 200 300 400 500
Dry
Uni
t Wei
ght (
kN/m
3 )
10
12
14
16
18
20
22
Note: Confining pressures vary from 200 kPa (bottom curve)to 600 kPa (top curve) for all 4 plots.
Modified
StandardModified
Standard
Modified
StandardModified
Stnd.
Mokwa, Cuelho, and Browne TRB 2008
6
All samples achieved at least 90% of total compaction in the first 100 gyrations, although dry unit weights continued to gradually increase at a rather slow rate until compaction was terminated at 500 gyrations. Rate of compaction was evaluated numerically by comparing the tangent slopes of the compaction curves at 100 and 500 gyrations. Tangent slopes were calculated by taking the derivative of the best fit logarithmic line for each confining pressure and soil type. Table 3 shows the average value and standard deviation of the gyratory compaction slope at 100 and 500 gyrations, respectively. At 100 gyrations, the tangent slopes of the four soil types were of the same order of magnitude, with the A-1-a slope approximately twice as high as the other soils. The compaction rate for the finer grained soils tapered off rapidly to a nearly horizontal slope after about 100 gyrations. At 500 gyrations, the tangent slope of the A-1-a soil increased at a rate that was about ten times greater than observed for the other three soils.
TABLE 3 Rate of Change in the Gyratory Compaction Curve at 100 and 500 Gyrations Soil Type
Average Slope at 100 Gyrations
(kN/m3/gyration)
Average Slope at 500 Gyrations
(kN/m3/gyration) A-1-a 7.40 x 10⁻³ 1.48 x 10⁻³ A-3 3.72 x 10⁻³ 7.43 x 10⁻⁴ A-4 4.39 x 10⁻³ 8.78 x 10⁻⁴ A-7-6 3.70 x 10⁻³ 7.39 x 10⁻⁴
This evaluation indicates that maximum density can be achieved for fine-grained soils at about
200 to 350 gyrations, while coarse-grained granular soils may require more than 500 gyrations to achieve a maximum gyratory density, when prepared in a dry state. Although higher densities can be achieved at larger gyration counts, there are disadvantages of compacting soil samples to 500 or more gyrations, these include:
High gyration counts may result in elevated amounts of aggregate degradation. Although,
comparative gradation tests conducted on the A-1-a and A-3 soils (compacted to 500 gyrations) showed only relatively minor aggregate degradation as a result of testing. It is possible that aggregates composed of softer or more friable minerals may experience greater particle breakdown at high gyration counts.
High gyration counts will ultimately lead to increased wear on the SGC mold, particularly when testing dry granular soils that lack the lubricating effects of water or oil (in the case of HMA).
SGCs compact at 30 gyrations per minute; therefore, the testing time is increased as more gyrations are used. Experience from this study indicates the time required to run a test is relatively minor in comparison to the time required to prepare soil samples for compaction.
Based on the range of soil types examined in this study, it appears the advantages of a higher
gyration count outweigh the potential disadvantages. Higher gyration counts provide a more complete relationship between dry unit weight and number of gyrations and assure that the maximum dry density is achieved.
Confining Pressure Figure 2 shows that increasing the confining pressure from 200 kPa to 600 kPa results in an increase in dry unit weight that varies depending on soil type. At 500 gyrations, the A-1-a soil exhibited only relatively minor increases in maximum dry unit weight as a result of increasing the confining pressure from 200 to 600 kPa. Soils with smaller particle sizes (A-3, A-4, and A-7-6) exhibited more substantial increases in densification as a result of higher confining pressures.
Mokwa, Cuelho, and Browne TRB 2008
7
There are disadvantages and advantages of using high confining pressure for compacting soil
specimens. Disadvantages of using 600 kPa confinement include:
High confining pressures may subject the laboratory soil samples to pressures and compaction energies that are greater than typical field construction conditions.
High confining pressures will ultimately lead to increased wear on the SGC molds and machine.
High confining pressures would likely cause more particle degradation than a low confining pressure.
Advantages of using 600 kPa confinement include:
The highest dry unit weights for all soil types occurred at the highest confining pressure of 600 kPa.
Gyratory compaction curves were more clearly defined in terms of the relationship between maximum dry unit weight and optimum water content at 600 kPa confinement pressure.
A 600 kPa confining pressure was required for the A-4 soil to surpass the standard Proctor maximum dry unit weight. The A-7-6 soil was only able to surpass the modified Proctor maximum dry unit weight when a 600 kPa confining pressure was used.
The testing procedure would be the same as that recommended in the AASHTO T312 standard for HMA.
In general, the authors believe that in most cases the advantages of using a 600 kPa confining
pressure outweigh potential disadvantages.
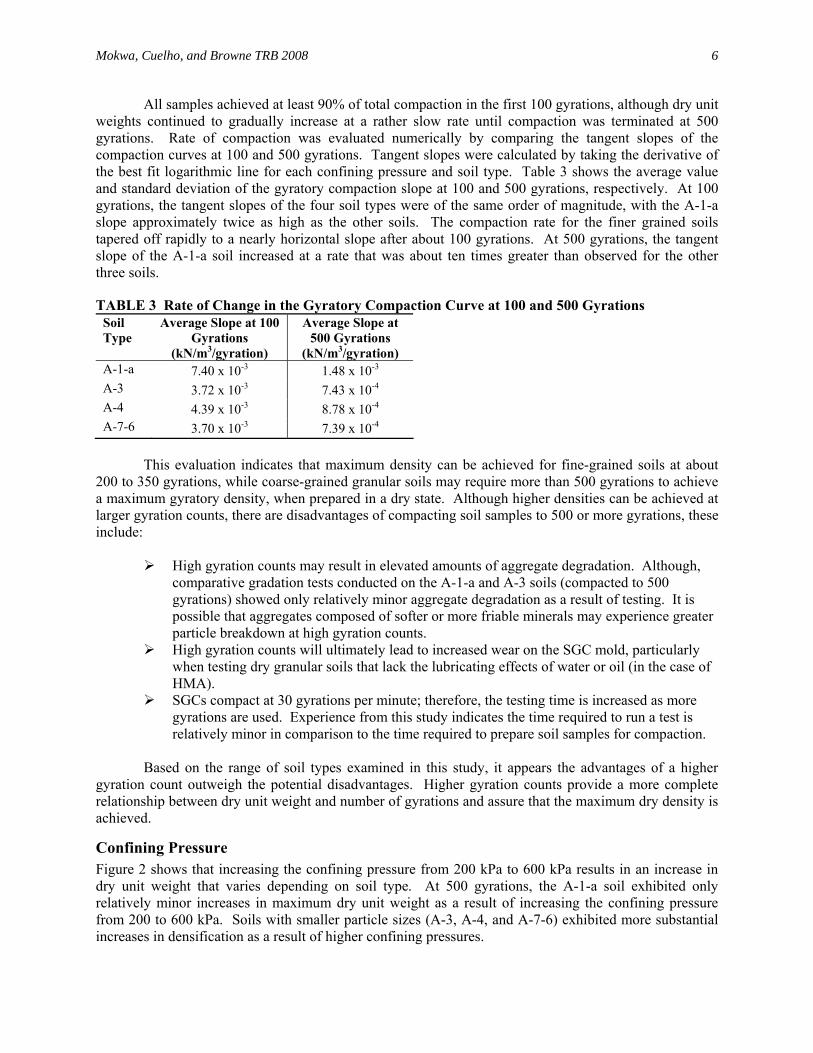
Compaction Water Content When compacted dry, three of the four soils (A-1-a, A-4, A-7-6) did not achieve their corresponding modified Proctor maximum dry unit weights even at high confining pressures and 500 gyrations. Test soils were gyratory compacted at different water contents to compare gyratory densities to densities achieved using the Proctor test; to determine if optimum water contents could be discerned from gyratory compaction data; and to compare the relationship between dry unit weight and water content with conventional Proctor compaction curves. All of the soils were compacted at ranges of water contents at 200 and 600 kPa confinement to simultaneously determine the effect of confinement and water content. Examples of these results are shown in Figure 3 for the A-1-a soil. Results for the other three soils are provided in (6).
Mokwa, Cuelho, and Browne TRB 2008
8
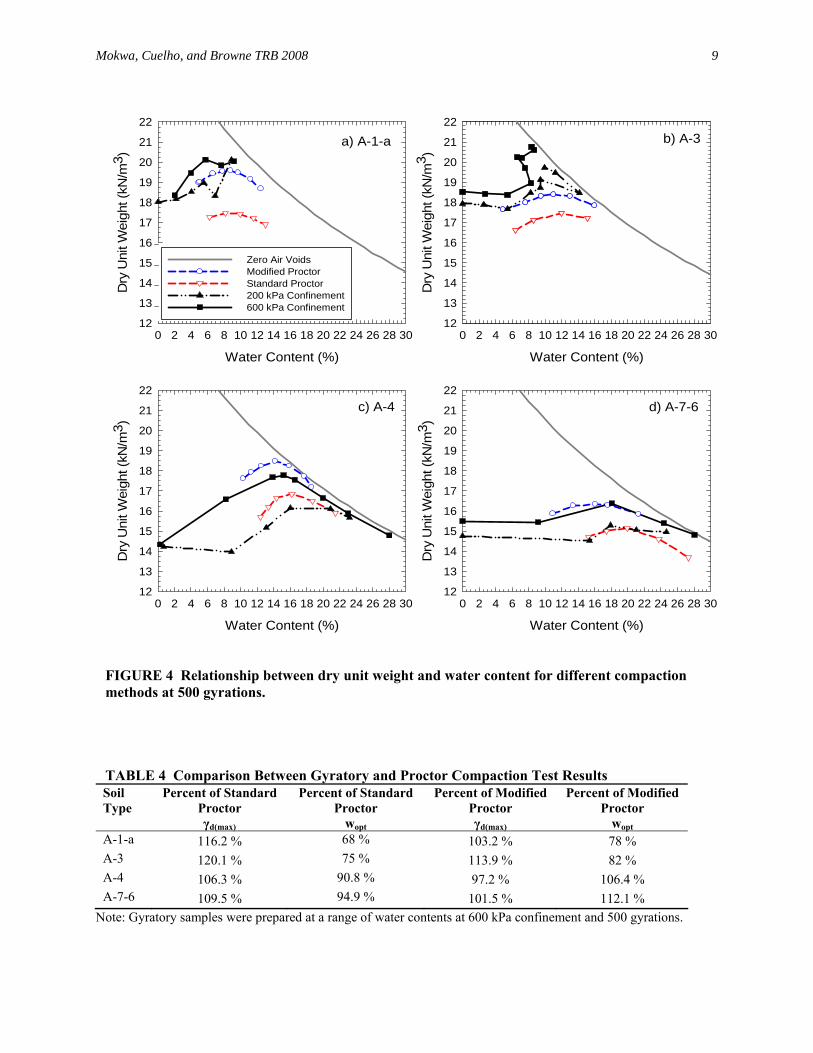
FIGURE 3 Variation of dry unit weight for A-1-a samples prepared at different water contents and gyrated at: a) 200 kPa confinement and b) 600 kPa confinement.
Data plotted in Figure 3 can be re-arranged into a format that is similar to a traditional Proctor
compaction curve, as shown in Figure 4. Gyratory compaction of soils with adjusted water contents produced dry unit weights that matched or surpassed modified Proctor maximum dry unit weights for all samples except the A-4 soil.
Optimum water contents were determined for the cohesive soils. The non-cohesive, granular soils were incapable of retaining water at high water contents; therefore, optimum water contents could only be estimated using the SGC. Similar problems occur in the Proctor tests when compacting wet cohesionless soils.
A comparison of densities achieved at the highest gyratory compaction energies used in this study (600 kPa confinement pressure and 500 gyrations) to standard and modified Proctor maximum dry densities are summarized in Table 4. The fine-grained soils (A-4 and A-7-6) compacted to the lowest gyratory densities in comparison to their corresponding Proctor values. Of the four soil types, the A-4 soil was the only soil in which the gyratory maximum dry density was less than the modified Proctor value (97.2%). The A-3 soil achieved the highest relative densification: 120% and 114% greater than the standard and modified Proctor values, respectively. Optimum water contents measured from gyratory tests on the coarse-grained soils were lower than corresponding Proctor values, while optimum gyratory water contents for the fine-grained soils were slightly lower than the standard Proctor values and slightly higher than the modified Proctor values.
Note: Gyratory samples were prepared at a range of water contents at 600 kPa confinement and 500 gyrations.
a) A-1-a
Water Content (%)
0 2 4 6 8 10 12 14 16 18 20 22 24 26 28 30
Dry
Uni
t Wei
ght (
kN/m
3 )
12
13
14
15
16
17
18
19
20
21
22
c) A-4
Water Content (%)
0 2 4 6 8 10 12 14 16 18 20 22 24 26 28 30
Dry
Uni
t Wei
ght (
kN/m
3 )
12
13
14
15
16
17
18
19
20
21
22d) A-7-6
Water Content (%)
0 2 4 6 8 10 12 14 16 18 20 22 24 26 28 30
Dry
Uni
t Wei
ght (
kN/m
3 )
12
13
14
15
16
17
18
19
20
21
22
b) A-3
Water Content (%)
0 2 4 6 8 10 12 14 16 18 20 22 24 26 28 30
Dry
Uni
t Wei
ght (
kN/m
3 )
12
13
14
15
16
17
18
19
20
21
22
Zero Air VoidsModified ProctorStandard Proctor
200 kPa Confinement600 kPa Confinement
Zero Air VoidsModified ProctorStandard Proctor200 kPa Confinement600 kPa Confinement
Mokwa, Cuelho, and Browne TRB 2008
10
A-1-a Soil Gyratory compaction curves for the A-1-a soil at confining pressures of 200 and 600 kPa are shown in Figure 4a. Like many free-draining soils, the A-1-a soil does not have a well defined optimum water content or maximum dry unit weight. The general trend of the compaction curve shows that the material increases in dry unit weight as the water content is increased. Additional points on the wet side of optimum would likely show this more definitively; however, the soil is near saturation and has free standing water when it is mixed at water contents above about 8%. The results indicate that compacted densities greater than the standard and modified Proctor maximum dry densities can be achieved in the gyratory compactor when water is added to the sample. In general, higher dry unit weights were achieved using gyratory compaction than standard and modified Proctor tests. For example, at 75 gyrations, gyratory compaction achieved densities that were 109.0% and 96.8% of the standard and modified Proctor dry unit weights, respectively. At 500 gyrations, densities of 115.8% and 102.9% of standard and modified Proctor were achieved.
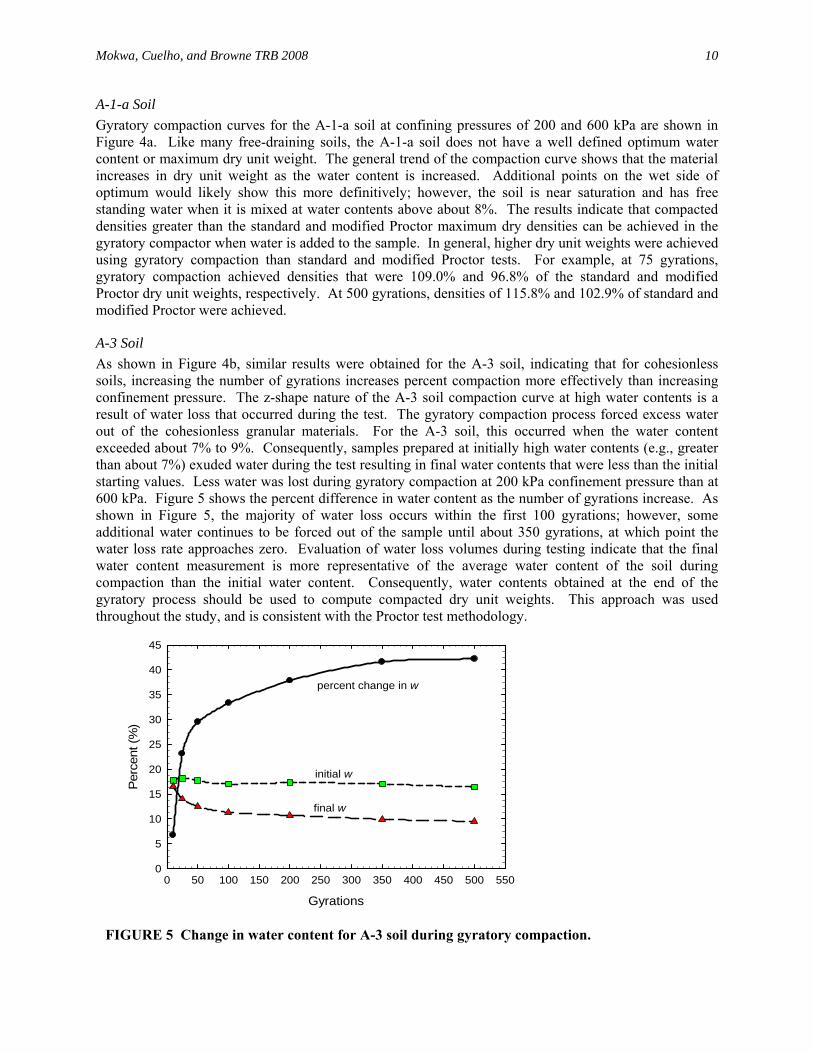
A-3 Soil As shown in Figure 4b, similar results were obtained for the A-3 soil, indicating that for cohesionless soils, increasing the number of gyrations increases percent compaction more effectively than increasing confinement pressure. The z-shape nature of the A-3 soil compaction curve at high water contents is a result of water loss that occurred during the test. The gyratory compaction process forced excess water out of the cohesionless granular materials. For the A-3 soil, this occurred when the water content exceeded about 7% to 9%. Consequently, samples prepared at initially high water contents (e.g., greater than about 7%) exuded water during the test resulting in final water contents that were less than the initial starting values. Less water was lost during gyratory compaction at 200 kPa confinement pressure than at 600 kPa. Figure 5 shows the percent difference in water content as the number of gyrations increase. As shown in Figure 5, the majority of water loss occurs within the first 100 gyrations; however, some additional water continues to be forced out of the sample until about 350 gyrations, at which point the water loss rate approaches zero. Evaluation of water loss volumes during testing indicate that the final water content measurement is more representative of the average water content of the soil during compaction than the initial water content. Consequently, water contents obtained at the end of the gyratory process should be used to compute compacted dry unit weights. This approach was used throughout the study, and is consistent with the Proctor test methodology.
FIGURE 5 Change in water content for A-3 soil during gyratory compaction.
Gyrations
0 50 100 150 200 250 300 350 400 450 500 550
Perc
ent (
%)
0
5
10
15
20
25
30
35
40
45
final w
initial w
percent change in w
Mokwa, Cuelho, and Browne TRB 2008
11
A-4 Soil The compaction curves for the A-4 soil (Figure 4c) are more defined than the two granular soils. This is partially due to the A-4 soil retaining all of the water during gyratory compaction. The majority of densification of the moist A-4 soils occurred within the first 100 gyrations. Samples of the A-4 soil prepared at low water contents compacted at a slower rate than samples prepared initially at higher water contents. Samples that were prepared near or above the optimum water content achieved the majority of densification within the first 15 gyrations, with negligible increases of density for the remainder of the test.
A-7-6 Soil The A-7-6 soil exhibited many of the same gyratory characteristics and trends as the A-4 soil. The moist A-7-6 samples achieved the majority of densification within the first 150 gyrations. Similar to the A-4 soil, samples that were prepared near or above the optimum water content achieved the majority of densification within the first 15 gyrations. Only samples compacted at 600 kPa confining pressure achieved dry unit weights equal to or greater than the modified Proctor maximum dry unit weight.
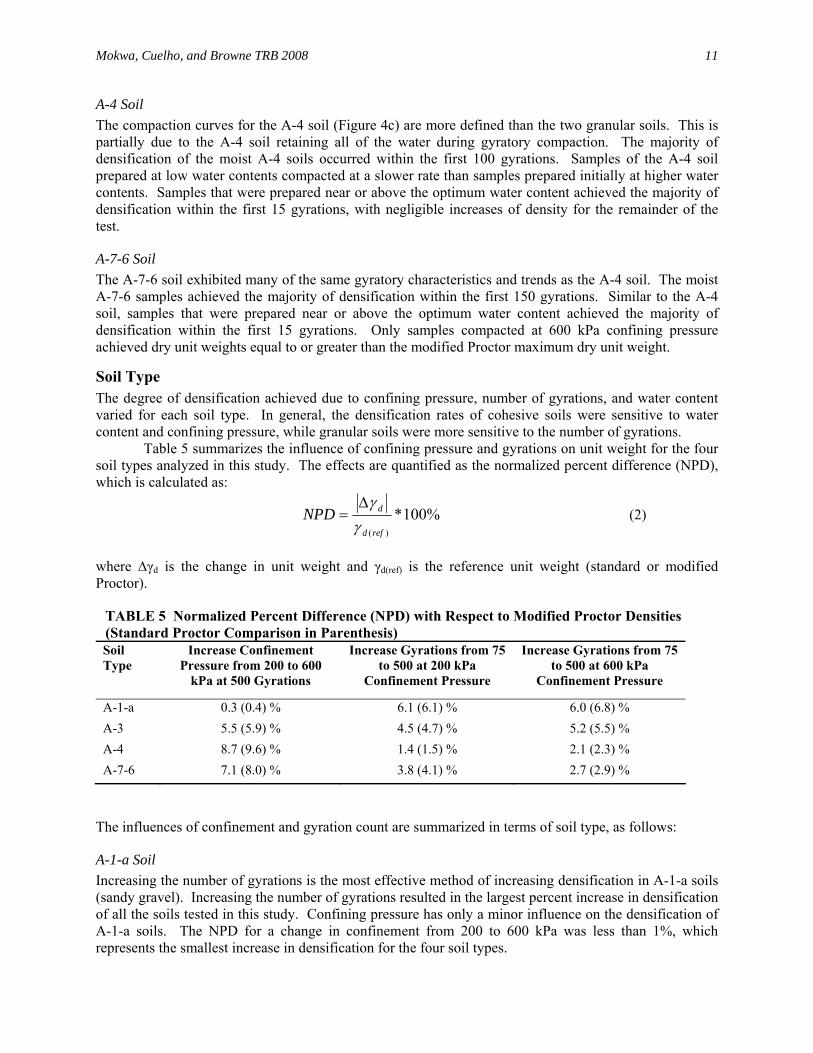
Soil Type The degree of densification achieved due to confining pressure, number of gyrations, and water content varied for each soil type. In general, the densification rates of cohesive soils were sensitive to water content and confining pressure, while granular soils were more sensitive to the number of gyrations.
Table 5 summarizes the influence of confining pressure and gyrations on unit weight for the four soil types analyzed in this study. The effects are quantified as the normalized percent difference (NPD), which is calculated as:
%100*)(refd
dNPDγγΔ
= (2)
where ∆γd is the change in unit weight and γd(ref) is the reference unit weight (standard or modified Proctor).
TABLE 5 Normalized Percent Difference (NPD) with Respect to Modified Proctor Densities (Standard Proctor Comparison in Parenthesis) Soil Type
The influences of confinement and gyration count are summarized in terms of soil type, as follows:
A-1-a Soil Increasing the number of gyrations is the most effective method of increasing densification in A-1-a soils (sandy gravel). Increasing the number of gyrations resulted in the largest percent increase in densification of all the soils tested in this study. Confining pressure has only a minor influence on the densification of A-1-a soils. The NPD for a change in confinement from 200 to 600 kPa was less than 1%, which represents the smallest increase in densification for the four soil types.
Mokwa, Cuelho, and Browne TRB 2008
12
A-3 Soil Compaction of the A-3 soil (sand) was influenced by both confining pressure and number of gyrations. Increasing the confining pressure caused a slightly larger percent increase in densification than increasing the number of gyrations. In general, densification can be increased for this type of soil by increasing the number of gyrations or increasing the confining pressure, both having approximately the same effect.
A-4 Soil Densification of the A-4 soil (silt) was most affected by changes in confining pressure. The A-4 soil was the most sensitive of all the soils to increases in confining pressure. The A-4 soil exhibited the smallest increase in densification as a result of increasing the number of gyrations.
A-7-6 Soil The A-7-6 soil (clay) exhibited behavior that was similar to the A-4 soil. An increase in soil densification was gained from increasing the SGC confining pressure from 200 to 600 kPa. Increasing the gyration count from 75 to 500 gyrations resulted in only a relatively small increase in percent compaction.
Potential Problems Testing Moist Soils in the SGC The SGC machine and mold were designed to compact HMA samples. During compaction of moist soils, the soil skeleton is compressed and water and air are forced out of the void space. Depending on the initial degree of saturation and permeability of the soil, water may be exuded through gaps around the perimeter of the top or bottom plates of the gyratory mold; labeled as escape points in Figure 1. This is especially true for granular free-draining soils compacted at higher water contents. Expelled pore fluid containing water and small amounts of suspended fine soil particles will pool on the top of SGC undercarriage box. As the SGC gyrates, the pooled fluid drains into the undercarriage of the SGC, which houses gears, a drive chain, and electronic equipment such as the gyration counter. Some of the fine soil particles also precipitate out of suspension and are deposited within cracks between the mold base and mold carriage. These soil deposits accumulate over time and can cause the SGC to malfunction. In addition, loss of soil particles can create errors in the computed dry density values.
In this study, the majority of problems associated with expelled pore fluid occurred while testing the A-1-a and the A-3 soils at high water contents. The fine-grained A-4 and A-7-6 soils did not experience any water loss during gyratory compaction. A vacuum device was retrofitted to the SGC undercarriage cover plate to remove expelled pore fluid as it exited the mold, before it was able to enter the undercarriage. The device consisted of a small diameter vacuum tube connected to a moveable arm that automatically rotated inwards and vacuumed water between passes of the mold carriage arms. The mold carriage has three arms that rotate at 30 revolutions per minute; consequently, the vacuum device had limited time to vacuum expelled fluid. A removable water retaining berm was constructed around the gyratory mold perimeter to contain the expelled fluid long enough for removal by the vacuum tube. The water handling retrofit was successful in protecting the undercarriage components; however, the system was somewhat awkward and resulted in longer sample setup times. A more permanent modification would be necessary for conducting large quantities of tests on high water content coarse-grained soils.
SUMMARY AND CONCLUSION Gyratory compactors were designed to simulate orientation of aggregate, degradation of aggregate, field compaction, and traffic degradation that occurs in HMA during production, compaction, and traffic loading. This study explored the methodologies, parameters, variables, and results associated with SGC compaction of soil. A gyratory testing method was developed based on the current AASHTO T312 compaction method for HMA and other recently published studies on gyratory compaction of soil. A suite of laboratory tests were conducted to analyze the primary variables associated with gyratory compaction. These variables include: confining pressure, number of gyrations, soil type, and water content. Gyratory compaction was performed on four soil types with varying water contents. The four
Mokwa, Cuelho, and Browne TRB 2008
13
soils (A-1-a, A-3, A-4, and A-7-6) used throughout this study were selected to represent a broad range of materials that may be encountered during construction. Dry density values achieved using a gyratory compactor were compared to maximum dry densities achieved using laboratory impact methods (standard and modified Proctor tests).
Results from testing conducted during this study indicate that increasing the confining pressure is the most effective method of increasing the compacted density of fine-grained soils. Increasing the number of gyrations is the most effective method of increasing the compacted density of non-cohesive, granular soils. Three of the four soils (A-1-a, A-3, and A-7-6) achieved gyratory-compacted dry densities that were greater than modified Proctor maximum dry densities. At maximum gyratory compaction; the A-1-a, A-3, and A-7-6 soils were compacted to 103.2%, 113.9%, and 101.5% of the modified Proctor maximum dry density. Gyratory compaction of the A-4 soil only reached 97.2% of the modified Proctor maximum dry density. These comparisons were based on the following SGC machine settings:
gyratory compaction rate of 30 gyrations per minute, gyratory compaction angle of 1.25 degrees, confinement pressure of 600 kPa, and gyration counts of 500.
This study has demonstrated that gyratory compacted maximum dry densities are not
substantially different than dry density values obtained using traditional laboratory Proctor tests, even though the physical process of achieving compaction are quite different. Furthermore, the SGC encounters many of the same disadvantages as the Proctor test when compacting cohesionless soils at relatively high water contents.
In conclusion, although the gyratory compaction process has been demonstrated to simulate field compaction of HMA, this study has experimentally demonstrated that dry densities achieved using a gyratory compaction device in the laboratory does not yield significantly different results than the traditional Proctor test. Additional studies are necessary to more fully establish a relationship between laboratory gyratory compaction and in-situ compaction obtained with modern construction equipment. In due course, the gyratory compactor may offer some advantages in quality control and quality assurance evaluations of compacted soils and aggregate. However, additional testing of pit run A-1-a soils and processed aggregates as well as field verification studies are necessary before specific criteria and compaction parameters can be developed for large scale implementation of gyratory compaction testing of soil.
ACKNOWLEDGEMENTS Acknowledgement of financial support for this research is extended to the Research and Innovative Technology Administration (RITA) at the United States Department of Transportation through the Western Transportation Institute at Montana State University. The contents of this report reflect the views of the authors, who are responsible for the facts and accuracy of the data presented. The contents do not necessarily reflect the official policies of the supporting agencies.
REFERENCES CITED 1. Collins, R., Watson, D., Johnson, A., and Wu, Y. Effect of Aggregate Degradation of Specimens
Compacted by Superpave Gyratory Compactor. In Transportation Research Record: Journal of the Transportation Research Board, No. 1590, TRB, National Research Council, Washington D.C., 1997, pp. 1-9.
2. Harman, T., Bukowski, J., Moutier, F., Huber, G., and McGennis, R. The History and Future Challenges of Gyratory Compaction 1939 to 2001. Transportation Research Board 81st Annual Meeting, Washington D.C., January 13-17, 2002.
Mokwa, Cuelho, and Browne TRB 2008
14
3. Ping, W., Yang, Z., Leonard, M., and Putcha, S. Laboratory Simulation of Field Compaction Characteristics on Sandy Soils. Transportation Research Board 81st Annual Meeting, Washington D.C., January 13-17, 2002.
4. Frament, I. H. Determination of Optimum Moisture Content (OMC) and Maximum Dry Density (MDD) of Soils through the use of the Gyratory Compactor. Draft Report Prepared by the Rhode Island Department of Transportation Materials Section, Rhode Island, in Cooperation with the U.S. Department of Transportation and the FHWA, Obtained March 2005.
5. Sebesta, S., Guthrie, W.S., and Harris, J.P. Gyratory Compaction of Soils for Laboratory Swell Tests. Transportation Research Board 83rd Annual Meeting, Washington D.C., January 11-15, 2004.
6. Browne, M. Feasibility of Using a Gyratory Compactor to Determine Compaction Characteristics of Soil. Master of Science Thesis, Civil Engineering Department, Montana State University, Bozeman, Montana, 2006.
7. McRea, J.L. Gyratory Compaction Method for Determining Density Requirements for Subgrade and Base of Flexible Pavements. Miscellaneous Paper No. 4-494, U.S. Army Corps of Engineers Waterways Experiment Station, Vicksburg, Mississippi, May 1962.