Permanent seismic deformation analysis of a landslide
Abstract A failed slope may not necessarily require a remedial treat-ment if it can be shown with confidence that the maximum movementof the slide mass will be within tolerable limits, i.e., not cause loss oflife or property. A permanent displacement analysis of a landslide forstatic and seismic conditions is presented using a continuum mechan-ics approach. Computed values of displacement for static conditionscompare favorably with field measurements and computed valuesof seismic displacements for a postulated earthquake motion appearreasonable. Also, the seismic displacements using the continuum me-chanics approach compare favorably with those obtained using theNewmark sliding block procedure for assessing seismically-inducedslope deformations.
IntroductionAfter some movement, the slide mass of a landslide will come to rest ina more stable configuration. The amount of movement is a functionof the failure mechanism. The cause of the landslide may be static,such as build-up of pore-water pressures in the soil mass, steepeningof slope, toe excavation, an increase in surface loads, etc., or dynamic,such as an earthquake, blasting, traffic-induced vibrations, etc. Envi-ronmental factors such as desiccation cracking followed by ingress ofsurface water from a rain storm can also trigger landslides. Whateverthe cause of a landslide (initial failure), the failed mass comes to restin a more stable configuration. Sometimes, the newly acquired sta-ble configuration can be reactivated under a new or different set ofsurface and/or subsurface conditions.
Generally, one is interested in analyzing a slope for the onset offailure whether it is for the first-time occurrence or a reactivation ofa slide using appropriate material properties, and surface and sub-surface conditions. In such cases, the results of analyses are used todesign/implement measures to assure stability of the slope for thedesired conditions. There are several numerical analysis proceduresavailable to calculate the factor of safety (FoS) for the before- andafter- the failure conditions at a site. These methods differ in complex-ity, data needs, and accuracy of results—but their primary objective isto calculate the FoS against failure. These numerical-analysis proce-dures are based on either limit-equilibrium or continuum-mechanicstheories.
In some situations, the onset of a slope failure is not of primary con-cern if the slide mass will not encroach on another piece of property,endanger life, or otherwise have a material effect on the environmen-tal/other interests of a site. In this situation, the primary concern isthe magnitude of displacement of the slide mass. This is the problemof interest in the study reported in this paper.
MotivationDuring the design phase of an embankment dam, 32 different his-toric landslides were mapped and analyzed in the field within thereservoir area and adjacent hills (Fig. 1). A summary description ofthese 32 slides is given in Chugh and Stark 2005. In addition to these32 numbered landslides, there are 17 landslides that are identifiedbut not numbered or described. It was anticipated in the designphase (1980s) that areas within the reservoir containing fat-clay top-soils, overlying predominantly fine-grained soil units with north- tonorthwest facing slopes of 2H:1V (2 horizontal to 1 vertical) to 5.5H:1Vthat had failed in the past would be susceptible to additional slidingdue to likely seepage of reservoir water into the pervious sand units.With the filling of the reservoir, this prediction came true with about20 slides occurring. Fig. 1 conveys the complexity of the geologic en-vironment and the enormity of the landslide activity in this relativelysmall area. The geologic units at the site are composed of unindurated,compacted sediments deposited in both marine and lacustrine envi-ronments. The geologic units are estimated to be over 2500 m thickconsisting of interbedded lean and fat clays and silty and clayey sands.These deposits are overlain by an average of 1 m thick fat-clay.
At present, the area of most of the landslides is remote and doesnot merit extensive analyses or remedial measures. However, thetoe of one of the the landslides, identified as Quaternary landslide
Fig. 1 Location map of landslide study area
Landslides 00 . 2005
Original Article
(Qls)-18 in Fig. 1, is within about 50 m of a developed facility. Thisclose proximity of Qls-18 to development motivated this study todetermine if landslide Qls-18 could reach the development before orafter a seismic event?
ObjectivesThe objectives of this paper are to present
1. An effective and efficient procedure to estimate the post-failuremaximum displacement of a slide mass due to static and seismicconditions; and
2. An application of the procedure to the Qls-18 landslide shown inFig. 1.
The proposed procedure can be implemented in essentially anycontinuum-mechanics based solution procedure; however, for anal-ysis of the field problem presented in this paper, a commerciallyavailable computer program FLAC (Itasca Consulting Group 2000)was used. FLAC is an acronym for Fast Lagrangian Analysis of Con-tinua; it is a two-dimensional explicit finite difference program; andits adoption was for convenience.
For static analyses, computed displacements are compared withthe field measurements; and for dynamic analyses, the computeddisplacements are compared with those obtained using the New-mark sliding block procedure for estimating seismically-inducedslope deformations (Newmark 1965). The Newmark procedure isimplemented in the computer program DISP (Chugh 1980). Relativemerits of using FLAC and DISP for assessing the earthquake-induceddisplacements are mentioned. Copies of the computer programDISP and instructions for its use can be obtained from the firstauthor on request.
RationaleThe rationale for the proposed procedure is the following:
(a) If a landslide has occurred previously, there is little to be gainedby performing slope stability analyses, especially when the fieldconditions that caused the slope failure and the location of theslip surface have been well estimated/determined via field workand material properties are well established via laboratory/fieldtests.
(b) If a slope has not failed, FoS results from slope stability analysescan be used to reduce the values of shear strength parameters(cohesion and friction angle) to bring the soil mass to the vergeof failure, i.e., static FoS = 1.Steps (a) and (b) mark the beginning of displacement of the slidemass.
(c) An estimate of horizontal and vertical displacements of a soilmass above the potential failure surface, items (a) and (b),due to a static cause can be made via a continuum-mechanicsbased solution procedure. At the end of this step, the slidemass would have come to rest in a stable geometric con-figuration. This stable geometric configuration of the slidemass may be permanent or temporary depending on statusquo of the event(s) that initiated the slope failure or occur-rence of a new destabilizing event (such as an earthquake),respectively.
(d) An estimate of horizontal and vertical displacement of the slidemass above the potential failure surface caused by a seismic eventcan also be made via a continuum-mechanics based solutionprocedure.
Fig. 2 Descriptions of the Qls-18 landslide
(e) The Newmark sliding block procedure for calculating permanentdeformations of a slide mass due to earthquake loading is anefficient alternative to the continuum approach, item (d).
Proposed continuum-mechanics based procedureThe proposed procedure for calculating permanent displacement ofa slide mass for static and seismic conditions using the continuum-mechanics approach has the following steps:
(a) Create a discretized model of the continuum considering its usefor static and dynamic analyses and identify the locations wheredisplacement results are of interest;
(b) Include in step (a), the failure surface of interest as an interfacebetween the soil mass above the failure surface and the intact soilmass below the failure surface;
(c) Assign appropriate material properties to the continuum mate-rials and the interface. Apply the appropriate surficial loads andboundary conditions to the numerical model for static analysis;
Landslides 00 . 2005
(d) Perform a static deformation analysis using a large displacementand large strain formulation (updated Lagrangian and large strainconstitutive formulation). At the end of this analysis, the modelshould be in equilibrium.
(e) If necessary, change material/interface properties to reflect thefield conditions, and repeat step (d).This is the end of static deformation analysis and the calibratedparameters will be used for the seismic analysis. Additional de-tails on the static analysis are given in Chugh and Stark (2005).To continue with the dynamic deformation analysis using thecontinuum approach, the proposed procedure has the followingsteps:
(f) To the last execution of step (d), apply the appropriate dynamicboundary conditions, shear strength parameters, and seismictime-acceleration history to the model;
(g) Perform the deformation analysis for the dynamic conditionsusing a large displacement and large strain formulation (similarto step (d)) for the duration of the seismic event;
(h) At the end of the seismic event, continue the analysis for freevibrations for a reasonable length of time to study the post-seismicresponse of the model.
Newmark sliding block procedureAs an alternative to the continuum approach for dynamic deforma-tion analysis (steps (f), (g), and (h) under the heading ‘Proposedcontinuum-mechanies based procedure’), the Newmark slidingblock analysis (Newmark 1965) can be used to calculate permanentdisplacements of the slide mass due to an earthquake. The Newmarkprocedure is an efficient alternative to the continuum approach.However, confidence in an exclusive use of one of the two alternativesneeds further study (analysis of landslides/slope-failures); in theinterim, both methods should be used for comparison of results andto gain confidence in the final outcome of the analyses.
Sample problemThe chronology of the landslides in the area around the reser-voir indicates that the Qls-18 landslide occurred or was reactivatedsubsequent to the first filling of the reservoir. Seepage from thereservoir entering the underlying pervious sand units has been at-tributed to be the cause of the Qls-18 and other landslides westand northwest of the reservoir (U.S. Bureau of Reclamation 2004).The Qls-18 landslide is about 10 m thick and occurred in a 4.5H:1Vground slope on the hillside facing away from the reservoir; and theslide materials include fat-clay topsoil and underlying QuaternaryPliocene-Pleistocene sediments (QPs) of the marine and lacustrineenvironments.
In May 2003, new Qls-18 landslide movement began to occur in thearea immediately adjacent to, and to the east of, the head scarp of thehistoric limits of the Qls-18 landslide. Water levels in an observationwell (located in the lower portion of the slope and just to the eastof the historic limits of the Qls-18 landslide) had risen by about 9 mabove historic levels. Seepage exiting the Qls-18 landslide area hadincreased from an average of 10– 15 liters per minute (L/min) to about400 L/min. At this time, very limited downslope movement and onlyminor ground distortion immediately downslope of the new (1–2.5 mhigh and about 60 m across at the top) head scarp had occurred.
By March 2004, the 2003 head scarp had developed into a new lobeof sliding, about 60 m wide, that along with portions of the 2003 slidehad moved 23–30 m downslope in the toe area; and the head scarp inthe new lobe of sliding was about 7.5–9 m high. Also, the western side-
scarp in the old portion of Qls-18 had additional movement duringMay 2003 and March 2004. Seepage exiting the Qls-18 landslide areahad decreased to 10–15 L/min. Water flowing from the head scarpwas ponding on a newly formed bench just downslope from the headscarp—the pond covered an area of about 8000 m2 and the waterdepth was about 1–1.5 m. The observation well (that formerly wasjust east of the limits of the Qls-18 landslide) was in a downslopeportion of the new Qls-18 landslide area and was destroyed.
Table 1 summarizes the 2003 and 2004 movement data for the Qls-18 landslide. The distance from the March 2004 toe of the landslideto the nearest building downslope is about 50 m. Descriptions of theQls-18 landslide in terms of the March 2004 photographic view, theMay 2003 and March 2004 boundaries, and the geologic cross sectionwith different soil units in the hillside are shown in Fig. 2a, b, and c,respectively. The location and geometry of the failure surface shownin Fig. 2c were estimated in the field from observations of the scarpand toe of the slide and data from drill logs.
Material propertiesBecause of the interbedded nature of the QPs, the foundation soilsare grouped into the major geologic units shown in Fig. 2c. Soils fromdifferent geologic units were tested to determine the fully-softenedand residual shear-strengths using triaxial compression, and repeateddirect-shear and torsional ring shear tests, respectively. All laboratorytests were performed in the 1980s for the design of the dam and appur-tenant structures. Shear and bulk modulus values were assumed. Theinterface strength properties correspond to those of the slide mass,and the stiffness values were assumed. Table 2 shows the materialproperties and Table 3 shows the interface (slip surface) propertiesused in the deformation analyses of the Qls-18 landslide.
Groundwater conditionThe water table in the Qls-18 landslide was assumed to be at the topof the SP-SM layer (elevation 120 m) and then followed the field-estimated slip surface shown in Fig. 2c.
Earthquake motionThe Yerba Buena Island record of the 1989 Loma Prieta, California,earthquake (Ms = 7.1 and amax = 0.3 g) was selected for estimatingadditional movements of the slide mass due to an earthquake eventin the near vicinity. Figure 3a shows the time-acceleration data ofthe earthquake motion used for seismic-deformation analyses of theQls-18 landslide. Direct integration of the input motion is shownin Fig. 3b; and direct integration of time-velocity data, Fig. 3b, isshown in Fig. 3c. Integeral of complete input motion results inapproximately 0.001 m/s velocity and 0.066 m displacement. Thus,the earthquake motion used is essentially free of baseline error.Figure 3d shows the Fourier power spectrum of the input motion.
Numerical analysesFor numerical analyses of the landslide conditions of May 2003(assuming first time occurrence due to high ground-water condi-
Table 1 Field data on Qls-18 landslide movements
May 2003 March 2004
Downslope movementat new headscarp (m)
Vertical dropat new headscarp (m)
Downslopemovement at toeof Qls-18 (m)
Vertical drop at newhead scarp (m)
Very limited 1–2.5 23–30 7.5–9
Landslides 00 . 2005
Original Article
Table 2 Material properties for stabilityand deformation assessments of Qls-18landslide
Material identifier Density ρ(kg/m3) Material strength Elastic constants
tions and limited movements), fully-softened shear strengths andother material properties shown in Table 2, interface propertiescorresponding to the fully-softened shear strengths shown in Table 3,and the water table at top of the SP-SM layer (elevation 120 m) andflowing along the field-estimated slip surface are used.
For numerical analyses of the landslide conditions of March 2004(substantial movements, observed water pond, normal seepage-flowconditions), fully-softened shear strengths and other materialproperties shown in Table 2, interface properties corresponding tothe residual shear strengths shown in Table 3, and water table at
Fig. 3 Loma Prieta earthquake motion. aAcceleration time-history. b Directintegration of time-history (a). c Directintegration of time-history (b). d Fourierpower spectrum of time- history (a)
Landslides 00 . 2005
top of the SP-SM layer (elevation 120 m) and flowing along thefield-estimated slip surface are used.
For analysis of the expected movements during an earthquake, thenumerical model at the end of the March 2004 landslide and theassociated material and interface properties are used.
FLAC modelFigure 4 is a numerical model of the geologic cross section of the Qls-18 landslide shown in Fig. 2c, and was used in all continuum-basedFLAC analyses. The estimated slip surface is modeled as a frictionalinterface between the slide mass and the parent material (base). Alongthis interface, the slide mass was allowed to: (a) move relative to thebase; and (b) separate from the base. The interface properties areshown in Table 3. The continuum material properties are presentedin Table 2; and the water table is shown in Fig. 4. The boundaryconditions for static analysis are shown in Fig. 4a, and the boundaryconditions for seismic analysis are shown in Fig. 4b. The constitutivemodel used is Mohr-Coulomb. The displacements of the slide masswere sampled at three locations shown in Fig. 4a.
Static displacementsDeformation analysis of the model in Fig. 4a was started with theMay 2003 conditions set-up and brought to a successful completion(equilibrium solution reached). Interface properties were changedto the March 2004 conditions and analysis continued to a successfulcompletion (equilibrium solution reached). Thus, results for theMarch 2004 conditions include the results of the May 2003 condi-
tions. Results of these analyses are shown in Figs. 5 and 6. Figure 5is for the May 2003 field conditions and shows: (a) progression ofhorizontal displacements at the three selected locations shown inFig. 4a, (b) the spread of elastic, plastic-yield, and tension failurezones; and (c) the relative position of the slide mass. Figure 6 is acounterpart of Fig. 5 and is for the March 2004 field conditions.Table 4 shows the computed and field-observed displacements forthe May 2003 and March 2004 conditions. Additional details of thestatic analysis are presented in Chugh and Stark 2005.
In brief, the computed and observed displacements at the corre-sponding locations for the May 2003 and March 2004 conditions areas follows: for the May 2003 field conditions—the computed hor-izontal and vertical displacement at the monitoring location 1 (headscarp) are 0.5 and 0.3 m, respectively while displacements observedin the field are: very limited horizontal movement and 1–2.5 m dropat the head-scarp; and for the March 2004 field conditions—thecomputed horizontal displacement at the monitoring location 3(toe) is 36.1 m while field measurement is 23–30 m and the computedvertical displacement at the monitoring location 1 (head scarp) is12.2 m while the field measurement is 7.5–9 m. Thus, comparisonsbetween the computed and field observed displacements aregood.
Seismic displacementsThe seismic deformation analysis was applied to the static analysismodel for the March 2004 conditions, Section under the sub-heading
Fig. 4 FLAC model of the geologic crosssection, Fig. 2c
Landslides 00 . 2005
Original Article
Fig. 5 Static analysis results using FLAC for the May 2003 conditions
‘Static displacements’. The sequence of instructions followed for con-tinuation of the static to seismic analysis conditions is (Fig. 4b):
(a) application of free-field boundaries to the sides of the model(which ensures transfer of static-equilibrium conditions to thefree field);
(b) initializing velocities and displacements in the model from zero;(c) initializing time histories of seismic acceleration, velocity, and
displacement response at the selected locations in the model; and(d) application of earthquake motion at the base of the model
(Fig. 4b).
Thus, the dynamic displacements are in addition to the static dis-placement values determined in Section under the sub-heading ‘Staticdisplacements’. The earthquake duration is 40 s (Fig. 3) and at theend of 40 s, the applied acceleration and velocity to the model are setto zero, and the dynamic analysis continued to 60 s to observe themodel response for 20 s past the end of the earthquake motion (freevibrations). Rayleigh damping of 5% of critical damping operating ata central frequency of 2 Hz was used in all dynamic analyses.
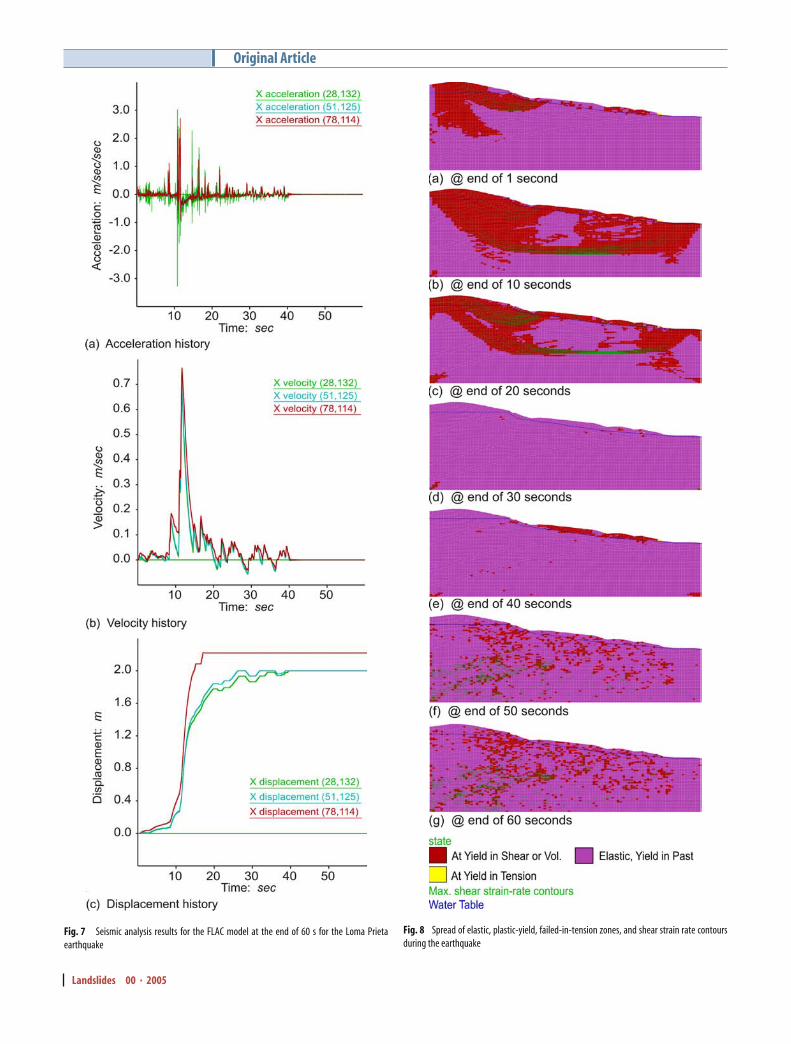
Variations in displacement, velocity, and acceleration with respectto time (history) at the updated select locations shown in Fig. 4a wererecorded at dynamic times of 1, 10, 20, 30, 40, 50, and 60 s, and thecorresponding model state was saved. The computed acceleration,velocity, and displacement histories at 60 s are shown in Fig. 7a, b,and c, respectively; they are all inclusive for the model subjected to
Fig. 6 Static analysis results using FLAC for the March 2004 conditions
Landslides 00 . 2005
Table 4 Comparison of displacement results with the field data (Table 1)
0.5 −0.3 36.1 −12.2 2.2 0.2DISP results N/A N/A N/A N/A 2.0 m for yield acceleration of 0.005 g
N/A not applicable; negative y direction in the FLAC model corresponds to drop in elevation
Table 5 Seismic displacement results for the reversed sign of accelerations in the earthquakemotion shown in Fig. 3
Condition Seismic (future)
x-displacement at toe (m) y-displacement at toe (m)
FLAC results 2.4 0.2DISP results 5.0 m in the downslope direction for yield acceleration of 0.005 g
the seismic input. The stair-step nature of the displacement historyand the cyclic nature of the velocity plots (except for the negativevelocity parts) illustrate the deformations and velocities implied inthe Newmark procedure for seismically-induced slope deformations.The calcualted permanent horizontal displacement at monitoringlocation 3 (toe) due to the seismic input of Fig. 3 is 2.2 m (Fig. 7cand Table 4). The static horizontal displacement is 36.1 m. Therefore,for Qls-18 landslide, the computed total permanent displacement atmonitoring location 3 (toe) is 38.3 m.
Figure 8 shows the spread of elastic, plastic-yield, and tension failurezones at 1, 10, 20, 30, 40, 50, and 60 s. It is interesting to note thechanges in response of the material model during and following theapplication of earthquake motion.
DISP modelFigure 9 presents a schematic description of the Newmark Slid-ing Block procedure for seismically-induced slope deformations(Newmark 1965; Chugh 1982, 1995). The base angle α for theMarch 2004 configuration of the slide mass is estimated to be about5.67◦; the base angle α1 for the next 10 m distance is estimated tobe about 5.71◦. For the March 2004 slope configuration, the staticFoS (using FLAC) is 1.01 but the failure surface is different fromthe one along which displacements are being assessed. Defining theinterface as the failure surface (along which displacements are beingassessed) in the limit-equilibrium based procedure implemented inthe computer program SSTAB2 (Chugh 1992), the static FoS (for theMarch 2004 configuration of the slide mass) is 0.92 with an intersliceforce inclination of 6.5◦. Therefore, a low value of 0.005 g wasassumed (without calculation) for the yield acceleration of the slidemass. The earthquake motion of Fig. 3 was used without propagatingit through the soil mass. For these conditions, the dynamic displace-
ment is calculated to be about 2 m in the downslope direction. Theacceleration, velocity, and displacement history results from DISPare shown in Fig. 10. A permanent downslope displacement of 2 mby the Newmark procedure (DISP) is in excellent agreement withthe resultant seismic displacement of about 2.21 m estimated usingthe continuum-mechanics-based procedure (FLAC), see Table 4.
Sensitivity analyses
Reversing the sign of acceleration values in the earthquake dataThe Loma Prieta earthquake motion (Fig. 3) has a peak accelerationof about 0.24 g positive and about 0.30 g negative. The dynamicdisplacements, using FLAC and DISP, were also made using a time-acceleration record with reversed polarity. Results of these calcula-tions are shown in Fig. 11 and Table 5. Reversing the sign of accelerationvalues in the earthquake data in the continuum approach did not re-sult in significant change in the computed displacements at the toe ofthe landslide (FLAC results for seismically induced x-displacement of2.4 m vs. 2.2 m in Tables 5 and 4, respectively). However, reversing thesign of acceleration values in the earthquake data in the Newmarkprocedure resulted in significant increase in the computed downs-lope displacements (DISP results for seismically induced downslopemovement of 5.0 m vs. 2.0 m in Tables 5 and 4, respectively). The pre-cise reason for this relatively large difference in computed displace-ments by the two procedures (FLAC and DISP) is not clear at this time.However, the objective lesson in this sensitivity element is that a polar-ity change in a non-simulated seismic motion should be consideredin analysis of numerical models by repeating the analyses for differentcombinations of polarity change in the input motion. Thus, for theQls-18 landslide, the computed total permanent x-displacement atthe toe could be upto about 41 m (36 m static plus 5 m seismic).
Effect of variation in yield acceleration in Newmark approachThe dynamic displacement calculations for the DISP model were alsomade by varying yield acceleration values from 0.001 g to 0.01 g inincrements of 0.001 g. Results of these calculations for the earthquakemotion shown in Fig. 3 and also for the reversed sign of accelera-tions are shown in Fig. 12. Variations in dynamic displacements ofa slide mass using the Newmark approach are rightfully sensitive tothe yield acceleration which relates to the static stability (FoS)—the
Table 6 Static and seismic displacement results for the G =1.0 × 10⁶ kPa and K=1.5 × 10⁶ kPa
Condition May 2003 March 2004 Seismic (future)x-displacement (headscarp) (m)
Negative y direction in the FLAC model corresponds to drop in elevation
Landslides 00 . 2005
Original Article
Fig. 7 Seismic analysis results for the FLAC model at the end of 60 s for the Loma Prietaearthquake
Fig. 8 Spread of elastic, plastic-yield, failed-in-tension zones, and shear strain rate contoursduring the earthquake
Landslides 00 . 2005
Fig. 9 DISP model for seismically-induced displacements using Newmark procedure
only question is of the order of sensitivity (Chugh 1995). It is under-stood that a marginally stable earth-mass (low FoS and hence lowyield-acceleration) shall experience larger displacements during anearthquake than if it had high static stability. Other factors affectingthe magnitude of dynamic displacements of an earth-mass include:(a) the geometry of the riding surface, and (b) the kinetic energy ofthe slide mass.
Elastic constantsThe shear modulus, G, and the bulk modulus, K, were assignedvalues of 1.0 × 10⁷ kPa and 1.5 × 10⁷ kPa, respectively in the resultsreported in Tables 4 and 5, and in Figs. 5–8. For G = 1.0 × 10⁴ kPa andK = 1.5 × 10⁴ kPa, the FLAC model runs into numerical problemsdue to excessive changes in geometry. For G = 1.0 × 10⁶ kPa and K=1.5 × 10⁶ kPa, the static- and seismic- displacement results are shown Fig. 10 Seismically-induced displacement results using DISP
Landslides 00 . 2005
Original Article
Fig. 11 Seismic analysis results of interest for reversed polarity of input motion of Fig. 3: FLAC and DISP models
Landslides 00 . 2005
Fig. 12 Sensitivity of dynamic displacements to variations in yield acceleration: DISP model
in Table 6. There is a noticeable increase in static displacements forthe March 2004 conditions (46.0 m in Table 6 vs. 36.1 m in Table 4)and seismic displacements also increase (4.2 m in Table 6 vs. 2.2 min Table 4) due to the lowering of the G and K values. However,for the March 2004 conditions, the computed values of staticdisplacements (using G = 1.0 × 10⁶ kPa and K = 1.5 × 10⁶ kPa)differ significantly from the field measured values shown in Table 1(46.0 m in Table 6 vs. 23–30 m in Table 1). Therefore, the use of G =1.0 × 10⁶ kPa and K = 1.5 × 10⁶ kPa is not considered appropriate forthe Qls-18 landslide.
General comments(a) Seismic analysis of field problems using continuum-mechanics
based procedures with Rayleigh (stiffness and mass proportional)damping is generally very time consuming – using FLAC, eachseismic analysis of the Qls-18 landslide reported in this paper tookwell over 240 h on a well equipped modern personal computer.All calculations were performed using single-precision arithmetic(use of double-precision arithmetic was not successful in bringingthe FLAC model to a stable state for the March 2004 conditions).
(b) FLAC in large-strain mode updates the coordinates of the grid ateach calculation step, but the constitutive formulation is that ofsmall strains.
(c) Seismic displacement calculations using the Newmark procedureare very efficient—using DISP, each seismic displacement calcula-tion of the Qls-18 landslide reported in this paper took well under1 min on the same personal computer as in (a).
(d) Analytical and numerical details of the static, dynamic, and in-terface logic used in analyses reported in this paper are given inFLAC manuals (Itasca Consulting Group 2000). Details of thelimit-equilibrium procedure used for static FoS results reportedin this paper are given in the SSTAB2 manual (Chugh 1992). De-tails of the Newmark procedure used in this paper are given in theDISP manual (Chugh 1980). These details are not included hereto conserve space.
Conclusions(a) The computed permanent displacements of Qls-18 landslide
using the proposed procedure in a continuum-mechanics basedprocedure FLAC are in good agreement with the May 2003 andMarch 2004 field data which pertain to the onset and a stableconfiguration of the landslide, respectively. Seismically inducedpermanent displacements of Qls-18 landslide using the proposedprocedure in FLAC are in fair agreement with the Newmark’srigid block procedure implemented in DISP.
(b) Safety of the people and property (presently located within about50 m from the toe of the slide) against the hazards of the landslidecan not be assured because there could occur additional move-ments of the slide mass due to possible further reductions in shearstrengths of materials due to weathering; increase in pore waterpressure due to rise in ground-water level in the hills; and infil-tration from surface run-off from rain storms. Seismic concernsat this site are even larger. There exists a possibility that the slidemass may turn into a mud flow during a heavy rain storm or astrong seismic event. Therefore, for safety of people and property,it is better to err on the side of safety.
(c) Static deformation analyses can be performed effectively and ef-ficiently using the continuum approach. It is instructive and in-formative to perform displacement analysis following a slope sta-bility analysis using residual strength values along the interfacerepresenting the most vulnerable shear surface.
(d) Dynamic deformation analysis using the continuum approach isvery time-consuming and should be performed when refinementsto dynamic deformation results using the Newmark procedureare considered necessary. However, additional comparisonsbetween the results of these two procedures on field problemsare warranted to gain confidence in this recommendation.
AcknowledgementsThe authors would like to express their sincere thanks to Dr. RobertL. Schuster for his constructive comments and suggestions on theinitial draft of the paper.
References
Chugh AK (1980) User information manual: Dynamic slope stability displacement program DISP. U.S.Bureau of Reclamation, Engineering and Research Center, Denver, Colorado
Chugh AK (1982) Slope stability analysis for earthquakes. Int J Num Anal Methods Geomech 6:307–322Chugh AK (1992) User information manual: Slope stability analysis program SSTAB2. U.S. Bureau of
Reclamation, Engineering and Research Center, Denver, ColoradoChugh AK (1995) Dynamic displacement analysis of embankment dams. Geotechnique 45(2):295–299Chugh AK, Stark TD (2005) Displacement analysis of a landslide. In: 11th international conference
and field trip on landslides, Norway, 1–10 September 2005Itasca Consulting Group (2000) FLAC—Fast Lagrangian Analysis of Continua. Itasca Consulting
Group, Minneapolis, MinnesotaNewmark NM (1965) Effects of earthquakes on dams and embankments. Geotechnique 15(2):139–159U.S. Bureau of Reclamation (2004) Internal reports. Denver, Colorado
A. K. Chugh (�)U.S. Bureau of Reclamation, Denver,Colorado 80225, USAe-mail: [email protected].: +303-445-3026Fax: +303-445-6432
T. D. StarkUniversity of Illinois, Urbana,Illinois 61801, USA