Large-area and high-resolution distortion measurement based on moiré fringe method for
hot embossing process
Zhiguang Xu*1, 2, 3, Hayden K. Taylor1, 3, Duane S. Boning1, 3, Soon Fatt Yoon2, 3, and Kamal Youcef-Toumi1,3
1Massachusetts Institute of Technology, 77 Massachusetts Avenue, Cambridge, MA 02139, USA 2School of Electrical & Electronic Engineering, Nanyang Technology University, Singapore 639798
Abstract: A moiré fringe approach is developed to identify simultaneously the global and local distortions in hot-embossed polymeric samples. A square grid pattern with a pitch of 63.5 µm is hot-embossed on the polymer substrate. When a reference grid, a polymeric film with the same pattern, is placed on top of the sample, a moiré fringe pattern is observed and recorded by a document scanner. The deviation of the intersections of the fringes from their ideal positions presents the residual distortion in the sample. With different sample-reference rotation angles eight images are acquired for the same sample to achieve the optimal result by a data fitting technique. The validity of this method is proved by the self-consistency of the results from the eight images. To the best of our knowledge, this is the first time distortion quantification has been achieved both in a large area up to that of a scanner and with a high resolution at the level of 1 µm. Furthermore, we do not use any expensive instrument, nor need to measure the sample–reference rotation angle or position the sample precisely, and the process is run automatically by a computer instead of manual operation.
1. P. P. Shiu, G. K. Knopf, M. Ostojic, and S. Nikumb, “Rapid fabrication of tooling for microfluidic devices via laser micromachining and hot embossing,” J. Micromech. Microeng. 18(2), 025012 (2008).
2. N. S. Cameron, H. Roberge, T. Veres, S. C. Jakeway, and H. John Crabtree, “High fidelity, high yield production of microfluidic devices by hot embossing lithography: rheology and stiction,” Lab Chip 6(7), 936–941 (2006).
3. O. Rotting, and W. Ropke, “H, Becker, C. Gärtner, “Polymer microfabrication technologies,” Microsyst. Technol. 8, 32–36 (2002).
4. H. K. Taylor, Z. G. Xu, S. G. Li, S. F. Yoon, and D. S. Boning, “Moiré fringe method for the measurement of distortions of hot-embossed polymeric substrates,” Proc. SPIE 7155(715528), 1–9 (2008).
5. M. Dirckx, H. Taylor, and D. Hardt, “High-temperature demolding for cycle time reduction in hot embossing,” in Proc. Society of Plastics Engineers Annual Technical Conference, 2972–2976 (2007).
6. Y. He, J. Z. Fu, and Z. C. Chen, “Research on optimization of the hot embossing process,” J. Micromech. Microeng. 17(12), 2420–2425 (2007).
7. W. M. Choi, and O. O. Park, “The fabrication of submicron patterns on curved substrates using a polydimethylsiloxane film mould,” Nanatechnol. 15(12), 1767–1770 (2004).
8. W. W. Y. Chow, K. F. Lei, G. Shi, W. J. Li, and Q. Huang, “Microfluidic channel fabrication by PDMS-interface bonding,” Smart Mater. Struct. 15(1), S112–S116 (2006).
9. J. A. Rogers, K. E. Paul, and G. M. Whitesides, “Quantifying distortions in soft lithography,” J. Vac. Sci. Technol. B 16(1), 88–97 (1998).
10. K. Patorski, Handbook of the Moiré Fringe Technique (Elsevier, 1993), Chap. 1. 11. J. S. Lim, Two-Dimensional Signal and Image Processing (Prentice Hall, 1990), Chap. 9. 12. R. W. Cox, and R. Tong, “Two- and three-dimensional image rotation using the FFT,” IEEE Trans. Image
Process. 8(9), 1297–1299 (1999).
#111755 - $15.00 USD Received 22 May 2009; revised 24 Jul 2009; accepted 25 Jul 2009; published 28 Sep 2009
(C) 2009 OSA 12 October 2009 / Vol. 17, No. 21 / OPTICS EXPRESS 18394
13. B. W. Yoon, and W. J. Song, “Image contrast enhancement based on the generalized histogram,” J. Electron. Imaging 16(3), 033005 (2007).
14. J. Condeco, L. H. Christensen, and B. G. Rosen, “Software relocation of 3D surface topography measurements,” Int. J. Mach. Tools Manuf. 41(13–14), 2095–2101 (2001).
15. Z. G. Xu, S. G. Li, D. J. Burns, V. Shilpiekandula, H. K. Taylor, S. F. Yoon, K. Youcef-Toumi, I. Reading, Z. P. Fang, J. H. Zhao, and D. S. Boning, “Three-dimensional profile stitching based on the fiducial markers for microfluidic devices,” Opt. Commun. 282(4), 493–499 (2009).
1. Introduction
The hot embossing technique is one of the most popular approaches adopted in the high-volume manufacturing of polymer-based micro-devices [1,2]. In this method a polymer substrate is heated to a temperature between the glass transition temperature and the melting point of the polymer material; subsequently, a silicon or metal tool is pressed on to the softened polymer to cause the pattern on the tool to be replicated on the substrate. Compared with another frequently-used approach, micro-injection molding, hot-embossing is much better suited to the fabrication of structures containing trenches that are more than a few times as deep as wide. Hot embossing is also more advantageous for the processing of substrates thinner than 0.2 mm. It also has an easier mounting procedure and fewer parameters to control for the duplication process [3].
Residual distortion in the produced sample is quite an important issue in the hot-embossing technique. It not only makes the embossed features deviate from the expected dimensions, but also causes great difficulty in the registration for multi-layer micro devices [4]. To improve machine performance and guarantee product quality, distortion caused in the embossing process must be characterized accurately and minimized.
The main source inducing the distortion is the demolding procedure, in which the sample is peeled off from the tool and the substrate temperature drops fast from the embossing temperature down to room temperature. It usually causes a global distortion (contraction) in the sample, which is much evident especially in the demolding explored at temperatures within the glass-transition region [5]. Other possible reasons are the adhesion between the polymer and the mold, as well as the inappropriate or uneven heat and pressure exerted on the sample when the pattern is transferred, which results in the local distortions in the sample.
Both the global and local distortions require to be measured precisely, because they indicate different parameters to optimize in the embossing process. This determines the challenging requirements of simultaneous large-area and high-resolution measurements.
The current method for distortion quantification is to measure the dimension of the practically formed pattern in the sample and compare it with the designed dimension [6–8]; however, it is limited in characterizing the distortion in a small region. To obtain the global and local distortion quantifications simultaneously, one has to measure the accurate dimension of the embossed features throughout the whole sample, which sometimes is quite difficult to realize, especially for samples with a large area.
Whitesides’ group provided an indirect method using a moiré technique to determine the distortion in soft lithography [9]. A square grid in a known nominal pitch was precisely manufactured on the rigid substrate, which was taken as a reference grid. The same grid pattern was cast into the polydimethylsiloxane (PDMS) sample by soft lithography. When the sample was placed on the surface of the reference grid by a small relative rotation, moiré fringes were observed and recorded by a microscope, and subsequently were used to interpret both the global contraction of the sample and local distortions of the pattern.
Although this approach provided useful information about a particular set of processes, several limitations exist: (i) it employed a special apparatus to set the angle between the test and reference grids accurately within 0.01°, and used a microscope to help measuring this angle and acquiring the image of moiré fringes; (ii) the measured sample area is limited to less than 1 cm
2, which is not large enough to identify global distortion in hot-embossing processes
where substrates are commonly 100 mm or more in diameter; (iii) the crossing points of moiré fringes were determined manually, making it not desirable for the modern automatic detection.
#111755 - $15.00 USD Received 22 May 2009; revised 24 Jul 2009; accepted 25 Jul 2009; published 28 Sep 2009
(C) 2009 OSA 12 October 2009 / Vol. 17, No. 21 / OPTICS EXPRESS 18395
In this paper we present an approach for distortion measurement in hot-embossed process, which, compared with previously reported work, makes significant progress in that: (i) we do not apply a microscope or special equipment to set and measure the orientation of the sample, but use hand to manipulate the samples and a document scanner to record the image of moiré fringes; (ii) more importantly, it can cover much larger sample areas up to that of a scanner, without any compromise of the high resolution; (iii) the positions of the fringe intersections are automatically determined by the software instead of manually.
The rest of this paper is organized as follows. In Section 2 we describe the general methodology, including the experimental method to obtain the moiré fringes and image interpretation concept to process the fringes. Section 3 shows the experimental results of the derived global and local distortions in the sample by processing the acquired images. In this part the image processing steps to develop a fitted grid matching the practical fringe pattern are firstly described in detail, and distortion qualification from one single image is demonstrated; subsequently, information from eight images acquired for the same sample with different reference–sample included angles is combined together, and global sample distortions are obtained using a curve-fitting method; the self consistency of our method is also examined by comparing the local distortions derived from different images. Conclusions and possible future work are discussed in Section 4.
2. Methodology
2.1 Obtaining the moiré fringes
A 100 mm × 100 mm square reference grid, with a known pitch of 63.5 µm and 25% unshaded areal density, is printed on an acetate sheet by a 5000-dpi imagesetter. Through a photolithography technique this reference pattern is etched on to a silicon wafer with 10 µm etching depth. Subsequently, the silicon stamp is used as a tool to hot-emboss the grid pattern into a 50 mm × 50 mm × 1.5 mm polymethylmethacrylate (PMMA) substrate. In this process the sheet of PMMA was laid down on the patterned silicon stamp and a blank silicon wafer was placed on to the other face of the PMMA to ensure that a smooth surface was obtained during embossing. The resulting stack was placed between the platens of a Carver 4386 heated hydraulic press, and was heated to 120 °C. A load of 3 kN was then applied. The platens were cooled to 105 °C over a period of approximately 2 minutes, and the load was then removed. A razor blade was immediately used to peel the PMMA from the silicon wafer.
The embossed PMMA sample is placed on the glass platen of a document scanner (Epson V100), and the reference grid is placed on top of the sample and rotated by hand until moiré fringes are visible to the naked eye when looking down at the scanner [4]. The fringes are finally scanned in a 600 dpi 8-bit grayscale scanning mode, where the dimension of each acquired image is 2629 pixels × 1944 pixels with one pixel presenting 42.3 µm. The sample was pressed firmly down against the scanner’s platen during scanning, ensuring that any out-of-plane distortions were eliminated and that only in-plane sample distortions were measured. The resolution of 600 dpi was chosen so that the images were of a manageable size for the subsequent image processing.
2.2 Image interpretation method
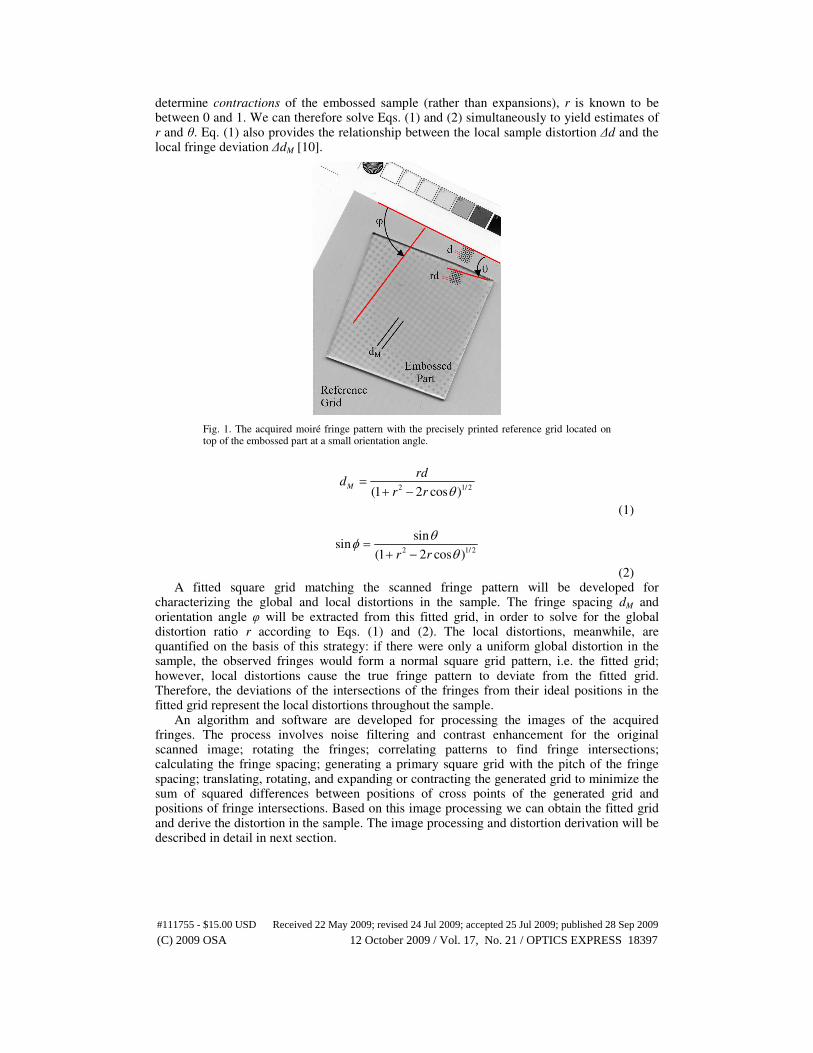
One acquired image is illustrated in Fig. 1. The reference grid pitch is denoted by d, here d = 63.50 ± 0.03 µm; rd represents the actual average grid pitch in the sample, where r is the contraction ratio representing the global distortion; θ means the included angle between the two grids; dM is the spacing of the moiré pattern and φ its angular orientation. The anticlockwise direction is defined as positive for θ and φ in this paper. In an ideal, distortion-free, situation, the acquired moiré fringes form a square grid.
The dependence of dM and φ on r and θ is described in Eqs. (1) and (2). The values of dM and φ can be extracted from any one image, as will be described below. Since the patterns on the reference sheet and the embossed sample are both approximately square grids, θ and φ are
defined to vary in the range −90° to 90°. Moreover, because we are specifically trying to
#111755 - $15.00 USD Received 22 May 2009; revised 24 Jul 2009; accepted 25 Jul 2009; published 28 Sep 2009
(C) 2009 OSA 12 October 2009 / Vol. 17, No. 21 / OPTICS EXPRESS 18396
determine contractions of the embossed sample (rather than expansions), r is known to be between 0 and 1. We can therefore solve Eqs. (1) and (2) simultaneously to yield estimates of r and θ. Eq. (1) also provides the relationship between the local sample distortion ∆d and the local fringe deviation ∆dM [10].
Fig. 1. The acquired moiré fringe pattern with the precisely printed reference grid located on top of the embossed part at a small orientation angle.
2 1/2
(1 2 cos )M
rdd
r r θ=
+ −
(1)
2 1/ 2
sinsin
(1 2 cos )r r
θφ
θ=
+ −
(2) A fitted square grid matching the scanned fringe pattern will be developed for
characterizing the global and local distortions in the sample. The fringe spacing dM and orientation angle φ will be extracted from this fitted grid, in order to solve for the global distortion ratio r according to Eqs. (1) and (2). The local distortions, meanwhile, are quantified on the basis of this strategy: if there were only a uniform global distortion in the sample, the observed fringes would form a normal square grid pattern, i.e. the fitted grid; however, local distortions cause the true fringe pattern to deviate from the fitted grid. Therefore, the deviations of the intersections of the fringes from their ideal positions in the fitted grid represent the local distortions throughout the sample.
An algorithm and software are developed for processing the images of the acquired fringes. The process involves noise filtering and contrast enhancement for the original scanned image; rotating the fringes; correlating patterns to find fringe intersections; calculating the fringe spacing; generating a primary square grid with the pitch of the fringe spacing; translating, rotating, and expanding or contracting the generated grid to minimize the sum of squared differences between positions of cross points of the generated grid and positions of fringe intersections. Based on this image processing we can obtain the fitted grid and derive the distortion in the sample. The image processing and distortion derivation will be described in detail in next section.
#111755 - $15.00 USD Received 22 May 2009; revised 24 Jul 2009; accepted 25 Jul 2009; published 28 Sep 2009
(C) 2009 OSA 12 October 2009 / Vol. 17, No. 21 / OPTICS EXPRESS 18397
3. Experimental results and discussion
3.1 Image processing to develop the fitted grid and quantify the distortion for one single
image
(a) Image filtering
The scanned grayscale image in Fig. 1 is transferred to a matrix in Matlab, with each pixel value varying in the range from 0 to 1. A small fraction of the image data is illustrated in Fig. 2(a), from which one can see that the original image is heavily degraded by the random noise introduced in procedures of sample manufacturing and image acquisition. To reduce the high frequency components, i.e., the noise, from the image, a pixelwise adaptive Wiener method [11], on the basis of statistics estimated from a local neighborhood of each pixel, is applied to filter the noise in the image. Fig. 2(b) shows the same image section after noise filtering.
The algorithm of the applied Wiener filtering can be described as:
[ ]2 2
2 12( , ) ( , )A i j A i j
σ νρ ρ
σ
−= + −
(3)
With 2 2 2
1 1
, ,
1 1( , ); ( , )
i j i j
A i j A i jMN MNε ε
ρ σ ρ∈ ∈
= = −∑ ∑
(4)
where A1 denotes the matrix of the original image with noise, A2 the matrix after noise filtering, ε is the M-by-N local neighborhood of each pixel in A1, ρ and σ
2 represent the local
mean and variance around each pixel, and ν2 is the average of all the local estimated variances
σ2. The assignment of M and N depends on the noise level; in our experiments M and N are
usually given between 5 and 10.
Fig. 2. Fraction of the image data before (a) and after (b) Wiener noise filtering. The unit in the x and y axes is pixel, and the image intensity is normalized in z axis.
(b) Image rotation and enhancement
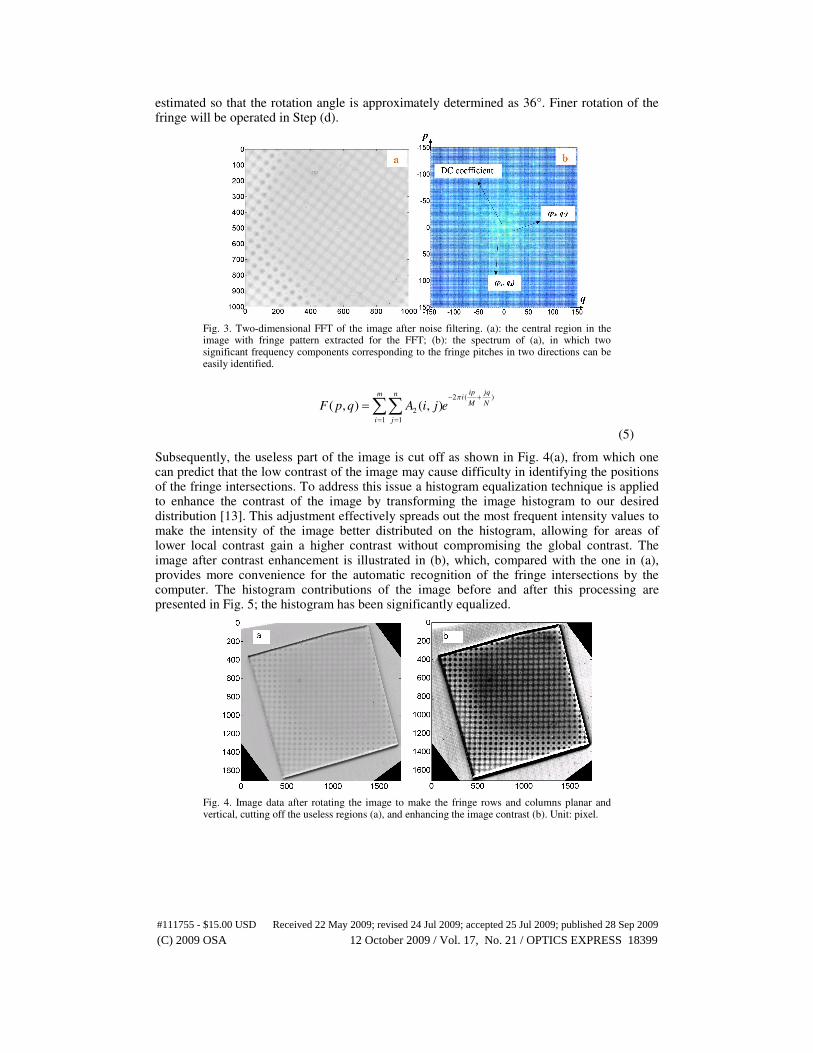
The fringe orientation is oblique in the original image, which makes the further process a little difficult. Therefore, an algorithm is developed to adaptively rotate the image till the rows and columns of the fringes orientated in the planar and vertical directions. This procedure is implemented by the usage of two-dimensional FFT (Fast Fourier Transform) technique described in formula (5) [12]. A2 is a m-by-n matrix indicating the central region of the image after noise filtering introduced above (see Fig. 3(a)), F(p, q) denotes the Fourier transform of A2, and the transform variable p and q represent spatial frequency in frequency domain. In the resultant spectrum of A2 shown in Fig. 3(b), the zero frequency representing the DC coefficient has been moved to the center of figure, besides which two significant frequency components corresponding to the fringe pitches in two directions can be easily identified. Based on the coordinates (p1, q1) and (p2, q2) of these two frequencies, the fringe orientation is
#111755 - $15.00 USD Received 22 May 2009; revised 24 Jul 2009; accepted 25 Jul 2009; published 28 Sep 2009
(C) 2009 OSA 12 October 2009 / Vol. 17, No. 21 / OPTICS EXPRESS 18398
estimated so that the rotation angle is approximately determined as 36°. Finer rotation of the fringe will be operated in Step (d).
Fig. 3. Two-dimensional FFT of the image after noise filtering. (a): the central region in the image with fringe pattern extracted for the FFT; (b): the spectrum of (a), in which two significant frequency components corresponding to the fringe pitches in two directions can be easily identified.
2 ( )
2
1 1
( , ) ( , )ip jqm n iM N
i j
F p q A i j eπ− +
= =
=∑∑
(5)
Subsequently, the useless part of the image is cut off as shown in Fig. 4(a), from which one can predict that the low contrast of the image may cause difficulty in identifying the positions of the fringe intersections. To address this issue a histogram equalization technique is applied to enhance the contrast of the image by transforming the image histogram to our desired distribution [13]. This adjustment effectively spreads out the most frequent intensity values to make the intensity of the image better distributed on the histogram, allowing for areas of lower local contrast gain a higher contrast without compromising the global contrast. The image after contrast enhancement is illustrated in (b), which, compared with the one in (a), provides more convenience for the automatic recognition of the fringe intersections by the computer. The histogram contributions of the image before and after this processing are presented in Fig. 5; the histogram has been significantly equalized.
Fig. 4. Image data after rotating the image to make the fringe rows and columns planar and vertical, cutting off the useless regions (a), and enhancing the image contrast (b). Unit: pixel.
#111755 - $15.00 USD Received 22 May 2009; revised 24 Jul 2009; accepted 25 Jul 2009; published 28 Sep 2009
(C) 2009 OSA 12 October 2009 / Vol. 17, No. 21 / OPTICS EXPRESS 18399
Fig. 5. Histogram contributions of the image before and after contrast enhancement technique.
(c) Fringe intersection identification by pattern correlation
Due to the inconsistency of the contrast and brightness throughout the image, so far it is still very hard to set one standard criterion for the computer to identify all the fringe intersections. Pattern matching [14] or correlation techniques are sometimes utilized in image processing, to identify the similar features in an image with the known pattern. Here, we design our fringe cross match algorithm in the following steps: (i) a typical fringe cross, with the size of 30 pixels × 30 pixels in this case, is extracted from the image, as shown in Fig. 6(a); (ii) a search window with the same size as the extracted cross is shifted step by step in the image; (iii) the cross-correlation [15] between the extracted cross and every searched area is calculated. The correlation ratio, varying from minimum –1 to maximum 1, indicates the similarity between the searched region and the typical fringe cross. The results of this correlation calculation throughout the image are illustrated in Fig. 6(b).
Fig. 6. Correlation calculation between the typical fringe cross and each searched region with the same size of the cross. (a) The extracted fringe cross; (b) The calculation results throughout the image.
To obtain accurate positions of fringe intersections, three steps are operated as following: (i) a threshold value, e.g. 0.6, is set for the correlation ratios obtained in Fig. 6(b); (ii) the continuous pixels with the ratio larger than this threshold are lined out, as shown in Fig. 7(a); (iii) the centroids of each continuous regions are calculated and taken as the positions of fringe crosses, as in Fig. 7(b). Two points need to be noticed: (i) In our experiments the deviation exactly on the edge cannot be quantified, for the scanned fringe pattern is not complete there. But the distortion near the edge, where the fringe pattern is intact, can be characterized, which also provides substantial information of the distortion contribution in the edge regions. (ii) If the area of the continuous pixels are too small, it indicates that the fringe at this location is not clear enough, which may cause error in the identification of the
#111755 - $15.00 USD Received 22 May 2009; revised 24 Jul 2009; accepted 25 Jul 2009; published 28 Sep 2009
(C) 2009 OSA 12 October 2009 / Vol. 17, No. 21 / OPTICS EXPRESS 18400
intersection position. Therefore, continuous pixels with area smaller than a certain value, in our case 50 pixels, will be ignored.
Fig. 7. (a): Continuous pixels with the calculated correlation ratio larger than the threshold 0.6; (b) The centroids of all the continuous areas, which are taken as the positions of fringe intersections.
(d) Obtaining the fitted grid for distortion quantification by one single image
Based on the positions of all the fringe crosses obtained above, the approximate pitch of the fitted grid is estimated as 57 pixels and with this pitch a primary square grid is generated. Subsequently, this primary grid is translated, rotated, and expanded or contracted until the sum of squared differences between positions of cross points of the generated grid and positions of fringe intersections is minimized. Now the optimal fitted grid is obtained, derived from which the fringe spacing dM and orientation angle φ are determined to be 56.85 pixels and 77.10°, respectively. Through Eqs. (1) and (2), the sample-reference angle θ is determined as 1.47° and the global distortion ratio r is achieved to be 99.41%, corresponding to a 0.59% post-demolding shrinkage of the part.
The coefficient of thermal expansion of PMMA is assumed in the region of 5 × 10⁻⁵
/K to
10−4
/K and the variation from hot-embossing temperature to room temperature is about 100K, so the global distortion in the embossed sample is expected to be 0.5% ~1%, which matches our calculated result.
The fitted grid can be considered the ideal fringe pattern without local distortion, so the deviation from each cross in the fitted grid to its adjacent practical fringe cross presents the local fringe deviation. These deviations throughout the sample surface are illustrated by arrows in Fig. 8, where the beginning points of the arrows are the ideal positions of the fringe intersections, and end points show the practical positions.
From Fig. 1 and formula (1) we know that the local fringe deviation is proportional to the local sample distortion by a ratio of r/(1 + r
2 –2r cosθ)
1/2, and the included angle between
their orientations is φ−θ. Based on this relationship the local sample distortions are calculated and presented in Fig. 9. The maximum distortion happens at the sample edge, which is estimated as 23.92 µm; the distortion in the central region is much less, within the level of 5 µm. This conclusion means the edge regions of the sample are affected more heavily in the hot-embossing process.
We consider the impact of any local distortions of the reference grid to be negligible: the observed pattern of local distortions is clearly linked to the shape of the sample. In any case, any local distortions of the reference grid are unlikely to exceed the resolution of the imagesetter that wrote it: approximately 5 µm.
#111755 - $15.00 USD Received 22 May 2009; revised 24 Jul 2009; accepted 25 Jul 2009; published 28 Sep 2009
(C) 2009 OSA 12 October 2009 / Vol. 17, No. 21 / OPTICS EXPRESS 18401
Fig. 8. Local fringe deviations throughout the sample surface denoted by arrows, where the beginning point of each arrow represents the ideal position of the fringe intersection, and end point shows the practical position.
Fig. 9. Local sample distortions throughout the sample surface, from which one can see the distortion at the edges is more significant than in the central region.
3.2 Distortion quantification by multiple images
Each step in the image processing may introduce error to our determination of the values of dM and φ, and thus affect the calculated global distortion ratio r. To obtain a more accurate result, multiple images are acquired for the same sample with different sample–reference angles, and information from these images is combined for the distortion characterization. A least-squares curve-fitting technique is applied in this process, which can substantially reduce the influence of the inaccuracy of dM and φ on the final determination of r.
This procedure is operated as follows. When the sample is manually rotated relative to the reference grid in the anticlockwise direction, eight different images of moiré fringes are obtained, as shown in Fig. 10. For images from (1) to (3) the values of θ are negative, resulting in negative angles of φ. As the sample is rotated clockwise to make θ closer to zero
#111755 - $15.00 USD Received 22 May 2009; revised 24 Jul 2009; accepted 25 Jul 2009; published 28 Sep 2009
(C) 2009 OSA 12 October 2009 / Vol. 17, No. 21 / OPTICS EXPRESS 18402
degree, the fringe spacing becomes larger. Between (3) and (4) a moment of phenomena is observed, in which the fringe spacing is too large to be found in the sample surface, meaning θ is passing the zero degree. From image (4) on, θ and φ turn to be positive, and the fringe spacing becomes smaller with the increase of θ.
Fig. 10. The acquired eight images of moiré fringe pattern with different sample-reference orientation angles. Form (1) to (8) the sample is rotated in the clockwise direction.
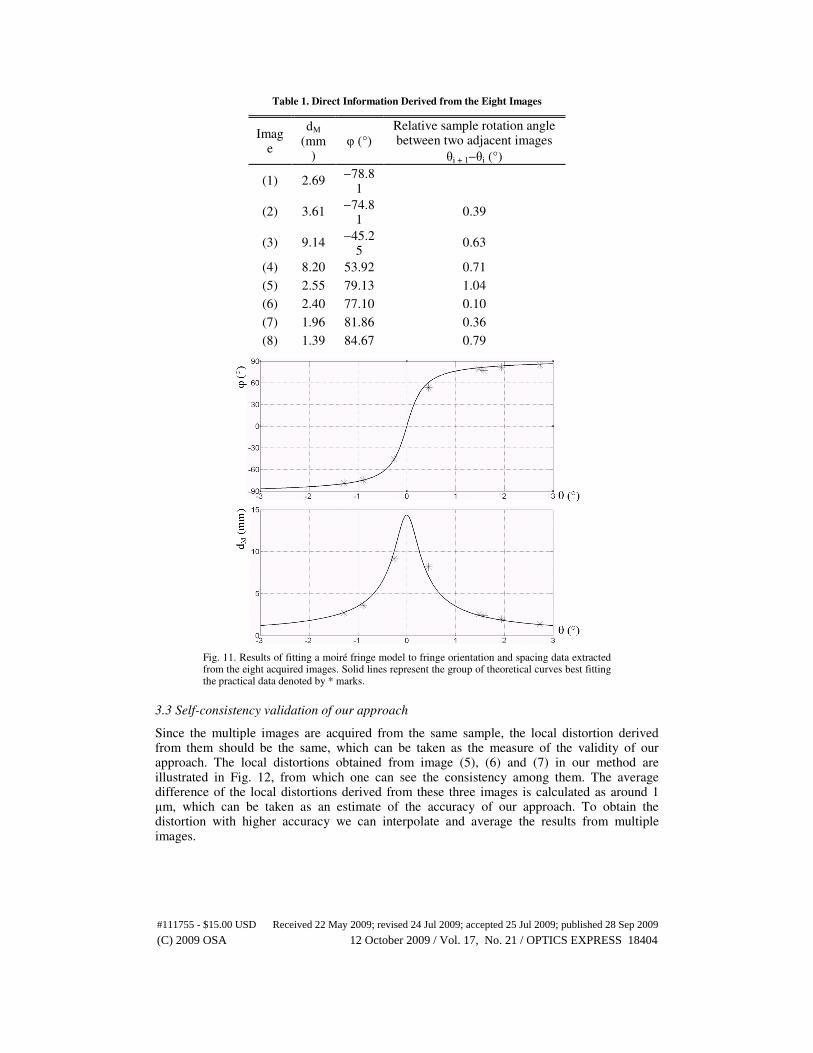
Following the image processing steps all these images are processed by the computer, and their values of dM and φ are obtained and listed in Table 1. Each relative sample rotation angle
between two adjacent images, i.e. θi + 1 − θi (i = 2, 3……8), is also automatically detected by an edge identification technique based on Matlab functions. This technique finds sample edges in our images using the Sobel approximation to the derivative of the image. If the sample-reference rotation angle in image (1) is denoted as θ0, then in these eight images will be successively θ1 = θ0, θ2 = θ0 + 0.39, θ3 = θ0 + 0.39 + 0.63……
One group of r and θ0 can determine one group of φ−θ and dM−θ curves by Eqs. (1) and (2). Now, both r and θ0 are allowed to vary continuously in a limited range to produce a series of theoretical curves. Among them the one best fitting the practical obtained values of dM and φ is selected by least squares minimization, as shown in Fig. 11. The optimal r is finally determined as 99.56%, representing a 0.44% global post-demolding contraction of the sample.
#111755 - $15.00 USD Received 22 May 2009; revised 24 Jul 2009; accepted 25 Jul 2009; published 28 Sep 2009
(C) 2009 OSA 12 October 2009 / Vol. 17, No. 21 / OPTICS EXPRESS 18403
Table 1. Direct Information Derived from the Eight Images
Image
dM (mm
) φ (°)
Relative sample rotation angle between two adjacent images
θi + 1−θi (°)
(1) 2.69 −78.8
1
(2) 3.61 −74.8
1 0.39
(3) 9.14 −45.2
5 0.63
(4) 8.20 53.92 0.71
(5) 2.55 79.13 1.04
(6) 2.40 77.10 0.10
(7) 1.96 81.86 0.36
(8) 1.39 84.67 0.79
Fig. 11. Results of fitting a moiré fringe model to fringe orientation and spacing data extracted from the eight acquired images. Solid lines represent the group of theoretical curves best fitting the practical data denoted by * marks.
3.3 Self-consistency validation of our approach
Since the multiple images are acquired from the same sample, the local distortion derived from them should be the same, which can be taken as the measure of the validity of our approach. The local distortions obtained from image (5), (6) and (7) in our method are illustrated in Fig. 12, from which one can see the consistency among them. The average difference of the local distortions derived from these three images is calculated as around 1 µm, which can be taken as an estimate of the accuracy of our approach. To obtain the distortion with higher accuracy we can interpolate and average the results from multiple images.
#111755 - $15.00 USD Received 22 May 2009; revised 24 Jul 2009; accepted 25 Jul 2009; published 28 Sep 2009
(C) 2009 OSA 12 October 2009 / Vol. 17, No. 21 / OPTICS EXPRESS 18404
Fig. 12. Local distortions derived from image (5), (6) and (7), which show the self-consistency of our approach.
#111755 - $15.00 USD Received 22 May 2009; revised 24 Jul 2009; accepted 25 Jul 2009; published 28 Sep 2009
(C) 2009 OSA 12 October 2009 / Vol. 17, No. 21 / OPTICS EXPRESS 18405
3.4 Discussion
The distortion at the edges of the sample is at the level of 10~20 µm, much larger than that in the central region, which is limited to approximately 5 µm. This difference could possibly result from the fact that the edges of the embossed sample separated spontaneously from the silicon stamp immediately upon removal of the embossing load; they were therefore free from the stamp at the demolding temperature of 105 °C whereas the central portion of the sample was peeled from the stamp manually at a lower temperature. The edges of the sample may therefore have experienced a few crucial seconds in a moderately soft state — one in which measurable viscoelastic shape recovery could have occurred. It is measurements of distortion such as these that could facilitate the design of embossing processes to reduce sample distortions.
The application of moiré fringe method makes the distortion magnified for observation and the magnification is the ratio of the deviation of the local fringe intersection to the local sample distortion, i.e., r/(1 + r
2 –2rcosθ)
1/2, which approximates to 1/|θ| if the situation of
|1−r|<<|θ|<<1 is met. The resolution of the scanner limits the characterization of the deviation of the fringe intersection; therefore, the resolution of our approach is the scanner resolution divided by the magnification of our approach. For instance, as θ = 1°, the magnification 1/|θ| will be about 60. The scanner resolution is currently set as 42.3 µm, meaning we can get easily a resolution higher than 1 µm. Scanners with higher resolution can be employed if higher resolution is required.
4. Conclusion and Future work
We successfully quantify the dimensional distortions occurring during a hot-embossing process by using the moiré fringe approach. The reference and test grid are placed together to form the moiré fringes, and image processing techniques are applied to obtain a fitted grid matching the fringe pattern. The global contraction and local distortions in the embossed sample are obtained simultaneously. To the best of our knowledge, this is the first time distortions have been measured in a large area up to that of a document scanner and with high resolution at the level of 1 µm. The method is demonstrated here with samples that are 50 mm square, although in principle samples as large as the scanner’s platen could be measured: typical scanners have platens slightly larger than an A4-size sheet of paper. All that is required is for the reference grid to be large enough to cover the whole sample. We do not use special equipment to control or measure the reference–sample angle, nor a microscope to observe or record the fringes, but manipulate the sample by hand, acquire the images by a scanner and process the images automatically by computer, which makes the procedure very straightforward to carry out.
This method has a valuable application in optimizing the process parameters of the hot-embossing technique. In a future publication we will apply it to characterize the distortions in samples embossed under various candidate temperatures, pressures, and loading times, to determine the best working conditions for production. Because a highly regular pattern is required to be embossed across the entire area of the substrate, this method, in its present form, is not suitable for the direct on-line monitoring of manufactured, functional components.
To improve the performance of this approach, progress will be made in two aspects. First, in the currently acquired images the consistency of the contrast and brightness of the moiré fringes is not perfect, which causes much difficulty in image processing. This inconsistency probably results from the nonuniform profile of the embossed grid pattern, i.e. variation in the shape and depth of the embossed micro channels. Secondly, the analysis presented here cannot be used to characterize the out-of-plane distortions, so a more sophisticated geometrical model for the formation of moiré fringes needs to be developed. These problems will be addressed and solved in the future.
#111755 - $15.00 USD Received 22 May 2009; revised 24 Jul 2009; accepted 25 Jul 2009; published 28 Sep 2009
(C) 2009 OSA 12 October 2009 / Vol. 17, No. 21 / OPTICS EXPRESS 18406
Acknowledgment
The authors would like to thank the Singapore-MIT Alliance for supporting this research. The authors Zhiguang and Hayden contributed equally to this work. We are indebted to Dr Li Shiguang in Nanyang Technological University, who gave us much help in this work.
#111755 - $15.00 USD Received 22 May 2009; revised 24 Jul 2009; accepted 25 Jul 2009; published 28 Sep 2009
(C) 2009 OSA 12 October 2009 / Vol. 17, No. 21 / OPTICS EXPRESS 18407