Lazard Retirement Series Annual Report December 31, 2016 US Equity Lazard Retirement US Strategic Equity Portfolio Lazard Retirement US Small-Mid Cap Equity Portfolio International Equity Lazard Retirement International Equity Portfolio Emerging Markets Lazard Retirement Emerging Markets Equity Portfolio Asset Allocation Lazard Retirement Global Dynamic Multi Asset Portfolio
Transcript
Lazard Retirement SeriesAnnual Report December 31, 2016
US EquityLazard Retirement US Strategic Equity PortfolioLazard Retirement US Small-Mid Cap Equity Portfolio
International EquityLazard Retirement International Equity Portfolio
25 Lazard Retirement Global Dynamic Multi Asset Portfolio
36 Notes to Portfolios of Investments
40 Statements of Assets and Liabilities
42 Statements of Operations
44 Statements of Changes in Net Assets
46 Financial Highlights
51 Notes to Financial Statements
63 Report of Independent Registered Public Accounting Firm
64 Board of Directors and Officers Information
67 Other Information
Shares of the Portfolios are currently offered only to separate accounts established by insurance companies to fund variable annuitycontracts and variable life insurance policies. Portfolio shares may also be offered to certain qualified pension and retirement plans andaccounts permitting accumulation of assets on a tax-deferred basis.
Please consider a Portfolio’s investment objectives, risks, charges and expenses carefully before investing. For more complete informationabout Lazard Retirement Series, Inc. (the “Fund”), you may obtain a prospectus or summary prospectus by calling 800-823-6300, or online,at www.LazardNet.com. Read the prospectus or each Portfolio’s summary prospectus carefully before you invest. The prospectus and eachPortfolio’s summary prospectus contain the investment objectives, risks, charges, expenses and other information about each Portfolio ofthe Fund, which are not detailed in this report.
Distributed by Lazard Asset Management Securities LLC.
Lazard Retirement Series, Inc. Table of Contents
2 Annual Report
Dear Shareholder,
In 2016, global equity markets generally performed well despite significant bouts of volatility caused by unex-pected economic and political events. In Europe, returns were muted as the United Kingdom’s June vote toleave the European Union weighed on the pound sterling and UK assets. In December, Prime Minister MatteoRenzi’s resounding defeat in the Italian referendum on constitutional reform and his subsequent resignationadded to uncertainty in the region. A surprise outcome to the US presidential election caused US stocks to rallysharply at year-end in anticipation of lower corporate taxes and regulatory reform. Meanwhile, emerging mar-kets equities snapped their negative streak and ended the year firmly higher, primarily as the price of oil andother commodities stabilized.
In the first half of 2016, yields across most global bond markets fell due to uneven news flow and seesawing risksentiment. However, yields increased toward the end of the year in response to inflationary pressures, higher oilprices, and strong economic data. The US Federal Reserve delivered its long-awaited rate hike in December, andis widely expected to deliver additional hikes in 2017. In contrast, European monetary policy is expected toremain loose, based on announced asset purchase plans from the European Central Bank.
The US dollar continued to strengthen against other major currencies in 2016. The Japanese yen appreciatedeven after the Bank of Japan adopted a negative interest rate policy early in the year, but weakened consider-ably in November and December due to Japan’s widening interest rate differential with the United States. Overthe year, the biggest currency laggards included the Mexican peso, which was hurt by Donald Trump’s electionvictory, and the Turkish lira, which was weighed down by a surprise coup attempt in Turkey.
At Lazard Asset Management, we remain focused on active management and are committed to responsibly pur-suing the Portfolios’ investment objectives. We appreciate your continued confidence in our investment man-agement capabilities and we feel privileged that you have turned to Lazard for your investment needs.
Sincerely,
Lazard Asset Management LLC
Lazard Retirement Series, Inc. A Message from Lazard
Annual Report 3
US EquitiesThe S&P 500® Index rose 12.0% in 2016. Modest gainsin the first half of the year masked significant volatility,as markets were down significantly in February on theback of concerns about the Chinese economy and com-modity price declines. However, markets resumed theirupward trend in the second half of the first quarter, asthe US Federal Reserve’s lowered forecast for 2016interest rate increases and a rebound in oil pricesencouraged investors. Although markets again fellsharply in late June due to the uncertainty caused bythe United Kingdom’s vote to leave the EuropeanUnion (“Brexit”), they recovered in the third quarter, asinvestors gained more confidence in the United Stateseconomy’s ability to withstand global geopolitical risks.Economic data were mixed during the period, asemployment reports generally exceeded expectations,but the economy continued to grow unevenly, culmi-nating with a strong third quarter reading of 3.2%. Inlight of an improving employment and inflation picturetoward the end of the year, the Federal Open MarketCommittee elected to raise interest rates by 25 basispoints in December. By sector, energy, telecom serv-ices, financials, and industrials sectors recorded strongreturns, outperforming the S&P 500 benchmark in2016. In contrast, the consumer discretionary, con-sumer staples, real estate, and health care sectorsunderperformed the index.
International EquitiesInternational equities rose in 2016, though in US dollarterms this was tempered by the strength of the US cur-rency. The MSCI EAFE® Index (the “EAFE Index”) rose1.00% in 2016 with a recovery in commodity prices theconstant through most of the year. In oil, this recoverycame from output cuts, first in the United States inresponse to much lower prices and capital expendi-tures, then in a production-cut agreement from oil-pro-ducing countries. In other commodities, it resulted fromChinese government policy that included government-directed spending on infrastructure and state-ownedenterprises as well as restricting local coal supply.
Elsewhere, it was a year of two halves. Until the sum-mer, low growth and low or negative interest rates sup-ported higher-return and more defensive stocks, while astable dollar and rising commodity prices helped
emerging markets. This dynamic peaked after the sur-prise United Kingdom vote to leave the EuropeanUnion. Investors, however, quickly decided Brexit wasnot the feared disaster, and indeed started to believethat reflation was coming, aided by a shift towardsmore expansionary fiscal policy. Market sentimentreceived another boost in November with the electionof Donald Trump as US president. Investors focused onthe potentially stimulative impact of his policies ongrowth, including lower taxes, less regulation, andhigher infrastructure spending, while downplayingTrump’s previous statements on trade, immigration,and foreign policy. This dynamic accelerated the marketrotation into stocks perceived to benefit from risinginflation, rising rates and, possibly, rising growth.
In this environment, the commodity-related areas ofenergy, materials and industrials were strong all yearfrom the commodity lows of February. Banks finishedthe year broadly flat, after a significant recovery in thesecond half of the year from weakness in the first half.The higher-return and more stable sectors of the mar-ket fell in absolute terms, especially in the fourth quar-ter of the year. Healthcare was the weakest sector ofthe year as the rotation out of defensives and intocyclicals was exacerbated by rising commercial andpolitical pressure on pricing and regulation.
Emerging Markets EquitiesFollowing a year of heightened deflationary pressuresand concerns over the sustainability of world eco-nomic activity, equities in the developing world wereable to rebound in 2016. The improvement was prima-rily caused by some adjustments in political policy inseveral countries, most prominently Brazil and Rus-sia, coupled with a stabilizing trend in commodityprices. The MSCI Emerging Markets® Index (the “EMIndex”) finished the year 11.2% higher with increasingshare prices across all regions. However, in contrastto most of the last three years, Asian emerging mar-kets recorded the worst regional return, rising by justover 6%. Latin American markets were dominated byreturns in Brazil, and rose by 31%, while eastern Euro-pean markets were aided by a strong rebound in Rus-sia and increased by almost 38%. The year began withunsuccessful efforts by the People’s Bank of China(PBoC) to significantly devalue the renminbi, which
Lazard Retirement Series, Inc. Investment Overviews
4 Annual Report
shook global markets. Investors witnessed severalcommodities’ prices bottoming in the first quarter,and then prices subsequently increased as capacitywas removed. The Brexit vote, which resulted in arequirement that the United Kingdom leave the Euro-pean Union in the near future, also surprisedinvestors but did not, up to this point, destabilizeemerging markets. An unsuccessful coup in Turkey,caused market disruption, as President Recep TayyipErdogan made efforts to remove members of theGulen movement from government office. In Novem-ber, the election of Donald Trump as US president hadthe effects of increasing confidence in US economicactivity and the US dollar and again pressuring sev-eral developing markets currencies, especially theMexican peso and Chinese renminbi.
In Asian markets, the election of President RodrigoDuterte in the Philippines ushered in unusual law andorder as well as defense policies and rhetoric resultingin poor returns. The scandal involving 1MDB, a gov-ernment run strategic development company, heldback equity returns in Malaysia. Indian Prime MinisterNarendra Modi’s decision to prohibit larger currencybills as a means of decreasing the informal economyand raise tax receipts also caused some market dis-ruption. Chinese company shares were adverselyaffected by the devaluation efforts of the PBoC butalso suffered from ongoing economic lethargy and atightening in liquidity. Several Asian markets, how-ever, performed well. Indonesian company stocksrebounded strongly after considerable weakness in2015. The Taiwanese market benefited especially fromtechnology companies’ increased demand for sophis-ticated integrated circuits. Despite King BhumibolAdulyadej’s death, Thai company shares rebounded onsigns of improving economic activity.
The Mexican market suffered greatly during 2016 asUS President-elect Donald Trump threatened to rene-gotiate the NAFTA trade agreement. Elsewhere inLatin America, markets finished considerably higherbased on a commodity price recovery and improvedpolitical trends. In Peru, market-friendly candidatePedro Pablo Kuczynski narrowly won the presidency.The biggest change, however, happened in Brazil. Atelephone conversation between President Dilma
Rousseff and former President Lula, allegedly protect-ing him from an investigation, was leaked in Marchand set in motion her ultimate impeachment. This hadthe effect of markedly strengthening the real, as wellas share prices, as investors became much less pes-simistic about the economic trends. As a result, Brazil-ian equities ended the year 66% higher, outperformingall other emerging markets.
Returns were more mixed across eastern European,Middle East, and African markets. Lack of policy direc-tion in Greece resulted in more weakness there. A deci-sion to completely float the Egyptian pound caused anear 100% currency devaluation and considerable mar-ket weakness in Egypt. The unsuccessful coup attemptin Turkey and subsequent political and economic turbu-lence resulted in another weak year for that market. InSouth Africa, an apparent dispute between PresidentJacob Zuma and Finance Minister Pravin Gordhan overcorruption weakened equity prices in the country untilthe release of a report in November, which found seri-ous evidence of graft in Zuma’s government. The mar-ket then rallied on the higher likelihood that Zuma willnot run again. Russian company shares rose by morethan 54% in the year, aided by strengthening crude oilprices, conservative fiscal policies, and the possibilityof improving relations with the United States followingthe election of Donald Trump.
By sector, materials and energy stocks recordedstrong returns, outperforming the benchmark. In con-trast, the consumer discretionary, consumer staples,health care, and real estate performed particularlypoorly and underperformed the EM Index.
Multi AssetGlobal equity markets generated fairly strong gains in2016, rising 7.5% in US dollar terms, as measured bythe MSCI World® Index, which was impressive consid-ering the many macro and political events that buf-feted markets and the inauspicious start to the yearwith stocks falling sharply in the first six weeks. Onthe other hand, global bonds as measured by theBloomberg Barclays Capital Global Aggregate Bond®
Index were up 2.09% for the year, also in US dollarterms. Early in the year, investors feared the US Fed-eral Reserve’s rate hike in December 2015 had been a
Annual Report 5
policy error likely to push a sluggish US economy intorecession and trigger an uncontrolled devaluation ofChina’s currency. Oil’s plunge to the mid $20sweighed further and triggered a rapid deterioration incredit markets and crushing investor sentiment. Laterin the year, overcoming a string of political surprises,investor sentiment began to reverse and a durablerally ensued. Equities rebounded with oil which trig-gered a rotation into commodity-oriented valuestocks. Credit markets more than fully reversed theirearlier weakness. The mid-year shock of Brexit causeda drop in rates and outperformance of defensivegrowth stocks but within a few weeks rates bottomedand began to rise. This triggered a rotation into rate-sensitive value stocks (e.g., financials) and declines inthe defensive growth stocks which had benefited fromthe earlier deflationary concerns. The election of Don-ald Trump, along with Republican control of bothhouses of Congress, was perceived as a potential endto gridlock in Washington and increased the likelihoodof growth-stimulative tax cuts and infrastructurespending. This provided further evidence that anextended period of widespread deflation was unlikelyand accelerated the rise in rates and rotation fromdefensive growth equities to more cyclical valuestocks and, particularly, financials.
However, a broad array of economic indicators hadbegun to show that deflationary pressures were abat-ing in the global economy even before the US elec-tions. Secular stagnation and fears of deflation hadbecome a strong consensus among investors earlier inthe year. Fears of an additional step down in growthdue to Brexit brought those deflation concerns to afever pitch and drove bond yields to their lows. Yetinflationary pressures had been building as the shockof the mid 2014 collapse in oil and surge in the US dol-lar faded and the industrial sector globally regained itsfooting. Global inflation reports were no longer consis-tently below forecasts and market-based estimates offuture inflation were rebounding from low levels inboth the US and Europe. Forward looking indicators ofmanufacturing activity had seen a broad basedrebound since late 2015. US wages have risen steadilyover the past year and Chinese producer prices, whichhad been deeply negative since 2012, moved sharply
positive during the fourth quarter, signaling that Chinais no longer exporting deflation.
Lazard Retirement US Strategic Equity PortfolioFor the year ended December 31, 2016, the LazardRetirement US Strategic Equity Portfolio’s ServiceShares posted a total return of 9.42%, as comparedwith the 11.96% return for the S&P 500 Index.
Stock selection in the industrials sector contributed toperformance. Shares of salvage vehicle auctionholder Copart rose after the company reported quar-terly earnings above expectations, driven by highervolume growth stemming from market share gainsand industry-wide volume growth. Stock selection inthe health care sector also helped returns. Shares ofdiversified managed care provider Aetna rose afterthe company reported third-quarter earnings aboveexpectations, driven by continued strength in its gov-ernment business. We exited our position as we sawopportunities with better risk-reward profiles else-where.
In contrast, stock selection in the consumer discre-tionary sector detracted from performance. Shares ofNorwegian Cruise Line fell in response to concernsabout travel demand stemming from the terroristattacks in Brussels and Orlando and the Zika virus, aswell as concerns of a macroeconomic slowdown, andthe recent rise in oil prices. We trimmed our positionin the fourth quarter, as our thesis had changed. Stockselection and an underweight position in the finan-cials sector also hurt returns. Shares of OneMain fellamid continued concerns about the company’s fund-ing costs in a rising rate environment, as well as itssubprime loan exposure. We sold our position as areassessment of our scenarios resulted in the risk-adjusted upside no longer being favorable.
Lazard Retirement US Small-Mid Cap Equity PortfolioFor the year ended December 31, 2016, the LazardRetirement US Small-Mid Cap Equity Portfolio’s ServiceShares posted a total return of 15.78%, as comparedwith the 17.59% return for the Russell 2500® Index.
Stock selection in the information technology sectorcontributed to performance. Shares of payment tech-
6 Annual Report
nology company NCR rose after the companyreported quarterly earnings above expectations,driven by strong margins and order growth. Stockselection and an overweight position in the industrialssector also helped returns. Shares of B/E Aerospacerose after Rockwell Collins announced plans toacquire the company for $8.3 billion. We sold ourposition after the fourth quarter announcement, as thestock approached our target valuation.
In contrast, stock selection in the financials sectordetracted from performance. Shares of OneMain fellamid continued concerns about the company’s fund-ing costs in a rising rate environment, as well as itssubprime loan exposure. We sold our position as ourthesis had changed. Stock selection and an under-weight position in the materials sector also hurtreturns. Shares of Kapstone Paper and Packaging fellafter the company reported quarterly earnings belowexpectations and management gave a cautious out-look, citing difficult market conditions. We sold ourposition after the announcement in February, as ourthesis was no longer valid.
Lazard Retirement International Equity PortfolioFor the year ended December 31, 2016, the LazardRetirement International Equity Portfolio’s ServiceShares posted a total return of -4.29%, as comparedwith the 1.00% return for the EAFE Index.
During the year, in an environment that saw anextended, strong rotation into cyclicals and lower-quality stocks, the Portfolio lagged its benchmark.Much of the underperformance was due to the rally instocks with negative to low financial productivity thatoccurred while stocks with higher financial productiv-ity lagged. As we focus on companies with sustain-ably high, or improving, financial productivity wewere not exposed to some of the best performingstocks. Furthermore, some of our holdings, despiteconsistent fundamentals, were negatively impactedby the strong sector rotation.
The most significant source of underperformance wasour positioning in the industrials sector, where weremain overweight. The sector was generally led
higher by stocks with lower financial productivity, andadditionally, some of our holdings in this sector under-performed due to the aforementioned rotation intoless financially productive stocks, despite consistentfundamentals. One notable example is lock-makerAssa Abloy, which lagged its more cyclical peers.
Stock selection in the health care sector also hurt rela-tive returns, despite low exposure which benefited thePortfolio. Some of this was due to the strong rotationout of traditionally defensive stocks and into cyclicals,which weighed on the sector. Furthermore, increasedregulatory scrutiny during the US election cycle alsoweighed on the sector. Our position in Israeli pharma-ceutical company Teva fell on worries about the viabilityof their Copaxone (for the treatment of multiple sclero-sis) patents, as well as concerns on generics pricing.
Additionally, the Portfolio was negatively impacted byour positioning in the financials sector. The opportu-nity cost of not owning less financially productivefinancials weighed on the Portfolio. These stocks ral-lied on the anticipation of earnings improvement, theprobability of which is less likely in Europe given thechallenging regulatory, tax, and interest rate environ-ment. Elsewhere in the sector, shares of British bankLloyds (which was sold during the period) declinedfollowing the Brexit referendum result. We remainunderweight in financials given the numerous risksstill pervasive in the sector.
On a positive note, the Portfolio benefited from posi-tioning in emerging markets, as shares of TaiwanSemiconductor rose. In Brazil, shares of insurancebroker BB Seguridade performed well on improvingbusiness conditions. The Portfolio’s positioning inCanada was also beneficial, as shares of NationalBank of Canada and Suncor Energy both performedwell. Elsewhere, the Portfolio’s low allocation to theunderperforming utilities sector was additive to rela-tive returns.
Lazard Retirement Emerging Markets Equity PortfolioFor the year ended December 31, 2016, the LazardRetirement Emerging Markets Equity Portfolio’sInvestor Shares posted a total return of 21.12%, while
Annual Report 7
Service Shares posted a total return of 20.78%, ascompared with the 11.19% return for the EM Index.
During the period, shares of Sberbank, a Russian bank,rose on the back of continued strong operating per-formance and after management provided upbeatguidance for 2017. Banco do Brasil, a Brazilian bank,benefited from an improving return outlook with risingmargins and healthier capital ratios. Taiwan Semicon-ductor Manufacturing, a Taiwanese semiconductormanufacturer, benefited from positive trends in thesemiconductor industry as well as from reports ofstronger-than-expected iPhone sales. Shares of Sam-sung Electronics, a Korean manufacturer of electronicgoods, also rose with a display division turnaround.Stock selection, especially within the financials, indus-trials, and consumer discretionary sectors, and withinChina, Korea, and Russia helped performance. Ahigher-than-index exposure to Russia and Brazil, and alower-than-benchmark exposure to China, added value.
In contrast, shares of Baidu, a Chinese search enginecompany, declined after management guided downexpectations for the quarter amid continued weaknessin one of its areas of business after a governmentclampdown. Shares of PLDT, a Philippine telecomservices company, fell due to expectations for furtherweakness as the company pursues its three-year turn-around strategy. Bharat Heavy Electricals, an Indianmanufacturer of power plant equipment, posted poorearnings for the third quarter of fiscal year 2016 onthe back of increased competition. Shares of HanwhaLife Insurance, a Korean insurance company, fell onexpectations for a continued environment of lowinterest rates in Korea.
Lazard Retirement Global Dynamic Multi Asset PortfolioFor the year ended December 31, 2016, the LazardRetirement Global Dynamic Multi Asset Portfolio’sService Shares posted a total return of 3.30%, as com-
pared with the 4.95% return of its blended benchmark,which is a 50/50 blend of the MSCI World Index andthe Bloomberg Barclays Capital Global AggregateBond Index (the “GDMA Index”).
Changes made to the market forecast during 2016reflected a consideration of many factors, includingmonetary policies of central banks around the globe;global macro data readings in China (particularly thePurchasing Managers Index, which measures eco-nomic activity), the United States, the euro zone, andJapan; fiscal policy in developed and emerging mar-kets; geopolitical events and risks including electionsand referenda; and equity and fixed income valua-tions, along with other data.
For the full year 2016, stock selection in the real estatesector and an underweight position to the energy sec-tor added value within the equity allocation, as didstock selection in Israel and Ireland and an under-weight exposure to Germany. Within fixed income,performance was helped by overweight exposures toAustralia and New Zealand, underweight governmentbonds and overweight positioning in diversified globalcredit sectors, especially corporates, tactical exposureto Australia and New Zealand, and underweight expo-sure to the Japanese yen and Korean won.
In contrast, stock selection in the consumer discre-tionary and industrials sectors, underweight exposure toinformation technology and overweight exposure to util-ities detracted from performance within equities, as didstock selection in the United States and the United King-dom; within fixed income, performance was hurt byunderweight exposure to bonds across the euro zone,Japan, United Kingdom, and the United States, over-weight exposure to Mexico and overweight exposure tothe Swedish krona. The positions in the currencies areimplemented using non-deliverable forward contracts.
8 Annual Report
Notes to Investment Overviews:
Total returns reflect reinvestment of all dividends and distributions, if any. Certain expenses of a Portfolio may have been waived or reimbursed byLazard Asset Management LLC, the Fund’s investment manager (the “Investment Manager”), State Street Bank and Trust Company, the Fund’sadministrator (“State Street”), or Boston Financial Data Services, Inc., the Fund’s transfer and dividend disbursing agent (“BFDS”); without suchwaiver/reimbursement of expenses, such Portfolio’s returns would have been lower. Performance information does not reflect the fees and chargesimposed by participating insurance companies at the separate account level, and such charges will have the effect of reducing performance. Past per-formance is not indicative, or a guarantee, of future results.
The performance data of the indices and other market data have been prepared from sources and data that the Investment Manager believes to bereliable, but no representation is made as to their accuracy. These indices are unmanaged, have no fees or costs and are not available for investment.
The views of the Investment Manager and the securities described in this report are as of December 31, 2016; these views and portfolio holdingsmay have changed subsequent to this date. Nothing herein should be construed as a recommendation to buy, sell, or hold a particular security. Thereis no assurance that the securities discussed herein will remain in a Portfolio at the time you receive this report, or that securities sold will not havebeen repurchased. The specific securities discussed may, in aggregate, represent only a small percentage of a Portfolio’s holdings. It should not beassumed that securities identified and discussed were, or will be, profitable, or that the investment decisions made in the future will be profitable, orequal the investment performance of the securities discussed herein.
The views and opinions expressed are provided for general information only, and do not constitute specific tax, legal, or investment advice to, or rec-ommendations for, any person. There can be no guarantee as to the accuracy of any outlooks for markets, sectors and securities as discussed herein.You should read the Fund’s prospectus or each Portfolio’s summary prospectus for a more detailed discussion of each Portfolio’s investment objec-tives, strategies, risks and fees.
Annual Report 9
Lazard Retirement Series, Inc. Performance Overviews
Lazard Retirement US Strategic Equity PortfolioComparison of Changes in
Value of $10,000 Investment in
the Service Shares of Lazard
Retirement US Strategic Equity
Portfolio and S&P 500® Index*
Retirement US Strategic Equity Portfolio Service SharesS&P 500 Index
Average Annual Total Returns*Periods Ended December 31, 2016 One Five Ten
Year Years Years
Service Shares 9.42% 11.62% 4.95%
S&P 500 Index 11.96% 14.66% 6.95%
* Total returns reflect reinvestment of all dividends and distributions, if any. Certain expenses of the Portfolio have been waived or reimbursed by thePortfolio’s Investment Manager or State Street; without such waiver/reimbursement of expenses, the Portfolio’s returns would have been lower.Performance information does not reflect the fees and charges imposed by participating insurance companies at the separate account level, andsuch charges will have the effect of reducing performance.
Performance results do not include adjustments made for financial reporting purposes in accordance with accounting principles generally acceptedin the United States of America (“GAAP”) and may differ from amounts reported in the financial highlights.
The performance quoted represents past performance. Current performance may be lower or higher than the performance quoted. Past perform-ance is not indicative, or a guarantee, of future results; the investment return and principal value of the Portfolio will fluctuate, so that Portfolioshares, when redeemed, may be worth more or less than their original cost. Within the longer periods illustrated there may have been short-termfluctuations, counter to the overall trend of investment results, and no single period of any length may be taken as typical of what may beexpected in future periods.
The performance data of the index has been prepared from sources and data that the Investment Manager believes to be reliable, but no repre-sentation is made as to its accuracy. The S&P 500 Index is a market capitalization-weighted index of 500 common stocks, designed to measureperformance of the broad domestic economy through changes in the aggregate market value of these stocks, which represent all major industries.The index is unmanaged, has no fees or costs and is not available for investment.
Before May 1, 2007, the Portfolio was known as Lazard Retirement Equity Portfolio and had a different investment strategy.
10 Annual Report
Lazard Retirement US Small-Mid Cap Equity PortfolioComparison of Changes in
Value of $10,000 Investment in
the Service Shares of Lazard
Retirement US Small-Mid Cap
Equity Portfolio, Russell 2500®
Index and Russell 2000/2500
Linked Index*
Retirement US Small-Mid Cap Equity Portfolio Service SharesRussell 2500 IndexRussell 2000/2500 Linked Index
Average Annual Total Returns*Periods Ended December 31, 2016 One Five Ten
Year Years Years
Service Shares 15.78% 13.35% 6.60%
Russell 2500 Index 17.59% 14.54% 7.69%
Russell 2000/2500 Linked Index 17.59% 14.54% 7.43%
* Total returns reflect reinvestment of all dividends and distributions, if any. Certain expenses of the Portfolio have been waived or reimbursed by thePortfolio’s Investment Manager; without such waiver/reimbursement of expenses, the Portfolio’s returns would have been lower. Performanceinformation does not reflect the fees and charges imposed by participating insurance companies at the separate account level, and such chargeswill have the effect of reducing performance.
Performance results do not include adjustments made for financial reporting purposes in accordance with GAAP and may differ from amountsreported in the financial highlights.
The performance quoted represents past performance. Current performance may be lower or higher than the performance quoted. Past perform-ance is not indicative, or a guarantee, of future results; the investment return and principal value of the Portfolio will fluctuate, so that Portfolioshares, when redeemed, may be worth more or less than their original cost. Within the longer periods illustrated there may have been short-termfluctuations, counter to the overall trend of investment results, and no single period of any length may be taken as typical of what may beexpected in future periods.
The Portfolio was previously known as Lazard Retirement U.S. Small Cap Equity Portfolio. As of June 1, 2009, the Portfolio changed its name toLazard Retirement U.S. Small-Mid Cap Equity Portfolio and changed its investment strategy to invest in equity securities of small-mid cap UScompanies.
The performance data of the indices have been prepared from sources and data that the Investment Manager believes to be reliable, but no repre-sentation is made as to their accuracy. The Russell 2500 Index is comprised of the 2,500 smallest US companies included in the Russell 3000®
Index (which consists of the 3,000 largest US companies by capitalization). The Russell 2000/2500 Linked Index is created by the Portfolio’s Invest-ment Manager, which links the performance of the Russell 2000® Index for all periods through May 31, 2009 (when the Portfolio’s benchmarkindex changed) and the Russell 2500 Index for all periods thereafter. The Russell 2000 Index is comprised of the 2,000 smallest US companiesincluded in the Russell 3000 Index. The indices are unmanaged, have no fees or costs and are not available for investment.
Annual Report 11
Lazard Retirement International Equity PortfolioComparison of Changes in
Value of $10,000 Investment in
the Service Shares of Lazard
Retirement International Equity
Portfolio and EAFE Index*
Retirement International Equity Portfolio Service SharesEAFE Index
Average Annual Total Returns*Periods Ended December 31, 2016 One Five Ten
Year Years Years
Service Shares -4.29% 6.41% 1.36%
EAFE Index 1.00% 6.53% 0.75%
* Total returns reflect reinvestment of all dividends and distributions, if any. Certain expenses of the Portfolio have been waived or reimbursed by thePortfolio’s Investment Manager; without such waiver/reimbursement of expenses, the Portfolio’s returns would have been lower. Performanceinformation does not reflect the fees and charges imposed by participating insurance companies at the separate account level, and such chargeswill have the effect of reducing performance.
Performance results do not include adjustments made for financial reporting purposes in accordance with GAAP and may differ from amountsreported in the financial highlights.
The performance quoted represents past performance. Current performance may be lower or higher than the performance quoted. Past perform-ance is not indicative, or a guarantee, of future results; the investment return and principal value of the Portfolio will fluctuate, so that Portfolioshares, when redeemed, may be worth more or less than their original cost. Within the longer periods illustrated there may have been short-termfluctuations, counter to the overall trend of investment results, and no single period of any length may be taken as typical of what may beexpected in future periods.
The performance data of the index has been prepared from sources and data that the Investment Manager believes to be reliable, but no representa-tion is made as to its accuracy. The EAFE Index is a broadly diversified international index comprised of equity securities of approximately 1,000 com-panies located in developed countries outside the United States. The index is unmanaged, has no fees or costs and is not available for investment.
12 Annual Report
Lazard Retirement Emerging Markets Equity PortfolioComparison of Changes in
Value of $10,000 Investment in
the Service Shares of Lazard
Retirement Emerging Markets
Equity Portfolio and EM Index*
Average Annual Total Returns*Periods Ended December 31, 2016 One Five Ten
Year Years Years
Service Shares** 20.78% 2.11% 2.63%
Investor Shares** 21.12% 2.35% 2.88%
EM Index 11.19% 1.28% 1.84%
* Total returns reflect reinvestment of all dividends and distributions, if any. Certain expenses of the Portfolio have been waived or reimbursed by thePortfolio’s Investment Manager; without such waiver/reimbursement of expenses, the Portfolio’s returns would have been lower. Performanceinformation does not reflect the fees and charges imposed by participating insurance companies at the separate account level, and such chargeswill have the effect of reducing performance.
Performance results do not include adjustments made for financial reporting purposes in accordance with GAAP, also exclude adjustments relatedto reimbursed custodian out-of-pocket expenses (Note 3 in the Notes to Financial Statements), and may differ from amounts reported in the finan-cial highlights.
The performance quoted represents past performance. Current performance may be lower or higher than the performance quoted. Past perform-ance is not indicative, or a guarantee, of future results; the investment return and principal value of the Portfolio will fluctuate, so that Portfolioshares, when redeemed, may be worth more or less than their original cost. Within the longer periods illustrated there may have been short-termfluctuations, counter to the overall trend of investment results, and no single period of any length may be taken as typical of what may beexpected in future periods.
The performance data of the index has been prepared from sources and data that the Investment Manager believes to be reliable, but no repre-sentation is made as to its accuracy. The EM Index is comprised of emerging market securities in countries open to non-local investors. The indexis unmanaged, has no fees or costs and is not available for investment.
**The performance of Service Shares and Investor Shares may vary, primarily based on the differences in fees borne by shareholders investing in dif-ferent classes.
Retirement Emerging Markets Equity Portfolio Service SharesEM Index
Lazard Retirement Global Dynamic Multi Asset PortfolioComparison of Changes in
Value of $10,000 Investment in
the Service Shares of Lazard
Retirement Global Dynamic
Multi Asset Portfolio, GDMA
Index and MSCI World® Index*
Average Annual Total Returns*Periods Ended December 31, 2016 One Since
Year Inception†
Service Shares 3.30% 6.37%
GDMA Index 4.95% 4.40%
MSCI World Index 7.51% 8.88%
* Total returns reflect reinvestment of all dividends and distributions, if any. Certain expenses of the Portfolio have been waived or reimbursed by thePortfolio’s Investment Manager, State Street or BFDS; without such waiver/reimbursement of expenses, the Portfolio’s returns would have beenlower. Performance information does not reflect the fees and charges imposed by participating insurance companies at the separate account level,and such charges will have the effect of reducing performance.
Performance results do not include adjustments made for financial reporting purposes in accordance with GAAP and may differ from amountsreported in the financial highlights.
The performance quoted represents past performance. Current performance may be lower or higher than the performance quoted. Past perform-ance is not indicative, or a guarantee, of future results; the investment return and principal value of the Portfolio will fluctuate, so that Portfolioshares, when redeemed, may be worth more or less than their original cost. Within the longer periods illustrated there may have been short-termfluctuations, counter to the overall trend of investment results, and no single period of any length may be taken as typical of what may beexpected in future periods.
The performance data of the indices have been prepared from sources and data that the Investment Manager believes to be reliable, but no repre-sentation is made as to their accuracy. The GDMA Index is created by the Portfolio’s Investment Manager and is a 50/50 blend of the MSCI WorldIndex and the Bloomberg Barclays Capital Global Aggregate Bond® Index. The MSCI World Index is a free float-adjusted market capitalizationweighted index that is designed to measure the equity market performance of developed markets. The Bloomberg Barclays Capital Global Aggre-gate Bond Index provides a broad-based measure of global investment-grade fixed-income debt markets, including government-related debt, cor-porate debt, securitized debt and global Treasury, with maturities of no less than one year. The indices are unmanaged, have no fees or costs andare not available for investment.
Before April 30, 2014, the Portfolio was known as Lazard Retirement Multi-Asset Targeted Volatility Portfolio.
† The inception date for the Portfolio was April 30, 2012.
Retirement Global Dynamic Multi Asset Portfolio Service SharesGDMA IndexMSCI World Index
$12,224
$14,877
$13,345
04/30/12 06/12 12/1312/12 06/13
9,000
10,000
11,000
12,000
13,000
14,000
$15,000
12/1406/14 12/1506/15 12/1606/16
14 Annual Report
Expense ExampleAs a shareholder in a Portfolio of the Fund, you incur ongoing costs, including management fees, distributionand service (12b-1) fees (Service Shares only), and other expenses. This Example is intended to help you under-stand your ongoing costs (in dollars) of investing in a Portfolio and to compare these costs with the ongoingcosts of investing in other mutual funds. The Example is based on an investment of $1,000 invested at the begin-ning of the six month period from July 1, 2016 through December 31, 2016 and held for the entire period.
Actual ExpensesFor each Share class of the Portfolios, the first line of the table below provides information about actual accountvalues and actual expenses. You may use the information in this line, together with the amount you invested, toestimate the expenses that you paid over the period. Simply divide your account value by $1,000 (for example,an $8,600 account value divided by $1,000=8.6), then multiply the result by the number in the first line under theheading entitled “Expenses Paid During Period” to estimate the expenses you paid on your account during thisperiod.
Hypothetical Example for Comparison PurposesFor each Share class of the Portfolios, the second line of the table below provides information about hypotheti-cal account values and hypothetical expenses based on the class’ actual expense ratio and an assumed rate ofreturn of 5% per year before expenses, which is not the Portfolio’s actual return. The hypothetical account valuesand expenses may not be used to estimate the actual ending account balance or expenses you paid for theperiod. You may use this information to compare the ongoing costs of investing in the Portfolio and othermutual funds. To do so, compare this 5% hypothetical example with the 5% hypothetical examples that appearin the shareholders reports of other mutual funds.
Please note that you also bear fees and charges imposed by participating insurance companies at the separateaccount level, which are described in the separate prospectuses issued by the participating insurance compa-nies. Such charges will have the effect of reducing account value.
Lazard Retirement Series, Inc. Information About Your Portfolio’s Expenses
Annual Report 15
US Strategic EquityService SharesActual $1,000.00 $1,088.10 $5.25 1.00%Hypothetical (5% Return Before Expenses) $1,000.00 $1,020.11 $5.08 1.00%
US Small-Mid Cap EquityService SharesActual $1,000.00 $1,159.40 $6.79 1.25%Hypothetical (5% Return Before Expenses) $1,000.00 $1,018.85 $6.34 1.25%
International Equity**Service SharesActual $1,000.00 $ 981.90 $5.38 1.08%Hypothetical (5% Return Before Expenses) $1,000.00 $1,019.71 $5.48 1.08%
Global Dynamic Multi AssetService SharesActual $1,000.00 $1,007.60 $5.30 1.05%Hypothetical (5% Return Before Expenses) $1,000.00 $1,019.86 $5.33 1.05%
* Expenses are equal to the annualized expense ratio, net of expense waivers and reimbursements, of each Share class multiplied by the averageaccount value over the period, multiplied by 184/366 (to reflect one-half year period).
**Excludes impact of the custodian out-of-pocket expenses that were reimbursed during the current period. Refer to Note 3 in the Notes to FinancialStatements.
Beginning Ending Expenses Paid Annualized Expense Account Value Account Value During Period* Ratio During PeriodPortfolio 7/1/16 12/31/16 7/1/16 - 12/31/16 7/1/16 - 12/31/16
Auto Components | 1.3%Delphi Automotive PLC 1,970 132,680
Banks | 4.7%Bank of America Corp. 17,060 377,026KeyCorp. 6,500 118,755 495,781Beverages | 5.7%Molson Coors Brewing Co., Class B 2,925 284,632The Coca-Cola Co. 7,425 307,840 592,472Building Products | 1.2%Johnson Controls International PLC 3,005 123,776
Capital Markets | 3.9%Intercontinental Exchange, Inc. 4,100 231,322The Charles Schwab Corp. 4,510 178,010 409,332Chemicals | 0.4%PPG Industries, Inc. 500 47,380
Commercial Services & Supplies | 0.9%Copart, Inc. (a) 1,685 93,366
Communications Equipment | 5.1%Cisco Systems, Inc. 12,795 386,665Motorola Solutions, Inc. 1,800 149,202 535,867Containers & Packaging | 1.5%Crown Holdings, Inc. (a) 2,910 152,979
Industrial Conglomerates | 1.0%Honeywell International, Inc. 885 102,527
Insurance | 2.3%Aon PLC 1,675 186,812The Hartford Financial Services Group, Inc. 1,175 55,989 242,801Internet Software & Services | 7.4%Alphabet, Inc., Class A (a) 610 483,395Alphabet, Inc., Class C (a) 53 40,906eBay, Inc. (a) 8,335 247,466 771,767IT Services | 4.9%Fidelity National Information Services, Inc. 1,650 124,806Vantiv, Inc., Class A (a) 2,390 142,492Visa, Inc., Class A 3,095 241,472 508,770Life Sciences Tools & Services | 0.5%Quintiles IMS Holdings, Inc. (a) 760 57,798
The accompanying notes are an integral part of these financial statements.
FairDescription Shares Value
FairDescription Shares Value
Lazard Retirement Series, Inc. Portfolios of Investments December 31, 2016
18 Annual Report
The accompanying notes are an integral part of these financial statements.
Lazard Retirement US Strategic Equity Portfolio (concluded)
Machinery | 0.9%Deere & Co. 885 $ 91,190
Marine | 0.6%Kirby Corp. (a) 925 61,513
Media | 1.5%The Madison Square Garden Co. Class A (a) 920 157,789
Multiline Retail | 1.0%J.C. Penney Co., Inc. (a) 12,450 103,460
Oil, Gas & Consumable Fuels | 4.2%Chevron Corp. 1,680 197,736EOG Resources, Inc. 920 93,012Pioneer Natural Resources Co. 495 89,134Valero Energy Corp. 815 55,681 435,563Pharmaceuticals | 10.9%Allergan PLC (a) 730 153,307Pfizer, Inc. 14,965 486,063Zoetis, Inc. 9,258 495,581 1,134,951Road & Rail | 0.8%Union Pacific Corp. 800 82,944
Semiconductors & Semiconductor
Equipment | 2.9%Applied Materials, Inc. 3,775 121,819Skyworks Solutions, Inc. 2,435 181,797 303,616
Software | 4.9%Microsoft Corp. 6,945 $ 431,562Red Hat, Inc. (a) 1,100 76,670 508,232Specialty Retail | 2.6%Advance Auto Parts, Inc. 838 141,723L Brands, Inc. 700 46,088Lowe’s Cos., Inc. 1,175 83,566 271,377Technology Hardware, Storage
Electrical Equipment | 3.7%Atkore International Group, Inc. 33,700 805,767Generac Holdings, Inc. (a) 17,735 722,524Regal-Beloit Corp. 13,285 919,986 2,448,277Electronic Equipment, Instruments
& Components | 2.1%FLIR Systems, Inc. 24,810 897,874Littelfuse, Inc. 3,280 497,805 1,395,679Energy Equipment & Services | 2.3%Newpark Resources, Inc. (a) 67,400 505,500Oceaneering International, Inc. 35,055 988,902 1,494,402Equity Real Estate Investment Trusts
(REITs) | 8.9%American Campus Communities, Inc. 21,195 1,054,875DCT Industrial Trust, Inc. 22,770 1,090,228Extra Space Storage, Inc. 9,885 763,517Kilroy Realty Corp. 14,310 1,047,778Tanger Factory Outlet Centers, Inc. 25,580 915,253UDR, Inc. 26,975 984,048 5,855,699Food & Staples Retailing | 1.3%Sprouts Farmers Market, Inc. (a) 43,450 822,074
Health Care Equipment & Supplies | 2.3%DENTSPLY SIRONA, Inc. 8,712 502,944STERIS PLC 14,780 996,024 1,498,968Hotels, Restaurants & Leisure | 1.2%Bloomin’ Brands, Inc. 42,685 769,611
Insurance | 6.4%Arch Capital Group, Ltd. (a) 12,450 1,074,310Argo Group International Holdings, Ltd. 17,594 1,159,445Reinsurance Group of America, Inc. 8,395 1,056,343Validus Holdings, Ltd. 16,190 890,612 4,180,710
FairDescription Shares Value
FairDescription Shares Value
20 Annual Report
The accompanying notes are an integral part of these financial statements.
Lazard Retirement US Small-Mid Cap Equity Portfolio (concluded)
Internet Software & Services | 1.5%j2 Global, Inc. 12,055 $ 986,099
IT Services | 3.4%Leidos Holdings, Inc. 19,210 982,399Vantiv, Inc., Class A (a) 20,370 1,214,460 2,196,859Leisure Products | 0.6%Vista Outdoor, Inc. (a) 11,305 417,154
Life Sciences Tools & Services | 2.5%INC Research Holdings, Inc., Class A (a) 15,270 803,202VWR Corp. (a) 34,300 858,529 1,661,731Machinery | 4.2%Altra Industrial Motion Corp. 18,345 676,930Tennant Co. 6,605 470,276TriMas Corp. (a) 43,290 1,017,315Woodward, Inc. 8,900 614,545 2,779,066Marine | 1.5%Kirby Corp. (a) 14,565 968,572
Media | 1.3%Scholastic Corp. 17,380 825,376
Multi-Utilities | 1.6%CMS Energy Corp. 25,400 1,057,148
Development | 0.9%Jones Lang LaSalle, Inc. 6,105 616,849
Semiconductors & Semiconductor
Equipment | 5.3%Brooks Automation, Inc. 24,510 $ 418,386Cypress Semiconductor Corp. 62,125 710,710MACOM Technology SolutionsHoldings, Inc. (a) 13,430 621,540
Microsemi Corp. (a) 14,285 770,961Versum Materials, Inc. (a) 33,400 937,538 3,459,135Software | 3.1%Bottomline Technologies de, Inc. (a) 31,645 791,758BroadSoft, Inc. (a) 12,435 512,944Red Hat, Inc. (a) 10,015 698,045 2,002,747Specialty Retail | 4.3%Advance Auto Parts, Inc. 3,060 517,507Chico’s FAS, Inc. 50,020 719,788Foot Locker, Inc. 11,070 784,752Sally Beauty Holdings, Inc. (a) 29,080 768,294 2,790,341Technology Hardware, Storage
Canada | 5.8%Canadian National Railway Co. 122,190 8,223,356MacDonald Dettwiler & Associates, Ltd. 91,985 4,582,636National Bank of Canada 297,700 12,090,702Suncor Energy, Inc. 403,540 13,194,359 38,091,053Denmark | 1.1%Carlsberg A/S, Class B 83,536 7,209,231
Finland | 2.4%Sampo Oyj, A Shares 343,829 15,375,088
France | 10.3%Air Liquide SA 101,281 11,243,508Airbus Group SE 72,265 4,769,388Capgemini SA 149,144 12,578,449Cie Generale des Etablissements Michelin 85,283 9,485,923Valeo SA 282,609 16,238,600Vinci SA 193,162 13,138,719 67,454,587Germany | 2.4%SAP SE 179,680 15,703,159
Argentina | 1.7%YPF SA Sponsored ADR 1,062,434 $ 17,530,161
Brazil | 10.7%Ambev SA ADR 2,924,400 14,358,804Banco do Brasil SA 3,365,266 28,833,360BB Seguridade Participacoes SA 2,171,800 18,799,890CCR SA 3,366,500 16,404,609Cielo SA 2,703,554 23,073,368Localiza Rent a Car SA 781,115 8,179,747Natura Cosmeticos SA 702,000 4,939,132 114,588,910China | 15.5%AAC Technologies Holdings, Inc. 1,126,500 10,134,644Baidu, Inc. Sponsored ADR (a) 169,700 27,900,377China Construction Bank Corp.,Class H 58,680,390 44,955,861
China Mobile, Ltd. Sponsored ADR 519,049 27,213,739China Shenhua Energy Co., Ltd.,Class H 4,516,829 8,424,110
CNOOC, Ltd. 5,989,000 7,394,064NetEase, Inc. ADR 134,800 29,027,832Weichai Power Co., Ltd., Class H 7,060,932 10,828,568 165,879,195Egypt | 0.9%Commercial International Bank EgyptSAE GDR (Egypt) 144,531 527,539
Commercial International Bank EgyptSAE GDR (London) 2,358,760 8,606,898
9,134,437Hong Kong | 0.4%Huabao International Holdings, Ltd. (a) 9,268,000 3,922,380
Hungary | 1.8%OTP Bank Nyrt. 682,606 19,484,058
India | 9.6%Axis Bank, Ltd. 2,743,029 18,139,780Bajaj Auto, Ltd. 231,398 8,956,496Bharat Heavy Electricals, Ltd. 2,506,622 4,453,323HCL Technologies, Ltd. 1,086,435 13,198,683Hero MotoCorp, Ltd. 346,621 15,428,805Oil and Natural Gas Corp., Ltd. 110,435 310,176
Punjab National Bank (a) 5,875,030 $ 9,884,741Tata Consultancy Services, Ltd. 933,069 32,448,190 102,820,194Indonesia | 5.8%PT Astra International Tbk 22,998,900 14,064,928PT Bank Mandiri (Persero) Tbk 21,675,029 18,534,181PT Semen Indonesia (Persero) Tbk 9,480,300 6,428,773PT Telekomunikasi Indonesia (Persero)Tbk Sponsored ADR 791,800 23,088,888 62,116,770Malaysia | 0.6%British American Tobacco MalaysiaBerhad 680,400 6,763,165
Mexico | 3.3%America Movil SAB de CV, Class LSponsored ADR 1,400,927 17,609,652
Grupo Mexico SAB de CV, Series B 3,561,197 9,670,196Kimberly-Clark de Mexico SAB de CV,Series A 4,309,662 7,760,849
35,040,697Pakistan | 2.4%Habib Bank, Ltd. 4,359,600 11,366,356Oil & Gas Development Co., Ltd. 3,279,300 5,199,456Pakistan Petroleum, Ltd. 5,144,402 9,315,307 25,881,119Philippines | 0.8%PLDT, Inc. Sponsored ADR 306,900 8,455,095
49,800,754Thailand | 1.3%Kasikornbank Public Co. Ltd. 1,131,036 5,587,348The Siam Cement Public Co. Ltd. 551,650 7,654,809 13,242,157
Turkey | 4.5%Akbank TAS 4,823,787 $ 10,686,938KOC Holding AS 2,217,366 8,670,288Tupras-Turkiye Petrol Rafinerileri AS 397,659 7,973,222Turk Telekomunikasyon AS 2,877,086 4,303,167Turkcell Iletisim Hizmetleri AS (a) 2,738,913 7,568,153Turkiye Is Bankasi AS, C Shares 6,153,624 9,042,573 48,244,341Total Common Stocks
(Cost $1,041,144,809) 1,025,175,823
Short-Term Investment | 3.8%State Street Institutional TreasuryMoney Market Fund, Premier Class,0.40% (7 day yield) (Cost $40,344,509) 40,344,509 40,344,509
Total Investments | 99.8%(Cost $1,081,489,318) (b) $1,065,520,332
Cash and Other Assets in Excess
of Liabilities | 0.2% 1,934,413
Net Assets | 100.0% $1,067,454,745
The accompanying notes are an integral part of these financial statements.
FairDescription Shares Value
FairDescription Shares Value
Annual Report 25
The accompanying notes are an integral part of these financial statements.
Lazard Retirement Global Dynamic Multi Asset Portfolio
Telenet Group Holding NV (a) 2,314 128,389 1,710,516Canada | 3.2%Alimentation Couche-Tard, Inc., Class B 3,397 154,031Atco, Ltd., Class I 6,505 216,373BCE, Inc. 8,605 371,912Canadian Imperial Bank of Commerce 16,892 1,378,384Canadian National Railway Co. 16,483 1,110,773CI Financial Corp. 13,959 300,150Colliers International Group, Inc. 2,672 98,490Constellation Software, Inc. 244 110,877Corus Entertainment, Inc., B Shares 8,774 82,339Dollarama, Inc. 2,144 157,097Enbridge, Inc. 24,121 1,015,035First Quantum Minerals, Ltd. 13,857 137,781Genworth MI Canada, Inc. 15,662 392,644Intact Financial Corp. 1,327 94,980Inter Pipeline, Ltd. 5,450 120,313Linamar Corp. 6,205 266,612
Magna International, Inc. 11,280 $ 489,796Metro, Inc. 11,357 339,699Pembina Pipeline Corp. 6,412 200,385Quebecor, Inc., Class B 4,924 136,866Saputo, Inc. 6,720 237,789The Toronto-Dominion Bank 36,472 1,798,813Transcontinental, Inc., Class A 6,186 102,236 9,313,375Denmark | 0.7%Carlsberg A/S, Class B Sponsored ADR 44,495 767,984Danske Bank A/S 3,768 114,280Jyske Bank A/S 5,837 277,759Novo Nordisk A/S Sponsored ADR 15,205 545,251Novo Nordisk A/S, Class B 3,109 111,674Vestas Wind Systems A/S 4,175 271,338 2,088,286Finland | 0.6%Neste Oyj 4,641 178,161Orion Oyj, Class B 4,433 197,302Sampo Oyj, A Shares ADR 60,930 1,364,223UPM-Kymmene Oyj 5,090 124,740 1,864,426France | 1.2%Airbus Group SE 6,136 404,968AXA SA 31,136 785,683BNP Paribas SA 16,052 1,022,535CNP Assurances 9,198 170,368Faurecia 10,374 402,052Orange SA 14,912 226,301Peugeot SA (a) 10,639 173,439Technip SA 1,774 125,888TOTAL SA 2,877 146,864Valeo SA 3,073 176,573 3,634,671Germany | 1.8%Allianz SE 4,792 792,133Bayer AG 8,635 900,855Continental AG Sponsored ADR 26,330 1,013,705Deutsche Lufthansa AG 14,498 187,334Infineon Technologies AG 28,764 498,533MTU Aero Engines AG 3,000 346,111Muenchener Rueckversicherungs AG 1,413 267,244ProSiebenSat.1 Media SE 3,018 116,669Rheinmetall AG 3,542 237,989Symrise AG ADR 67,260 1,021,007 5,381,580
FairDescription Shares Value
FairDescription Shares Value
26 Annual Report
The accompanying notes are an integral part of these financial statements.
Lazard Retirement Global Dynamic Multi Asset Portfolio (continued)
Norway | 0.4%Aker BP ASA 41,348 739,179DNB ASA 7,631 113,486Leroy Seafood Group ASA 2,177 121,191Telenor ASA 7,725 115,177 1,089,033Portugal | 0.3%EDP-Energias de Portugal SA 31,395 95,608Galp Energia SGPS SA 48,367 718,979Jeronimo Martins SGPS SA 5,527 85,733 900,320Singapore | 0.3%BOC Aviation, Ltd. 62,500 306,298CapitaLand Commercial Trust REIT 138,900 141,168SATS, Ltd. 32,500 108,582Singapore Airlines, Ltd. 38,000 253,098 809,146South Africa | 0.0%Mediclinic International PLC 6,854 64,772
Spain | 0.8%Banco Santander SA 306,673 1,600,905CaixaBank SA 179,626 593,381Corporacion Financiera Alba SA 968 43,677 2,237,963Sweden | 0.7%Assa Abloy AB ADR 130,165 1,204,026Axfood AB 7,764 121,911Electrolux AB, Series B 19,946 495,234Mycronic AB 16,109 172,928Nobina AB 25,705 143,148 2,137,247
Switzerland | 1.7%Actelion, Ltd. 810 $ 175,396Actelion, Ltd. ADR 13,325 725,546Partners Group Holding AG 3,847 1,802,986Roche Holding AG 9,464 2,161,766Swiss Life Holding AG 430 121,699 4,987,393United Kingdom | 5.7%Admiral Group PLC 9,321 209,014Ashtead Group PLC ADR 10,955 869,827Bellway PLC 4,109 125,026British American Tobacco PLCSponsored ADR 10,990 1,238,243
BT Group PLC 207,318 938,807Centrica PLC 293,335 845,117Cineworld Group PLC 7,134 49,556Compass Group PLC 19,592 361,126Compass Group PLC Sponsored ADR 52,385 978,552CVS Group PLC 8,753 118,618Diageo PLC Sponsored ADR 9,765 1,014,974GlaxoSmithKline PLC 43,799 836,437Halma PLC 7,458 82,201Hargreaves Lansdown PLC 15,468 230,896International Consolidated AirlinesGroup SA 45,126 243,506
International Consolidated AirlinesGroup SA Sponsored ADR 6,155 66,400
The accompanying notes are an integral part of these financial statements.
FairDescription Shares Value
FairDescription Shares Value
28 Annual Report
The accompanying notes are an integral part of these financial statements.
Lazard Retirement Global Dynamic Multi Asset Portfolio (continued)
United States | 43.8%3M Co. 15,998 $ 2,856,763AbbVie, Inc. 6,058 379,352Accenture PLC, Class A 22,494 2,634,722Adobe Systems, Inc. (a) 3,259 335,514Aetna, Inc. 1,528 189,487Akamai Technologies, Inc. (a) 1,759 117,290Alaska Air Group, Inc. 1,522 135,047Alphabet, Inc., Class A (a) 2,450 1,941,503Alphabet, Inc., Class C (a) 1,675 1,292,799Amdocs, Ltd. 2,349 136,829American Electric Power Co., Inc. 10,824 681,479American Express Co. 3,369 249,576Amgen, Inc. 22,368 3,270,425Aon PLC 12,233 1,364,347Apple, Inc. 29,796 3,450,973Applied Materials, Inc. 37,340 1,204,962ARRIS International PLC (a) 8,112 244,415AT&T, Inc. 51,675 2,197,738Automatic Data Processing, Inc. 2,907 298,781AutoZone, Inc. (a) 1,220 963,544Baker Hughes, Inc. 15,000 974,550Bank of America Corp. 72,861 1,610,228Baxter International, Inc. 16,294 722,476C.R. Bard, Inc. 1,361 305,762Cardinal Health, Inc. 1,747 125,732Carnival Corp. 12,401 645,596Carnival PLC 2,252 114,096Carrizo Oil & Gas, Inc. (a) 4,821 180,064CBOE Holdings, Inc. 4,460 329,549Church & Dwight Co., Inc. 3,000 132,570Cirrus Logic, Inc. (a) 1,908 107,878Cisco Systems, Inc. 44,000 1,329,680Citigroup, Inc. 19,543 1,161,440Citrix Systems, Inc. (a) 1,386 123,784Colgate-Palmolive Co. 1,680 109,939Comcast Corp., Class A 12,041 831,431Comerica, Inc. 10,415 709,366CVS Health Corp. 6,225 491,215Darden Restaurants, Inc. 5,801 421,849Dick’s Sporting Goods, Inc. 2,836 150,592Dr Pepper Snapple Group, Inc. 3,109 281,893DTE Energy Co. 1,512 148,947Eaton Corp. PLC 11,630 780,257
eBay, Inc. (a) 12,120 $359,843EOG Resources, Inc. 7,910 799,701Everest Re Group, Ltd. 2,902 627,993Exelon Corp. 7,507 266,423F5 Networks, Inc. (a) 1,401 202,753Facebook, Inc., Class A (a) 8,637 993,687FactSet Research Systems, Inc. 2,303 376,379FedEx Corp. 5,515 1,026,893Fidelity National Information Services, Inc. 11,025 833,931Fifth Third Bancorp 5,744 154,916Fiserv, Inc. (a) 2,314 245,932Foot Locker, Inc. 11,258 798,080General Mills, Inc. 8,543 527,701General Motors Co. 22,504 784,039Genpact, Ltd. (a) 4,309 104,881GoDaddy, Inc., Class A (a) 3,206 112,050Great Plains Energy, Inc. 72,452 1,981,562Harman International Industries, Inc. 1,577 175,299Hasbro, Inc. 3,276 254,840HCA Holdings, Inc. (a) 5,788 428,428Honeywell International, Inc. 10,740 1,244,229HP, Inc. 19,507 289,484Humana, Inc. 3,962 808,367IDEXX Laboratories, Inc. (a) 1,791 210,031Intel Corp. 20,894 757,825Intercontinental Exchange, Inc. 22,005 1,241,522International Game Technology PLC 5,518 140,819Intuit, Inc. 3,601 412,711Iron Mountain, Inc. REIT 2,586 83,993J.B. Hunt Transport Services, Inc. 2,876 279,173Johnson & Johnson 30,425 3,505,264Johnson Controls International PLC 24,186 996,221Jones Lang LaSalle, Inc. 1,756 177,426JPMorgan Chase & Co. 29,713 2,563,935Juniper Networks, Inc. 9,040 255,470KB Home 6,268 99,097Kellogg Co. 7,305 538,452Kimberly-Clark Corp. 3,473 396,339Las Vegas Sands Corp. 6,299 336,430Lear Corp. 988 130,782Legg Mason, Inc. 5,751 172,012Lowe’s Cos., Inc. 19,017 1,352,489Manitowoc Foodservice, Inc. (a) 34,010 657,413Marathon Petroleum Corp. 8,555 430,744Marsh & McLennan Cos., Inc. 4,993 337,477MasterCard, Inc., Class A 2,949 304,484
FairDescription Shares Value
FairDescription Shares Value
Annual Report 29
The accompanying notes are an integral part of these financial statements.
Lazard Retirement Global Dynamic Multi Asset Portfolio (continued)
Mead Johnson Nutrition Co. 6,685 $ 473,031MetLife, Inc. 13,724 739,586Mettler-Toledo International, Inc. (a) 1,388 580,961Microsoft Corp. 71,561 4,446,801MKS Instruments, Inc. 2,353 139,768Mohawk Industries, Inc. (a) 3,318 662,538Molson Coors Brewing Co., Class B 10,871 1,057,857Monsanto Co. 6,091 640,834Motorola Solutions, Inc. 1,307 108,337MSCI, Inc. 2,273 179,067NIKE, Inc., Class B 5,154 261,978Nordstrom, Inc. 2,967 142,208Northrop Grumman Corp. 1,741 404,922NVIDIA Corp. 4,472 477,341O’Reilly Automotive, Inc. (a) 1,191 331,586Omnicom Group, Inc. 4,509 383,761Paychex, Inc. 5,181 315,419PayPal Holdings, Inc. (a) 2,472 97,570PepsiCo, Inc. 30,003 3,139,214Phillips 66 997 86,151Pinnacle West Capital Corp. 2,145 167,374Piper Jaffray Cos., Inc. (a) 6,113 443,193Pool Corp. 4,265 445,010Primerica, Inc. 1,349 93,283Prudential Financial, Inc. 15,486 1,611,473Public Service Enterprise Group, Inc. 11,160 489,701Quest Diagnostics, Inc. 9,840 904,296Quintiles IMS Holdings, Inc. (a) 14,240 1,082,952Regions Financial Corp. 128,092 1,839,401Republic Services, Inc. 6,178 352,455Reynolds American, Inc. 12,785 716,471Rice Energy, Inc. (a) 7,815 166,850Rockwell Automation, Inc. 9,180 1,233,792Rockwell Collins, Inc. 3,069 284,680Ross Stores, Inc. 19,476 1,277,626S&P Global, Inc. 11,653 1,253,164Sanderson Farms, Inc. 1,187 111,863Schlumberger, Ltd. 22,830 1,916,579Skyworks Solutions, Inc. 10,101 754,141Snap-on, Inc. 4,870 834,085Southwestern Energy Co. (a) 7,436 80,458Spirit AeroSystems Holdings, Inc., Class A 3,212 187,420
St. Jude Medical, Inc. 2,055 $ 164,790Starbucks Corp. 12,454 691,446Sysco Corp. 41,973 2,324,045Tallgrass Energy GP LP 6,538 175,218Teradata Corp. (a) 3,561 96,752Tesoro Corp. 2,769 242,149Texas Instruments, Inc. 16,941 1,236,185The Boeing Co. 7,752 1,206,831The Charles Schwab Corp. 24,995 986,553The Clorox Co. 1,171 140,543The Coca-Cola Co. 24,410 1,012,039The Dow Chemical Co. 24,086 1,378,201The Estee Lauder Cos., Inc., Class A 4,363 333,726The Gap, Inc. 8,974 201,377The Interpublic Group of Cos., Inc. 27,556 645,086The Kroger Co. 40,965 1,413,702The Procter & Gamble Co. 12,293 1,033,595The Sherwin-Williams Co. 4,299 1,155,313The Southern Co. 12,974 638,191The TJX Cos., Inc. 9,642 724,403The Walt Disney Co. 1,697 176,861Thermo Fisher Scientific, Inc. 6,700 945,370Time Warner, Inc. 16,771 1,618,905Tyson Foods, Inc., Class A 6,799 419,362Ubiquiti Networks, Inc. (a) 2,471 142,824United Rentals, Inc. (a) 2,684 283,377United Technologies Corp. 14,025 1,537,421UnitedHealth Group, Inc. 13,398 2,144,216Unum Group 5,749 252,554Vantiv, Inc., Class A (a) 17,130 1,021,291Verizon Communications, Inc. 57,343 3,060,969Visa, Inc., Class A 17,454 1,361,761VMware, Inc., Class A (a) 3,015 237,371Wal-Mart Stores, Inc. 4,683 323,689Waste Management, Inc. 5,032 356,819Waters Corp. (a) 1,706 229,269WellCare Health Plans, Inc. (a) 5,111 700,616Wyndham Worldwide Corp. 1,477 112,798Xcel Energy, Inc. 13,208 537,566Zoetis, Inc. 33,010 1,767,025 128,457,366Total Common Stocks
(Cost $209,219,628) 219,772,219
FairDescription Shares Value
FairDescription Shares Value
30 Annual Report
Lazard Retirement Global Dynamic Multi Asset Portfolio (continued)
Oslo Kommune: 3.550%, 02/12/21 NOK 3,000 367,8783.600%, 12/06/22 NOK 2,000 249,5792.450%, 05/24/23 NOK 3,000 350,2203.650%, 11/08/23 NOK 3,000 375,6992.350%, 09/04/24 NOK 4,000 462,934
2,391,686Panama | 0.3%Republic of Panama,4.000%, 09/22/24 USD 880 894,300
Poland | 0.7%Poland Government Bond,1.790%, 01/25/21 (e) PLN 9,015 2,118,454
Romania | 0.2%Romanian Government Bond,2.875%, 10/28/24 EUR 430 480,930
Singapore | 0.9%Singapore Government Bond,3.000%, 09/01/24 SGD 3,675 2,644,305
Currency Currency Settlement Unrealized Unrealized Purchased Quantity Sold Quantity Counterparty Date Appreciation Depreciation
36 Annual Report
The accompanying notes are an integral part of these financial statements.
(a) Non-income producing security.
(b) For federal income tax purposes, the aggregate cost, aggregate gross unrealized appreciation, aggregate gross unrealized depreciation and the netunrealized appreciation (depreciation) were as follows:
(c) Security valued using Level 2 inputs, based on reference to a similar security which was trading on an active market, under GAAP hierarchy — seeNote 8 in the Notes to Financial Statements.
(d) Pursuant to Rule 144A under the Securities Act of 1933, these securities may only be traded among “qualified institutional buyers.” At December31, 2016, the percentage of net assets for each Portfolio was as follows:
Emerging Markets Equity 0.4%Global Dynamic Multi Asset 0.6
(e) Variable and floating rate securities are securities which interest rate changes are based on changes in a designated base rate. The rates shownare those in effect on December 31, 2016.
(f) The Portfolio, at all times, maintains portfolio securities in sufficient amount to cover its obligations related to investments in forward currencycontracts.
Security Abbreviations:
ADR — American Depositary ReceiptGDR — Global Depositary ReceiptPJSC — Public Joint Stock CompanyREIT — Real Estate Investment Trust
Currency Abbreviations:
AUD — Australian Dollar JPY — Japanese YenCAD — Canadian Dollar KRW — South Korean WonCHF — Swiss Franc MXN — Mexican New PesoCZK — Czech Koruna NOK — Norwegian KroneDKK — Danish Krone NZD — New Zealand DollarEUR — Euro PLN — Polish ZlotyGBP — British Pound Sterling SEK — Swedish KroneHKD — Hong Kong Dollar SGD — Singapore DollarHUF — Hungarian Forint USD — United States Dollar
Counterparty Abbreviations:
CIT — Citibank NAHSB — HSBC Bank USA NAJPM — JPMorgan Chase Bank NASSB — State Street Bank and Trust Co.
Aggregate Gross Aggregate Gross Net Unrealized Aggregate Unrealized Unrealized Appreciation
* Industry classifications may be different than those used for compliance monitoring purposes.
Lazard Lazard Lazard Retirement Retirement Retirement Global International Emerging Dynamic Equity Markets Equity Multi Asset
Industry* Portfolio Portfolio Portfolio
[This page intentionally left blank]
Annual Report 39
ASSETS
Investments in securities, at fair value $10,468,044 $65,459,711 Foreign currency, at fair value — — 5 Receivables for:Investments sold — 17,287 Dividends and interest 5,600 64,909 Capital stock sold 7,978 72,820 Amount due from Investment Manager (Note 3) 2,887 — — — —Amount due from custodian (Note 3) — 6,776 Gross unrealized appreciation on forward currency contracts — — — — 1Total assets 10,484,509 65,621,503
LIABILITIES
Due to custodian — — — — 4Payables for:Management fees — 54,729 Accrued distribution fees 2,213 13,901 Accrued custodian fees 7,420 7,183 Accrued administration fees 6,505 13,710 Accrued shareholders’ reports 2,392 4,075 Accrued professional services 23,896 24,499 Investments purchased — — 4 Capital stock redeemed 2,142 23,157 Gross unrealized depreciation on forward currency contracts — — — — 2Other accrued expenses and payables 2,148 2,165 Total liabilities 46,716 143,419 Net assets $ 10,437,793 $65,478,084 $ 1
NET ASSETS
Paid in capital $ 9,647,767 $54,715,982 $6 Undistributed (distributions in excess of) net investment income (loss) 80,766 230,470 Accumulated net realized gain (loss) (521,923) 2,311,396 Net unrealized appreciation (depreciation) on:Investments 1,231,183 8,220,236 Foreign currency translations and forward currency contracts — — ( Net assets $ 10,437,793 $65,478,084
Service Shares
Net assets $ 10,437,793 $65,478,084 Shares of capital stock outstanding* 906,860 8,090,372 Net asset value, offering and redemption price per share $ 11.51 $ 8.09 Investor Shares
Net assets — — — $ Shares of capital stock outstanding* — — — 1 Net asset value, offering and redemption price per share — — — $ Cost of investments in securities $ 9,236,861 $ 57,239,475 Cost of foreign currency — — $
* $0.001 par value, 2,450,000,000 shares authorized for the Portfolios in total.
The accompanying notes are an integral part of these financial statements.
Lazard Lazard L L L Retirement Retirement R R R US Strategic US Small-Mid Cap I E G December 31, 2016 Equity Portfolio Equity Portfolio E E M
40 Annual Report
Lazard Retirement Series, Inc. Statements of Assets and Liabilities
Management fees (Note 3) 72,302 431,117 Distribution fees (Service Shares) 25,796 143,724 Custodian fees 44,811 56,318 Administration fees 44,620 54,094 Professional services 36,744 42,075 Shareholders’ reports 9,990 9,247 Directors’ fees and expenses 5,389 7,076 Shareholders’ services 13,627 13,342 Registration fees 61 204 Other 2,768 4,113 Total gross expenses 256,108 761,310 Management fees waived and expenses reimbursed (134,070) (36,003) Administration fees waived (18,750) — — — —Reimbursement of custodian fees (Note 3) — (6,776) Total net expenses 103,288 718,531 Net investment income (loss) 88,366 263,186
Net Realized and Unrealized Gain (Loss) on Investments,
Foreign Currency Transactions and Forward Currency Contracts
Net realized gain (loss) on:Investments (517,325) 2,528,724 Foreign currency transactions and forward currency contracts — — ( Total net realized gain (loss) on investments, foreign currency transactions and forward currency contracts (517,325) 2,528,724 Net change in unrealized appreciation (depreciation) on:Investments** 1,326,163 5,915,148 Foreign currency translations and forward currency contracts — — ( Total net change in unrealized appreciation (depreciation) on investments, foreign currency translations and forward currency contracts 1,326,163 5,915,148 Net realized and unrealized gain (loss) on investments, foreign currency transactions and forward currency contracts 808,838 8,443,872 Net increase (decrease) in net assets resulting from operations $ 897,204 $8,707,058
* Net of foreign withholding taxes of $ — $ 1,281
** Includes net change in unrealized appreciation (depreciation) foreign capital gains taxes of $ — $ — $
The accompanying notes are an integral part of these financial statements.
Lazard Lazard L L L Retirement Retirement R R R US Strategic US Small-Mid Cap I E G For the Year Ended December 31, 2016 Equity Portfolio Equity Portfolio E E M
42 Annual Report
Lazard Retirement Series, Inc. Statements of Operations
L L Lazard Lazard Lazard R R Retirement Retirement Retirement U U International Emerging Markets Global Dynamic E E Equity Portfolio Equity Portfolio Multi Asset Portfolio
Increase (Decrease) in Net AssetsOperationsNet investment income (loss) $ 88,366 $ 66,770 $ 263,186 $ (139,450) $ 1 $ 1 $ $ Net realized gain (loss) on investments, foreign currency transactions and forward currency contracts (517,325) 927,106 2,528,724 5,414,421 Net change in unrealized appreciation (depreciation) on investments, foreign currency translations and forward currency contracts 1,326,163 (1,620,763) 5,915,148 (6,818,250) Net increase (decrease) in net assets resulting from operations 897,204 (626,887) 8,707,058 (1,543,279)
Distributions to shareholdersFrom net investment income Service Shares (10,679) (52,360) — — ( Investor Shares — — — — — — ( From net realized gains Service Shares (105,677) (792,085) (3,171,705) (4,465,229) ( Investor Shares — — — — — — — ( Net decrease in net assets resulting from distributions (116,356) (844,445) (3,171,705) (4,465,229) (
Capital stock transactionsNet proceeds from sales Service Shares 1,106,595 5,026,315 12,126,952 14,432,469 7 Investor Shares — — — — — — 3 Net proceeds from reinvestment of distributions Service Shares 116,356 844,445 3,171,705 4,465,229 5 Investor Shares — — — — — — 2 Cost of shares redeemed Service Shares (3,094,973) (5,261,809) (14,855,237) (16,880,480) Investor Shares — — — — — — ( Net increase (decrease) in net assets from capital stock transactions (1,872,022) 608,951 443,420 2,017,218 Total increase (decrease) in net assets (1,091,174) (862,381) 5,978,773 (3,991,290) Net assets at beginning of period 11,528,967 12,391,348 59,499,311 63,490,601 1Net assets at end of period* $ 10,437,793 $11,528,967 $65,478,084 $ 59,499,311 $
*Includes undistributed (distributions in excess of) net investment income (loss) of $ 80,766 $ 10,671 $ 230,470 $ — $ $ $ $ ( $
Shares issued and redeemedService SharesShares outstanding at beginning of period 1,083,612 1,020,099 8,047,591 7,764,268 Shares sold 103,039 420,624 1,607,794 1,725,627 Shares issued to shareholders from reinvestment of distributions 10,370 80,270 430,938 605,900 Shares redeemed (290,161) (437,381) (1,995,951) (2,048,204) Net increase (decrease) (176,752) 63,513 42,781 283,323 Shares outstanding at end of period 906,860 1,083,612 8,090,372 8,047,591
Investor SharesShares outstanding at beginning of period Shares sold Shares issued to shareholders from reinvestment of distributions 1 Shares redeemed Net increase (decrease) Shares outstanding at end of period
The accompanying notes are an integral part of these financial statements.
Lazard Retirement US Strategic Equity Portfolio Lazard Retirement US Small-Mid Cap Equity Portfolio ________________________________________________ ________________________________________________ _ _ _ Year Ended Year Ended Year Ended Year Ended
December 31, December 31, December 31, December 31,
2016 2015 2016 2015
44 Annual Report
Lazard Retirement Series, Inc. Statements of Changes in Net Assets
Lazard Retirement International Equity Portfolio Lazard Retirement Emerging Markets Equity Portfolio Lazard Retirement Global Dynamic Multi Asset Portfolio _ _ ________________________________________________ ________________________________________________ ________________________________________________ Year Ended Year Ended Year Ended Year Ended Year Ended Year Ended
December 31, December 31, December 31, December 31, December 31, December 31,
2016 2015 2016 2015 2016 2015
The accompanying notes are an integral part of these financial statements.
LAZARD RETIREMENT US STRATEGIC EQUITY PORTFOLIO
Service SharesNet asset value, beginning of period $ 10.64 $ 12.15 $ 12.02 $10.44 $ 9.26Income (loss) from investment operations:Net investment income (loss) 0.10 0.06 0.09 0.11 0.12Net realized and unrealized gain (loss) 0.90 (0.73) 1.68 2.80 1.18Total from investment operations 1.00 (0.67) 1.77 2.91 1.30
Net asset value, end of period $ 11.51 $ 10.64 $ 12.15 $12.02 $10.44
Total Return (a) 9.42% -5.44% 14.71% 28.07% 14.01%
Ratios and Supplemental Data:Net assets, end of period (in thousands) $10,438 $11,529 $12,391 $8,944 $6,702Ratios to average net assets:Net expenses 1.00% 1.00% 1.00% 1.00% 1.00%Gross expenses 2.48% 2.31% 2.59% 2.88% 3.23%Net investment income (loss) 0.86% 0.53% 0.79% 0.97% 1.16%
Portfolio turnover rate 58% 86% 72% 66% 59%
(a) Total returns reflect reinvestment of all dividends and distributions, if any. Certain expenses of the Portfolio have been waived or reimbursed bythe Portfolio’s Investment Manager or State Street; without such waiver/reimbursement of expenses, the Portfolio’s returns would have beenlower. Performance information does not reflect the fees and charges imposed by participating insurance companies at the separate accountlevel, and such charges will have the effect of reducing performance.
Year EndedSelected data for a share of capital ______________________________________________________________________________________________________________________________
stock outstanding throughout each period 12/31/16 12/31/15 12/31/14 12/31/13 12/31/12
46 Annual Report
Lazard Retirement Series, Inc. Financial Highlights
The accompanying notes are an integral part of these financial statements.
LAZARD RETIREMENT US SMALL-MID CAP EQUITY PORTFOLIO
Service SharesNet asset value, beginning of period $ 7.39 $ 8.18 $ 8.71 $ 7.30 $ 9.26Income (loss) from investment operations:Net investment income (loss) 0.03^ (0.02) (0.02) (0.03) (0.01)Net realized and unrealized gain (loss) 1.09 (0.19) 0.94 2.53 0.95
Net asset value, end of period $ 8.09 $ 7.39 $ 8.18 $ 8.71 $ 7.30
Total Return (a) 15.78%^ -2.38% 11.03% 35.08% 10.38%
Ratios and Supplemental Data:Net assets, end of period (in thousands) $65,478 $59,499 $63,491 $58,923 $46,978Ratios to average net assets:Net expenses 1.25%^ 1.25% 1.25% 1.25% 1.20%Gross expenses 1.32% 1.35% 1.32% 1.35% 1.20%Net investment income (loss) 0.46%^ -0.22% -0.20% -0.33% -0.06%
Portfolio turnover rate 94% 89% 92% 101% 74%
^ Refer to Note 3 in the Notes to Financial Statements for discussion of prior period custodian out-of-pocket expenses that were reimbursed to thePortfolio in the current period. The amount of the reimbursement was on a per share basis at less than $0.005 per share. There was no impacton the total return of the Portfolio. The net expenses and net investment income (loss) ratios of the Portfolio would be unchanged as the changeto current period custodian fees was offset against current period expense waivers/reimbursements with no impact to net expenses or netinvestment income (loss).
(a) Total returns reflect reinvestment of all dividends and distributions, if any. Certain expenses of the Portfolio have been waived or reimbursed bythe Portfolio’s Investment Manager; without such waiver/reimbursement of expenses, the Portfolio’s returns would have been lower.Performance information does not reflect the fees and charges imposed by participating insurance companies at the separate account level, andsuch charges will have the effect of reducing performance.
Year EndedSelected data for a share of capital ______________________________________________________________________________________________________________________________
stock outstanding throughout each period 12/31/16 12/31/15 12/31/14 12/31/13 12/31/12
Annual Report 47
The accompanying notes are an integral part of these financial statements.
LAZARD RETIREMENT INTERNATIONAL EQUITY PORTFOLIO
Service SharesNet asset value, beginning of period $ 12.28 $ 12.50 $ 13.26 $ 11.12 $ 9.33Income (loss) from investment operations:Net investment income (loss) 0.19^ 0.19 0.21 0.17 0.19Net realized and unrealized gain (loss) (0.71) 0.02 (0.76) 2.13 1.78Total from investment operations (0.52) 0.21 (0.55) 2.30 1.97
Less distributions from:Net investment income (0.16) (0.21) (0.21) (0.16) (0.18)Net realized gains (0.03) (0.22) — — —
Total distributions (0.19) (0.43) (0.21) (0.16) (0.18)Net asset value, end of period $ 11.57 $ 12.28 $ 12.50 $ 13.26 $ 11.12
Total Return (a) -4.29%^ 1.75% -4.21% 20.76% 21.11%
Ratios and Supplemental Data:Net assets, end of period (in thousands) $653,014 $682,012 $690,324 $689,512 $592,437Ratios to average net assets:Net expenses 1.08%^ 1.11% 1.09% 1.10% 1.10%Gross expenses 1.09% 1.11% 1.09% 1.10% 1.10%Net investment income (loss) 1.59%^ 1.42% 1.59% 1.41% 1.80%
Portfolio turnover rate 28% 37% 34% 40% 43%
^ Refer to Note 3 in the Notes to Financial Statements for discussion of prior period custodian out-of-pocket expenses that were reimbursed to thePortfolio in the current period. The amount of the reimbursement was on a per share basis at less than $0.005 per share. There was no impacton the total return of the Portfolio. There was a 0.01% impact on the net expenses and net investment income (loss) ratios of the Portfolio.
(a) Total returns reflect reinvestment of all dividends and distributions, if any. Performance information does not reflect the fees and chargesimposed by participating insurance companies at the separate account level, and such charges will have the effect of reducing performance.
Year EndedSelected data for a share of capital ______________________________________________________________________________________________________________________________
stock outstanding throughout each period 12/31/16 12/31/15 12/31/14 12/31/13 12/31/12
48 Annual Report
The accompanying notes are an integral part of these financial statements.
Service SharesNet asset value, beginning of period $ 15.70 $ 19.96 $ 21.51 $ 22.22 $ 18.71Income (loss) from investment operations:Net investment income (loss) (a) 0.23^ 0.27 0.37 0.31 0.33Net realized and unrealized gain (loss) 3.04 (4.27) (1.35) (0.58) 3.78Total from investment operations 3.27 (4.00) (0.98) (0.27) 4.11
Less distributions from:Net investment income (0.19) (0.21) (0.37) (0.31) (0.35)Net realized gains — (0.05) (0.20) (0.13) (0.25)
Total distributions (0.19) (0.26) (0.57) (0.44) (0.60)Net asset value, end of period $ 18.78 $ 15.70 $ 19.96 $ 21.51 $ 22.22
Total Return (b) 20.84%^ -20.05% -4.64% -1.24% 22.05%
Ratios and Supplemental Data:Net assets, end of period (in thousands) $880,047 $754,835 $ 859,747 $846,233 $734,699Ratios to average net assets:Net expenses 1.37%^ 1.39% 1.38% 1.38% 1.39%Gross expenses 1.38% 1.39% 1.38% 1.38% 1.39%Net investment income (loss) 1.29%^ 1.43% 1.66% 1.42% 1.57%
Portfolio turnover rate 12% 9% 12% 14% 23%
Investor SharesNet asset value, beginning of period $ 15.51 $ 19.74 $ 21.28 $ 21.99 $ 18.52Income (loss) from investment operations:Net investment income (loss) (a) 0.26^ 0.32 0.42 0.37 0.38Net realized and unrealized gain (loss) 3.02 (4.25) (1.34) (0.59) 3.74Total from investment operations 3.28 (3.93) (0.92) (0.22) 4.12
Less distributions from:Net investment income (0.23) (0.25) (0.42) (0.36) (0.40)Net realized gains — (0.05) (0.20) (0.13) (0.25)
Total distributions (0.23) (0.30) (0.62) (0.49) (0.65)Net asset value, end of period $ 18.56 $ 15.51 $ 19.74 $ 21.28 $ 21.99
Total Return (b) 21.18%^ -19.90% -4.38% -1.01% 22.34%
Ratios and Supplemental Data:Net assets, end of period (in thousands) $ 187,408 $ 158,018 $229,855 $260,330 $282,596Ratios to average net assets:Net expenses 1.12%^ 1.15% 1.14% 1.14% 1.14%Gross expenses 1.14% 1.15% 1.14% 1.14% 1.14%Net investment income (loss) 1.52%^ 1.71% 1.91% 1.71% 1.85%
Portfolio turnover rate 12% 9% 12% 14% 23%
^ Refer to Note 3 in the Notes to Financial Statements for discussion of prior period custodian out-of-pocket expenses that were reimbursed to thePortfolio in the current period. The amount of the reimbursement was on a per share basis at less than $0.005 per share. There was a 0.06%impact on the total return of the Portfolio. There was a 0.02% impact on the net expenses and net investment income (loss) ratios of thePortfolio.
(a) Net investment income (loss) has been computed using the average shares method.(b) Total returns reflect reinvestment of all dividends and distributions, if any. Performance information does not reflect the fees and charges
imposed by participating insurance companies at the separate account level, and such charges will have the effect of reducing performance.
Year EndedSelected data for a share of capital ______________________________________________________________________________________________________________________________
stock outstanding throughout each period 12/31/16 12/31/15 12/31/14 12/31/13 12/31/12
Year EndedSelected data for a share of capital ______________________________________________________________________________________________________________________________
stock outstanding throughout each period 12/31/16 12/31/15 12/31/14 12/31/13 12/31/12
Annual Report 49
The accompanying notes are an integral part of these financial statements.
LAZARD RETIREMENT GLOBAL DYNAMIC MULTI ASSET PORTFOLIO
Service SharesNet asset value, beginning of period $ 11.51 $ 11.86 $ 12.30 $ 10.54 $ 10.00Income (loss) from investment operations:Net investment income (loss) 0.14 0.13 0.11 0.06 0.03Net realized and unrealized gain (loss) 0.24 (0.19) 0.23 1.99 0.54Total from investment operations 0.38 (0.06) 0.34 2.05 0.57
Net asset value, end of period $ 11.82 $ 11.51 $ 11.86 $ 12.30 $ 10.54
Total Return (b) 3.30% -0.44% 2.70% 19.49% 5.74%
Ratios and Supplemental Data:Net assets, end of period (in thousands) $293,286 $222,666 $176,669 $99,760 $30,262Ratios to average net assets (c):Net expenses 1.05% 1.05% 1.05% 1.05% 1.05%Gross expenses 1.25% 1.31% 1.33% 1.70% 3.80%Net investment income (loss) 1.23% 1.18% 1.19% 1.01% 1.03%
Portfolio turnover rate 105% 114% 105% 62% 45%* The Portfolio commenced operations on April 30, 2012.(a) Amount is less than $0.01 per share.(b) Total returns reflect reinvestment of all dividends and distributions, if any. Certain expenses of the Portfolio have been waived or reimbursed by
the Portfolio’s Investment Manager, State Street or BFDS; without such waiver/reimbursement of expenses, the Portfolio’s returns would havebeen lower. Performance information does not reflect the fees and charges imposed by participating insurance companies at the separateaccount level, and such charges will have the effect of reducing performance. Return for a period of less than one year is not annualized.
(c) Annualized for a period of less than one year.
Year Ended
For the PeriodSelected data for a share of capital ______________________________________________________________ 4/30/12* tostock outstanding throughout each period 12/31/16 12/31/15 12/31/14 12/31/13 12/31/12
50 Annual Report
Annual Report 51
1. OrganizationLazard Retirement Series, Inc. (the “Fund”) was incor-porated in Maryland on February 13, 1997 and is reg-istered under the Investment Company Act of 1940, asamended (the “1940 Act”), as an open-end manage-ment investment company. The Fund, comprised oftwenty-one no-load portfolios (each referred to as a“Portfolio”), is currently offered only to separateaccounts established by insurance companies to fundvariable annuity contracts and variable life insurancepolicies. Portfolio shares may also be offered to cer-tain qualified pension and retirement plans andaccounts permitting accumulation of assets on a tax-deferred basis. Effective January 31, 2006, the Funddesignated its existing class of shares as ServiceShares and commenced offering Investor Shares.Investor Shares and Service Shares are identical,except as to the services offered to and expensesborne by each class of shares. As of December 31,2016, only Lazard Retirement Emerging MarketsEquity Portfolio had issued Investor Shares. Currently,only the following five Portfolios, each of which is“diversified”, as defined in the 1940 Act, are offered:Lazard Retirement US Strategic Equity Portfolio (“USStrategic Equity Portfolio”), Lazard Retirement USSmall-Mid Cap Equity Portfolio (“US Small-Mid CapEquity Portfolio”), Lazard Retirement InternationalEquity Portfolio (“International Equity Portfolio”),Lazard Retirement Emerging Markets Equity Portfolio(“Emerging Markets Equity Portfolio”), and LazardRetirement Global Dynamic Multi Asset Portfolio(“Global Dynamic Multi Asset Portfolio”). Each of theother sixteen Portfolios had not commenced opera-tions as of December 31, 2016.
2. Significant Accounting PoliciesThe accompanying financial statements are presentedin conformity with GAAP. The Fund is an investmentcompany and therefore applies specialized accountingguidance in Accounting Standards Codification Topic946. The following is a summary of significantaccounting policies consistently followed by the Fundin the preparation of the financial statements:
(a) Valuation of Investments—Market values for securi-ties listed on the New York Stock Exchange (“NYSE”),NASDAQ national market or other US or foreign
exchanges or markets are generally based on the lastreported sales price on the exchange or market onwhich the security is principally traded on each valua-tion date; securities not traded on the valuation dateare valued at the most recent quoted bid price. TheFund values NASDAQ-traded securities at the NAS-DAQ Official Closing Price, which may not be the lastreported sales price in certain instances. Forward cur-rency contracts generally are valued using quotationsfrom an independent pricing service. Investments inmoney market funds are valued at the fund’s net assetvalue (“NAV”) per share.
Bonds and other fixed-income securities that are notexchange-traded are valued on the basis of pricesprovided by independent pricing services which arebased on, among other things, trading in securitieswith similar characteristics, brokers’ quotationsand/or a matrix system which considers such factorsas other security prices, yields and maturities.
Calculation of a Portfolio’s NAV may not take placecontemporaneously with the determination of theprices of portfolio assets used in such calculation.Trading on Europe, Latin and South America and FarEast securities exchanges and in over-the-countermarkets ordinarily is completed well before the closeof business on each business day in New York (i.e., aday on which the NYSE is open). In addition, Euro-pean or Far Eastern securities trading generally or in aparticular country or countries may not take place onall business days in New York and on which the netasset value of a Portfolio is calculated.
The Valuation Committee of the Investment Manager,which meets periodically under the direction of theBoard of Directors (the “Board”), may evaluate a vari-ety of factors to determine the fair value of securitiesfor which market quotations are determined not to bereadily available or reliable. These factors include, butare not limited to, the type of security, the value ofcomparable securities, observations from financialinstitutions and relevant news events. Input from theInvestment Manager’s portfolio managers/analystsalso will be considered.
If a significant event materially affecting the value ofsecurities occurs between the close of the exchange
Lazard Retirement Series, Inc. Notes to Financial Statements December 31, 2016
52 Annual Report
or market on which the security is principally tradedand the time when a Portfolio’s NAV is calculated, orwhen current market quotations otherwise are deter-mined not to be readily available or reliable (includingrestricted or other illiquid securities such as certainderivative instruments), such securities will be valuedat their fair value as determined by, or in accordancewith procedures approved by, the Board. The fairvalue of non-US securities may be determined withthe assistance of an independent pricing service usingcorrelations between the movement of prices of suchsecurities and indices of US securities and otherappropriate indicators, such as closing market pricesof relevant ADRs or futures contracts. Non-US securi-ties may trade on days when a Portfolio is not openfor business, thus affecting the value of the Portfolio’sassets on days when Portfolio shareholders may notbe able to buy or sell Portfolio shares.
The effect of using fair value pricing is that the NAV ofa Portfolio will reflect the affected securities’ values asdetermined in the judgment of the Board or itsdesignee instead of being determined by the market.Using a fair value pricing methodology to price secu-rities may result in a value that is different from themost recent closing price of a security and from theprices used by other investment companies to calcu-late their portfolios’ NAVs.
(b) Portfolio Securities Transactions and InvestmentIncome—Portfolio securities transactions areaccounted for on trade date. Realized gain (loss) onsales of investments are recorded on a specific identi-fication basis. Dividend income is recorded on the ex-dividend date except for certain dividends fromnon-US securities where the dividend rate is not avail-able. In such cases, the dividend is recorded as soonas the information is received by the Portfolio. Interestincome, if any, is accrued daily. The Portfolios amor-tize premiums and accrete discounts on fixed-incomesecurities using the effective yield method.
A Portfolio may be subject to taxes imposed by non-UScountries in which it invests. Such taxes are generallybased upon income earned or capital gains (realized orunrealized). An affected Portfolio accrues and appliessuch taxes to net investment income, net realized gainsand net unrealized gains concurrent with the recogni-
tion of income earned or capital gains (realized andunrealized) from the applicable portfolio securities.
As a result of several court cases in certain countriesacross the European Union, the International EquityPortfolio has filed tax reclaims for previously withheldtaxes on dividends earned in those countries. Thesefilings are subject to various administrative proceed-ings by the local jurisdictions’ tax authorities withinthe European Union, as well as a number of relatedjudicial proceedings. Uncertainty exists as to the ulti-mate resolution of these proceedings, the likelihoodof receipt of these claims, and the potential timing ofpayment, and accordingly no amounts are reflected inthe financial statements. Such amounts, if and whenrecorded, could result in an increase in the Interna-tional Equity Portfolio’s NAV per share.
(c) Foreign Currency Translation and Forward Cur-rency Contracts—The accounting records of the Fundare maintained in US dollars. Portfolio securities andother assets and liabilities denominated in a foreigncurrency are translated daily into US dollars at theprevailing rates of exchange. Purchases and sales ofsecurities, income receipts and expense payments aretranslated into US dollars at the prevailing exchangerates on the respective transaction dates.
The Portfolios do not isolate the portion of operationsresulting from changes in foreign exchange rates oninvestments from the fluctuations arising fromchanges in their market prices. Such fluctuations areincluded in net realized and unrealized gain (loss) oninvestments. Net realized gain (loss) on foreign cur-rency transactions and forward currency contracts rep-resents net foreign currency gain (loss) from forwardcurrency contracts, disposition of foreign currencies,currency gain (loss) realized between the trade andsettlement dates on securities transactions, and thedifference between the amount of dividends, interestand foreign withholding taxes recorded on the Portfo-lios’ accounting records and the US dollar equivalentamounts actually received or paid. Net change in unre-alized appreciation (depreciation) on foreign currencytranslations reflects the impact of changes in exchangerates on the value of assets and liabilities, other thaninvestments in securities, during the period.
Annual Report 53
A forward currency contract is an agreement betweentwo parties to buy or sell currency at a set price on afuture date. Upon entering into these contracts, risksmay arise from the potential inability of counterpar-ties to meet the terms of their contracts and fromunanticipated movements in the value of the foreigncurrency relative to the US dollar.
The US dollar value of forward currency contracts isdetermined using quotations provided by an inde-pendent pricing service. Daily fluctuations in the valueof such contracts are recorded as unrealized apprecia-tion (depreciation) on forward currency contracts.When the contract is closed, a Portfolio records a real-ized gain (loss) equal to the difference between thevalue at the time it was opened and the value at thetime it was closed.
During the year ended December 31, 2016, the GlobalDynamic Multi Asset Portfolio traded in forward cur-rency contracts.
(d) Federal Income Taxes—The Fund’s policy is to con-tinue to have each Portfolio qualify as a regulatedinvestment company under Subchapter M of the Inter-nal Revenue Code (the “Code”) and to distribute all ofits taxable income, including any net realized capitalgains, to shareholders. Therefore, no federal incometax provision is required.
At December 31, 2016, the following Portfolios hadunused realized capital loss carryovers which, for fed-eral income tax purposes, could be used to offsetfuture realized capital gains with no expiration date asfollows:
Under current tax law, post-October capital losses orcertain late-year ordinary losses, as defined by theCode, within the taxable year may be deferred andtreated as occurring on the first day of the followingtax year. For the tax year ended December 31, 2016,
the following Portfolio elected to defer such losses asfollows:
Global Dynamic Multi Asset $ — $(4,449,624)
Management has analyzed the Portfolios’ tax posi-tions, and has concluded that no liability for unrecog-nized tax benefits should be recorded related touncertain tax positions taken on returns filed for opentax years (2013-2015), or expected to be taken in thePortfolios’ 2016 tax returns.
(e) Dividends and Distributions—Dividends from netinvestment income, if any, will be declared and paidannually. During any particular year, net realized gainsfrom investment transactions in excess of availablecapital loss carryforwards would be taxable to thePortfolios, if not distributed. The Portfolios intend todeclare and distribute these amounts, at least annu-ally, to shareholders; however, to avoid taxation, asecond distribution may be required. Differences inper share distributions, by class, are generally due todifferences in class specific expenses.
Income and capital gains distributions are determinedin accordance with federal income tax regulationswhich may differ from GAAP. These book/tax differ-ences, which may result in distribution reclassifica-tions, are primarily due to differing treatments offoreign currency transactions, wash sales, passive for-eign investment companies and distributions fromreal estate investment trusts. The book/tax differencesrelating to shareholder distributions resulted inreclassifications among certain capital accounts asfollows:
US Strategic Equity $ — $ (7,592) $ 7,592US Small-Mid Cap Equity (1) (32,716) 32,717International Equity (3,266) 233,508 (230,242)Emerging Markets Equity (43,689) (77,521) 121,210Global Dynamic Multi Asset (509) (4,642,494) 4,643,003
Portfolio Short-Term Long-Term
Post-October Late-Year Capital Loss Ordinary Loss Portfolio Deferral Deferral
Undistributed (Distributions in Excess of) Accumulated Paid in Net Investment Net RealizedPortfolio Capital Income Gain (Loss)
54 Annual Report
The tax character of dividends and distributions paidduring the years ended December 31, were as follows:
(f) Allocation of Expenses—Expenses not directlychargeable to a specific Portfolio are allocated amongall Portfolios primarily on the basis of relative netassets. Portfolios accrue distribution and service (12b-1) fees to Service Shares. The Portfolios’ income,expenses (other than class specific expenses) andrealized and unrealized gains and losses are allocatedproportionally each day between the classes basedupon the relative net assets of each class.
(g) Estimates—The preparation of financial state-ments in conformity with GAAP requires manage-ment to make estimates and assumptions that affectthe reported amounts of assets and liabilities and dis-closure of contingent assets and liabilities at the dateof the financial statements and the reported amountsof increases and decreases in net assets resultingfrom operations during the reporting period. Actualresults could differ from those estimates.
(h) Net Asset Value—NAV per share for each class ofeach Portfolio is determined each day the NYSE isopen for trading as of the close of regular trading onthe NYSE (generally 4:00 p.m. Eastern time). The Fundwill not treat an intraday unscheduled disruption inNYSE trading as a closure of the NYSE, and will priceits shares as of 4:00 p.m., if the particular disruptiondirectly affects only the NYSE. NAV per share is deter-mined by dividing the value of the total assets of thePortfolio represented by such class, less all liabilities,by the total number of Portfolio shares of such classoutstanding.
3. Investment Management, Administration, Custody,Distribution and Transfer Agency AgreementsThe Fund, on behalf of the Portfolios, has entered intoa management agreement (the “Management Agree-ment”) with the Investment Manager. Pursuant to theManagement Agreement, the Investment Managerregularly provides each Portfolio with investmentresearch, advice and supervision and furnishes con-tinuously an investment program for each Portfolioconsistent with its investment objectives and policies,including the purchase, retention and disposition ofsecurities. For its services provided to the Portfolios,the Investment Manager earns a management fee,accrued daily as a percentage of its average daily netassets and payable by each Portfolio monthly, at theannual rate set forth below:
US Strategic Equity 0.70%US Small-Mid Cap Equity 0.75International Equity 0.75Emerging Markets Equity 1.00Global Dynamic Multi Asset (a) 0.80
(a) From January 1, 2016 to June 28, 2016, percentage was 0.85%.
The Investment Manager has voluntarily agreed toreduce its fees and, if necessary, reimburse the Portfo-lios through May 1, 2017 if annualized operatingexpenses, exclusive of taxes, brokerage, interest onborrowings, fees and expenses of “Acquired Funds”(as defined in Form N-1A) and extraordinary expenses,but including the management fee stated in the Man-agement Agreement between the Investment Managerand the Fund, on behalf of the Portfolios, exceed the
Undistributed Undistributed Net Unrealized Ordinary Income Long-Term Appreciation /Deferred Late Capital Gain (Depreciation) Year Ordinary /Deferred Capital Including Foreign Portfolio Losses Losses Currency
Ordinary Income Long-Term Capital Gain
Portfolio 2016 2015 2016 2015
Portfolio Annual Rate
Annual Report 55
following percentages of the value of the Portfolios’average daily net assets for the respective shares:
US Strategic Equity 1.00% N/AUS Small-Mid Cap Equity 1.25 N/AInternational Equity 1.10 N/AEmerging Markets Equity 1.55 1.30%Global Dynamic Multi Asset 1.05 N/A
During the year ended December 31, 2016, the Invest-ment Manager waived its management fees and reim-bursed the following Portfolios for other expenses asfollows:
US Strategic Equity $ 72,302 $61,768US Small-Mid Cap Equity 36,003 —Global Dynamic Multi Asset 502,423 —
The aforementioned waivers and/or reimbursementsare not subject to recoupment by the InvestmentManager.
The Fund has entered into an administration agree-ment with State Street to provide certain administra-tive services. Each Portfolio bears the cost of suchservices at a fixed annual rate of $42,500, plus 0.02% ofaverage daily net assets up to $1 billion and 0.01% ofaverage daily net assets over $1 billion. State Streethas agreed to waive up to $18,750 of the $42,500annual fee for the US Strategic Equity Portfolio untilthe Portfolio’s net assets reach $25 million. During theyear ended December 31, 2016, State Street waived$18,750 of its fee for the US Strategic Equity Portfolio.
State Street also serves as custodian for the Fund inaccordance with a custodian agreement to providecertain custody services.
In December 2015, State Street announced that it hadidentified inconsistencies in the way in which clientswere invoiced for out-of-pocket expenses from 1998until 2015. The dollar amount difference between whatwas charged and what should have been charged, plusinterest, will be paid back to the affected Portfoliosdirectly in February 2017 as a reimbursement. This
reimbursement was recognized as a change inaccounting estimate and reflected as “Reimbursementof custodian fees” in the Statements of Operations.Pursuant to the expense limitations described in Note 3,certain Portfolios have experienced management feewaivers during the year ended December 31, 2016.Accordingly, the reimbursement of out-of-pocketexpenses resulted in the reduction in the waiver ofmanagement fees for certain Portfolios for the yearended December 31, 2016.
The Fund has a distribution agreement with LazardAsset Management Securities LLC (the “Distributor”),a wholly-owned subsidiary of the Investment Man-ager, to serve as the distributor for shares of eachPortfolio. The Distributor bears the cost of printingand mailing prospectuses to potential investors andcertain expenses in connection with the offering ofPortfolio shares.
Under a distribution and servicing plan adopted pur-suant to Rule 12b-1 under the 1940 Act, each Portfoliopays a monthly fee to the Distributor, at an annualrate of 0.25% of the average daily net assets of itsService Shares, for distribution and servicing ofaccounts. The Distributor may make payments to par-ticipating insurance companies, certain financial insti-tutions, securities dealers and other industryprofessionals for providing these services.
BFDS is the Fund’s transfer and dividend disbursingagent. For its services, BFDS receives a monthly feecomputed on the basis of the number of shareholderaccounts it maintains, subject to a minimum feeamount per share class in each Portfolio, and is reim-bursed for certain out-of-pocket expenses. BFDS hasagreed to waive the monthly minimum fee for thefirst six months after a new Portfolio or share classhas commenced operations.
4. Directors’ CompensationCertain Directors of the Fund are officers of the Invest-ment Manager. For the year ended December 31, 2016,each Director who is not an affiliated person of theInvestment Manager or any of its affiliates was paid bythe Fund, The Lazard Funds, Inc., Lazard Global TotalReturn and Income Fund, Inc. and Lazard World Divi-
dend & Income Fund, Inc. (collectively with the Fund,the “Lazard Fund Complex”), each a registered man-agement investment company advised by the Invest-ment Manager: (1) an annual retainer of $190,000, (2)an additional annual fee of $20,000 to the lead Inde-pendent Director (an “Independent Director” is aDirector who is not an “interested person” (as definedin the 1940 Act) of the Fund), and (3) an additionalannual fee of $10,000 to the Audit Committee Chair.Effective January 1, 2017, the aggregate compensationfor Independent Directors for the Lazard Fund Com-plex is comprised of: (1) an annual retainer of$210,000, (2) an additional annual fee of $30,000 tothe lead Independent Director, and (3) an additionalannual fee of $20,000 to the Audit Committee Chair.The Independent Directors may be paid additionalcompensation for participation on ad hoc committeesor other work performed on behalf of the Board. TheIndependent Directors also are reimbursed for traveland other out-of-pocket expenses for attending Boardand committee meetings. The Directors do not receivebenefits from the Fund pursuant to any pension,retirement or similar arrangement. Independent Direc-tors’ fees are allocated among the portfolios in theLazard Fund Complex at a rate of $5,000 per portfoliowith the remainder allocated based upon each portfo-lio’s proportionate share of combined net assets. TheStatements of Operations show the IndependentDirectors’ fees and expenses paid by each Portfolio.
5. Securities Transactions and Transactions withAffiliatesPurchases and sales of portfolio securities (excluding short-term investments) for the year ended December 31, 2016 were as follows:
US Strategic Equity $ 5,785,543 $ 7,511,665US Small-Mid Cap Equity 52,614,173 55,064,456International Equity 194,055,808 180,169,385Emerging Markets Equity 117,048,069 150,049,315Global Dynamic Multi Asset 323,164,350 256,771,117
Global Dynamic Multi Asset $4,619,303 $2,928,476
For the year ended December 31, 2016, the Portfoliosdid not engage in any cross-trades in accordance withRule 17a-7 under the 1940 Act, and no brokerage com-missions were paid to affiliates of the InvestmentManager or other affiliates of the Fund for portfoliotransactions executed on behalf of the Fund.
6. Investment Risks(a) Non-US Securities Risk—A Portfolio’s performancewill be influenced by political, social and economicfactors affecting the non-US countries and companiesin which the Portfolio invests. Non-US securities carryspecial risks, such as less developed or less efficienttrading markets, political instability, a lack of companyinformation, differing auditing and legal standards,and, potentially, less liquidity.
(b) Emerging Market Risk—Emerging market countriescan generally have economic structures that are lessdiverse and mature, and political systems that are lessstable, than those of developed countries. Theeconomies of countries with emerging markets may bebased predominantly on only a few industries, may behighly vulnerable to changes in local or global tradeconditions, and may suffer from extreme debt burdensor volatile inflation rates. The securities markets ofemerging market countries have historically beenextremely volatile. These market conditions may con-tinue or worsen. Investments in these countries maybe subject to political, economic, legal, market and cur-rency risks. The risks may include less protection ofproperty rights and uncertain political and economicpolicies, the imposition of capital controls and/or for-eign investment limitations by a country, nationaliza-tion of businesses and the imposition of sanctions byother countries, such as the US. Significant devaluationof emerging market currencies against the US dollarmay occur subsequent to acquisition of investmentsdenominated in emerging market currencies.
(c) Foreign Currency Risk—Investments denominatedin currencies other than US dollars may experience adecline in value, in US dollar terms, due solely to fluc-tuations in currency exchange rates. The InvestmentManager does not intend to actively hedge the Portfo-lios’ foreign currency exposure.
Portfolio Purchases Sales
US Treasury Securities __________________________________
Portfolio Purchases Sales
Annual Report 57
(d) Fixed-Income and Debt Securities Risk—The mar-ket value of a debt security may decline due to gen-eral market conditions that are not specifically relatedto a particular company, such as real or perceivedadverse economic conditions, changes in the outlookfor corporate earnings, changes in interest or cur-rency rates or adverse investor sentiment generally.The debt securities market can be susceptible toincreases in volatility and decreases in liquidity. Liq-uidity can decline unpredictably in response to overalleconomic conditions or credit tightening.
Prices of bonds and other debt securities tend to moveinversely with changes in interest rates.Typically, a risein rates will adversely affect debt securities and,accordingly, will cause the value of a Portfolio’sinvestments in these securities to decline. Interest raterisk is usually greater for fixed-income securities withlonger maturities or durations. A rise in interest rates(or the expectation of a rise in interest rates) may resultin periods of volatility, decreased liquidity andincreased redemptions, and, as a result, the Portfoliomay have to liquidate portfolio securities at disadvan-tageous prices. Risks associated with rising interestrates are heightened given that interest rates in the USand other countries are at or near historic lows.
A Portfolio’s investments in lower-rated, higher-yield-ing securities (“junk bonds”) are subject to greatercredit risk than its higher rated investments. Credit riskis the risk that the issuer will not make interest or prin-cipal payments, or will not make payments on a timelybasis. Non-investment grade securities tend to bemore volatile, less liquid and are considered specula-tive. If there is a decline, or perceived decline, in thecredit quality of a debt security (or any guarantor ofpayment on such security), the security’s value couldfall, potentially lowering the Portfolio’s share price. Theprices of non-investment grade securities, unlikeinvestment grade debt securities, may fluctuate unpre-dictably and not necessarily inversely with changes ininterest rates. The prices of high yield securities canfall in response to negative news about the issuer orits industry, or the economy in general to a greaterextent than those of higher rated securities. The mar-ket for these securities may be less liquid and there-fore these securities may be harder to value or sell at
an acceptable price, especially during times of marketvolatility or decline.
Some fixed-income securities may give the issuer theoption to call, or redeem, the securities before theirmaturity. If securities held by a Portfolio are calledduring a time of declining interest rates (which is typi-cally the case when issuers exercise options to calloutstanding securities), the Portfolio may have toreinvest the proceeds in an investment offering alower yield (and the Portfolio may not fully benefitfrom any increase in the value of its portfolio holdingsas a result of declining interest rates).
(e) Derivatives Risk—Forward currency contracts,options, futures contracts and credit default swapagreements and other derivatives transactions, includ-ing those entered into for hedging purposes (i.e., seek-ing to protect Portfolio investments), may increasevolatility, reduce returns, limit gains or magnify losses,perhaps substantially, particularly since most deriva-tives have a leverage component that provides invest-ment exposure in excess of the amount invested.Forward currency contracts, swap agreements andother over-the-counter derivatives transactions aresubject to the risk of default by the counterparty andcan be illiquid. These derivatives transactions, as wellas the exchange-traded futures in which a Portfoliomay invest, are subject to many of the risks of, andcan be highly sensitive to changes in the value of, therelated currency, interest rate, security or other refer-ence asset. As such, a small investment could have apotentially large impact on the Portfolio’s perform-ance. In fact, many derivatives may be subject togreater risks than those associated with investingdirectly in the underlying or other reference asset.Derivatives transactions incur costs, either explicitly orimplicitly, which reduce returns, and costs of engagingin such transactions may outweigh any gains or anylosses averted from hedging activities. Successful useof derivatives, whether for hedging or for other invest-ment purposes, is subject to the Investment Manager’sability to predict correctly movements in the directionof the relevant reference asset or market and, forhedging activities, correlation of the derivative instru-ments used with the investments seeking to behedged. Use of derivatives transactions, even if
The following table summarizes the valuation of the Portfolios’ investments by each fair value hierarchy level asof December 31, 2016:
Unadjusted Quoted Prices in Active Markets Significant Other Significant for Identical Observable Unobservable Assets and Liabilities Inputs Inputs Balance as ofDescription (Level 1) (Level 2) (Level 3) December 31, 2016
58 Annual Report
entered into for hedging purposes, may cause a Port-folio to experience losses greater than if the Portfoliohad not engaged in such transactions.
7. Contractual ObligationsThe Fund enters into contracts in the normal courseof business that contain a variety of indemnifications.A Portfolio’s maximum exposure under these arrange-ments is unknown. Management has reviewed theFund’s existing contracts and expects the risk of lossto be remote.
8. Fair Value MeasurementsFair value is defined as the price that a Portfoliowould receive to sell an asset, or would pay to trans-fer a liability, in an orderly transaction between mar-ket participants at the date of measurement. The FairValue Measurements and Disclosures provisions ofGAAP also establish a framework for measuring fairvalue, and a three-level hierarchy for fair value meas-urement that is based upon the transparency ofinputs to the valuation of an asset or liability. Inputsmay be observable or unobservable and refer,broadly, to the assumptions that market participantswould use in pricing the asset or liability. Observableinputs reflect the assumptions that market partici-pants would use in pricing the asset or liability based
on market data obtained from sources independent ofthe Fund. Unobservable inputs reflect the Fund’s ownassumptions about the assumptions that market par-ticipants would use in pricing the asset or liability,developed based on the best information available inthe circumstances. Each investment’s fair value meas-urement level within the fair value hierarchy is basedon the lowest level of any input that is significant tothe overall fair value measurement. The three-levelhierarchy of inputs is summarized below:
• Level 1 – unadjusted quoted prices in active mar-kets for identical assets and liabilities
• Level 2 – other significant observable inputs (includ-ing unadjusted quoted prices for similar investments,interest rates, prepayment speeds, credit risk, etc.)
• Level 3 – significant unobservable inputs (includingthe Fund’s own assumptions in determining the fairvalue of investments)
Changes in valuation technique may result in transferinto or out of the current assigned level within thehierarchy.
The inputs or methodology used for valuing securitiesare not necessarily an indication of the risks associ-ated with investing in these securities.
Unadjusted Quoted Prices in Active Markets Significant Other Significant for Identical Observable Unobservable Assets and Liabilities Inputs Inputs Balance as ofDescription (Level 1) (Level 2) (Level 3) December 31, 2016
Unadjusted Quoted Prices in Active Markets Significant Other Significant for Identical Observable Unobservable Assets and Liabilities Inputs Inputs Balance as ofDescription (Level 1) (Level 2) (Level 3) December 31, 2016
* Please refer to Portfolios of Investments (pages 17 through 35) and Notes to Portfolios of Investments (pages 37 through 38) for portfolio holdings by country and industry.† Other financial instruments are derivative instruments which are valued at their respective unrealized appreciation (depreciation).
Unadjusted Quoted Prices in Active Markets Significant Other Significant for Identical Observable Unobservable Assets and Liabilities Inputs Inputs Balance as ofDescription (Level 1) (Level 2) (Level 3) December 31, 2016
Certain equity securities to which footnote (c) in theNotes to Portfolios of Investments apply are includedin Level 2 and were valued based on reference to sim-ilar securities which were trading on active markets.
In connection with the implementation of fair valuepricing procedures with respect to non-US securities(see Note 2(a)), certain equity securities (other thanthose securities described in footnote (c) in the Notes
to Portfolios of Investments) in the InternationalEquity, Emerging Markets Equity and Global DynamicMulti Asset Portfolios can transfer from Level 1 toLevel 2 as a result of fair value pricing procedures andwould revert to Level 1 when the fair value pricingprocedures are no longer used. Accordingly, a signifi-cant portion of the Portfolios’ investments are catego-rized as Level 2 investments. A Portfolio recognizes all
Annual Report 61
transfers between levels as though they were trans-ferred at the beginning of the reporting period.
During the year ended December 31, 2016, securitiesvalued at the following amounts were transferredfrom Level 2 to Level 1:
International Equity $29,065,461Global Dynamic Multi Asset 1,126,070
There were no other transfers into or out of Levels 1,2 or 3 during the year ended December 31, 2016.
For further information regarding security characteris-tics see Portfolios of Investments.
9. Derivative InstrumentsCertain Portfolios may use derivative instruments,including forward currency contracts.
Forward currency contracts may be used for hedgingpurposes or to seek to increase returns.
Global Dynamic Multi Asset PortfolioDuring the year ended December 31, 2016, theapproximate average monthly notional exposure forderivative instruments was as follows:
Forward currency contracts $92,600,000
The following table summarizes the fair value ofderivative instruments on the Statement of Assetsand Liabilities as of December 31, 2016:
The effect of derivative instruments on the Statementof Operations for the year ended December 31, 2016was:
Realized Gain (Loss) on DerivativesForeign Exchange Risk:Net realized gain (loss) on foreign currencytransactions and forward currency contracts $ 338,404 ____________________________ ____________________________
Net Change in Unrealized Appreciation (Depreciation) on Derivatives Foreign Exchange Risk:Net change in unrealized appreciation (depreciation)on foreign currency translations and forwardcurrency contracts $ (1,314,968) ____________________________ ____________________________
See Note 2(c) and the Portfolios of Investments foradditional disclosures about derivative instruments.
None of the other Portfolios presented traded in deriv-ative instruments during the year ended December 31,2016.
As of December 31, 2016, Global Dynamic Multi AssetPortfolio holds derivative instruments that are eligiblefor offset in the Statement of Assets and Liabilitiesand are subject to master netting arrangements. Amaster netting arrangement is an agreement betweentwo counterparties who have multiple contracts witheach other that provides for the net settlement of allcontracts, as well as any cash collateral, through asingle payment in the event of default on, or termina-tion of, any one contract.
Portfolio Amount
Fair Value
Amount
62 Annual Report
The required information for the affected Portfolio is presented in the below table, as of December 31, 2016:
Citibank NA $ 533,992 $ (533,992) $ — $ —HSBC Bank USA NA 1,210,150 (1,210,150) — —JPMorgan Chase Bank NA 115,004 (8,966) — 106,038State Street Bank and Trust Co. 12,101 (12,101) — — _________________________________________________________________________________________________________________________________________________________________________________________Total $1,871,247 $(1,765,209) $ — $106,038 _________________________________________________________________________________________________________________________________________________________________________________________ _________________________________________________________________________________________________________________________________________________________________________________________
Citibank NA $ 1,113,759 $ (533,992) $ — $579,767HSBC Bank USA NA 1,596,232 (1,210,150) — 386,082JPMorgan Chase Bank NA 8,966 (8,966) — —State Street Bank and Trust Co. 31,841 (12,101) — 19,740 _________________________________________________________________________________________________________________________________________________________________________________________Total $2,750,798 $(1,765,209) $ — $985,589 _________________________________________________________________________________________________________________________________________________________________________________________ _________________________________________________________________________________________________________________________________________________________________________________________
Net Amounts of Gross Amounts Offset Assets Presented Gross Amounts of in the Statement of in the Statement ofDescription Recognized Assets Assets and Liabilities Assets and Liabilities
Amounts Not Offset in the Statement of Assets and Liabilities ___________________________________________ Net Amounts of Assets Presented in Statement of Financial Collateral Net Amounts ofCounterparty Assets and Liabilities Instruments Received Derivative Assets
Net Amounts of Gross Amounts Offset Liabilities Presented Gross Amounts of in the Statement of in the Statement ofDescription Recognized Liabilities Assets and Liabilities Assets and Liabilities
Amounts Not Offset in the Statement of Assets and Liabilities _________________________________________ Net Amounts of Liabilities Presented in Statement of Financial Collateral Net Amounts ofCounterparty Assets and Liabilities Instruments Pledged Derivative Liabilities
10. Recent Accounting PronouncementsIn October 2016, the U.S. Securities and ExchangeCommission (the “SEC”) adopted new rules andamended existing rules (together, “final rules”)intended to modernize the reporting and disclosure ofinformation by registered investment companies. Inpart, the final rules amend Regulation S-X and requirestandardized, enhanced disclosure about derivativesin investment company financial statements, as wellas other amendments. The compliance date for theamendments to Regulation S-X is August 1, 2017.
Management is currently evaluating the impact thatthe adoption of the amendments to Regulation S-Xwill have on the Fund’s financial statements andrelated disclosures.
11. Subsequent EventsManagement has evaluated subsequent events affect-ing the Fund through the issuance of the financialstatements and has determined that there were nosubsequent events that required adjustment ordisclosure.
Annual Report 63
To the Board of Directors of Lazard Retirement Series, Inc. and Shareholders of Lazard Retirement US StrategicEquity Portfolio, Lazard Retirement US Small-Mid Cap Equity Portfolio, Lazard Retirement International EquityPortfolio, Lazard Retirement Emerging Markets Equity Portfolio, and Lazard Retirement Global Dynamic MultiAsset Portfolio:
We have audited the accompanying statements of assets and liabilities, including the portfolios of investments,of Lazard Retirement Series, Inc. (the “Funds”) comprising Lazard Retirement US Strategic Equity Portfolio,Lazard Retirement US Small-Mid Cap Equity Portfolio, Lazard Retirement International Equity Portfolio, LazardRetirement Emerging Markets Equity Portfolio, and Lazard Retirement Global Dynamic Multi Asset Portfolio asof December 31, 2016, and the related statements of operations for the year then ended, the statements ofchanges in net assets for each of the two years in the period then ended, and the financial highlights for each ofthe three years in the period then ended. These financial statements and financial highlights are the responsibil-ity of the Funds’ management. Our responsibility is to express an opinion on these financial statements andfinancial highlights based on our audits. The financial highlights for the periods presented on or before Decem-ber 31, 2013 were audited by other auditors whose report, dated February 14, 2014, expressed an unqualifiedopinion on those financial highlights.
We conducted our audits in accordance with the standards of the Public Company Accounting Oversight Board(United States). Those standards require that we plan and perform the audit to obtain reasonable assuranceabout whether the financial statements and financial highlights are free of material misstatement. The Funds arenot required to have, nor were we engaged to perform, an audit of its internal control over financial reporting.Our audits included consideration of internal control over financial reporting as a basis for designing audit pro-cedures that are appropriate in the circumstances, but not for the purpose of expressing an opinion on the effec-tiveness of the Funds’ internal control over financial reporting. Accordingly, we express no such opinion. Anaudit also includes examining, on a test basis, evidence supporting the amounts and disclosures in the financialstatements, assessing the accounting principles used and significant estimates made by management, as wellas evaluating the overall financial statement presentation. Our procedures included confirmation of securitiesowned as of December 31, 2016, by correspondence with the custodian and brokers; where replies were notreceived from brokers, we performed other auditing procedures. We believe that our audits provide a reason-able basis for our opinion.
In our opinion, the financial statements and financial highlights referred to above present fairly, in all materialrespects, the financial position of Lazard Retirement US Strategic Equity Portfolio, Lazard Retirement US Small-Mid Cap Equity Portfolio, Lazard Retirement International Equity Portfolio, Lazard Retirement Emerging MarketsEquity Portfolio, and Lazard Retirement Global Dynamic Multi Asset Portfolio as of December 31, 2016, theresults of their operations for the year then ended, the changes in their net assets for each of the two years inthe period then ended and the financial highlights for each of the three years in the period then ended, in con-formity with accounting principles generally accepted in the United States of America.
DELOITTE & TOUCHE LLPNew York, New YorkFebruary 13, 2017
Lazard Retirement Series, Inc. Report of Independent Registered Public Accounting Firm
64 Annual Report
Independent Directors(3):
Franci J. Blassberg (63) Director Debevoise & Plimpton LLP, a law firm, Of Counsel (August 2014) (2013 – present); previously, Partner (through 2012)
University of California, Berkeley School of Law, Lecturer (Spring 2017)
Cornell Law School, Visiting Professor of Practice(2015 – 2016); previously, Distinguished Practitioner inResidence (Fall 2013 and Fall 2014)
Kenneth S. Davidson (71) Director Davidson Capital Management Corporation, an (April 1997) investment manager, President (1978 – present)
Landseer Advisors LLC, an investment manager, SeniorAdvisor (2012 – 2014)
Aquiline Holdings LLC, an investment manager, Partner(2006 – 2012)
Nancy A. Eckl (54) Director College Retirement Equities Fund (eight accounts), (May 2007) Trustee (2007 – present)
TIAA-CREF Funds (68 funds) and TIAA-CREF Life Funds(11 funds), Trustee (2007 – present)
TIAA Separate Account VA-1, Member of theManagement Committee (2007 – present)
American Beacon Advisors, Inc. (“American Beacon”)and certain funds advised by American Beacon,Vice President (1990 – 2006)
Trevor W. Morrison (45) Director New York University School of Law, Dean and Eric M. (April 2014) and Laurie B. Roth Professor of Law (2013 – present)
Columbia Law School, Professor of Law (2008 – 2013)
Richard Reiss, Jr. (72) Director Georgica Advisors LLC, an investment manager, (April 1997) Chairman (1997 – present)
Resource Americas, Inc., a real estate asset managementcompany, Director (2016 – present)
O’Charley’s, Inc., a restaurant chain, Director (1984 – 2012)
Robert M. Solmson (69) Director Fairwood Capital, LLC, a private investment corporation (September 2004) engaged primarily in real estate and hotel investments,
President (2008 – present)
Lazard Retirement Series, Inc. Board of Directors and Officers Information (unaudited)
Name (Age) Position(s) with the Fund Principal Occupation(s) and Other Public CompanyAddress(1) (Since) and Term(2) Directorships Held During the Past Five Years(2)
Annual Report 65
Interested Directors(4):
Charles L. Carroll (56) Chief Executive Officer, Investment Manager, Deputy Chairman and Head of President and Director Global Marketing (2004 – present) (June 2004)
Ashish Bhutani (56) Director Investment Manager, Chief Executive Officer (July 2005) (2004 – present)
Lazard Ltd, Vice Chairman and Director (2010 – present)(1) The address of each Director of the Fund is Lazard Asset Management LLC, 30 Rockefeller Plaza, New York, New York 10112-6300.(2) Each Director serves as a Director for each of the funds in the Lazard Fund Complex (comprised of, as of January 31, 2017, 40 active investment
portfolios). Each Director serves an indefinite term, until his or her successor is elected, and each Director serves in the same capacity for theother funds in the Lazard Fund Complex.
(3) “Independent Directors” are not “interested persons” (as defined in the 1940 Act) of the Fund.(4) Messrs. Bhutani and Carroll are “interested persons” (as defined in the 1940 Act) of the Fund because of their positions with the Investment
Manager.
The Fund’s Statement of Additional Information contains further information about the Directors and is available without charge by calling 800-823-6300,or online, at www.LazardNet.com.
Name (Age) Position(s) with the Fund Principal Occupation(s) and Other Public CompanyAddress(1) (Since) and Term(2) Directorships Held During the Past Five Years(2)
66 Annual Report
Officers(3):
Nathan A. Paul (44) Vice President Managing Director and General Counsel of the and Secretary Investment Manager (April 2002)
Christopher Snively (32) Chief Financial Officer Senior Vice President of the Investment Manager (March 2016) (since November 2015)
Assurance Manager at PricewaterhouseCoopers LLP(2008 – November 2015)
Stephen St. Clair (58) Treasurer Vice President of the Investment Manager (May 2003)
Mark R. Anderson (46) Chief Compliance Officer Director and Chief Compliance Officer of the Investment (September 2014) Manager (since September 2014)
Senior Vice President, Counsel and Deputy ChiefCompliance Officer of AllianceBernstein L.P.(2004 – August 2014)
Tamar Goldstein (41) Assistant Secretary Director (since February 2016, previously Senior Vice (February 2009) President), and Director of Legal Affairs (since July
2015) of the Investment Manager
Shari L. Soloway (35) Assistant Secretary Senior Vice President, Legal and Compliance, of the (November 2015) Investment Manager (since September 2015)
Vice President and Associate General Counsel of GEAsset Management (July 2011 – September 2015)
Cesar A. Trelles (42) Assistant Treasurer Vice President of the Investment Manager (December 2004)(1) The address of each officer of the Fund is Lazard Asset Management LLC, 30 Rockefeller Plaza, New York, New York 10112-6300.(2) Each officer serves for an indefinite term, until his or her successor is elected and qualifies or until his or her earlier resignation or removal. Each
officer serves in the same capacity for the other funds in the Lazard Fund Complex.(3) In addition to Charles L. Carroll, President, whose information is included in the Interested Directors section.
Name (Age) Position(s) with the FundAddress(1) (Since) and Term(2) Principal Occupation(s) During the Past Five Years
Annual Report 67
Proxy VotingA description of the policies and procedures used todetermine how proxies relating to Fund portfoliosecurities are voted is available (1) without charge,upon request, by calling (800) 823-6300 or (2) on theSEC website at http://www.sec.gov.
The Fund’s proxy voting record for the most recent12-month period ended June 30 is available (1) with-out charge, upon request, by calling (800) 823-6300 or(2) on the SEC’s website at http://www.sec.gov. Infor-mation as of June 30 each year will generally be avail-able by the following August 31.
Form N-QThe Fund files a complete schedule of each Portfolio’sholdings for the first and third quarters of its fiscal yearwith the SEC on Form N-Q. The Fund’s Forms N-Q areavailable on the SEC’s website at http://www.sec.govand may be reviewed and copied at the SEC’s PublicReference Room in Washington, D.C. Information onthe operation of the SEC’s Public Reference Roommay be obtained by calling 1-800-SEC-0330.
Board Consideration of Management Agreement
Lazard Retirement Real Assets and PricingOpportunities Portfolio
At a meeting of the Board held on November 9, 2016,the Board considered the approval of the ManagementAgreement between the Fund, on behalf of LazardRetirement Real Assets and Pricing Opportunities Port-folio (the “New Portfolio”), and the Investment Man-ager (the “New Portfolio Management Agreement”).The Independent Directors were assisted in theirreview by independent legal counsel, who advised theBoard on relevant legal standards and met with theIndependent Directors in executive session separatefrom representatives of the Investment Manager.
Services ProvidedThe Board previously had received and discussedinformation addressing, among other matters, thenature, extent and quality of services that the Invest-ment Manager provides to the Fund, including a dis-cussion of the Investment Manager and its clients (of
which the existing Lazard Funds complex of 39 activefunds comprises approximately $31 billion (as of Sep-tember 30, 2016) of the approximately $205 billion oftotal assets under the management of the InvestmentManager and its global affiliates as of September 30,2016); the Investment Manager’s global research, port-folio management, operations, technology, legal andcompliance and marketing infrastructure; and theInvestment Manager’s personnel, resources, financialcondition and experience. The Board received a pres-entation on the New Portfolio from members of theNew Portfolio’s proposed portfolio managementteam, including the strategies to be employed for theNew Portfolio and the New Portfolio’s portfolio man-agement team, including professional biographies.
The Directors considered the various services to beprovided by the Investment Manager including theInvestment Manager’s research and portfolio manage-ment capabilities and oversight of day-to-day opera-tions, including supervision of fund accounting andadministration-related services and assistance inmeeting legal and regulatory requirements. The Direc-tors also considered the Investment Manager’s infra-structure and agreed that the New Portfolio would beexpected to benefit from the services and infrastruc-ture provided by the Investment Manager. The Direc-tors accepted management’s assertion that suchservices and infrastructure would be greater thanthose typically provided to a $31 billion fund complexnot managed by a large, global firm such as theInvestment Manager.
Comparative Fee, Expense Ratio and PerformanceInformationThe Directors reviewed comparative fee and expenseratio information prepared by Strategic Insight, anindependent provider of investment company data.
Advisory Fee and Expense Ratio. The Directors dis-cussed the proposed management fee to be paid tothe Investment Manager (referred to in the StrategicInsight materials as the “advisory fee”) and expenseratio for the New Portfolio (as limited by the Invest-ment Manager) and the comparisons provided byStrategic Insight, which compared the contractualadvisory fee and expense ratio for the New Portfolio
Lazard Retirement Series, Inc. Other Information (unaudited)
68 Annual Report
to its group1 of comparison funds (“Group”), and theDirectors noted the methodology and assumptionsused by Strategic Insight. The proposed contractualadvisory fee for the New Portfolio was below themedian for the Group and the expense ratio for theNew Portfolio was slightly above the median for theGroup. The Board also considered the fees paid by adiscretionary account advised by the Investment Man-ager with investment objectives, policies and strate-gies similar to those of the New Portfolio (the “RealAssets Other Account”).
Performance.The Directors considered the perform-ance of the Real Assets Other Account compared to a3-month LIBOR index (the “LIBOR Index”) and certainother securities indexes (the “Other Indexes”),although the Real Assets Other Account had less thantwo years of performance. The performance of the RealAssets Other Account (net of fees) was above that ofthe LIBOR Index, and was generally competitive withthe Other Indexes for most periods, and with lowervolatility (since inception) than the Other Indexes.
Investment Manager Profitability and Economiesof ScaleRepresentatives of the Investment Manager notedthat because the New Portfolio is newly formed, hasnot commenced operations and the eventual aggre-gate amount of the New Portfolio’s assets was uncer-tain, specific information concerning the cost ofservices to be provided to the New Portfolio and theexpected profits to be realized by the InvestmentManager and its affiliates from their relationships withthe New Portfolio and economies of scale would besubject to a number of assumptions and would bespeculative and not meaningful. The Investment Man-ager’s representatives stated that they did not expectthe Investment Manager to realize any current profitson the New Portfolio initially, noting the InvestmentManager’s agreement to waive its fees and/or reim-burse expenses of the New Portfolio for at least twoyears following the New Portfolio’s commencement ofoperations to maintain the expense ratios reflected inthe Strategic Insight materials. The Board determinedto revisit this issue no later than when it nextreviewed the investment management fee in connec-
tion with renewal of the New Portfolio ManagementAgreement. The Investment Manager’s representa-tives noted that neither the Investment Manager norits affiliates were expected to receive any significantindirect benefits from the Investment Manager actingas investment adviser to the New Portfolio. The Invest-ment Manager’s representatives reviewed with theBoard information provided on the Investment Man-ager’s brokerage and soft dollar practices. The repre-sentatives of the Investment Manager stated that theInvestment Manager intends to support distributionrelationships through direct payments from its or itsaffiliates’ own resources to third parties in connectionwith distribution and shareholder servicing and/oradministrative and recordkeeping services, and notedthat the New Portfolio would not bear any relatedcosts other than the 0.25% 12b-1 fee pursuant to theDistribution and Servicing Plan adopted for the NewPortfolio’s Service Shares.
At the conclusion of these discussions, each of theDirectors expressed the opinion that he or she hadbeen furnished with such information as may reason-ably be necessary to make an informed business deci-sion with respect to the approval of the New PortfolioManagement Agreement. Based on its discussions andconsiderations as described above, the Board madethe following conclusions and determinations withregard to the New Portfolio Management Agreement:
• The Board concluded that the nature, extent andquality of the services to be provided by the Invest-ment Manager are adequate and appropriate, not-ing the benefits of advisory and research servicesand other services and infrastructure (as discussedabove) associated with an approximately $205 bil-lion global asset management business.
• The Board was satisfied with the resources theInvestment Manager was to devote to managementof the New Portfolio.
• The Board concluded that the New Portfolio’s fee tobe paid to the Investment Manager supported theapproval of the New Portfolio Management Agree-ment in light of the considerations discussed above.
1 The New Portfolio has one comparison group, corresponding to Service Shares.
Annual Report 69
• The Board recognized that economies of scale maybe realized as the assets of the New Portfolioincrease. The Board determined it would seek tohave the Investment Manager share any materialeconomies of scale with the New Portfolio.
In evaluating the New Portfolio Management Agree-ment, the Board relied on the information describedabove as well as other information provided by theInvestment Manager. The Board considered these con-clusions and determinations in their totality and deter-
mined to approve the New Portfolio ManagementAgreement. In deciding whether to vote to approvethe New Portfolio Management Agreement, eachDirector may have accorded different weights to dif-ferent factors so that each Director may have had adifferent basis for his or her decision.
NOTES
NOTES
NOTES
Lazard Retirement Series, Inc.30 Rockefeller PlazaNew York, New York 10112-6300Telephone: 800-823-6300http://www.LazardNet.com
Investment ManagerLazard Asset Management LLC30 Rockefeller PlazaNew York, New York 10112-6300Telephone: 800-823-6300
DistributorLazard Asset Management Securities LLC30 Rockefeller PlazaNew York, New York 10112-6300
CustodianState Street Bank and Trust CompanyOne Iron StreetBoston, Massachusetts 02210
Transfer Agent and Dividend Disbursing AgentBoston Financial Data Services, Inc.P.O. Box 8514Boston, Massachusetts 02266-8514Telephone: 800-986-3455
Independent Registered Public Accounting FirmDeloitte & Touche LLP30 Rockefeller PlazaNew York, New York 10112-0015
Legal CounselStroock & Stroock & Lavan LLP180 Maiden LaneNew York, New York 10038-4982http://www.stroock.com
Performance information as of the most recent month end is available online at www.LazardNet.com.
Lazard Asset Management LLC • 30 Rockefeller Plaza • New York NY 10112 • www.lazardnet.com


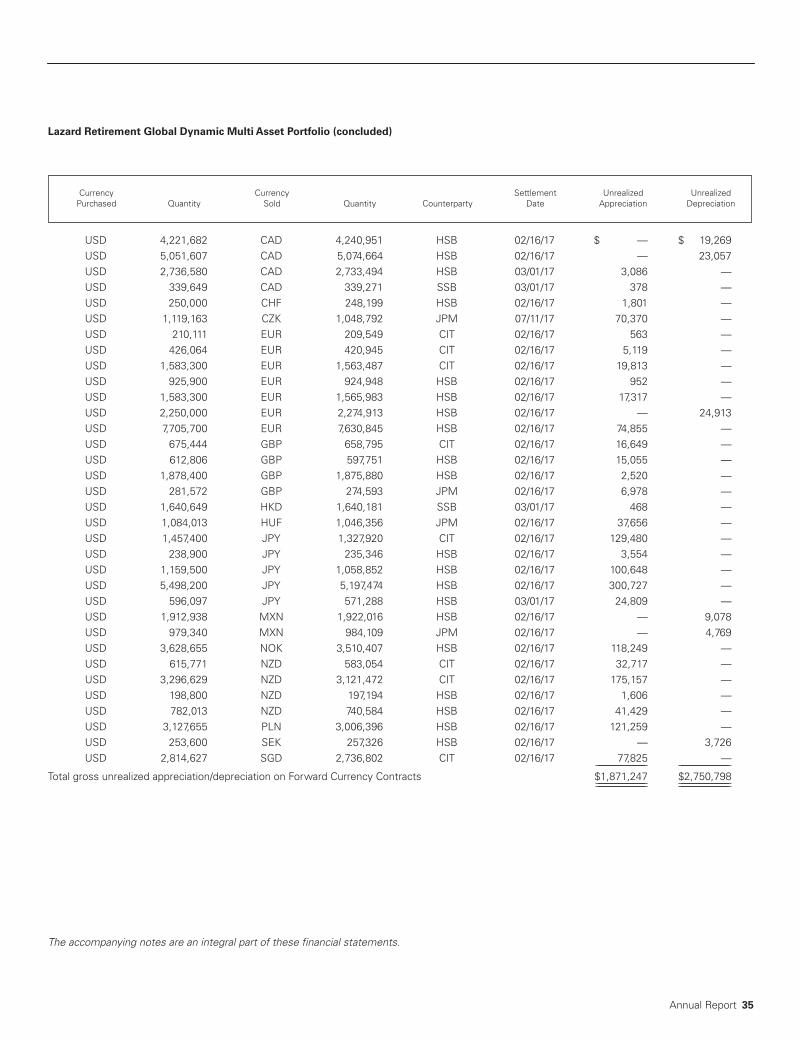


![A N NUA L REPO RT - IOLA - Home Annual Report/2017 IOLA...A N NUA L REPO RT 2017 J J D The IOLA Fund 7KH,2/$)XQG ,2/$ VXSSRUWVQRQ SURILWRUJDQL]DWLRQVLQ 1HZ](https://static.documents.pub/doc/80x56/5b0c5fb17f8b9a2c3b8b84c9/a-n-nua-l-repo-rt-iola-home-annual-report2017-iolaa-n-nua-l-repo-rt-2017.jpg)


