The author hereby grants to MIT permission to reproduce and to distribute publicly paper and electroniccopies of this thesis document in whole or in part in any medium now known or hereafter created.
Signature of Author:Harvard-MIT bivision of Health Sciences and Technology
August 24, 2007
Certified by:Lucila Ohno-Machado, M.D., Ph.D.
Associate Professor of Radiology and Health Sciences and TechnologyThesis Supervisor
Accepted by:
OCT 0 4 27A
LBRARIES RMWIES
to IfMartha L. Gray, Ph.D.Edward Hood Taplin Profe sor of Medical and Electrical Engineering
Co-director, Harvard-MIT Division of Health Sciences and Technology
Abstract
Recently, hospitals, regulatory agencies, and insurers have renewed their focus onimproving patient care and safety. Outcomes based measures are being utilized andhospitals are being asked to report on whether patients are being treated according to astandard of care or a best practice guideline.
As peri-operative physicians, anesthesiologists are able to evaluate and, to a great degree,affect the pre-operative, intra-operative, and post-operative course of a patient. However,several barriers exist. Although best practice guidelines exist, current models to riskstratify patients need improvement. Individual anesthesiologists currently have nouniform way to measure patient outcomes, either in an institutional or provider specificmanner, and many treat patients based on anecdotal experience rather than on evidencebased medicine.
We addressed these issues through development of an electronic feedback system. Thedemonstration system targeted the problem of postoperative nausea and vomiting(PONV) in the ambulatory surgery patient population. Because performance of existingPONV risk prediction models was poor and could not be used for educational purposes,we created a new PONV risk prediction model and compared it against existing models.The new, improved risk prediction model was incorporated into an electronic system thatgathered patient outcomes data related to best care practice and then fed back theinformation to care providers.
After implementation of the electronic feedback system, we evaluated its efficacy inimproving compliance with best care practices.
5-3 DATA CAPTURE AND UPLOAD ......................................... ........................................................ 21
5.4 CREATION AND VALIDATION OF RISK MODELS FOR PONV ........................................ .......... 23
5.4.1 Overview .......... ......................... 235.4.2 Statistical software ................................................... 245.4.3 Data source and pre-processing ........................................................................... 245.4.4 Model building and analysis....................................... .............................................. 26
5.5 ELECTRONIC FEEDBACK TO PHYSICIANS ................................................................. 27
7.1.1 Experimental model developed ................................................................... 447.1.2 Discrimination and calibration ...................................................... 48
7.2 ELECTRONIC FEEDBACK TO PHYSICIANS ................................................................. 49
Recently, there has been a renewed focus on improving patient care and safety. Patients,
the government, and HMOs are asking that healthcare resources be used more efficiently
to provide better quality care and care that is safer. As proof of improvement in care,
outcomes based measures are being utilized and the concept of a "balanced performance
score card" has emerged; that is, a report indicating that a hospital or physician is treating
patients according to a standard of care or a best practice guideline known to have a
positive effect on patient quality and efficiency of care.
As peri-operative physicians, anesthesiologists intensively monitor multiple parameters
related to the well-being of their patients. Because they are responsible for almost all
decisions regarding administration of peri-operative medicines, they are in the unique
position of being able to evaluate and, to a great degree, affect the pre-operative, intra-
operative, and post-operative course of a patient. However, individual anesthesiologists
currently have no uniform way to measure patient outcomes, either in an institutional or
provider specific manner, and many treat patients based on anecdotal experience rather
than on evidence based medicine (Cabana, et al., 1999). We hypothesize that a peri-
operative patient outcomes feedback system may help satisfy these deficiencies. Such a
system would identify practices that result in best patient outcomes and provide useful
feedback to care providers about their patients' outcomes and level of satisfaction. If
integrated into the educational system, it would also allow modification of provider
behavior towards compliance with best practices (Cohen, et al., 1996) (Lobach, et al.,
1997) (Shiffman, et al., 1999).
Although a few institutions are monitoring patient outcomes (Sandrick, 1998) and have
had good success with these systems (Wachter, 2001), none provides feedback to
anesthesiologists in a practice specific manner or in an automated, "real-time" manner.
Furthermore, although people have examined behavior modification in other fields of
medicine (Stomberg, et al., 2003) (Wachter, 2001), only a handful of studies in the field
of anesthesiology exist. A few indicate a positive response to feedback (Cohen, et al.,
1996) (Overdyk, et al., 1999) (Rose, et al., 1997); however, these studies do not
implement sustainable and cost effective ways of providing feedback.
2 Objectives
This study's primary objective was to develop and evaluate a sustainable electronic peri-
operative patient outcomes feedback system for its effectiveness in increasing
anesthesiologist compliance with best care practices.
Postoperative nausea and vomiting (PONV) control in ambulatory surgery patients has
been chosen as the best care practice to implement and evaluate in this demonstration
system. PONV has been chosen because it is frequent in the surgical population, has
been studied extensively (McQuay, et al., 1998) (Pavlin, 2002) (Moiniche, 2002), and
efficacy of multi-modal and risk directed treatment techniques has been demonstrated
(McQuay, et al., 1998) (Philip, 2002). Furthermore, a preliminary study in Brigham and
Women's Hospital (BWH) day surgery patients indicates that providers seldom use a
multi-modal technique for PONV prophylaxis and that treatment is not specific for
patient risk factors (Sarin, et al., 2006).
The system we developed had electronic educational materials that include a physician's
practices, their patients' outcomes, a tool to predict patient PONV risk, and current
literature recommendations. Evaluation of the system was conducted through a
prospective study examining physician practicing behavior.
In summary, this demonstration system:
1. monitored provider practice of a multi-modal PONV control regimens
2. monitored the patient outcomes of PONV in the immediate postoperative
recovery period and after discharge
3. developed, validated, and utilized a new PONV risk prediction model
4. fed back PONV risk model predictions, physician practices, patient outcomes,
and other educational materials to patient's care providers via a secure,
confidential electronic system
5. monitored change in provider behavior based on this feedback.
3 Background and prior work
Postoperative nausea and vomiting (PONV) and postoperative pain are the top two
complications in ambulatory surgery patients. Although both can significantly delay
discharge, patients are more concerned about having PONV and are willing to pay up
$100 out of pocket to prevent PONV (Gan, et al., 2001). Furthermore, having PONV
decreases patient satisfaction immensely and increases the risk of a costly overnight
hospitalization by three to four times (Habib, et al., 2004). With the number of
ambulatory surgery cases increasing each year, PONV is considered the "big little
problem" and much research into this complication has been conducted over the last 30
years. Unfortunately, the incidence has remained around 25-30% despite changes in
anesthetic practices (Palazzo, et al., 1984), possibly due to the multi-factorial nature of
PONV. At BWH, a preliminary study indicated that the overall PONV rate was 25%,
with the rate being as high as 65% in high risk patient groups (Sarin, et al., 2006).
3.1 Best practices for control of postoperative nausea andvomiting
Several regimens have been shown to reduce the incidence of PONV in the
ambulatory surgery population. These regimens include avoiding inhalational agents
for general anesthesia (GA); providing regional anesthesia (RA) to avoid use of
narcotics that are emetogenic; and/or providing prophylactic anti-emetics in an
attempt to decrease the probability of PONV (Gan, et al., 2003) (Apfel, et al., 2002).
Each of these regimens has been shown to be effective, but not guaranteed to
eliminate PONV (Habib, et al., 2004). However, blindly applying these regimens to
all ambulatory surgery patients is neither practical nor in the patient's best interests.
Providing RA may be associated with increased time of getting the patient ready for
surgery as well as serious complications associated with the technique. Avoiding
inhalational agents for GA may raise the incidence of intra-operative awareness.
Prophylactic use of anti-emetics increases the risk of having medication related side
effects (Tramer, 2001) and is not 100% effective in preventing PONV (Domino, et
al., 1999). All three factors increase the cost of anesthesia to the patient and the
health care system as a whole (Watcha, 2000).
The current strategy for reducing PONV relies on risk stratifying the patient and then
tailoring treatment based on the classification. For example, in one system, patients
considered to be at extremely high risk are recommended to receive multiple anti-
emetics as well as avoidance of GA and narcotics if possible, whereas patients
7
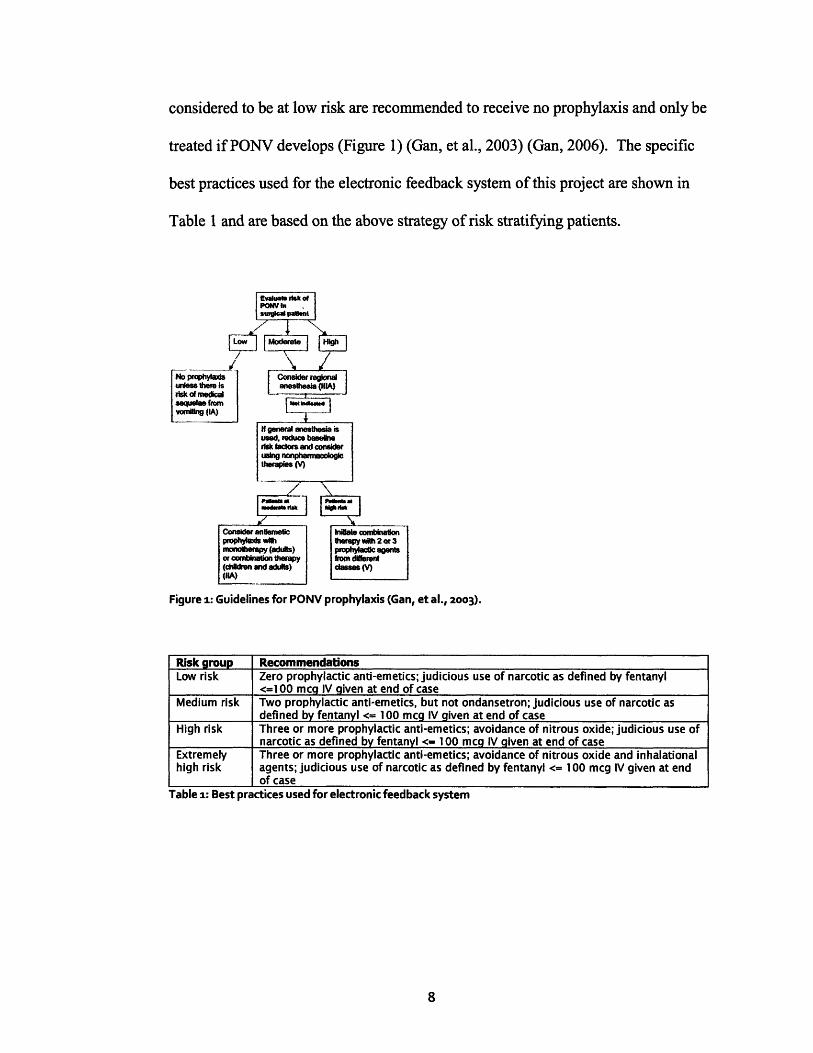
considered to be at low risk are recommended to receive no prophylaxis and only be
treated ifPONV develops (Figure 1) (Gan, et al., 2003) (Gan, 2006). The specific
best practices used for the electronic feedback system of this project are shown in
Table 1 and are based on the above strategy of risk stratifying patients.
Figure 1: Guidelines for PONV prophylaxis (Gan, et al., 2oo3).
Risk group RecommendationsLow risk Zero prophylactic anti-emetics; judicious use of narcotic as defined by fentanyl
<=100 mccq IV given at end of caseMedium risk Two prophylactic anti-emetics, but not ondansetron; judicious use of narcotic as
defined by fentanyl <= 100 mcq IV given at end of caseHigh risk Three or more prophylactic anti-emetics; avoidance of nitrous oxide; judicious use of
narcotic as defined by fentanyl <= 100 mcg IV given at end of caseExtremely Three or more prophylactic anti-emetics; avoidance of nitrous oxide and inhalationalhigh risk agents; judicious use of narcotic as defined by fentanyl <= 100 mcg IV given at end
of caseTable 1: Best practices used for electronic feedback system
3.2 Risk models for PONV
Many models have been developed to classify patients into risk groups.
Unfortunately, the current models cannot be effectively used for any decision support
purposes and are too simple for the educational purposes of this project. Even the
"best" models do not have great discriminatory ability in predicting PONV. They
cannot be used for decision support beyond risk stratifying patients based on patient
history, as they include only non-modifiable factors and rather than factors that the
physician can control. Furthermore, they cannot be used to educate anesthesiologists
about practices that can potentially reduce a patient's risk of PONV. Although
reasons for simplification of the original models were valid (Apfel, et al., 1999)
(Apfel, et al., 2002) when the models were first developed, it should now be possible
to apply improved yet more complex models to predict PONV risk from information
derived from anesthesia management systems that are routinely utilized in the care of
patients.
One of the first models for risk assessment of PONV was developed by Palazzo and
Evans. This model was created using logistic regression to identify variables
associated with increased PONV in patients undergoing orthopedic surgery (Palazzo,
et al., 1993). Since then, models have been created using data from patients
undergoing a greater variety of surgical procedures. Of these, the scoring systems of
Apfel (Apfel, et al., 1999) and Koivuranta (Koivuranta, et al., 1997) are best known.
Both used logistic regression on data from inpatients undergoing a number of
different procedures and recorded the outcome of PONV up to 24 hours after surgery.
Although the models considered patient history (e.g., sex, history of PONV, history
of motion sickness), intra-operative factors (e.g., medications given, fluids
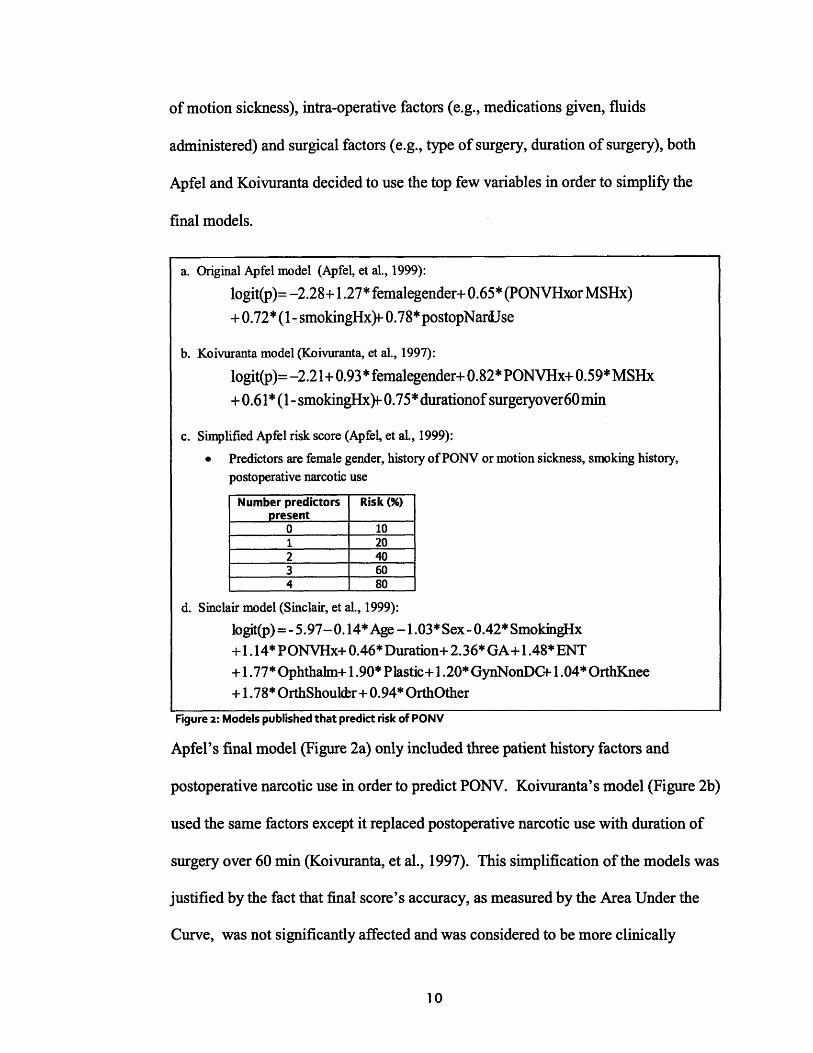
administered) and surgical factors (e.g., type of surgery, duration of surgery), both
Apfel and Koivuranta decided to use the top few variables in order to simplify the
final models.
Figure 2: Models published that predict risk of PONV
Apfel's final model (Figure 2a) only included three patient history factors and
postoperative narcotic use in order to predict PONV. Koivuranta's model (Figure 2b)
used the same factors except it replaced postoperative narcotic use with duration of
surgery over 60 min (Koivuranta, et al., 1997). This simplification of the models was
justified by the fact that final score's accuracy, as measured by the Area Under the
Curve, was not significantly affected and was considered to be more clinically
applicable (Apfel, et al., 2002). Apfel developed a simplified PONV risk score based
on these four predictors and the predicted risk of PONV for the simplified Apfel risk
score is shown in Figure 2c (Van den Bosch, et al., 2005). Because these models
were based on data from inpatients and not applicable to ambulatory surgery patients,
Sinclair analyzed data from over 17,000 ambulatory surgery patients. He published a
model (Figure 2d) that noted that the type of surgery, type of anesthesia, and certain
patient history factors were important in predicting PONV (Sinclair, et al., 1999).
Discrimination of the Apfel and Koivuranta models have been evaluated in outside
centers. In the derivation center, AUCs were 0.75 and 0.72, respectively, using
independent test sets. In validation datasets at other centers, the AUCs have ranged
from 0.63-0.68 for Apfel's model, and 0.66-0.70 for Koivuranta's model (Van den
Bosch, et al., 2005) (Apfel, et al., 2002). Sinclair's model has not been validated in
an external center but showed an AUC of 0.78 in the study's test set (Sinclair, et al.,
1999).
3.3 Compliance with recommended PONV practices
Although PONV has been studied extensively and guidelines have been published in
the literature, compliance with recommended practices by anesthesiologists is low.
Pilot data from BWH indicate overall compliance with recommended practices is less
than 50% and that compliance with recommended best practices in high risk patient
groups is less than 10%. When surveyed, anesthesiologist provide several reasons for
non-compliance. For one, they feel that they do not have the time to follow-up on all
of their patients to see what their outcomes were or to provide some of the more
aggressive preventative treatments. They may only follow-up on a select group of
patients and this may result in a "selection bias." Furthermore, because of a lack of
recorded data, many physicians feel that their patients do not have bad outcomes.
Other physicians provide all patients with aggressive treatment, without regard to
risks or costs associated with the treatment.
A few institutions are monitoring patient outcomes (Sandrick, 1998) and have had
good success with feedback systems (Wachter, 2001) (Stomberg, et al., 2003). Most
examine behavior modification in other fields of medicine and only a handful of
studies in the field of anesthesiology exist. A few in this field indicate a positive
response to feedback (Wachter, 2001) (Cohen, et al., 1996) (Overdyk, et al., 1999)
(Pierre, et al., 2004). However, these studies do not implement sustainable and cost
effective ways of providing feedback over long periods.
Cohen first examined if feedback can affect anesthesiologists' practice patterns. The
group provided individualized feedback and education to anesthesiologists with
regards to PONV control practices over a two year period with a control group
receiving no feedback. The individualized feedback included information on number
of promoted measures with which they complied and the individual's PONV rate.
The group noticed an increase in compliance with PONV control practices during the
study period but, unfortunately did not examine for continued compliance after
feedback was stopped (Cohen, et al., 1996). Overdyk also examined PONV control
practices in anesthesiologists. His study posted monthly bar charts comparing
incidence of PONV, number of patients receiving practices, and patient satisfaction
between attendings. Educational literature was also posted. Feedback and literature
were discussed during staff meetings each month. The study noted more appropriate
prescribing of prophylactic medications and decrease in medication cost without any
increase in PONV or decrease in patient satisfaction (Overdyk, et al., 1999).
These studies provided paper based feedback that is costly to create, disseminate, and
requires continued effort to maintain. They did not elucidate strategies to provide
feedback to anesthesiologists in a practice specific manner, in an automated, "real-
time" manner that is sustainable over time.
To the best of our knowledge, no study has evaluated the impact of automated
electronic feedback to anesthesiologists and effects on change in practice compliance.
4 Design & Implementation
4.1 Overview
In order to meet the goals of this project, the following informatics infrastructure was
put into place:
1. A clinical database and web based front end that allows entry of clinical
data found in the patient record by a care provider or a research assistant.
2. A departmental research database that transforms clinical data into data
that are easier to use for research purposes.
3. Web based electronic feedback components that can be used by physicians
to analyze their own practices and patient outcomes.
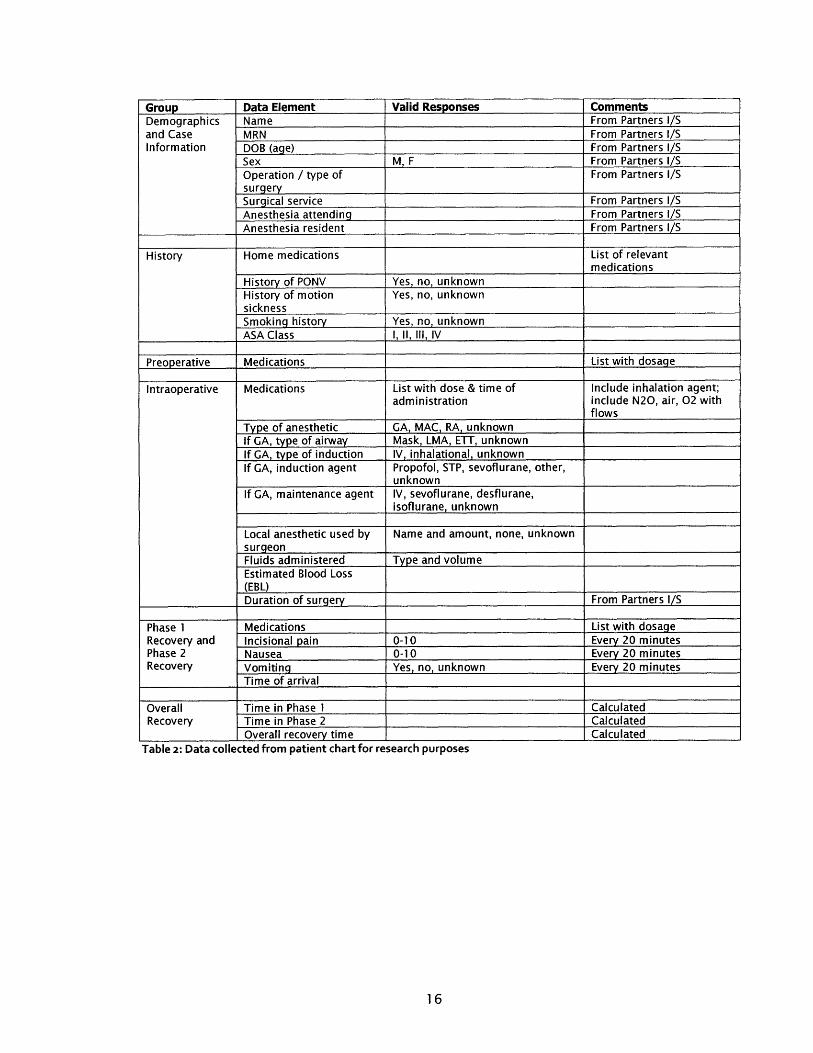
At BWH, patient charts are in paper format. To maximize collection of research data,
most information recorded on a paper chart was transferred to this specialized
research database. These data include various patient history factors, type and mode
of intubation, medications given (including inhalational agents, carrier gas flow rates,
and vasopressors), and complications in O.R. Recovery room data collected include
pain scores recorded every 20 minutes, outcomes of nausea/vomiting recorded every
20 minutes, analgesic and anti-emetic medications given, times in each phase of
recovery, and time to discharge. These data are collected on ambulatory surgery
patients undergoing breast biopsies, diagnostic laparoscopy, laparoscopic procedures,
or herniorraphy. Surgery start and end times are provided electronically by Partners
Information Systems and combined with the above data. Descriptions of all data
collected are listed in Table 2.
Clinical data are entered into the system at the point of care using a tablet PC. The
data are stored in a local database; at the end of the day, this local database is
synchronized with a database on a remote server. On the remote server, clinical data
are transformed and copied into the research database.
From this data, PONV risk models specific to BWH and ambulatory surgery patients
have been created and internally validated. These models are used as part of the
electronic system to provide physicians feedback on how their decisions might affect
PONV risk.
After the physician treats five new patients, an HTML e-mail containing physician
practices and patient outcomes is generated and sent to the physician. These data, as
well as detailed statistics, literature, and the PONV calculator created from the risk
models, are also available to physicians via a secure web site. All activity is logged,
including whether an e-mail has been read and how much time the physician has
spent on each part of the web site.
This electronic feedback system uses web based technologies to maximize
availability. The front end to the system is any HTML compliant web browser with
Javascript. The back end server technology uses the Adobe ColdFusion application
server programming language that dynamically generates HTML. The Apache web
server is used to serve the HTML created to clients. Postgresql is used as the
database server to store all data.
Group Data Element Valid Responses CommentsDemographics Name From Partners I/Sand Case MRN From Partners I/SInformation DOB (age) From Partners I/S
Sex M, F From Partners I/SOperation / type of From Partners I/SsurgerySurgical service From Partners I/SAnesthesia attending From Partners I/SAnesthesia resident From Partners I/S
History Home medications List of relevantmedications
History of PONV Yes, no, unknownHistory of motion Yes, no, unknownsicknessSmoking history Yes, no, unknownASA Class I II, III, IV
Preoperative Medications List with dosage
Intraoperative Medications List with dose & time of Include inhalation agent;administration include N20, air, 02 with
flowsType of anesthetic GA, MAC, RA, unknownIf GA, type of airway Mask, LMA, ETT, unknownIf GA, type of induction IV, inhalational, unknownIf GA, induction agent Propofol, STP, sevoflurane, other,
unknownIf GA, maintenance agent IV, sevoflurane, desflurane,
isoflurane, unknown
Local anesthetic used by Name and amount, none, unknownsurgeonFluids administered Type and volumeEstimated Blood Loss(EBL)Duration of surgery From Partners I/S
Phase 1 Medications List with dosageRecovery and Incisional pain 0-10 Every 20 minutesPhase 2 Nausea 0-10 Every 20 minutesRecovery Vomiting Yes, no, unknown Every 20 minutes
Time of arrival
Overall Time in Phase 1 CalculatedRecovery Time in Phase 2 Calculated
Overall recovery time CalculatedTable 2: Data collected from patient chart for research purposes
4.2 Database Development
4.2.1 Overview
Postgresql is used to store all data required for the application. Postgresql is a
free, multi-environment and well developed SQL relational database. Two
databases were designed - the first to store clinical data and the second to
store processed research data.
4.2.2 Clinical database
Clinical data are stored in a schema containing seven tables. These tables are
normalized to comply with relational database standards and therefore do not
store the same data in multiple locations nor store derived data. All tables are
linked via foreign keys and all have primary keys. The schema is shown in
Figure 3; tables in the database are listed in Table 3.
Figure 3: Schema of clinical database and relationships between tables. See text for moredetailed description.
Table Name Descriptioncaseinfo Primary table containing case informationdemo Patient demographicshistory Patient historyanestype Type of anesthesia performed for caserecovery Recovery room course for casemeds Medications administered to patient preoperatively, intraoperatively, or
postoperativelyscores Pain, nausea, and vomiting scores postoperativelymedinfo Supporting table, linked to table "meds" to identify medicationsanesstaff Supporting table, linked to table "caseinfo" to identify anesthesia staff
associated with caseTable 3: Tables in clinical database. See text for more detailed description.
The two primary tables are "caseinfo" and "patinfo". Table "caseinfo" stores
data related to the actual case, such as date of surgery, surgery description,
starting and ending times, anesthesiology staff, etc. The "caseid" is the
primary key and a unique id for each case. The "patid" foreign key links this
table to table "demo" such that identifying patient information is stored
separately of case information. Table "caseinfo" also contains fields to
indicate whether a case will be used in the evaluation study or not; the field
"active" is modified by a program to eliminate ambulatory cases that are not
part of the evaluation study and field "stageid" is used to indicate whether all
relevant case information has been captured.
All other tables are linked to table "caseinfo" via the unique foreign key
"caseid". Table "anestype" contains information on type of anesthesia
performed, such as general anesthesia versus monitored anesthesia care, type
of airway used, etc. Table "history" stores data on patient history factors,
such as whether the subject has had PONV in past, history of motion sickness,
height, weight, etc. Table "meds" stores all medications the patient receives
peri-operatively. The table provides for a record of when a medication is
18
started and ended, as well as the dose given. Table "recovery" contains fields
for data collected in the recovery room, such as when patients arrive to the
recovery room, when they are ready for discharge, any complications, etc.
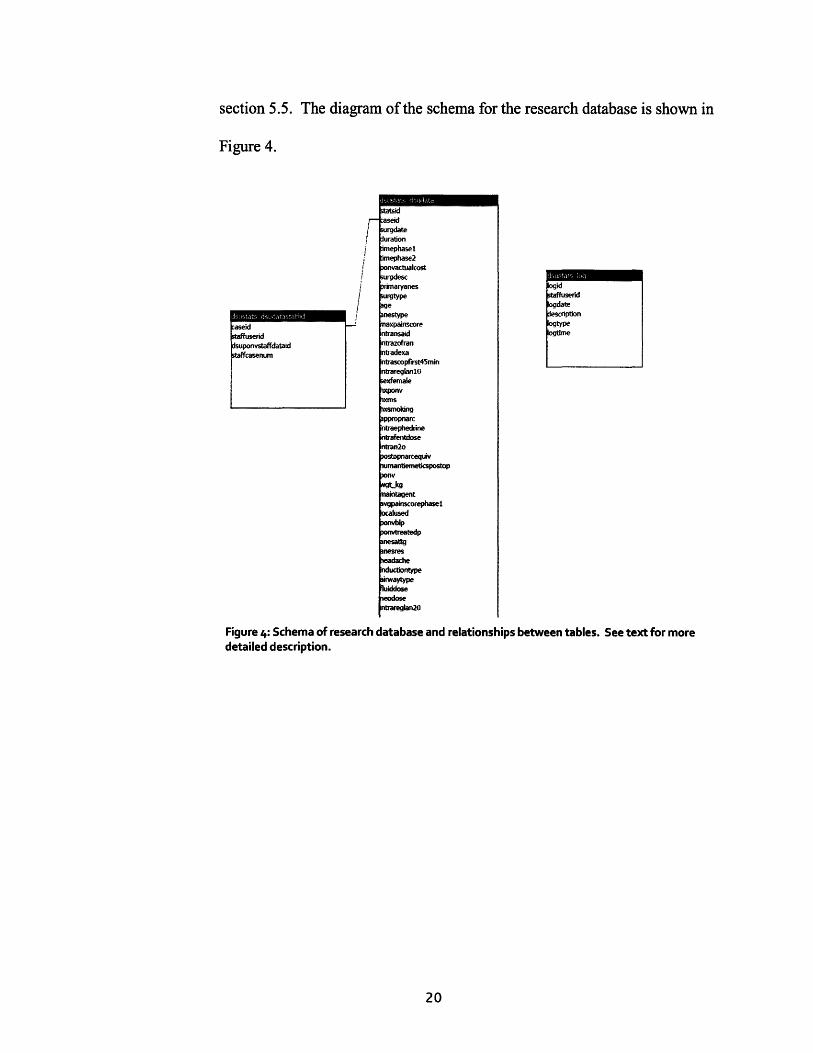
Figure 4: Schema of research database and relationships between tables. See text for moredetailed description.
4.3 Data capture and upload
As indicated before, infrastructure to allow electronic capture of data needed for this
project had to be created. This goal was accomplished by creating a system that
could be used by the research assistant (or, in the future, by clinicians and nurses) to
capture data at point of care in order to maximize the number of data points captured
without errors. The system presents the research assistant with the operating room
schedule for the day, filtered to show only ambulatory surgery patients who are to be
included in the study (Figure 5). Patient MRN, description of surgery, surgeon, and
time of surgery are listed for each case; patient names are only displayed when the
mouse hovers over the MRN because of patient privacy issues. Cases are grouped by
where in the recovery process the patient is in: (1) expected for arrival in the recovery
room, (2) in stage 1 of recovery, (3) in stage 2 of recovery, or (4) ready for discharge.
This type of grouping allows the user to quickly locate the patient for whom data
need to be entered.
m........ a .. S .- ........ ....
....
3
.f. ... ...... .
M R......... :. • •...........-... . ........ ......
Figure 5: Research assistant screen showing all cases for which data needs to be collected. Patients wereorganized by stage of recovery process.
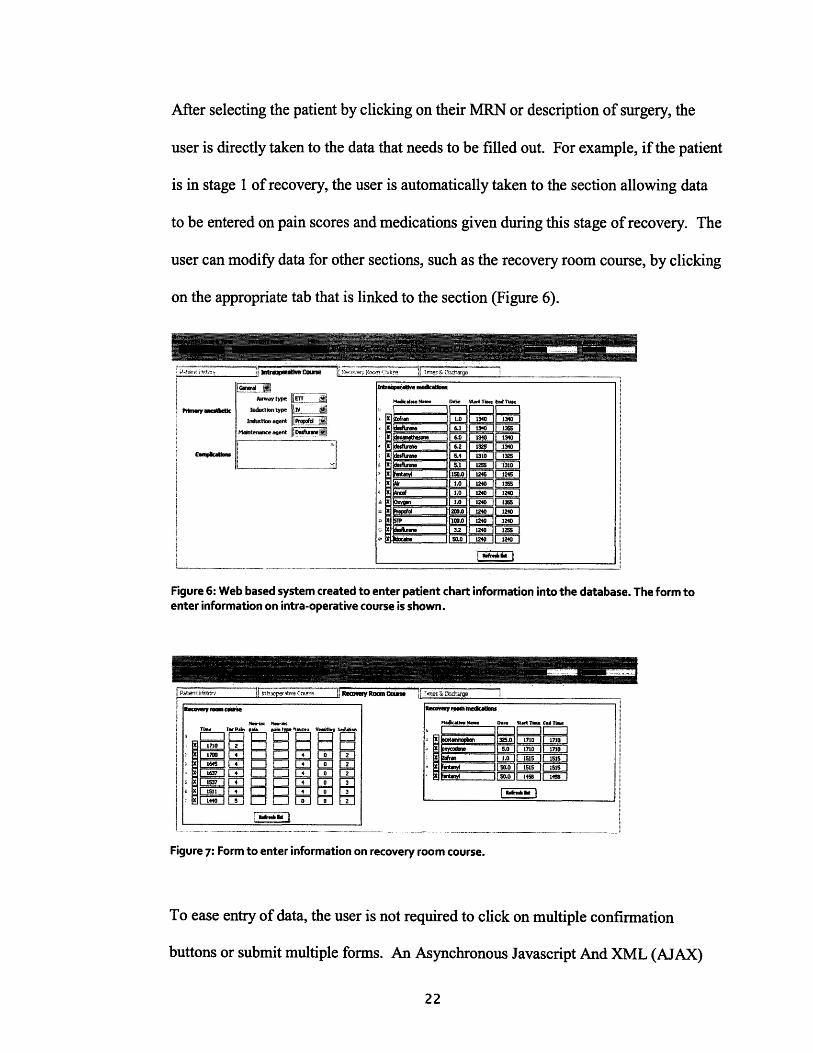
After selecting the patient by clicking on their MRN or description of surgery, the
user is directly taken to the data that needs to be filled out. For example, if the patient
is in stage 1 of recovery, the user is automatically taken to the section allowing data
to be entered on pain scores and medications given during this stage of recovery. The
user can modify data for other sections, such as the recovery room course, by clicking
on the appropriate tab that is linked to the section (Figure 6).
1. 7ti ivecame .z' 5
Aiaw .P.yl Iti7"7Prhnwy aneshefic IsibidUmWy t
___fL2epk-u I--7--- --
Figure 6: Web based system created to enter patient chart information into the database. The form toenter information on intra-operative course is shown.
Rumniny Room CaiM .!
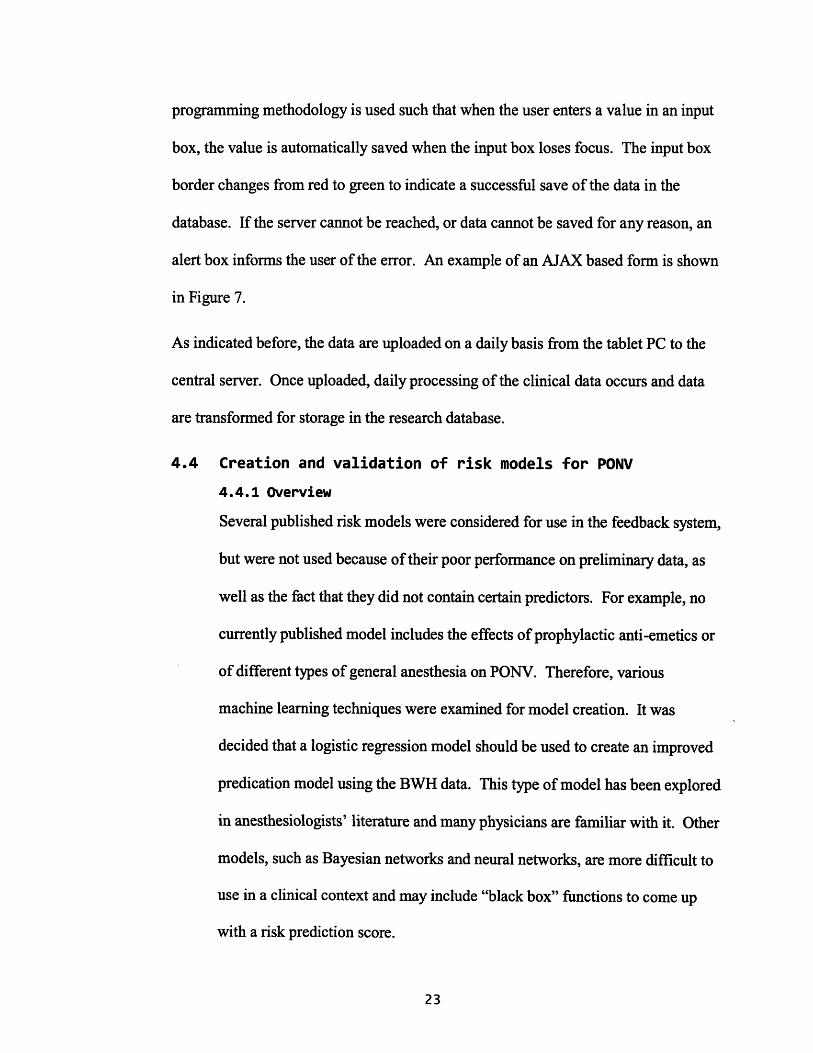
Figure 7: Form to enter information on recovery room course.
To ease entry of data, the user is not required to click on multiple confirmation
buttons or submit multiple forms. An Asynchronous Javascript And XML (AJAX)
IntbroperawMattv wmk
Don %"k TimeI~atT~ Eftdawt
Urn 1.0 1340 1340J~ 1*6 1365
O ~~ZZZ 6II H11400 131F6.2 1315 .1340F5. 1310 1325
151O s F 5451.0 1 F- 13557YO1 12450
.0 .12 40 1 '200.0 !M A12432 124 125
0. 5m F ma
'Ild ch 10. I~~ H
X r-~.0 151-5 -IF-i-i--smol 1455 M~1
Recoe rVan ow
T(AW IM pg*Pr t i U4.
ZM IIE 10I
x 55m mm31H 4s w wr--1 4-4-0 -1l 2
..... .......... ... ..........··
----- '----~ -- ··
~~~-----•S
I I
par~;lpnz
programming methodology is used such that when the user enters a value in an input
box, the value is automatically saved when the input box loses focus. The input box
border changes from red to green to indicate a successful save of the data in the
database. If the server cannot be reached, or data cannot be saved for any reason, an
alert box informs the user of the error. An example of an AJAX based form is shown
in Figure 7.
As indicated before, the data are uploaded on a daily basis from the tablet PC to the
central server. Once uploaded, daily processing of the clinical data occurs and data
are transformed for storage in the research database.
4.4 Creation and validation of risk models for PONV
4.4.1 Overview
Several published risk models were considered for use in the feedback system,
but were not used because of their poor performance on preliminary data, as
well as the fact that they did not contain certain predictors. For example, no
currently published model includes the effects of prophylactic anti-emetics or
of different types of general anesthesia on PONV. Therefore, various
machine learning techniques were examined for model creation. It was
decided that a logistic regression model should be used to create an improved
predication model using the BWH data. This type of model has been explored
in anesthesiologists' literature and many physicians are familiar with it. Other
models, such as Bayesian networks and neural networks, are more difficult to
use in a clinical context and may include "black box" functions to come up
with a risk prediction score.
4.4.2 Statistical software
SAS version 9.1 (Windows platform) was used for logistic regression
modeling and analysis.
4.4.3 Data source and pre-processing
Data used for development of models were extracted from the research
database described above. The binary outcome measure was postoperative
nausea/vomiting. Based on extensive literature search and consultation with a
local domain expert (Philip, 2006), 17 of the strongest predictors were
selected for consideration in the model. Clinical data collected is listed in
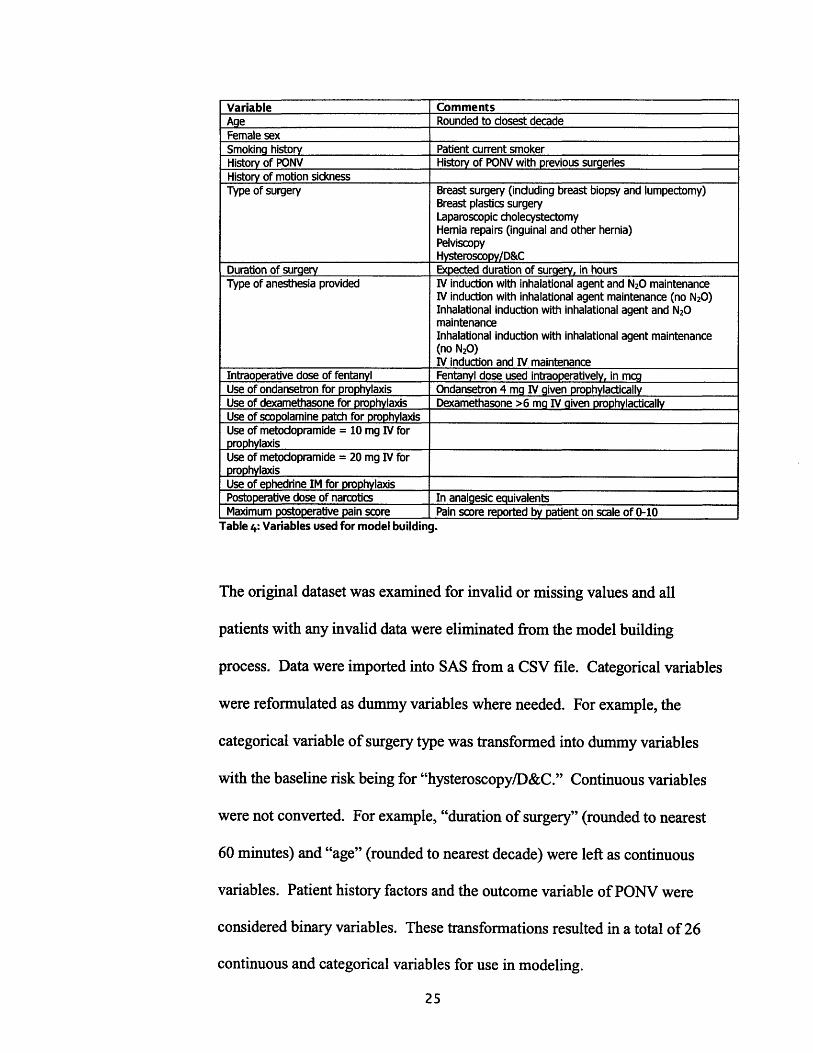
Table 2. From this clinical data, the following variables were used for model
development (Table 4): age (closest decade), female sex, smoking history,
history of PONV, history of motion sickness, type of surgery, duration of
surgery (in hours), type of anesthesia provided, intraoperative dose of fentanyl
(in mcg), use of ondansestron for prophylaxis, use of dexamethasone for
prophylaxis, use of scopolamine patch for prophylaxis, use of metoclopramide
for prophylaxis (2 different doses used), use of ephedrine IM for prophylaxis,
postoperative dose of narcotics in analgesic equivalents, and maximum
postoperative pain score.
Variable CommentsAge Rounded to dosest decadeFemale sexSmoking history Patient current smokerHistory of PONV History of PONV with previous surgeriesHistory of motion sicknessType of surgery Breast surgery (including breast biopsy and lumpectomy)
Breast plastics surgeryLaparoscopic cholecystectomyHernia repairs (inguinal and other hernia)PelviscopyHysteroscopy/D&C
Duration of surgery Expected duration of surgery, in hoursType of anesthesia provided IV induction with inhalational agent and N20 maintenance
IV induction with inhalational agent maintenance (no N20)Inhalational induction with inhalational agent and N20maintenanceInhalational induction with inhalational agent maintenance(no N20)IV induction and IV maintenance
Intraoperative dose of fentanyl Fentanyl dose used intraoperatively, in mcgUse of ondansetron for prophylaxis Ondansetron 4 mg IV given prophylacticallyUse of dexamethasone for prophylaxis Dexamethasone >6 mg IV given prophylacticallyUse of scopolamine patch for prophylaxisUse of metoclopramide = 10 mg IV forprophylaxisUse of metodopramide = 20 mg IV forprophylaxisUse of ephedrine IM for prophylaxisPostoperative dose of narcotics In analgesic equivalentsMaximum postoperative pain score Pain score reported by patient on scale of 0-10
Table 4: Variables used for model building.
The original dataset was examined for invalid or missing values and all
patients with any invalid data were eliminated from the model building
process. Data were imported into SAS from a CSV file. Categorical variables
were reformulated as dummy variables where needed. For example, the
categorical variable of surgery type was transformed into dummy variables
with the baseline risk being for "hysteroscopy/D&C." Continuous variables
were not converted. For example, "duration of surgery" (rounded to nearest
60 minutes) and "age" (rounded to nearest decade) were left as continuous
variables. Patient history factors and the outcome variable of PONV were
considered binary variables. These transformations resulted in a total of 26
continuous and categorical variables for use in modeling.
4.4.4 Model building and analysis
Prior to model building, the data were randomly divided into a % training set
and a % test set. These two sets were compared to confirm that data had
indeed been split randomly and the frequency of the variables' values was not
significantly different. The PROC LOGISTIC function in SAS was used to
build a logistic regression model using a stepwise algorithm on the training set
with the 26 variables. Variables were entered into the model if they met a
significance level of p<0.50 and were allowed to stay in the model if they met
a significance level of p<0.20 (Shtatland, et al.). Model building stopped
when no additional variables met these criteria.
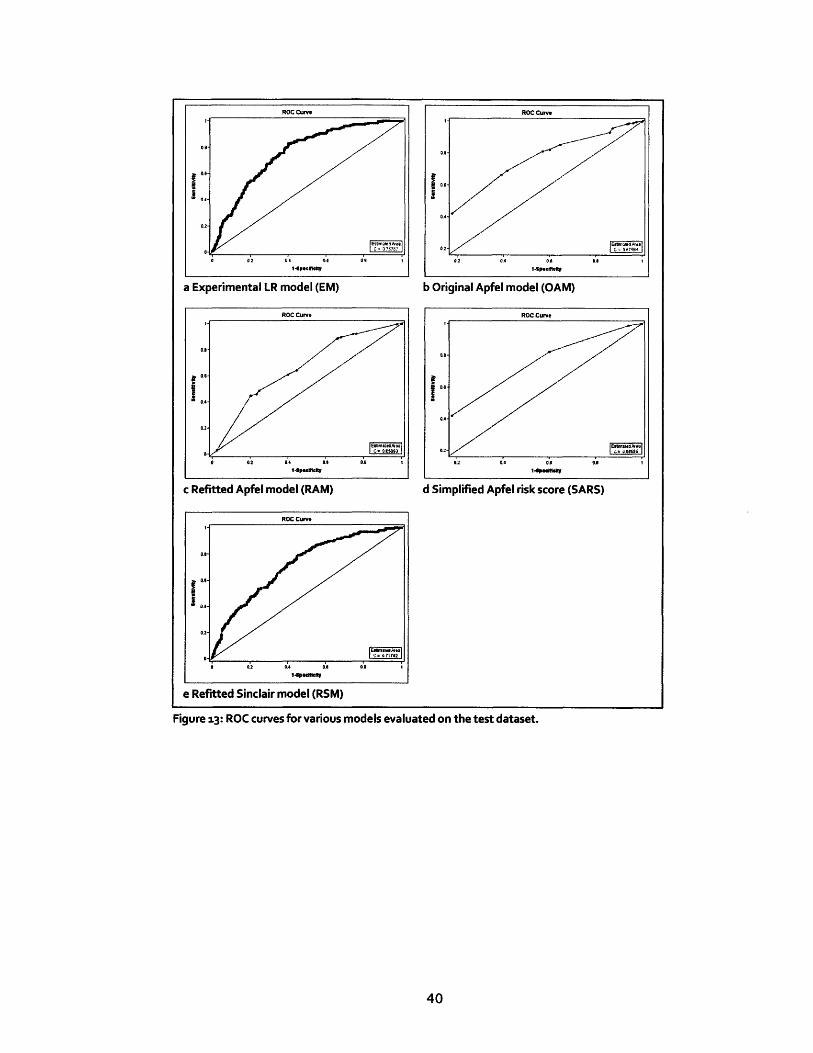
The experimental model (EM) created was compared against the original
Apfel model (OAM), a refitted Apfel model (RAM), the simplified Apfel risk
score (SARS), and a refitted Sinclair model (RSM). In order to refit the Apfel
and Sinclair models, new beta coefficients were calculated using the variables
from the original model using the PROC LOGISTIC function. Each of the
models was then run against the test data. To estimate the discriminating
power of the models, Receiver Operating Characteristic (ROC) curves were
created and the Area Under the Curves (AUC) were calculated using SAS
(Figure 13). The ROC curve allows visualization of the relationship of
sensitivity and specificity at different probability thresholds. The AUC
determines how well patients who had PONV could be distinguished from
patients who did not have PONV using the model's risk prediction
calculation. An AUC of 1.0 represents perfect discrimination whereas an
AUC of 0.5 represents no discrimination (Hanley, et al., 1982).
26
Pair-wise AUC comparisons were performed to evaluate differences in
discrimination between models as described previously (DeLong, et al., 1988)
(Hanley, et al., 1983). Here, a non-parametric comparison of the ROC is
done.
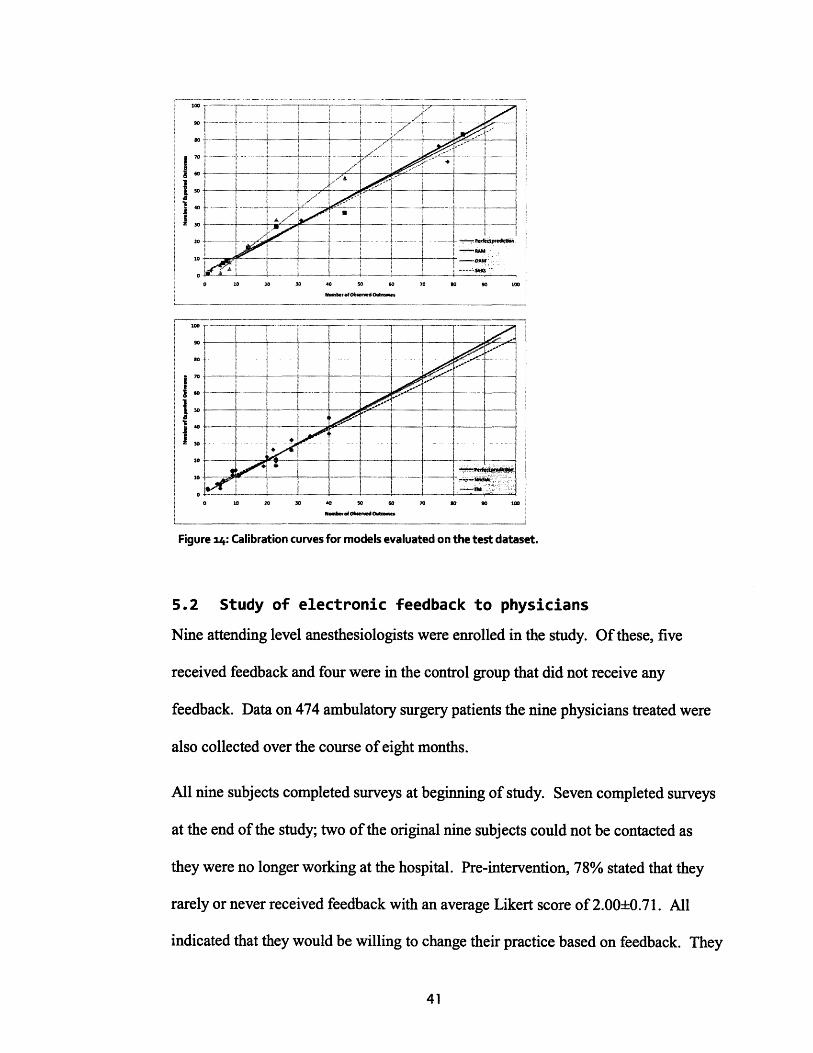
Calibration curves were also developed to examine the accuracy and goodness
of fit of each model. For each model, the predicted number of observations
was plotted against the expected number of observations for each of ten risk
percentiles created from the test set. For the simplified Apfel model, it was
only possible to categorize patients into four bins. A slope of 1 with an
intercept of 0 indicates perfect calibration whereas a larger slope indicates an
over-estimation of occurrence of PONV by the model. Calibration was
further evaluated with Hosmer-Lemeshow goodness of fit X2 estimates using
deciles (Lemeshow, et al., 1982).
4.5 Electronic feedback to physicians
4.5.1 Overview
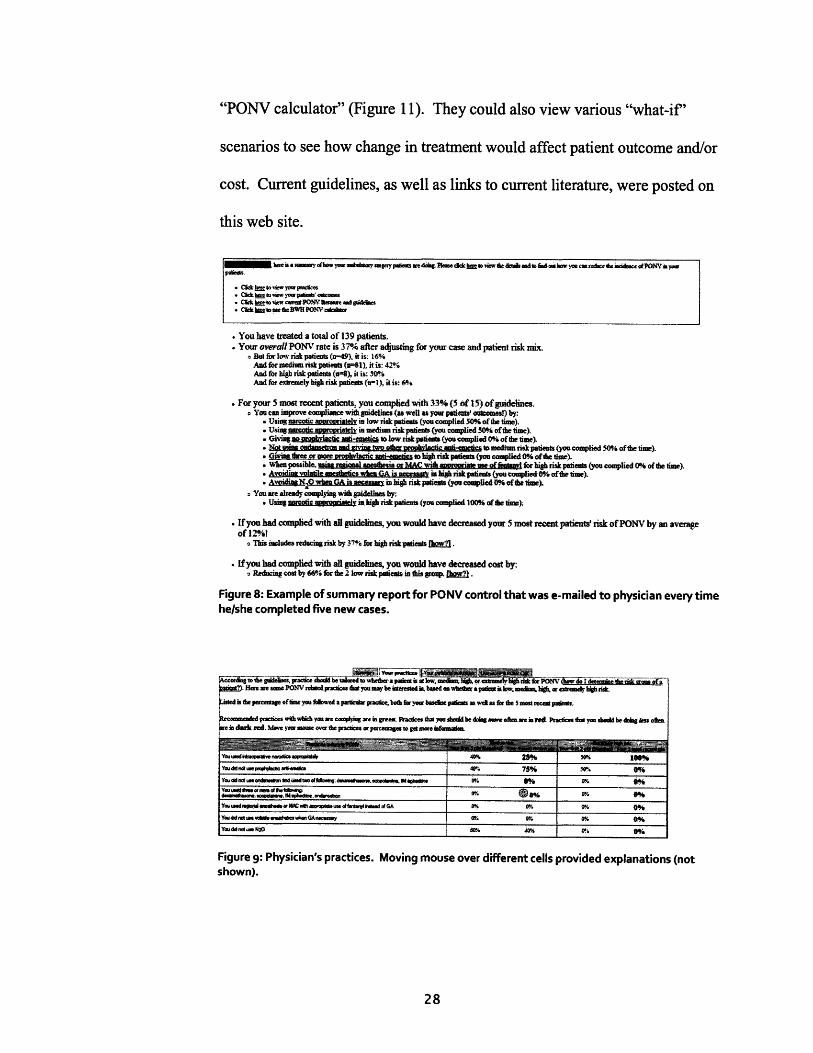
Two components were created to provide electronic feedback to physicians.
First, an electronic summary report displayed up-to-date statistics on a
physician's practices and patient outcomes as related to PONV control. These
individualized summary reports (Figure 8) were automatically e-mailed to the
physician every five patients he or she treated.
The next component created was a web site onto which physicians could login
to view details of their practices and patient outcomes (Figure 9-Figure 10).
Here, they could calculate the PONV risk of hypothetical patient using a
"PONV calculator" (Figure 11). They could also view various "what-if'
scenarios to see how change in treatment would affect patient outcome and/or
cost. Current guidelines, as well as links to current literature, were posted on
this web site.
hee a asnseory afm hayw oer iory sewarypoess we doet Plemase kw so viaew &e der d a id ns how you c rae the ideaceof PONV h yaw
C* Ck he ta xIew yw pract•ae•
* c rkkioreamedrePOfalaseV acieam r
" You have treated a total of 139 patients.SYour overall PONV rate is 37% after adjusting for your case and patient risk mix.
o But for low risk patieants (n49), it is: 16%And for medium risk paticns ( it81), it is: 42%And for high risk patients (r) it is: sW,%And for extremely high risk patients (Ua-), it is: 6%
" For your 5 most recent patients, you complied with 33% (5 of 15) of guidelines.o You can iaprove omopliance wittSid g es (as well as your patieas oucoans!) by:
. Using rcr amoriatel in low risk patients (you complied 50% of the time).
. Usig ra roriat~ in mediam ris patients (you complied 50% of the time).- G Tivi rafuic anti-em, to low risk poliaens (you complied 0% of the time),* Nl•as oa.mld r d iviar two t rtaiEiS Ianti-ms~ i medium risk paatiea (you complied 50% of the timae)SGivi tree or more op ic nMiC S mlai risk patients (you complied 0% ofe atim).When possible usia rseit ales ia or MAC awiiaaamodiaes uae of ha li fo hish risk patients (you complied 0% of te time).
* AAoi udiv ofleb ak s efa iGA a is lh igLh riskpalie~ls (you complied 0% of tim).SAvoidi N when GA is c~~arm in hil• risk ptials (you complied 0% ofsi ta time)You are already complying with guidelines by:
. Usi anutie mrria v iigh risk patients (you complied 100% of fie time).
* Ifyou had complied with all guidelines, you would have decreased your 5 most recent patients' risk of PONV by an averageof 12%1
o This nclades nlduciang risk b 37% for high riskplatieas fLI .
* Ifyou had complied with all guidelines, you would have decreased cost by:o Reducing cost by 66% for te 2 tlow risk patients in tis g oup.W Ih .
Figure 8: Example of summary report for PONV control that was e-mailed to physician every timehe/she completed five new cases.
......................................... ....... ......... ...... • •-- --. . . .• .. ,. ......... .................... R T -Kjacciewethe gikbe. piashall be tird wreds tr ha pales at low. mediono; hw or cadrgrtl&hoifor poi ~ IWddX asisCs s
p•giZ) Here are some PON rMeOaedracices t ou may beintrestediL based on whePthr apal is low medsm L or rcma iO rN*distedis the perce •age of tm you flwed a particulr pr e.bot h ur baselinre pients as we as for the 5 most rece paie .
Recommended pacices wt wlich you are compyi a gueei Pactices at yw shold be doing soreA we in re Pracices ay y sl oua be doeiag *s&otnie in dark red. Move your mase over ade pmces or pemnagese grt oe infmado
69 sac sa fVvtbe &C SAd Wsa padaess .kvsqdJ3(gj one pisslw makaissusbs chassisis t sheat &Z ssw 0w&P, = a0 hi*r CsF m i*"B sisk foC PONV, SWSi
toJ am &o sWs&ar6e pssatwi c=At t &sae preSda. One &Mtwd at BAN fir catin ambsrry suMr u Wds QymnmwrAepyDC tqmavcig yctgisabrosohrsosrebsqsods mi bappsonsas heetic ap arosncspseodslemocssess a l ihssisarapslss dsowssbslsw Zsmtsicdsoa poaihsaieeyssk fass.r -i ts ssp ef sosopy (r'ssoolssiosthseostkespin vagdieatqacrg cohdsq~rtuCogi heytaosm s bists sihe ismece~spse rai PCNV ina pflth
dss iswhss forbeat bossk facu msMeo Is. sop whh dscarw farsi psais ThsERhIDsyysls th M slnar*.lm pofnmsvsbpds ilMnsobsWa sg8 al 2 Ths4 ooysssbo kdpefsprbsbhte
-- o o t all
• oslo A% .i am~.i:.osbaodssflsdmmm.,•...m.•ae~•'•r
Q* r " " .. ...a. . m " I
Watsoawaas..oao
a*.
*
ausssnassaaobda
as as * as% sI "M V% UZ 5" "Weh, Wi*s as M s as 8s IMInk~ Room* ho -,A
1 Gan•T,, r- CaenaC e s Ma Pms;opu•el Nomesand Vo• AtAesaal,2003$7t*L [I
2 .ge w, ast The Usot ama mes~ahns Inouae MmqaS Sys • iolr edollsd aA mtidk esom TsleaS ts msm• S .Astm 2009 1234 1203(.kid
3 sq.&sflm&chEossi Assesufrfl qsjhflaydaesocg splmfarpssdoteqpenfper sefmesandoul Aussese4 2005. E0~pqne32393Ii hogg14 SehLR. at Rtoaomsl Aitr rofrlah adwWssbaonhapuwa Fm lkPliaellmes U AtranigAoiweyGnesotheog1pans AmestAes*1996A3S75-B1. kagI 0awT2 PcnsntopaeNesuoomi Vamle -Ca b BeElilmindd AMA 2O02;fl7(Wyi233-36. IsS
Figure ii: Online PONV risk calculator and current guidelines. The calculator automaticallycalculated risk based on patient risk factors as per the BWH PONV risk model. Current guidelineswere also listed.
29
TY, by 3% i1.
640.6
J,.,
4.5.2 Programming software
Both the summary report and web site were coded in Adobe ColdFusion 7
MX markup language, a server side programming language which
dynamically generates HTML. Apache web server was used to serve the web
page to a client side web browser. A combination of HTML, Javascript, and
AJAX technologies were used, as described below, to log actions on the web
site as well as verify that e-mails were read.
4.5.3 E-mail report
These reports contained information on the physician's PONV rate and
percentile, compliance with proposed recommendations, and anesthetic costs
(Figure 8).
Upon opening and closing of the e-mail message, a message was sent to the
server log and the amount of time spent reading the message was calculated.
This was accomplished by including a hidden link to an image on the web
server. Upon opening of the HTML formatted e-mail, the mail client fetched
the image from the server via a URL that included a unique token identifying
the user. The time this image was accessed and the ID of the user accessing it
were logged into the database. Furthermore, clicking on the links in the e-
mail message was also recorded and allowed differentiation of whether the
user logged in via e-mail link or directly onto the web site.
4.5.4 Web site
The web site allowed physicians to view details of their practices and patient
outcomes. The web site was divided into multiple tabs or sections. The first
section showed the physician his or her practices in a compact table (Figure
9). Moving the mouse over the column headers provided a tooltip containing
information about how to determine the risk group of the patient. Moving the
mouse over the row headers provided tooltips on each of the different
recommended practices. Tooltips on whether the practice should be practiced
more or less often appeared when the user placed the mouse over the cell
contents.
The next section of the web site showed the physicians their patients'
outcomes (Figure 10). It allowed them to view whether they followed the
recommended guidelines, if a patient had PONV, and, if he or she did,
whether the physician might have reduced the risk by following the
recommended guidelines. Furthermore, physicians could view details on
patient history factors to learn how to place patients in the appropriate risk
group. They could also view various "what-if' scenarios to see how changes
in treatment would affect patient outcome and/or cost.
The last section contained a PONV risk calculator and educational material
(Figure 11). The anesthesiologist could use the PONV risk calculator to
calculate any patient's risk for PONV by entering some patient history factors
and her intended anesthetic plan. The calculator used Javascript to calculate a
risk score and automatically convert this into a risk probability based on the
type of surgery to be performed. The related guidelines were automatically
highlighted when the user calculates a PONV risk. Furthermore, the PONV
calculator was displayed such that the anesthesiologist could print the page
out and calculate the score manually; in fact, copy of this page and the risk
calculator was distributed to all subjects receiving feedback in the study. The
section also contained literature on PONV and the recommended guidelines.
PDF copies of several review articles were available through links on the web
page.
All activity on the web site was logged and date/time stamped. Javascript was
used to send a message to the server each time the user logged in or out or
when the user moved from one section to another. This allows tracking of the
number of times the user used the web site, whether they logged in from the e-
mail or accessed the web site directly, and calculation of the amount of time
the user spent reading each section. Similarly, each use of the PONV risk
calculator was logged, as well as each access to a PDF article.
4.5.5 Evaluation
Evaluation of the electronic feedback components was conducted using a
before-after study design with a concurrent control group. An eight-month
evaluation phase was subdivided into three stages. The first stage involved
collecting data on PONV control practices and outcomes for four months,
without any feedback to any providers, on patients undergoing breast biopsies,
diagnostic laparoscopy, laparoscopic procedures, or herniorraphy, as
described before. These data provided a baseline of provider practices as well
as patient outcomes. Prior to the second stage, each subject was randomized to
an intervention or control group. For four months, individualized feedback on
(a) practitioner's practices, and (b) outcomes for all patients was provided to
the experimental group via the electronic feedback system described before.
The control group received no feedback. Once assigned to a group, the
subject remained in that group for the duration of the study.
Attending level BWH anesthesiologists treating ambulatory surgery patients
were identified from the Dept. of Anesthesiology staff lists for potential
inclusion in the study. No remuneration was provided. There was no age
restriction on subject enrollment and there was no inclusion or exclusion of
specific groups.
A research assistant collected all data on physician practices and patient
outcomes in real time from the medical record, i.e. anesthesia pre-operative
and intra-operative records, as well as post-operative nursing records. If
information was not complete, the assistant obtained the information from
either the physician or the nurse.
Only subjects who treated more than 40 patients during each stage of the
study were included in the analyses of provider behavior, as per a power
analysis done prior to study implementation (assuming a 25% absolute change
in behavior profile, alpha = 0.05, beta = 0.10).
Outcomes measured were (a) the number of times a physician accessed the
web site, (b) the amount of time spent on each section of the site, (c) the
number of articles downloaded from the web site, and (d) the number of times
the online PONV calculator was used.
Physician practices were also examined according to recommended
guidelines. The number and type of prophylactic anti-emetics given to low,
medium, high, and extremely high risk patients were examined. According to
currently accepted guidelines, low risk patients should have been given zero
prophylactic anti-emetics; medium risk patients should be given two
prophylactic anti-emetics, but not ondansetron; high risk and extremely high
risk patients should be given three or more prophylactic anti-emetics. The
average fentanyl dose used was also examined: less than 100 mcg fentanyl
should have been given to high and extremely high risk patients. Also, N20
should have been avoided in high and extremely high risk patients and and
inhalational agents avoided in extremely high risk patients.
The percentage of each subject's patients receiving appropriate therapy, as
determined by the patient's PONV risk stratification noted above was
calculated. This was averaged by the number of subjects in the group. An
unpaired t-test was done on the group percentage to look for any significant
change in average behavior pre- and post-intervention. The rate of use of
these different profiles, stratified by PONV risk status, was compared using a
ý2 test in order to determine if there was a behavior change between the time
periods.
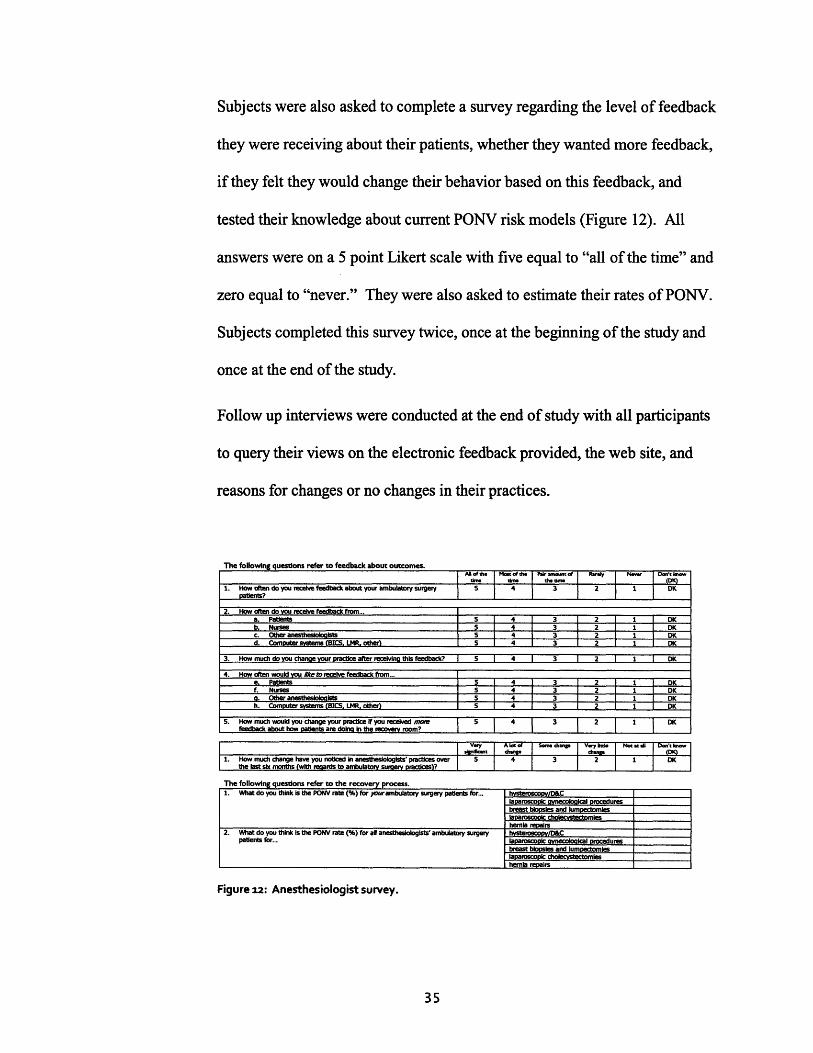
Subjects were also asked to complete a survey regarding the level of feedback
they were receiving about their patients, whether they wanted more feedback,
if they felt they would change their behavior based on this feedback, and
tested their knowledge about current PONV risk models (Figure 12). All
answers were on a 5 point Likert scale with five equal to "all of the time" and
zero equal to "never." They were also asked to estimate their rates of PONV.
Subjects completed this survey twice, once at the beginning of the study and
once at the end of the study.
Follow up interviews were conducted at the end of study with all participants
to query their views on the electronic feedback provided, the web site, and
reasons for changes or no changes in their practices.
The following questions refer to feedback about outcomes.
ANote cn th*eu of (DI &M I•K I I I O I1. How oRen do you receive feedback about your ambulatory surgery 5 4 3 2 1 DK
2. How oten do you receive feedback from...a. Patients 5 4 3 2 1 DKb. Nurses 5 4 3 2 1 DKc. Other anesthes ists 5 4 3 2 1 DKd. Computer systems BICSLM other 5 4 3 2 1
3. How much do you change your practice afer receiving this feedback? 5 4 3 2 1 I
4. How often would you keto receive feedback from...e. Patients 5 4 3 2 1 DKf. Nurses 5 4 3 2 1 DK. Other anesthesolosts 5 4 3 2 1
h. Computer syste (BICS LMR, other) 5 4 3 DK
5. How much would you change your practice if you received mowe 5 4 3 2 1 DKfeedback about how patients are doing n the room?
IV,• I Aikrf j Saadrrchar V.,,I Nwrat s Don't oI=I I= I•-r I I ( I1. How much change have you noticed In anesthesiologists' practices over 5 4 3 2 1 IDK
the last ski months (with regards to ambulatory surge ractices)?
The following questions refer to the recovery process.1. What do you think is the PONV rate () for urambulatory surgery patients for.. hysterscoy/D&C
laparoscopic aynecolooical proceduresbreast biopsies and lumpect•leslapamscopic choleCVstBctomieshernia repalrs
2. What do you think is the PONV rate (%) for all anesthesiologists" ambulabtory surgery hysteroscopy/D&Cpatients for... aparscoc qynecololcal procedures
breast biopsies and lumpectomleslaparoscopi cholecystectomleshernia repairs
Figure 12: Anesthesiologist survey.
5 Results
5.1 PONV risk models
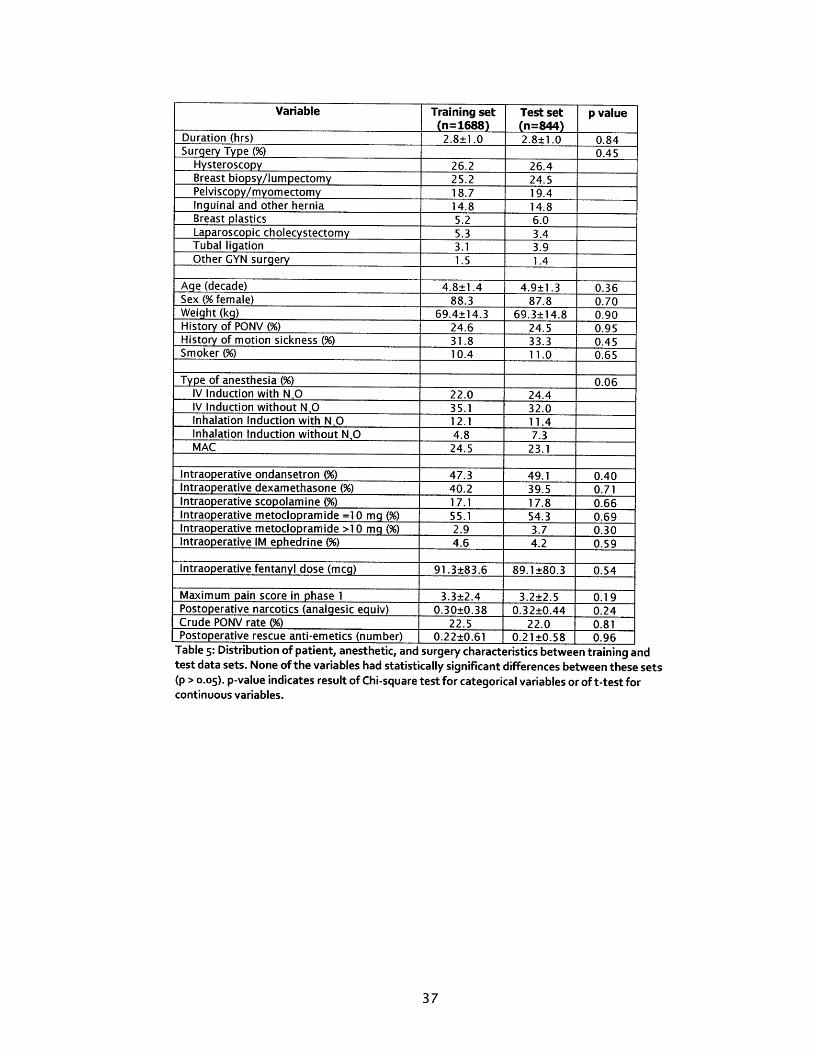
Data from 2498 patients were used in the model building and testing process. The
distribution of patient, anesthetic, and surgery characteristics was not significantly
different between the training and test sets and is shown in Table 5. The experimental
model ended up containing 10 input variables, including four patient history and
outcome factors, two surgical factors, and four anesthetic factors. Patient history and
outcome factors included: age, history of motion sickness, history of PONV, and
maximum pain score postoperatively. Surgical factors included duration of surgery
and type of surgery. Types of surgery found to have significant effect on PONV were
laparoscopic cholecystectomy and pelviscopy. Anesthetic factors found to have an
effect on PONV included: intraoperative fentanyl dose, intraoperative
dexamethasone use, intraoperative ondansetron use, and type of anesthetic performed
(e.g., IV versus inhalation induction and N20 use versus no N20 use). PONV was the
binary outcome variable in the model.
The final experimental model, its beta coefficients, and odds ratios are shown in
Table 6. The strongest patient history and surgical factors increasing risk are
laparoscopic cholecystectomy, history of PONV, pelviscopy, history of motion
sickness, and duration of surgery. Anesthetic factors increasing risk included the type
of anesthetic utilized, with inhalation induction increasing risk the most. Age and use
of prophylactic ondansetron or dexamethasone reduced PONV risk.
The new beta coefficients calculated for the refitted Apfel model (RAM) and for the
refitted Sinclair model (RSM) are shown in Table 7 and Table 8.
Variable Training set Test set p value(n=1688) (n=844)
Duration (hrs) 2.8±1.0 2.8±1.0 0.84Surgery Type (%) 0.45
Hysteroscopy 26.2 26.4Breast biopsy/lumpectomy 25.2 24.5Pelviscopy/myomectomy 18.7 19.4Inguinal and other hernia 14.8 14.8Breast plastics 5.2 6.0Laparoscopic cholecystectomy 5.3 3.4Tubal ligation 3.1 3.9Other GYN surgery 1.5 1.4
Type of anesthesia (%) 0.06IV Induction with NO 22.0 24.4IV Induction without NO 35.1 32.0Inhalation Induction with NO 12.1 11.4Inhalation Induction without NO 4.8 7.3MAC 24.5 23.1
Table 5: Distribution of patient, anesthetic, and surgery characteristics between training andtest data sets. None of the variables had statistically significant differences between these sets(p > o.o5). p-value indicates result of Chi-square test for categorical variables or of t-test forcontinuous variables.
Beta p-value Odds Ratio 95% CIcoefficient Estimate
Post-intervention, 57% stated that they rarely or never received feedback with an
increase in the Likert score of 2.43±0.53. Most still wanted more feedback.
However, there was no statistically significant difference between pre- and post-
intervention responses.
No significant difference in practice change was observed between groups. Absolute
differences pre- and post-intervention for each recommended best practice were
calculated for the control group and intervention group. For each practice, no
significant difference was noted between groups (Table 12).
Practice Pre/post change Pre/post changein control group in intervention
(%) group (0 )No prophylactic anti-emetics (AE) in low risk 12 9patients2+ AE, no ondansetron in medium risk patients 16 -313+ AE in high risk patients 4 23+ AE in extremely high risk patients -1 0Fentanyl <= 100 mcg IV in high risk patients 12 10Fentanyl <= 100 mcg IV in extremely high risk 13 10patientsNo NO in high risk patients -19 -3No NO in extremely high risk patients -17 -5No inhalational agent in extremely high risk 0 0patients
Table 12: Absolute change in number of practices complied with pre- and post- intervention.
Follow-up interviews querying for subjects' impressions of the electronic feedback,
the web site, and their reasons for not changing practice indicated several issues.
Many of the subjects thought viewing the web site took too much time and they were
too busy to use it on a regular basis. They felt they did not know where to look on the
web site to access information they wanted or the web site did not provide them with
the information they wanted. Some felt that residents often made decisions when
they were not around and, therefore, felt they were not always in control of practice.
One subject disagreed with the guidelines.
6 Discussion
6.1 PONV risk models
Preliminary analysis indicated that published models would not work for purposes of
this project. Their performance on data from BWH ambulatory surgery patients was
poor. Also, the models could not be used for the education of physicians because
they did not contain certain predictors. Therefore, data collected at BWH was used to
create a new PONV risk prediction model. This experimental model was tested
against several popular models and showed improved performance. A logistic
regression model was used even though other methods of machine learning may have
resulted in better predictive models. Physicians are familiar with logistic regression
models and the concept of "odds ratios" to determine how much of an effect a
variable has on the outcome. Furthermore, other models result in "black box"
formulas such that they often cannot be used for teaching purposes.
6.1.1 Experimental model developed
In our experimental model, history of PONV, history of motion sickness, age,
duration of surgery, type of surgery, intraoperative fentanyl dose,
intraoperative dexamethasone use, intraoperative ondansetron use, type of
anesthetic performed, and maximum pain score postoperatively were
determined to be independent predictors of PONV. Inclusion of these
variables is consistent with published studies as well as the other models.
One of the strongest predictors of PONV was the patient's history of prior
PONV (odds ratio of 2.65). Prior history of motion sickness resulted in a 1.5
increased risk of PONV. An increase in one decade of age resulted in slightly
decreased risk of PONV whereas longer duration of surgery increased the risk
of PONV.
Female gender did not appear in our model, even though female gender has
been well demonstrated as an important predictor of PONV (Cohen, et al.,
1994). This may be due to the composition of the data set such that 88% of
patients were female. With such a large percentage of female patients,
differentiation of risk between male and female patients may be difficult and
the risk may be incorporated into the baseline risk.
Several types of surgery found to have significant effect on PONV. Of these,
laparoscopic cholecystectomy increased the risk of PONV the greatest, with
an odds ratio of 3.2. Pelviscopy also increased risk and this is consistent with
literature (Gan, 2006).
Anesthetic factors found to have an effect on PONV included: intraoperative
fentanyl dose, type of general anesthetic performed (i.e., IV versus inhalation
induction and N20 use versus no N20 use), intraoperative dexamethasone use,
and intraoperative ondansetron use. Previous models have not differentiated
between intraoperative and postoperative doses of narcotics and most have
focused on long term narcotics such as morphine. Literature is controversial
on whether intraoperative narcotics actually increase risk whereas the most
current literature indicates that postoperative narcotic dose does correlate with
increased risk of PONV. Here, although there is a statistically significant
increase in PONV risk with intraoperative fentanyl use, an odds ratio of 1.002
indicates that risk is not increased greatly and this may not be clinically
significant. Furthermore, our model did not find that postoperative narcotics
are associated with increased risk.
Instead, a patient's postoperative pain was shown to be correlated with the
PONV risk. Here, the higher the maximum pain score (scale of 0-10, with ten
being the worst pain experienced) that a patient reported, the more at risk
he/she was for PONV (odds ratio of 1.1). Although some experts have
hypothesized that postoperative pain is associated with PONV (Chia, et al.,
2002) (Gan, 2006), it has been hard to separate out whether postoperative pain
or postoperative narcotic use is the cause of increased PONV. This is because
when the patient complains of pain postoperatively, he/she is treated with
narcotics.
It is reassuring that the type of anesthetic performed appeared to be associated
with PONV risk in our model. Recent studies indicate that exposure to
inhalation agent increases PONV risk (Apfel, et al., 2002) and many experts
advocate avoidance of inhalation agents for high risk groups (Gan, et al.,
2003) (Gan, 2006). In our model, we were able to differentiate between
different types of general anesthetic techniques that some have postulated may
increase risk but have not proven. For example, our model indicates that an
inhalation induction increases risk almost two-fold over an IV induction with
propofol. Exposure to nitrous oxide also seems to increase risk, but more for
patients who undergo IV induction rather than inhalation induction. This may
be due to the fact that an inhalation induction already increases the risk of
PONV. None of the previously published models break down risk by
anesthetic technique, something that can be controlled by the anesthesiologist.
As expected, prophylactic intraoperative use of dexamethasone and
ondansetron independently reduced risk of PONV. This risk reduction was
similar for each medication and is consistent with the 20-25% risk reduction
quoted in the literature (Apfel, et al., 2004) (Thomas, et al., 2001). Ours is the
first model to incorporate these variables and to demonstrate to physicians the
risk reduction resulting from their use after controlling for confounding
variables. Prophylactic use of scopolamine did not appear in the model. This
may be due to the fact that the outcome of PONV was only recorded for up to
time of discharge whereas scopolamine is thought to have more of an effect
on post-discharge nausea and vomiting. Use of either metoclopramide 10 mg
or metoclopramide IV 20 mg IV was not shown to affect PONV; this result is
consistent with literature that numbers needed to treat to prevent one case of
PONV with metoclopramide are very high (Henzi, et al., 1999).
Intramuscular ephedrine use did not appear in the model either, perhaps due to
the fact that only 4.4% of patients received this treatment and its efficacy
could not be determined with such low numbers of data points.
History of smoking did not appear in our model, even though it is well proven
to be associated with decreased risk of PONV. Like in the case of female
gender, this may be due to the patient population studied. Here, only 10.6%
of patients were smokers and, therefore, the risk associated with being a non-
smoker may be incorporated into the baseline risk rather than an independent
predictor.
6.1.2 Discrimination and calibration
The model developed in this project showed statistically significant improved
discrimination over the original Apfel model, the refitted Apfel score, the
simplified Apfel risk score, and the refitted Sinclair model. The Apfel
models, though often advocated for use because of their simplicity, are clearly
not applicable to the BWH ambulatory surgery patient population and may not
be applicable to other institutions' patients also. It is known that risk
prediction models often do not perform as well at institutions other than the
one where the model was developed. Performance results from this study of
the Apfel models are consistent with results at other validation centers (Apfel,
et al., 1999). Another reason for the Apfel models' poor performance may be
that the original models were developed using data from inpatients rather than
ambulatory surgery patients.
The original Apfel model, the refitted Apfel score, and the simplified Apfel
risk score all performed similarly and there was no statistically significant
difference between their performance. The original Apfel model had worse
calibration than the other two, as was to be expected. The simplified Apfel
risk score had good calibration for data at BWH because it classified patients
into only four quartiles.
The refitted Sinclair model had both good discrimination and calibration on
the BWH data. This can be explained by the fact that it was very similar to
the experimental model developed in the types of variables used. However,
the experimental model contained more detailed variables and contained
predictors that appeared in an aggregated form in the Sinclair model. For
example, the Sinclair model differentiates between patients who had general
anesthesia and those who did not. Our model also considers the contribution
of different techniques used to induce general anesthesia to the overall risk.
This may explain why our model provided better discrimination. It also
allows our model to be used for teaching purposes by demonstrating the
relative risks associated with certain anesthetic techniques.
6.2 Electronic feedback to physicians
Prior to intervention, most attending physicians enrolled in the study indicated that
they rarely or never received feedback. The rest indicated that they followed up on
their patients in the recovery room before the patients were discharged. All indicated
that they would like to receive more feedback about their patients' outcomes. They
even indicated that they would be willing to change their practice based on this
feedback.
Of interest is that anesthesiologists underestimated their patients' rate of PONV by an
absolute difference of 21-16%. This is consistent with some physicians' beliefs that
their patients did not have bad outcomes.
Given these data, it was expected that the anesthesiologists would access the
electronic feedback to learn more about their outcomes, educate themselves on
current literature, and possibly change their practices. Unfortunately, electronic
feedback to attending anesthesiologists did not result in change in practices. This
could be due to several factors.
First, it seems as physicians did not adequately use the site to look up their statistics.
Of the five people who received feedback e-mails, four looked at the web site at least
once. However, overall usage was quite low. Surprisingly, physicians always logged
in using the link in the e-mail and never logged in directly by accessing the web site
URL. This could be due to the fact that the physicians were not compelled enough to
review material on the web site consistently but the e-mail served as a reminder to
view the statistics.
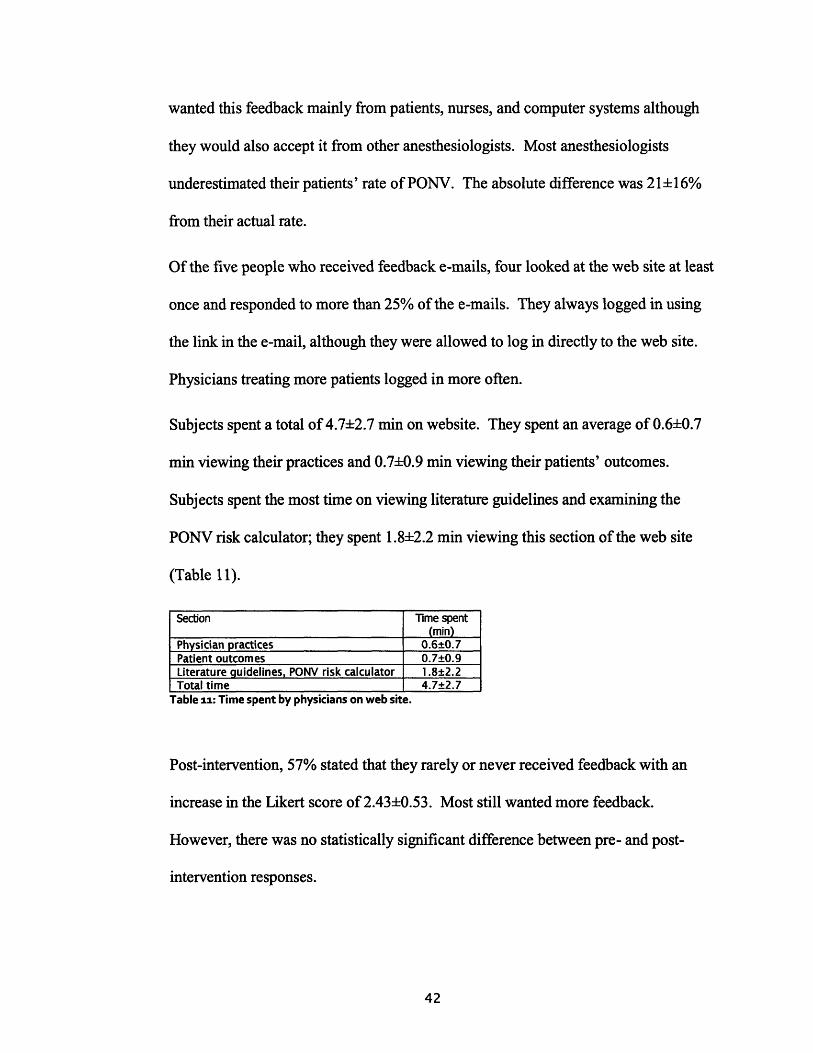
Once on the web site, subjects spent a total of 4.7±2.7 min looking at material on the
site. They spent almost 40% of this time viewing the section on literature guidelines.
This could be due to their trying to familiarize themselves with the guidelines.
Physicians spent an average of 0.6±0.7 min viewing their practices and 0.7±0.9 min
viewing their patients' outcomes.
Another reason for a lack of change in practices could be a lack of time on the
physician's part. Because all charting is paper based at BWH, it would take extra
time for the physician to access the web site and review material. For example, in
order to use the online PONV risk calculator, they would have to find a computer, log
into the computer, log into the web site, and then enter patient history factors to
calculate the risk score. This process could take upwards of two minutes.
Physicians treating more patients logged in more often. These physicians were
specialized ambulatory surgery anesthesiologists and the above fact may indicate
these physician's greater interest in their patients' well-being.
One additional reason for lack of use may have been that the site did not provide them
with the information they wanted. However, extensive feedback and testing was done
during creation of the web site to ensure the users would have easy access to the
information they preferred to see.
Lack of compliance by attending anesthesiologists could also be due to absence of a
requirement for them to use the system. Other studies have employed some
verification and compliance measure, such as reporting of the physician to the
department chairperson for non-compliance or publishing individual physicians'
compliances in public.
Follow-up interviews with the subjects substantiated some of the above reasons for
lack of change in practices by the subjects. Many of the subjects thought viewing the
web site took too much time and they were too busy to use it on a regular basis.
Some indicated that they did not know where to look on the web site to access
information they wanted to see.
One other reason several anesthesiologists provided was that they felt that residents
often made decisions when they were not around and, therefore, felt they were not
always in control of practice. They felt that they should provide residents with the
freedom to decide on a different anesthetic plan or that the residents would give
patients medications without prior discussion with the attending. Some of the
physicians who did not regularly practice ambulatory anesthesia felt that PONV was
51
not an important patient outcome that warranted a change in their practice. One
subject disagreed with the guidelines. He indicated that he did not believe that
several of these measures would change the outcome.
The responses of these follow-up interviews provide good insight into the difficulties
of implementing an electronic feedback system. Although most physicians want
feedback on patient outcomes and educational literature, they are less open to a
system that provides protocol based care or appears to dictate patient care. Combined
with the extra work required to use the system since it is not at the "point-of-care," an
electronic system is difficult to implement without a formal requirement or
compliance measure.
7 Conclusions
This study's primary objective was to develop and evaluate a sustainable electronic peri-
operative patient outcomes feedback system for its effectiveness in increasing
anesthesiologist compliance with best care practices. We selected PONV in ambulatory
surgery patients as the best care practice to implement and evaluate for the demonstration
system.
In the process of developing such a system, we instituted an informatics infrastructure at
the BWH Department of Anesthesiology as well as developed and evaluated a new,
improved PONV risk prediction model. This new risk prediction model is the first to
incorporate certain anesthetic practices as predictors. It was developed specifically for
the ambulatory surgery patient population and clearly performs better than existing
models.
The electronic system we developed monitored provider practice of multi-modal PONV
control regimens as well as patient outcomes, and it provided anesthesiologists with
information on their practices and their patients' outcomes. This system was evaluated
through a prospective study examining physician practicing behavior.
Although no significant change in provider practice behavior was noted, examination of
reasons for this lack of change provided useful insight on how to improve compliance
with best practices. In addition to providing physicians with data and guidelines,
compliance should be actively enforced and physicians need to be constantly reminded
about their compliance. Any future system should be integrated into the physician's
workflow and at the "point-of-care" to minimize additional burden on the provider.
Future work will focus on validating the new BWH PONV risk prediction model at
outside institutions and integrating the electronic feedback system into clinicians'
workflow to improve compliance. Other outcomes, such as compliance with
perioperative antibiotic guidelines and beta-blocker therapy, will be examined for
incorporation in risk prediction models as well as for use in future iterations of the
electronic feedback system.
AcknowledgementsI would like to thank Drs. Lucila Ohno-Machado and Sunil Eappen for their mentorshipand guidance, without which this work (and development of my career) would not havebeen possible. Dr. Ohno-Machado provided excellent teaching and advice during myinformatics training and has been very supportive of my educational and clinicalinformatics endeavors. Likewise, Dr. Eappen has provided much support and guidanceon this research study as well as my clinical projects in the Department ofAnesthesiology.
In addition, I would like to thank Dr. Robert Greenes for accepting me and supporting mywork in the biomedical informatics program at the Decision Systems Group.
Finally, a note of appreciation to my DSG classmates, Drs. Michael Blechner andMichael Matheny, with whom I brainstormed and survived coursework.
This research was supported in part by grant T15-LM-07092 from the National Library ofMedicine of the National Institutes of Health and by funding from the Brigham &Women's Hospital Department of Anesthesiology, Perioperative and Pain Medicine.
8 Bibliography
1. Apfel CC [et al.] A Factorial Trial of Six Interventions for the Prevention ofPostoperative Nausea and Vomiting [Journal] // New England Journal ofMedicine. - 2004. - 24 : Vol. 350. - pp. 2441-2451.
2. Apfel CC [et al.] A simplified risk score for predicting postoperative nausea andvomiting [Journal] // Anesthesiology. - 1999. - Vol. 91. - pp. 693-700.
3. Apfel CC [et al.] Comparison of predictive models for postoperative nausea andvomiting [Journal] // Br J Anaes. - 2002. - 2: Vol. 88. - pp. 234-240.
4. Apfel CC [et al.] Volatile anaesthetics may be the main cause of early but notdelayed postoperative vomiting: a randomized controlled trial of actorial design[Journal] // British Journal of Anaesthesia. - 2002. - 5 : Vol. 88. - pp. 659-668.
6. Chia YY [et al.] Does postoperative pain induce emesis? [Journal] // ClinicalJournal of Pain. - 2002. - 5 : Vol. 18. - pp. 317-323.
7. Cohen MM [et al.] The postoperative interview: assessing risk factors for nauseaand vomiting [Journal] // Anesth Analg. - 1994. - 78. - pp. 7-16.
8. Cohen MM, Rose DK and Yee DA Changing Anesthesiologists' PracticePatterns: Can it be done? [Journal] // Anesthesiology. - 1996. - 2 : Vol. 85. - pp.260-269.
9. DeLong ER, DeLong DM and Clarke-Pearson DL Comparing the areas undertwo or more correlated receiver operating characteristic curves: A nonparametricapproach [Journal] // Biometrics. - 1988. - Vol. 44. - pp. 837-845.
10. Domino KB [et al.] Comparative efficacy and safety of ondansetron, droperidol,and metoclopramide for preventing postoperative nausea and vomiting: a meta-analysis [Journal] // Anesth Analg. - 1999. - Vol. 88. - pp. 1370-1379.
11. Gan T [et al.] Consensus guidelines for managing postoperative nausea andvomiting [Journal] // Anesth Analg. - 2003. - Vol. 97. - pp. 62-71.
12. Gan T [et al.] How much are patients willing to pay to avoid postoperativenausea and vomiting? [Journal] // Anesth Analg. - 2001. - Vol. 92. - pp. 393-400.
13. Gan TJ Risk Factors for Postoperative Nausea and Vomiting [Journal] // AnesthAnalg. - 2006. - Vol. 102. - pp. 1884-1898.
14. Habib AS and Tong J Evidence-based management of postoperative nausea andvomiting: a review [Journal] // Can J Anesth. - 2004. - 4 : Vol. 51. - pp. 326-341.
15. Hanley J.A. and McNeil B.J. A method of comparing the areas under receiveroperating characteristic curves derived from the same cases [Journal] //Radiology. - 1983. - Vol. 148. - pp. 839-843.
16. Hanley JA and McNeil BJ The meaning and use of the area under a receiveroperating characteristic (ROC) curve [Journal] // Radiology. - 1982. - 1 : Vol.143. - pp. 2 9-36.
17. Henzi I, Walder B and Tramer MR Metoclopramide in the prevention ofpostoperative nausea and vomiting: a quantitative systematic review ofrandomized, placebo-controlled studies [Journal] // British Journal ofAnaesthesia. - 1999.- 5 : Vol. 83.- pp. 761-771.
18. Koivuranta M [et al.] A survey of postoperative nausea and vomiting [Journal] //Anaesthesia. - 1997. - Vol. 52. - pp. 443-449.
19. Lemeshow S and Hosmer DW A review of goodness of fit statistics for use inthe development of logistic regression models [Journal] // American Journal ofEpidemiology. - 1982. - 1 : Vol. 115. - pp. 92-106.
20. Lobach DF and Hammond W Computerized Decision Support Based on aClinical Practice Guideline Improves Compliance with Care Standards [Journal] //Am J Med. - 1997. - 1 : Vol. 102. - pp. 89-98.
21. McQuay H and Moore R Postoperative analgesia and vomiting, with specialreference to day-case surgery: a systematic review [Report]. - 1998.
22. Moiniche S A Qualitative and Quantitative Systematic Review of PreemptiveAnalgesia for Postoperative Pain Relief [Journal] // Anesthesiology. - 2002. - Vol.96. - pp. 725-41.
23. Overdyk FJ let al.] Individualized outcome feedback produces voluntaryantiemetic prescribing practice changes [Journal] // J Clin Anes. - 1999. - 1 : Vol.11. - pp. 17-23.
24. Palazzo M and Evans R Logistic regression analysis of fixed patient factors forpostoperative sickness: a model for risk assessment [Journal] // Br J Anaesz. -1993. - Vol. 70. - pp. 135-140.
25. Palazzo M and Strunin L Anesthesia and emesis. I. etiology [Journal] // CanAnaesth Soc J. - 1984. - Vol. 31. - pp. 178-187.
26. Pavlin D Pain as a Factor Complicating Recovery and Discharge AfterAmbulatory Surgery [Journal] // Anesth Analg. - 2002. - Vol. 95. - pp. 627-34.
27. Philip B [Interview]. - 2006.28. Philip B The Economic Impact of Opioids on Postoperative Pain Management
[Journal] // J Clinical Anes. - 2002. - Vol. 14. - pp. 345-364.29. Pierre S let al.] A risk score-dependent antiemetic approach effectively reduces
postoperative nausea and vomiting - a continuous quality improvement initiative[Journal] // Canadian Journal of Anesthesiology. - 2004. - 4 : Vol. 51. - pp. 320-325.
30. Rose DK, Cohen MM and Yee DA Changing the Practice of Pain Management[Journal] // Anesth Analg. - 1997. - 4 : Vol. 84. - pp. 764-772.
31. Sandrick K Waiting on Clinicians to Catch Up [Journal] // Health ManagementTechnology. - 1998. - 2 : Vol. 19. - pp. 32-34.
32. Sarin P and Philip B Postoperative Pain Control in Day Surgery Patients: Canwe be doing better? [Conference] // ASA. - Atlanta : [s.n.], 2006.
33. Shiffman RN [et al.] Computer-based Guideline Implementation Systems: asystematic review of functionality and effectiveness [Journal] // J Am Med InformAssoc. - 1999. - Vol. 6. - pp. 104-114.
34. Shtatland ES, Kleinman K and Cain EM Stepwise Methods in Using SASPROC LOGISTIC [Conference] // SUGI. - [s.l.] : SAS. - 258-28.
35. Sinclair D, Chung F and Mezei G Can postoperative nausea and vomiting bepredicted? [Journal] // Anesthiology. - 1999.- Vol. 1.- pp. 109-118.
36. Stomberg MW [et al.] Postoperative Pain Management on Surgical Wards: Doquality assurance strategies result in long-term effects on staff member attitudesand clinical outcomes? [Journal] // Pain Management Nursing. - 2003. - 1 : Vol.4. - pp. 11-22.
37. Thomas R and Jones N Prospective randomized, double-blind comparative studyof dexamethasone, ondansetron, and ondansetron plus dexamethasone asprophylactic antiemetic therapy in patients undergoing day-case gynaecologicalsurgery [Journal] // British Journal of Anaesthesia. - 2001. - 4 : Vol. 87. - pp. 588-592.
38. Tramer MR A rational approach to the control of postoperative nausea andvomiting: evidence from systematic reviews. Part I. Efficacy and harm ofantiemetic interventions, and methodological issues [Journal] // Acta AnaesthesiolScand. - 2001. - Vol. 45. - pp. 4-13.
39. Van den Bosch JE [et al.] Asessing the applicability of scoring systems forpredicting postoperative nausea and vomiting [Journal] // Anaesthesia. - 2005. -Vol. 60. - pp. 323-331.
40. Wachter RM Making Health Care Safer: A critical analysis of patient safetypractices [Report]. - [s.l.] : Agency for Healthcare Research and Quality, 2001. -Publication 01-E058.
41. Watcha M The cost-effective management of postoperative nausea and vomiting[Journal] // Anesthesiology. - 2000. - 4 : Vol. 92. - p. 931.