70
LDC Issues for Operationalisation of the SAARC Food Bank Nepal Case Study SAWTEE Working Paper No. 01/12

LDC Issues for Operationalisation of the SAARC Food Bank Nepal Case Study
SAWTEE Working Paper No. 01/12

LDC Issues for Operationalisation of the SAARC Food Bank
Nepal Case Study
SAWTEE Working Paper No. 01/12
South Asia Watch on Trade, Economics and Environment (SAWTEE)
26 Mamata Galli P.O. Box: 19366 Tukucha Marg
Baluwatar Kathmandu Nepal
Tel: 977-1-4444438 / 4424360
Fax: 977-1-4444570
Email: [email protected]
Web: www.sawtee.org
Views expressed in SAWTEE working papers are of the author(s) and do not necessarily reflect the official position of SAWTEE or its member institutions. SAWTEE working papers often represent preliminary work and are circulated to encourage discussions. This publication has been issued without formal editing.

Acknowledgement
I am highly grateful to South Asia Watch on Trade, Economics and Environment
(SAWTEE) for providing me this opportunity of conducting Nepal case study under LDC
Issues for Operationalization of the SAARC Food Bank. I am highly thankful to Dr.
Ratnakar Adhikari, Chief Executive Director, SAWTEE and Puspa Sharma, Programme
Coordinator for entrusting me for this interesting assignment and providing valuable
comments on the draft report.
I gratefully acknowledge the help of policy makers from Ministry of Commerce and
Supplies, and from Nepal Food Corporation for providing necessary data and information
for conducting this study. I am highly thankful to experts with whom I consulted during
the study with special mention to Dr. Sudarshan Bhakta Mathema. I am also thankful to
the discussants and participants of the Regional Seminar on Emerging Issues on Trade,
Climate Change and Food Security: Way Forward for South Asia, 31 May – 1 June 2012,
Colombo, Sri Lanka, for their valuable insights helping me to revise the paper.
I would like to express my sincere gratitude to Dr. Posh Raj Pandey, President, SAWTEE
for finding my experience suitable for this assignment.
I would like to thank all the respondents who provided information to this study.
Krishna Prasad Pant, Ph. D.
Kathmandu 20 June 2012
i

ii
Table of Content
Acknowledgement .....................................................................................................................i
1. Introduction ....................................................................................................................... 1
1.1 Background................................................................................................................... 1
1.2 Context of the study..................................................................................................... 1
1.3 Objectives of the study ........................................................................................... 4
1.4 Methodology ................................................................................................................ 5
1.5 Limitations of the study ............................................................................................... 5
1.6 Organization of the study ............................................................................................ 5
2. Status and trends in Food Availability.............................................................................. 5
2.1 Food production ........................................................................................................... 6
2.2 Agricultural investment............................................................................................. 10
2.3 Food insecurity ........................................................................................................... 15
2.3.1 Food insecurity in Nepal .................................................................................. 16
2.3.2 Food insecurity at regional and district level.................................................. 21
2.4 Public Food Distribution System .............................................................................. 25
3. Challenges and opportunities of public distribution system ......................................... 34
3.1 Opportunities of PDS ................................................................................................. 34
3.2 Challenges of PDS ...................................................................................................... 35
4. Commitments for SAARC Food Bank and Issues on its Operationalization................ 37
4.1 Mechanisms to link the national food distribution system with the SAARC Food
Bank .................................................................................................................................. 39
4.2 Critical appraisal of SAARC Food Bank from Nepal‘s perspectives ........................ 39
4.2.1 Inadequate Food Reserve ................................................................................. 39
4.2.2 Qualifying for drawing from Food Reserve .................................................... 40
4.2.3 Procedure for drawing from the reserve......................................................... 41
4.3 Discussions on operational issues .............................................................................. 42
5. Summary .......................................................................................................................... 44
6. Recommendations ........................................................................................................... 44
6.1 Recommendations at national level......................................................................... 45
6.1.1 Nepal government .................................................................................................... 45
6.1.2 Local governments in Nepal..................................................................................... 45
6.1.3 Nepal Food Corporation ........................................................................................... 46
6.2 Recommendations at regional level......................................................................... 46
6.2.1 Member governments .............................................................................................. 46
6.2.2 SAARC Food Bank Board ......................................................................................... 47
6.2.3 SAARC Secretariat .................................................................................................... 49

iiiiiiiii
References ............................................................................................................................... 50
Annexes 55
List of Tables
Table 1: Key indicators of South Asian LDCs (2009) .............................................................. 3
Table 2: Major cereal production in SAARC countries in 2010 (‗000 metric tons) .............. 7
Table 3: Production of cereals, potato and pulses in Nepal during last 25 years (‗000
metric tons)...................................................................................................................7
Table 4: Agriculture loan outstanding at the end of year 2009/10 ...................................... 14
Table 5: Loan outstanding from ADBL in agriculture sub-sectors....................................... 14
Table 6: Foodgrain self-sufficiency in last two decades (1,000 metric tons) ....................... 19
Table 7: Food trade (1000 metric tons) 2010/11.................................................................... 20
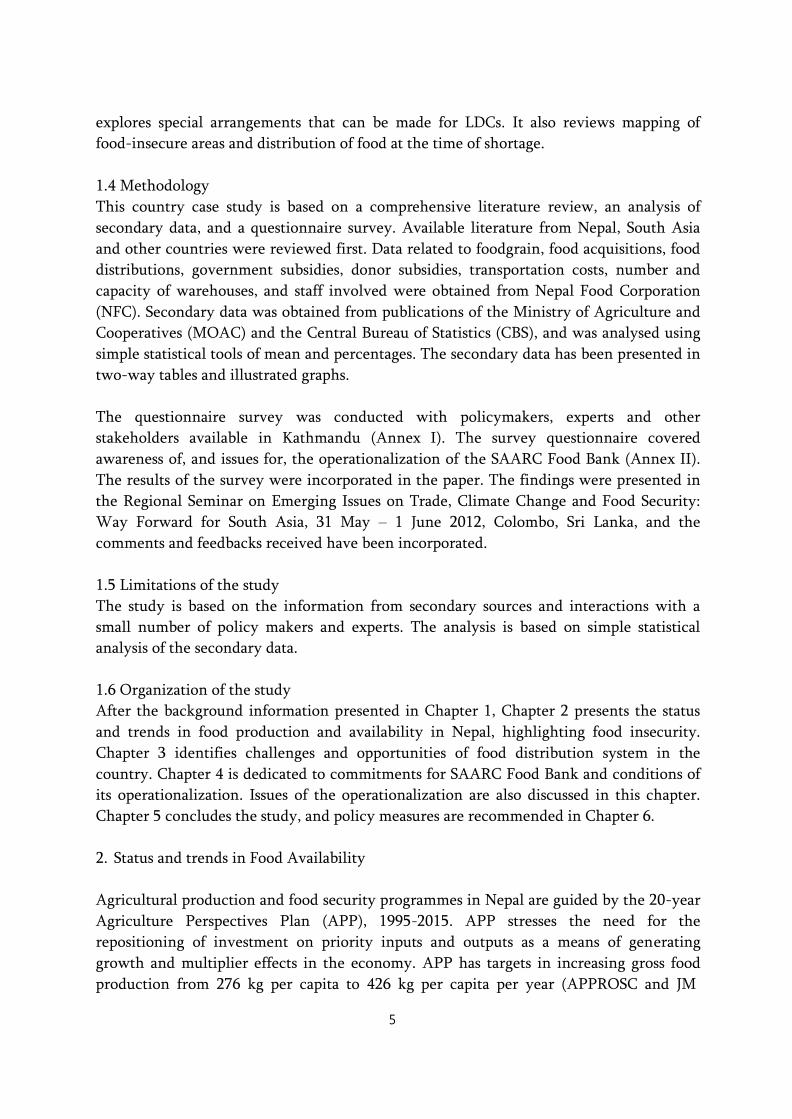
Table 8: Regional distribution of sales of foodgrain by NFC (metric tons) ......................... 29
Table 9: Foodgrain quota (proposed) and transportation costs (2011/12) ........................... 30
Table 10: NFC national buffer stock and SAARC Food Bank (‗000 metric tons) ............... 33
Table 11: Food balance sheets of South Asian countries and comparison with SAARC
Food Bank (‗000 metric tons) ................................................................................................. 40
List of Figures
Figure 1: Global hunger index in South Asian Countries....................................................... 3
Figure 2: Annual fluctuations in the production of major cereals ......................................... 8
Figure 3: Annual fluctuations in the production of potato and pulses................9
Figure 4: Public expenditure in agriculture in a decade (current price) ............................ 10
Figure 5: Public expenditure in irrigation during the last decade (current price) .............. 11
Figure 6: Foreign aid in agriculture (current price) .............................................................. 11
Figure 7: Foreign aid in irrigation (current price) ................................................................ 12
Figure 8: Public expenditures in agriculture and irrigation (at 2000/01 price)................... 12
Figure 9: Percent budget allocation in agriculture and contribution to GDP..................... 13
Figure 10: Contribution of different crops in cereal basket ................................................. 16
Figure 11: Production of foodgrain (edible portion)............................................................. 17
Figure 12: Foodgrain production and requirement .............................................................. 18
Figure 13: Surplus of the foodgrain by physiographic regions............................................. 22
Figure 14: Food requirement and production in 2009/10 .................................................. 233
Figure 15: Food requirement and production in 2010/11 .................................................. 233
Figure 16: District food self sufficiency ............................................................................... 244
Figure 17: Locations and capacity of warehouses ............................................................... 266
Figure 18: Foodgrain purchase and sales by NFC over decades ......................................... 277
Figure 19: Number of warehouses and their capacity utilization ...................................... 288
Figure 20: Efficiency of NFC measures in terms of handling costs.................................... 288
Figure 21: Foodgrain sold NFC in different areas ............................................................... 299
Figure 22: Transportation cost per kg of grain for different districts .................................. 32

iviviv
Figure 23: Buffer stock and SAARC Food Bank at different locations .............................. 333
Figure 24: Subsidies on food transportation and interest subsidies on food reserve......... 377
Figure 25: Foodgrain, rice and wheat production as percent to the three year average .... 41
Figure 26: Coordination for operation of SAARC Food Bank............................................ 488
Abbreviations and acronyms
ADBL Agriculture Development Bank Limited
ADB Asian Development Bank
APP Agriculture Perspective Plan
BIMSTEC Bay of Bengal Initiatives for Multi-Sectoral, Technical and Economic
Cooperation
CBS Central Bureau of Statistics
CDP Committee for Development Policy
EVI Economic Vulnerability index
GAFSP Global Agriculture and Food Security Programme
GATT General Agreement on Tariffs and Trade
GDP Gross Domestic Product
GNI Gross national income
HAI Human Assets Index
KR Kennedy Round
LDC Least developed countries
MDG Millennium Development Goal
MOAC Ministry of Commerce and Supply
MOF Ministry of Finance
NAP National Agriculture Policy
NASDP National Agriculture Sector Development Priority plan
NeKSAP Nepal Food Security Monitoring System
NFC Nepal Food Corporation
ODA Official development assistance
OECD Organization for Economic Cooperation and Development
SAARC South Asian Association for Regional Cooperation
SAFTA South Asian Free Trade Area
SAPL Second Agriculture Program Loan
SAWTEE South Asia Watch on Trade, Economics and Environment
SFDB Small Farmer Development Bank
UN United Nations
US$ United States Dollar
WTO World Trade Organization

v
Executive Summary
This report presents a Nepal case study for Regional Least Developed Countries (LDCs)
Study commissioned by SAWTEE under its Trade, Climate Change and Food Security
Programme in collaboration with Oxfam Novib. The objectives of the study are to analyze
the status and trends in agricultural productivity, investment, and food security in Nepal, as well as the status and trend in Nepal‘s Public Distribution System. The study identifies
challenges and opportunities for an effective food distribution system, and also suggests
policy measures for enhancing access to the food distribution system, including that from
the SAARC Food Bank. The methodologies followed were a review of literature, an
analysis of secondary data on food production, trade and public distribution, and a
questionnaire survey of policy makers and experts.
Among the eight members of South Asian Association for Regional Cooperation
(SAARC), half of the members - Afghanistan, Bangladesh, Bhutan and Nepal - are Least
Developed Countries (LDCs). Nepal has a predominantly agrarian economy with about
3.2 million hectares of agricultural land. Within Nepal, 77 percent of the 5.66 million
households are engaged in agriculture. As per the government statistics, Nepal has had
food deficit for 13 of the last 22 years. During this period, the food deficit was five
percent or less, except during 1992/93, 1994/95, and 2009/10, when, due to severe
droughts and floods, the deficit was higher. The statistics show that in case of a severe
drought, Nepal can face food deficit of 300 to 500 thousand metric tons. However, the
national food buffer stock is just 25 thousand metric tons. Thus, there is a need for
provisions to be made for outsourcing in the event of future adverse conditions. Net food
production in the year 2010/11 was 5,513 thousand metric tons and the net import was
332 thousand metric tons. The public distribution system operated by Nepal Food
Corporation (NFC) distributed 20 thousand metric tons of foodgrain in the same year.
NFC, with 159 warehouses in 63 districts, distributes foodgrain, (mainly to 23 remote
districts via the aid of government subsidy. It seems that the role of NFC in food supply is
small as compared to its role in production and trade.
Agriculture is suffering from low investment and low productivity. Public investment in
agriculture is mainly to cover operating expenses, and the capital expenditure is less than
one billion rupees per year. The contribution of foreign aid is also small, at about half a
billion rupees per year. Agriculture has failed to attract private sector investment
adequately. The total loan advanced to the agricultural sector is Rs 23 billion. However,
most of the capital investment, foreign aid and credit money go to non-food crops, as the
government policy has focused on high value cash crops in lieu of traditional foodgrain.
As a result, crop productivity is low with only 3.3 and 1.9 metric tons of rice and wheat
produced per hectare.
The public distribution system (PDS) gives an opportunity to strengthen food security

vi
through supply management. The supply management includes the provision of buffer
stock of essential food commodities for controlling price rise and market stabilization.
The PDS involves several challenges. It involves a large budget, high risks, and a large
number of human resources and infrastructure. Buying food, storing it, transporting it to
deficit areas and distributing it, involves large costs. The public sector is less efficient than
the private sector. Because foodgrain are semi-perishable it involves high risks of storage
damage, adding to the handling costs; a large number of human resources are necessary
for the buying, storing, transportation and distribution of foodgrain. With the
functioning of the PDS, there is also the danger of replacing the food market in sensitive
areas, by creating uncertainty among private food suppliers. The PDS also discourages
farmers from growing food locally, as the distribution of subsidized food dampens local
food price, diminishing the incentive to grow food. This creates chronic dependency of
the villages on food aid. It is also believed that distribution of subsidized rice leads to
malnutrition and loss in crop biodiversity. The PDS sometimes also politicizes the food
supply, making the local people more vulnerable.
For increasing food security in South Asia through collective action, the 14th SAARC
summit in Islamabad in 2007 established the SAARC Food Bank, based on 20 years of
bitter experience of non-functional SAARC Food Reserve. The Bank is expected to act as
a regional food security reserve for the member countries during food shortages and
emergencies, as well as provide regional support to national food security efforts, foster
inter-country partnerships and regional integration, and solve regional food shortages.
The Bank holds 485.6 thousand metric tons of rice and wheat, with 306 thousand metric
tons in India, 80 thousand metric tons in both Pakistan and Bangladesh, 8 thousand
metric tons in both Nepal and Sri Lanka, 2.84 thousand tons in Afghanistan, 0.40 metric
tons in Maldives, and 0.36 metric tons in Bhutan. The reserve is the asset of the respective
members and is under the control of the SAARC Food Bank Board located in the SAARC
Secretariat, Kathmandu. Nepal‘s share of the reserve is maintained by the NFC.
Though the SAARC Food Bank was established in 2007, it is not yet operationalised. The
Bank, if properly operationalised, is expected to contribute enormously in addressing food
insecurity in the region. No specific mechanism is yet developed for linking the Bank to
the PDS operated by the NFC. NFC officials are not currently provided with the
information and plans necessary for empowering them to mobilize the food from the
Bank at the time of need. The PDS of Nepal can be strengthened and linked to the
SAARC Food Bank, not only for maintaining the reserve, but also for the
operationalization of the Bank; whereby the PDS helps by distributing the foodgrain
released from the Bank, and replenishing the stock during the next harvesting season.
Considering an annual fluctuation of the food production, Nepal needs to maintain a
national food reserve of five percent (250 thousand metric tons) of its annual
consumption. Increasing access to the Bank can reduce the amount needed for the

national reserve, reducing the costs of maintaining a large buffer stock.
Food withdrawal from the Bank is possible only when there is emergency or food
shortage. The necessary condition for a food shortage is that the production of foodgrain
in the current year is lower by eight percent than the average of production of the
previous three years. Analyzing the food production data shows that Nepal would never
have qualified for this condition during past two decades, as the shortfall in the
production of foodgrain was not more than 6.31 percent. Even after meeting this
condition, foodgrain within the country can be withdrawn only after three months from
the date of the notice. If a member needs foodgrain from the reserve of another member,
no clearly specified provision is available for food transportation, border formalities,
institutional mechanisms, and price setting for swift delivery of foodgrain.
The SAARC Food Bank Board has the authority to revise procedures and mechanisms for
food withdrawals. The Board needs to authorize Nodal Points of the member countries,
which have the authority to decide and draw foodgrain from their own reserves,
immediately at the time of need. The Board needs to establish an automatic set of
mechanisms for the pricing, releasing, transporting, border crossing and distributing of
foodgrain, at any time when a member feels that its people are suffering from food
insecurity.
Though small countries and LDCs are more vulnerable to food insecurity, no special
provision is made under the SAARC Food Bank for such countries. The LDCs have low
level technology base, from which to increase food production and adapt to the shocks of
natural calamities that are being accentuated by climate change. Recognizing the
problems of smaller economies and low level of development, the importance of regional
collective actions for ensuring food security is greater in LDCs.
PDS of the member countries in LDCs need to be empowered and strengthened in order
to allow the withdrawal of food at the time of need, and its quick distribution to food-
insecure, remote, rural and vulnerable areas. A built in mechanism is necessary to avail
food from the Bank at reasonable price. For food distribution, food coupons and food
credit cards can be used in some extreme cases, and food distribution also needs to be
linked to credit system through consumer cooperatives, fair price shops and food depots.
The NFC needs to be reoriented and strengthened to assume new responsibility of
effective food distribution. For efficient distribution of foodgrain in food insecure areas,
PDS can also be linked to local level institutions, such as the local governments, or local
charity organizations. Such decentralization is necessary at the time when Nepal is
leading towards federal states. PDS can also be linked to self-help groups or local
institutions working for food security. The government needs to implement PDS by
developing targeted programs for the identified food insecure regions and groups.
vii

1
LDC Issues for Operationalisation of the SAARC Food Bank
Nepal Case Study
Krishna Prasad Pant
1. Introduction
1.1 Background
This Nepal case study is a part of Regional Least Developed Countries (LDCs) study
commissioned by SAWTEE under its Trade, Climate Change and Food Security1
Programme with Oxfam Novib. It empirically analyses the status and trends in food
production, availability and agricultural investment, and assesses the impact of such
trends on food insecurity, at both national and local levels. The study also delineates
public food distribution system in Nepal and its challenges and opportunities. Likewise, it
assesses policies and programmes for fair distribution of food, and effective
operationalization of the SAARC Food Bank, assessing their current and potential impact
on reducing the risk of food insecurity among the poor within the country.
1.2 Context of the study
South Asia houses 330 million undernourished2 people accounting for 40 percent of the
world‘s undernourished (World Bank 2006; FAO 2011). Some 578 million people are
undernourished in Asia Pacific accounting to 62 percent of the global number (FAO
2010). In response to chronic food insecurity, at least in some parts of the countries,
governments in South Asia have tried to implement several policy measures that help
them, which includes among others, policies designed to help maintain and increase
national food reserves. The governments have also adopted other measures like reducing
taxes on foodgrain, increasing supply using foodgrain stocks, export restrictions, price
controls and consumer subsidies. Recognizing the importance of a coordinated approach
to addressing food insecurity, SAARC countries have emphasized the importance of
maintaining regional foodgrain reserves.
The Istanbul programme of Action for the LDCs for the decade 2011-2020 proposed joint
actions for exploring the feasibility, effectiveness, and administrative modalities of a
system of food stockholding as a means of dealing with humanitarian food emergencies,
or as a means to price volatility (United Nations 2011). The Istanbul policies have targets
of ensuring access to safe food and emergency food assistance in all LDCs.
1Food security is a situation that exists when all people, at all times, have physical, social and economic access to
sufficient, safe and nutritious food that meets their dietary needs and food preferences for an active and healthy life
(World Food Summit—Rome—Declaration 1996).
2 Undernourishment or hunger exists when caloric intake is below the minimum dietary energy requirement (MDER)
for light activity and to maintain a minimum acceptable weight for attained height (FAO, 2012).

2
LDCs are low-income countries facing structural impediments to sustainable
development. The income is measured in terms of gross national income (GNI) per capita.
The structural impediments to sustainable development include low level of human
development and structural vulnerability to shocks. The low income and structural
constraints are interconnected with social, economic and environmental problems,
leading to low standard of living, which in some severe cases manifested by hunger and
malnutrition.
Nepal is one among the 48 LDCs in the world. The UN added Nepal to this list in 1971.
The UN identified the LDCs in terms of their low GNI, weak human assets, and high
degree of economic vulnerability. Under the GNI criterion, three-year average estimate of
the GNI per capita is taken for comparison. Human resource weakness criterion involves
a composite Human Assets Index (HAI)3 based on indicators of nutrition, health,
education and adult literacy. Similarly, the economic vulnerability criterion is based on
indicators of the instability of agricultural production; the instability of exports of goods
and services; the economic importance of non-traditional activities (share of
manufacturing and modern services in GDP); merchandise export concentration; and the
handicap of economic smallness (United Nations 2008). To be included in the list of
LDCs, a country should have population less than 75 million; GNI per capital less than
$750; HAI less than 55; and an Economic Vulnerability index (EVI) greater than 37.
Among the eight SAARC member countries, 50 percent of them fall in the list of LDCs4—
Afghanistan, Bangladesh, Bhutan and Nepal. Maldives graduated from its former LDC
status in January 2011. To be included in the list of LDCs, a country must satisfy all three
criteria. To qualify for graduation, a country must meet the thresholds for two of the
three criteria in two consecutive triennial reviews carried out by the UN Committee for
Development Policy (CDP)5. Afghanistan meets all four indicators to be a LDC. Other
three remaining LDCs meet two out of four indicators. Nepal qualifies for LDC status in
terms of its population and income.
Nepal is the second poorest country in South Asia, after Afghanistan, in terms of per
capita gross national income (GNI) (Table 1). However, Nepal has the second highest
human asset index (after Bhutan) and the second lowest economic vulnerability index
(after Bangladesh) among the South Asian LDCs. The economic vulnerability index,
however, does not capture the climatic vulnerability in which Bangladesh is most
susceptible. Moreover, a hunger index is not incorporated as an indicator of an LDC.
3 The HAI is calculated as the simple average of the component indices—Index of child mortality rate, index of
prevalence of undernourishment in the population, index of adult literacy rate and index of gross enrolment in
secondary education. The original component data are transformed into indices between 0 and 100 (Korachais, 2011). 4 http://www.un.org/esa/policy/devplan/profile/ldc_list.pdf
5 www.un.org/special-rep/ohrlls/ldc/ldc%20criteria.htm

3
Country Population
(million)
Per capita gross national
income (GNI) (US$)
Human
Asset Index
(HAI)
Economic
Vulnerability Index
(EVI)
Afghanistan 28.22 301 15.2 39.5
Bangladesh 161.32# 453 53.3 23.2#
Bhutan 0.67 1487# 58.6# 52.9
Nepal 28.76 320 58.3# 33.6#
Table 1: Key indicators of South Asian LDCs (2009)
Note: # Do not qualify to be a LDC. Source: United Nations, 2009
The Global Hunger Index (GHI) of 2011, shows hunger to be lowest in Sri Lanka (14.0
percent) followed by Nepal (19.9 percent), Pakistan (20.7 percent), India (23.7 percent),
and highest in Bangladesh (24.5 percent)6. Bangladesh, Nepal, and Sri Lanka have made
appreciable improvement in the area of hunger during last two decades (Figure 1).
However, GHI data is not available for Afghanistan, Bhutan and Maldives.
Figure 1: Global hunger index in South Asian Countries 45.0
40.0
35.0
30.0
25.0
20.0
15.0
10.0
5.0
0.0
Bangladesh
India
Pakistan
Nepal
Sri Lanka
1990 (with data from
1988-
92)
1996 (with data from
1994-
98)
2001 (with data from
1999 -
2003)
2011 (with data from
2004 -
2009)
Data Source: www.ifpri.org/book-8018/node/8058
Poverty and food insecurity are undeniable problems in Nepal. Above 25 percent of the
population exist below the national poverty line of Rs. 19,261 per capita per annum in
2010-11 prices. The food poverty line is Rs. 11,929, and the non food poverty line Rs.
7,332 (CBS 2011a). Inadequate food production by farmers, low levels of income with
which to buy sufficient food, and a limited public food distribution system (PDS) are the
major reasons of food insecurity among the poor. Child malnutrition is among the highest
in the world, with 42 percent of children under five years of age stunted, 31 percent
underweight, and 14 percent wasted (CBS 2011b).
6 http://www.ifpri.org/book-8018/node/8058

4
PDS for food is operationalised by Nepal Food Corporation (NFC) under the Ministry of Commerce and Supplies (MOCS). The NFC purchases foodgrain from farmers and traders
in the Terai region during harvesting season, and sells them to food deficit hill and
mountain districts, with the aid of transportation subsidy from the government. The size of NFC‘s operation is limited by the size of transportation subsidy provided by the
government. The NFC maintains a national food buffer stock of 25,000 metric tons and
the SAARC Food Bank reserve of 8,000 metric tons.
The SAARC Food Bank, established in April 2007, is an improved version of its non-
functional predecessor—the SAARC Food Reserve—established in 1988. There is an
immediate need to make the Food Bank operational and effective. Issues of foodgrain
pricing, operational guidelines and delivery systems need to be tackled to make the Food
Bank operational. The effective operationalization of the Bank may constitute a first step
in building an efficient regional response mechanism to food inflation in South Asia
(Carrasco and Mukhopadhyay 2012). It is still not clear whether the SAARC Food Bank
can be operational in a manner which helps to reduce the vulnerability of South Asian
poor from food insecurity. This study is commissioned to explore ways to operationalise
the Food Bank in order to help the poor in Nepal, and reduce hunger and malnutrition.
1.3 Objectives of the study
The country case study explores the status and trends in agricultural productivity,
agricultural investment and food security at both the national, sub-national and district
levels; particularly at remote, rural, inaccessible and vulnerable regions. It also identifies
the challenges and opportunities for an effective food distribution system. It analyses the
efficiency of the policies and programmes in enhancing access to food, and ensuring its
fair distribution.
In addition, the study also explores the commitments from the government to
operationalise the regional food bank. It analyses the stakeholders take on this issue,
nationally and locally, with regard, for example, to coverage of food items, storage and
withdrawal conditions, pricing mechanisms, and replenishment of the stock. The study
discusses the question of which policy and institutional mechanisms are necessary for the
regional food bank to be accessible to poor people in food-insecure, remote, rural, and
vulnerable areas. It also examines the public food distribution system, and its suitability
for linking with the regional food bank, strategically and institutionally.
On the question of institutions, this paper argues for the need for governments to
implement national and decentralized distribution systems, with certain institutional
arrangements at the community level. It examines how the pricing mechanism can be
implemented under the Food Bank mechanism. The study explores the question of how
those countries with an immediate need can be assisted to benefit from the system, and
5
explores special arrangements that can be made for LDCs. It also reviews mapping of
food-insecure areas and distribution of food at the time of shortage.
1.4 Methodology
This country case study is based on a comprehensive literature review, an analysis of
secondary data, and a questionnaire survey. Available literature from Nepal, South Asia
and other countries were reviewed first. Data related to foodgrain, food acquisitions, food
distributions, government subsidies, donor subsidies, transportation costs, number and
capacity of warehouses, and staff involved were obtained from Nepal Food Corporation
(NFC). Secondary data was obtained from publications of the Ministry of Agriculture and
Cooperatives (MOAC) and the Central Bureau of Statistics (CBS), and was analysed using
simple statistical tools of mean and percentages. The secondary data has been presented in
two-way tables and illustrated graphs.
The questionnaire survey was conducted with policymakers, experts and other
stakeholders available in Kathmandu (Annex I). The survey questionnaire covered
awareness of, and issues for, the operationalization of the SAARC Food Bank (Annex II).
The results of the survey were incorporated in the paper. The findings were presented in
the Regional Seminar on Emerging Issues on Trade, Climate Change and Food Security:
Way Forward for South Asia, 31 May – 1 June 2012, Colombo, Sri Lanka, and the
comments and feedbacks received have been incorporated.
1.5 Limitations of the study
The study is based on the information from secondary sources and interactions with a
small number of policy makers and experts. The analysis is based on simple statistical
analysis of the secondary data.
1.6 Organization of the study
After the background information presented in Chapter 1, Chapter 2 presents the status
and trends in food production and availability in Nepal, highlighting food insecurity.
Chapter 3 identifies challenges and opportunities of food distribution system in the
country. Chapter 4 is dedicated to commitments for SAARC Food Bank and conditions of
its operationalization. Issues of the operationalization are also discussed in this chapter.
Chapter 5 concludes the study, and policy measures are recommended in Chapter 6.
2. Status and trends in Food Availability
Agricultural production and food security programmes in Nepal are guided by the 20-year
Agriculture Perspectives Plan (APP), 1995-2015. APP stresses the need for the
repositioning of investment on priority inputs and outputs as a means of generating
growth and multiplier effects in the economy. APP has targets in increasing gross food
production from 276 kg per capita to 426 kg per capita per year (APPROSC and JM

6
Associates 1995). On average 63 percent of gross foodgrain is edible and with this in
mind, the APP target of 426 kg per capita would lead to the production of 268 kg of
edible foodgrain per capita—much higher than the domestic need. Indeed, the per capita
annual requirements of edible foodgrain are 191 kg for those in the mountain region, 201
kg for those in the hilly region, and 181 kg for those in the Terai (IDL Group 2006).
However, Nepal is lagging far behind the APP target of improving food security and
generating food surplus through increased production. The annual per capita edible
foodgrain production declined from 198 kg in 1990/91 to 186 kg in 2008/09 (NPC 2011a).
The National Agricultural Policy (NAP) (2004) aims to increase food production in the
country, with the primary goal of attaining food security and improving the livelihoods of
the farmers. It seeks to achieve this, by in part, encouraging a transformation from
subsistence agriculture, towards a commercialized and competitive system. It has a
unique provision of encompassing earlier policies, such as the National Seed Policy (2000)
and National Fertilizer Policy (2002), and providing a basis for developing other
commodity specific detail policies under its framework such as the Agribusiness
Promotion Policy (2006), the Agriculture Bio-diversity Policy (2007), and the Poultry
Policy (2012).
The food security issue is also addressed by the National Agriculture Sector Development
Priority plan (NASDP) (2011-2015), developed on the basis of NAP 2004. NASDP‘s,
number one priority is to enhance food and nutrition security and safety. The expected
improvements of the plan includes an increase in productivity and production, an
ensured access to sufficient and safer food for the poor and vulnerable groups, a
strengthened food distribution system, and a stronger emergency preparedness, response,
and recovery support in order to minimize the extent of vulnerabilities (MOAC 2010a).
Similarly, the Three Year Plan (2010/11-2012/13) developed on the basis of the NASDP,
has the major objective of ensuring food and nutrition security with increased food
production and productivity. It also aims to reduce poverty through agricultural
production, and to minimize adverse effects of climate change on agriculture (NPC
2011b). It is evident that the public policies are mainly focused towards food production,
rather than towards food access, utilization and stability for food security.
2.1 Food production
In 2010, SAARC countries produced 186 million metric tons of paddy, 111 million metric
tons of wheat and 20 million metric tons of maize. (Table 2). The highest contribution
came from India, which produced 65 percent of paddy, 73 percent of wheat and 68
percent of maize. The second highest producers were Bangladesh for paddy and Pakistan
for wheat and maize. Nepal contributed only 2.16 percent in paddy, 1.40 percent in wheat, and 8.98 percent in maize. Thus, Nepal was South Asia‘s third largest producer of
maize, and fourth largest producer of rice and wheat. Though foodgrain production is
slowly increasing in this region, the year to year fluctuation is very high due to high

7
Paddy Wheat Maize
Afghanistan 672 (0.36) 4,532 (4.08) 301 (1.46)
Bangladesh 49,355 (26.50) 901 (0.81) 887 (4.29)
Bhutan 62 (0.03) 4 (0.00) 55 (0.27)
India 120,620 (64.76) 80,710 (72.70) 14,060 (68.05)
Maldives 0 (0.00) 0 (0.00) 0 (0.00)
Nepal 4,024 (2.16) 1,557 (1.40) 1,855 (8.98)
Pakistan 7,235 (3.88) 23,311 (21.00) 3,341 (16.17)
Sri Lanka 4,301 (2.31) 0 (0.00) 162 (0.78)
Total 186,268 (100) 111,015 (100) 20,662 (100)
Year Paddy Maize Millet Wheat Barley Potato Pulses
1985/86 2804.49 873.75 137.94 598.00 23.43 356.72 NA
1990/91 3502.16 1230.95 231.63 835.97 27.84 738.03 NA
1995/96 3578.83 1331.06 282.44 1012.93 41.34 898.35 NA
2000/01 4216.47 1484.11 282.85 1157.87 30.49 1313.72 243.24
2005/06 4209.28 1734.42 290.94 1394.13 27.79 1974.76 267.45
2010/11 4460.28 2067.52 302.69 1745.81 30.24 2508.04 318.36
dependency of agriculture on weather conditions. As food production in South Asia is
growing slower than expected, Thimphu Declaration of 16th SAARC Summit (2010)
emphasized the need for the reduction of food insecurity through increased production.
Table 2: Major cereal production in SAARC countries in 2010 (‗000 metric tons)
Notes: Figures in parentheses are percent to the total production in the region. Source: FAOSTAT, 2010.
Nepal is a LDC member of the SAARC, which has a predominantly agrarian economy
with about 3.2 million hectares of agricultural land and 77 percent of households engaged
in agricultural production. Although only about 21 percent of land area is used for
agriculture, agriculture is the major determinant of economic activities and the nation‘s
socio-political identity (NSAC 1998). The agricultural sector contributes 35 percent to
gross domestic product, and provides employment to 65 percent of the labour force
(MOAC 2010). Though 77 percent of the households in Nepal are engaged in agricultural
production, a large proportion of the labour force from these households has moved away
from agriculture in order to earn cash income.
Table 3: Production of cereals, potato and pulses in Nepal during last 25 years (‗000 metric
tons)
Source: MOAC 2011
In Nepal, production of major cereals, potatoes and pulses has increased over the years.
During the last 25 years, the highest increases in production have been obtained in potato

8
Prod
uctio
n in
thou
sand
met
ric
ton
s
1984
/85
1986
/87
1988
/89
1990
/91
1992
/93
1994
/95
1996
/97
1998
/99
2000
/01
2002
/03
2004
/05
2006
/07
2008
/09
2010
/11
(603 percent) and the lowest in barley (29 percent) (Table 3). The production of maize,
millet and wheat has more than double. The production of the main staple crop –paddy-
increased by 59 percent during the same period. Among the cereals, paddy contributes
the most, followed by maize and wheat. The contribution of millet and barley are very
small. Though potato makes large contribution in food, it is only used as staple in
mountain region and t is used as a vegetable in other regions.
Though the production of all the cereals has increased over the years, fluctuations in
production from year to year are still evident, and are most noticeable in the production
of paddy and wheat. Indeed, paddy production fell between 1986/87, 1992/93, 1994/95,
2006/07 and 2009/10, due to droughts during growing season (Figure 2). Similarly, wheat
production dipped during 1992/93 and 2008/09, due to prolonged drought during winter
season, other cereal production fluctuated less.
Figure 2: Annual fluctuations in the production of major cereals
5000
4500
4000
3500
3000
2500
2000
1500
1000
500
0
Paddy
Maize
Wheat
Millet
Barley
Data Source: MOAC 2011
Potato production has increased sharply, touching the level of 2500 thousand metric tons,
with little fluctuations (Figure 3). Some decreases in production are found in the year
1985/86, 1997/98, and 2006/07. Little fluctuation is seen in pulse production during the
last decade. This is explained by the fact that the pulse production is taken as an aggregate
production of lentil, chickpea, pigeon pea, black gram, grass pea, horse gram, soybean and
other.
Agricultural production is especially effective in reducing hunger in Nepal. Agriculture
not only increases the food supply, but also reduces poverty directly by raising farm
incomes, and indirectly, by providing employment and reducing food prices in the
market. In addition, the agricultural production continues to be a major source of raw
materials, provides a means for value addition - generating further employment and plays

9
Prod
uctio
n in
thou
sand
met
ric to
ns
1984
/85
1986
/87
1988
/89
1990
/91
1992
/93
1994
/95
1996
/97
1998
/99
2000
/01
2002
/03
2004
/05
2006
/07
2008
/09
2010
/11
a vital role in increasing the affordability of food.
Figure 3: Annual fluctuations in the production of potato and pulses
3000
2500
2000
1500
1000
500
Potato
Pulses
0
Source: MOAC 2011
Though food production in the country has increased over the years, rising demand for
foodgrain due to the rise in population has worsened the problem of food insecurity,
particularly among the rural poor in areas with poor transportation facilities.
Limited availability of arable land and low level of productivity are the major reasons of
food deficiency in Nepal. The average farm size is 0.7 ha, although this is normally
fragmented into 3.3 parcels (CBS 2011). Low crop productivity can be attributed to the
problems of less productive land, low levels of modern inputs use, large fractions of
rainfed lands (46 percent), inadequate infrastructure, and poor access of the farmers to
technological services. The National Agriculture Policy (2004) and Three Year Plan
(2011-2014) both emphasize the need for high value commercial crops to replace at least
some of the food crop areas. In terms of food security related output indicators, the plan
has set target levels of increasing food crop production by 23 percent, pulse production by
6 percent, fruit production by 10 percent, potato production by 9 percent, vegetable
production by 20 percent, milk production by 19 percent, and meat production by 16
percent (NPC 2011b). Such ambitious targets in food production are for reducing food
insecurity in the country. To eradicate extreme poverty and hunger (related to MDG-1),
the plan has emphasized the need for improved productivity, market linkage
development, rural employment promotion, improved food distribution arrangement,
and targeted food assistance. The low productivity of traditional agriculture, limited
opportunities for its commercialization, and limited opportunities for off-farm and non-
farm employment opportunities has caused the absence of 1.9 million youths (population
census 2011), mainly due to their migration for foreign employment (CBS 2011). A large
portion of the remittance is used by the women, children and elderly left at home for the
purpose of buying food. Such low productivity and inadequate food production are

10
Publ
ic e
xpen
ditu
re in
Agr
icul
ture
Rs b
illio
n
attributed to low investment in agriculture. Remittance-fuelled consumption, rather than
investment has been a main driver to achieving the MDG goals, and as a consequence,
competitiveness has been eroded (IMF 2011).
2.2 Agricultural investment
Public expenditure in agriculture is increasing. In 1998/99 expenditure (at current price)
totalled Rs 2.02 billion, and increased to Rs 6.6 billion by the year 2009/10. The increase
was however predominantly due to an increase in current expenditure, which was 80
percent during 1998/99, and increased to 90 percent in 2009/10. Indeed, during this
period, the current expenditure increased from Rs 1.7 billion to Rs 5.95 billion. As the
current expenditures are expenses on goods and services that are consumed within the
current year, such expenditures are made recurrently to sustain the production of
agricultural services in the country. Such expenditures do not increase the productive
capacity of the agriculture sector. The capital expenditure that is utilized in order to
increase productive capacity is still very low, failing to rise above one billion rupees,
except in a couple of years following the peace agreement of 2006 (Figure 4). It is clearly
visible that the priority of the state during the conflict period was diverted away from the
agriculture.
Figure 4: Public expenditure in agriculture in a decade (current price)
7.0
6.0
5.0
4.0
Current
Capital
3.0
2.0
1.0
0.0
Data source: MOF, 2011
The public expenditure in irrigation reached Rs 8.65 billion in 2009/10 from Rs 3.05
billion in the year 1998/99. In irrigation, by nature, the capital expenditure is much
higher than the current expenditure. The current expenditure ranges from eight to
twenty percent. The capital expenditure, which decreased during the conflict period, has
increased continuously after the peace accord in 2006, rising to Rs 8.0 billion in 2009/10
(Figure 5).

11
Publ
ic ex
pend
iture
in ir
rigat
ion
Rs b
illio
n Fo
reign
aid
in ag
ricul
ture
(Rs m
illion
)
Figure 5: Public expenditure in irrigation during the last decade (current price)
9.0
8.0
7.0
6.0
5.0
4.0
3.0
2.0
1.0
0.0
Capital
Current
Data source: MOF, 2011
With regard to agricultural development, the government has a policy to obtain as much
foreign aid as possible. The foreign loan and aid together in agriculture remained
generally less than Rs one billion per year, in current price, except in pre-conflict and
post conflict periods. During the decade of conflict (1996 to 2006) foreign aid in
agriculture was low (Figure 6). Compared to aid, the amount of foreign loans invested in
agriculture is much higher, with higher level of fluctuations.
Figure 6: Foreign aid in agriculture (current price)
2500
2000
L oan
Grant
1500
1000
500
0
Data source: MOF, 2011
The foreign aid in irrigation was much lower during the eighties and then increased
successively, with some fluctuations, till 2000/01. Since 2000/01, the amount of loan
decreased drastically, whereas the grant maintained its trend with exceptions in the year
2001/02 and 2006/07 (Figure 7). After the peace accord in 2006, both loan and grant are

12
Fore
ign ai
d in
irriga
tion
(Rs m
illion
)
improving, but the improvement in loan is much slower than the improvement in grant.
In the year 2009/10, the total foreign aid in irrigation was Rs 2.02 billion.
Figure 7: Foreign aid in irrigation (current price) 3000
2500
2000
L oan
Grant
1500
1000
500
0
Data source: MOF, 2011
Public expenditures in agriculture and irrigation in real terms are presented in Figure 8.
In real price, the investment in agriculture over a decade has been bimodal. There was a
peak in the year 2000/01, and again in 2007/08. Between these two modes, the public
expenditures in agriculture and irrigation declined, although the amount of foreign aid
was still lower than public expenditures. The decrease in the agricultural expenditure was
both due to internal and external causes. Indeed, the internal resources were diverted to
containing conflict, and the external foreign aid was often loaded with conditionalities.
The Second Agriculture Program Loan (SAPL) from the Asian Development Bank was
conditional upon the structural adjustment program that, in 1995/96 pushed the
government to discontinue subsidies in fertilizers and irrigation. The conditionalities led,
not only to a decline in the use of chemical fertilizers, but also to a decline in the use of
ground water, particularly in establishing deep tube, and shallow tube wells.
Consequently the use of chemical fertilizers and establishment of tube wells decreased. As
these were the priority inputs proposed by the APP for generating growth in agriculture,
the implementation of APP, formulated with technical assistance of ADB almost failed.
Limited internal resources, loan conditionalities and policy instability within Nepal have
all contributed to ensure a decrease in investment in the agriculture sector during the last
decade. In turn this has meant that the potential of the country to produce food and high
value crops has been unexploited. The expenditure in the agricultural sector (including
agriculture, irrigation and forestry) was nearly 11 percent in the year 1998/99, but this
decreased to 6.5 percent by the year 2004/05. Although it has slightly improved, reaching
7.1 percent in the year 2009/10. This budget is much lower as compared to the
contribution of agriculture to gross domestic production (GDP), which was 35 percent
during the same year (Figure 9).

13
Perc
ent t
o tot
al bu
dget
and
GDP
In
vest
men
t in
Rs b
illio
n
1998
/99
1999
/00
2000
/01
2001
/02
2002
/03
2003
/04
2004
/05
2005
/06
2006
/07
2007
/08
2008
/09
2009
/10
Figure 8: Public expenditures in agriculture and irrigation (at 2000/01 price)
6.0
5.0 Irrigation Government
4.0
3.0
Agriculture Government
2.0 Irrigation Foreign aid
1.0
0.0
Agriculture Foreign aid
Data source: MOF, 2011
Figure 9: Percent budget allocation in agriculture and contribution to GDP
45
40
35 AGDP
30
25 Total e xpe nditure
20 Irrigation
15
10 Agric ulture
5
0 Fore stry
Source: MOF, 2011
Low expenditure in agriculture and an open access for imports of agricultural products at
very low tariff, particularly from India, has caused undue pressure on the livelihood of
the farmers and has led to the migration of the labour force away from agriculture. Investment in agriculture has become particularly unattractive within Nepal‘s private
sector, and investment has been diverted into other sectors of the economy, particularly
real estate and housing. The housing boom, in turn, has led to a process of urban sprawl
which has eaten away at precious farmlands, decreasing food production.
Private investment is fundamentally important for agricultural development and food
production. However, no systematic data is available on private investment in the

14
Source Outstanding loan (Rs
billion)
1 Commercial banks 14.29
2 Agriculture Development Bank Limited 5.37
3 Small Farmers Development Bank 1.12
4 Agricultural cooperatives* 2.38
5 Milk, fruit & vegetable, tea, coffee, beekeeping
cooperatives*
0.15
Total 23.31
Purpose of loan Outstanding loan (Rs
billion)
% to total outstanding
loan in agriculture in
2010/11 2009/10 2010/11
1 Crop and crop services 2.24 2.79 53.66
2 Tea and coffee 0.22 0.08 1.61
3 Livestock and livestock related 1.29 1.24 23.86
4 Forestry 0.03 0.02 0.43
agriculture sector. Credit from financial institutions is taken as a proxy for private sector
investment in agriculture. The major sources of agricultural credits are commercial banks,
Agriculture Development Bank Limited (ADBL), Small Farmer Development Bank
(SFDB) and agricultural cooperatives. The outstanding loan of commercial banks in the
agriculture sector at the end of year 2009/10 was Rs 14.29 billion (Table 4). During the
same year, ADBL had Rs 5.37 billion of outstanding loan in the agriculture sector. But,
the contribution of SFDB and agricultural cooperatives is much smaller. Though Micro-
Finance Development Banks and Rural Development Banks had loans and advances to
the tune of Rs 11.11 billion in the same year, no information is available about what
portion of this goes to the agricultural sector.
Table 4: Agriculture loan outstanding at the end of year 2009/10
Note: * Total investment Source: MOF, 2011; MOAC 2010.
The banks instituted for lending to agriculture has diverted the loans to other sectors of
the economy. Investment was primarily diverted to real estate and then to housing (IMF
2011). Out of the Rs 40.4 billion outstanding loan of ADBL, only Rs 5.2 billion (12.88
percent) was invested in the agricultural sector at the end of fiscal year 2010/2011 (Table
5). This outstanding loan divided by the cultivated area in the country comes to an
average loan of Rs 1,683per ha. More than half of this loan goes to crops and crop services
(52.66 percent), followed by livestock and livestock related activities (23.86 percent). In
addition, there is no data on what percent of the agricultural loans are diverted to other
purposes.
Table 5: Loan outstanding from ADBL in agriculture sub-sectors

15
5 Irrigation 0.04 0.03 0.64
6
Other agricultural and agro
services
1.56
1.03
19.80
7 Total in agriculture 5.37 5.20 100
8
Total outstanding loan of
ADBL
39.58
40.37
Source: ADBL, 2011
The low level of public expenditure, foreign aid, and private investment in agriculture has
led to a dwindling of research and technology generation, and a poor delivery of
technology extension services from the public sector. This has resulted in low levels of
entrepreneurship in the private sector. The declining trends of global funding on
agriculture and rural development are also reflected in the country programs of donors.
The gross disbursement of the official development assistance (ODA) for agriculture was
12.9 percent in 2002, and declined to 2.9 percent in 2010. In this period, the assistance to
food crop production always remained at less than one percent (please see the figures
from Creditor Reporting System database of the OECD in Annex VII). Increasing
population, higher food price and climate change, add to the challenges of increasing food
production. The situation is particularly vulnerable among South Asian LDCs where poor
people are working on small farms for their subsistence. Food insecurity and hunger are
old problems in such countries aggravated by new challenges of rising food prices and
climate change. Unfavourable processes and dysfunctional policies and institutions in
LDCs serve only to increase the economic, ecological and social challenges of food
security in such countries. The unfavourable processes include population growth at a
rate faster than food production, climate change and rapid urbanization. Some examples
of dysfunctional policies include the neglection of agriculture in budget allocation, faulty
public distribution systems and a lack of incentives for the farmers to continue farming.
Similarly, some examples of institutional dysfunction include skewed land holding,
excluded farmers, bad governance and distorted markets.
2.3 Food insecurity
The 2009 World Food Summit7was able to renew commitments towards advancing
agriculture, and addressing hunger and food insecurity. The Summit defined food security as the ―situation when all people at all times have access to sufficient, safe and nutritious
food to meet their dietary needs and food preferences for an active and healthy life.‖ The
four most recognized elements of the definition of food security are availability, access,
utilization and stability.
Food availability is generally equated to domestic food production, but in fact it is a
function of food production, domestic carry-over of stocks, commercial food imports and
7 World Summit on Food Security in Rome on 15–18 November 2009.

16
food aid. It is said that food availability is a necessary but not a sufficient condition for
achieving food security among the poor. The second element, food access covers both
physical as well as economic access to food. Food access is ensured when households and
all individuals within the households have adequate resources to obtain appropriate foods
for a nutritious diet. The economic access of a household to adequate food depends upon
income and food prices. The physical access to food depends on infrastructures, transport,
connectivity and food policy.
The third element, food utilization depends on the metabolism of an individual in taking
nutrients and energy from food and is expressed in terms of a certain nutritional status.
Good knowledge and sound practices in food processing, storage, safety, consumption and
health care are necessary for effective food utilization. Finally, the fourth element, food
stability refers to non-vulnerability in the temporal dimension of food security.
Anthropogenic disturbances, natural calamities and climate induced instability in food
supply and agricultural production are the main source of food insecurity. Thus, food
insecurity is a consequence, not only of low production, low supply and poverty, but is
also a product of poor health, unhealthy food practices and external factors, such as
natural calamities, which differ from country to country. The poor in LDCs are
particularly vulnerable to food insecurity and this increases the need for national and
regional food buffer stock.
2.3.1 Food insecurity in Nepal
Nepal is one of the food insecure LDCs in South Asia. A limited area of arable land
suitable for cereal and grain farming, a decade of armed conflict, and protracted political
instability have all resulted in inadequate food production. Natural disasters, including
droughts, flooding and erratic rainfall pose serious threats to vulnerable populations who
depend on agriculture for domestic food production. Extremely difficult geographical
conditions and the remoteness of the country pose difficulties for the delivery of
development programmes and humanitarian food assistance. Inequalities such as gender
disparities, caste differentials, ethnic and linguistic discrimination, and spatial exclusion
due to the remoteness of rural villages are major challenges to food security in Nepal
(Frankenberger 2010).
National food security is estimated by comparing the edible portion of the production and
the requirement of the population. Though the term food encompasses all the nourishing
substances of plant or animal that are consumed to sustain life, provide energy and
promote growth, it is only the edible portion of five major cereals—rice, maize, wheat,
millet and barley—that are considered for measuring food self sufficiency in Nepal. This
is because these cereals are staples and the calories they provide are necessary for
survival.
Figure 10: Contribution of different crops in cereal basket

17
Edib
le f
oo
dgr
ain
th
ou
san
d m
etr
ic t
on
s
Millet
5% Barley
0%
Wheat 24%
Rice 45%
Maize 26%
Data source: MOAC 2011
The three year average ending 2010/11 shows that in terms of edible portion, rice
contributes 45 percent of the cereal basket, followed by maize (26 percent), wheat (24
percent) and millet (5 percent). The contribution of barley is very low (0.15 percent)
(Figure 10). Among these five cereals, the production of millet and barley has failed to
rise for several years (Figure 11). The production of rice, maize and wheat has increased
over the years with some fluctuations, caused primarily by prolonged droughts. The
availability of water affects the production of rice, and thus in turn affects food security of
the country.
Figure 11: Production of foodgrain (edible portion)
3,000
2,500
2,000
1,500
1,000
500
-
Rice
Maize
Wheat
Millet
Barley
Data source: MOAC 2011 In terms of national aggregates, foodgrain production is moving almost alongside

18
Edib
le f
oo
dgr
ain
th
ou
san
d m
etr
ic t
on
s
foodgrain requirements, with surplus occurring in some years and deficit in others
(Figure12). While better-off farmers have practices of keeping stocks of food at home in
the surplus year, the poor cannot afford such food storage, and consequently suffer from
shortfalls in production in any year. Indeed, even in years of national food self-sufficiency
at an aggregate level, the poor in some parts of the country nevertheless still often suffer
from food shortages.
Figure 12: Foodgrain production and requirement
6,000
5,000
4,000
3,000
2,000
Production
Requirement
1,000
-
Data source: MOAC 2011
During the last 22 years, Nepal was food deficit for 13 years and surplus for the other nine
years (Table 6). During this period, the food deficit was five percent or less, except during
the time of severe droughts and floods (1994/95, 1992/93 and 2009/10). During these
drought years, the food deficit was 485, 342 and 330 thousand metric tons respectively.
This means, if severe drought occurs, Nepal can face food deficit of 300 to 500 thousand
metric tons. On average, Nepal is deficit in cereal grains by about one percent of
domestic consumption. The government data shows that the food sufficiency is better in
recent years, primarily due to increases in production and out migration of large number
of youths.
In the context of Nepal, food availability is mainly a function of agricultural performance,
but agriculture in turn depends heavily on rainfall pattern. Thus, severe weather
conditions like drought, flood, landslides and hailstorms affect food security. Other
factors affecting the food availability are food trade and food aid.
Food trade affects food availability in the country. Since 1990, Nepal‘s food trade with
neighbouring countries has increased. This has been a result of the 1990 trade
liberalization, as well as other developments, including Nepal‘s accession to the World

19
Year Production Requirement Balance Balance as % of the
requirement
1989/90 3549.59 3559.01 -9.42 -0.26
1990/91 3618.96 3486.78 132.18 3.79
1991/92 3373.45 3561.84 -188.39 -5.29
1992/93 3292.13 3633.72 -341.60 -9.40
1993/94 3585.11 3723.72 -138.61 -3.72
1994/95 3397.76 3882.92 -485.16 -12.49
1995/96 3913.88 3948.23 -34.35 -0.87
1996/97 3972.59 4079.14 -106.55 -2.61
1997/98 4027.35 4178.08 -150.73 -3.61
1998/99 4097.61 4279.49 -181.88 -4.25
1999/00 4451.94 4383.44 68.50 1.56
2000/01 4513.18 4430.13 83.05 1.87
2001/02 4543.05 4463.03 80.02 1.79
2002/03 4641.47 4565.82 75.65 1.66
2003/04 4884.37 4671.34 213.03 4.56
2004/05 4942.55 4779.71 162.84 3.41
2005/06 4869.44 4890.99 -21.55 -0.44
2006/07 4815.28 4995.19 -179.91 -3.60
2007/08 5195.21 5172.84 22.37 0.43
2008/09 5160.41 5293.32 -132.91 -2.51
2009/10 4967.47 5297.44 -329.98 -6.23
2010/11 5512.88 5069.82 443.06 8.74
Trade Organization (WTO), and the development of both regional trade agreements8, and
a long standing bilateral trade agreement with India. Food trade is affected by price
movement and the trade itself stabilizes food prices. The trade not only fills the gap
between domestic production and consumption, but also reduces the variability in supply
and prices caused by natural disasters and climate change factors (FAO and SAARC 2008).
Trade policy however, is not considered an explicit instrument in achieving food security
in Nepal (NTWG 2007). Nepal has open trade regimes with low applied tariff rate (10 to
15 percent for third country and no tariff for Indian primary products on reciprocal
basis). It has no export subsidies and quantitative restrictions on export and import.
Table 6: Foodgrain self-sufficiency in last two decades (1,000 metric tons)
Data source: MOAC 2011
In spite of a surplus foodgrain production shown by the national statistics above, the net
8 Nepal joined South Asian Free Trade Area (SAFTA) agreement among the SAARC countries and Bay of Bengal
Initiatives for Multisectoral, Technical and Economic Cooperation (BIMSTEC) Free Trade Agreement (FTA) in 2004.

20
Product Export Import Net import Percent
1 Rice 0.30 126.72 126.42 38.10
2 Wheat 0.03 2.04 2.01 0.61
3 Maize 0 163.64 163.64 49.32
4 Millet 0 15.51 15.51 4.67
5 Barley 0 1.09 1.09 0.33
6 Cereals (other) 0 2.64 2.64 0.80
7 Malts 0 6.09 6.09 1.84
8 Wheat flour 1.17 15.59 14.42 4.35
Total 1.50 333.32 331.82 100.00
import of cereals and their products, such as flour and malts, was 331 thousand metric
tons in the year 2010/11 (Table 7). Nearly a half of the import is maize (49 percent)
followed by rice (38 percent). Export of cereals was, however, negligible, and import was
mainly from India. Though the government statistics on food balance shows that
foodgrain in year 2010/11 was surplus by 443 metric tons (8.74 percent of total
production), the net import in the same year was recorded to be 331 metric tons
(accounting to 6.02 percent of the total production). This raises questions with regards to
the preciseness of the figures reported by the food balance sheet. Assuming that the net
import was done to meet the domestic requirement, the domestic surplus and net import
figures together indicate that the error in the estimates of food balance can go as high as
15 percent of the total consumption.
India is the major trading partner for export as well as imports. Trade with India, along
the porous long land border, also defies trade restrictions, if price differences across the
border are high enough to compensate the costs of informal trade.
Table 7: Food trade (‗000 metric tons) 2010/11
Data source: TEPC as reported by MOAC 2011.
Food aid affects food availability, as well as the ability of the poor to access food. The
government of Japan provides food aid under the Kennedy Round (KR1) programme,
through Nepal Food Corporation (NFC). The quantity of this aid for the fiscal year
2009/10 is set at 9,600 metric tons of rice. The World Food Program (WFP) has also been
making contribution to foodgrain availability through its safety net programme. The
WFP, in collaboration with the government has provided rural employment
opportunities to the poor. WFP‘s Food for Education Programme is improving children‘s
nutritional status, as well as their school enrolment and attendance. Similarly, it‘s Mother
and Child Health Initiative improves the health and nutritional status of pregnant
women. The Food for Education Programme and the health initiatives are implemented
for vulnerable people to improve food security in future. Using food aid, the WFP
facilitates the construction and rehabilitation of productive assets to improve market
infrastructure, such as rural roads and mule tracks, while enhancing agricultural

21
productivity through the construction of small-scale irrigation systems, water storage
tanks, micro-hydro schemes and storage facilities (HLTF 2009).
Access to food is another important dimension of food security. The term access covers
both economic as well as physical access to food. Access to food is ensured when every
individual has adequate resources to obtain appropriate foods for a nutritious diet. The
access to adequate food depends upon income of the household and food price in the
market. Even though a whopping 77 percent of Nepalese households grow food, many
rural households are still lack food security. Small size of landholding and limited
availability of irrigation water impede food production, and this in turn limits the access
of households to food as it limits both self production, and the ability for households to
generate a farm-based income as a means of buying food. The physical access to food
depends on transport infrastructure, market development, and communication. The
market supplies food in town areas where transportation facilities are available. Since the
transportation to remote areas is costly, market forces are not getting developed to supply
food in such areas. The government provides transportation subsidies to NFC to supply
food in 23 remote districts in mountains and hills. Some 3.5 million people in Nepal are
highly food insecure (WFP 2010), and 24.82 percent of the population lives on less than
US$ 1.25 a day at 2005 PPP9. The food insecurity is due to draught, high food prices, low
agricultural production, political unrest and the impact of global economic crisis. This is
particularly true in the mid and far western hills and mountains, where the farmers are
exposed to food vulnerability mainly due to marginal land, the existence of intermittent
rugged dry terrain, limited irrigation facilities for food production and limited road access
for food supply.
Food utilization is another aspect of food security. Healthy body and healthy food
practices are necessary for proper utilization of food. A person with healthy digestive
system can digest the food properly. Healthy food practices include proper processing of
food, good storage and safe handling. Finally, the stability of food refers to food
availability, access and utilization. Because agricultural production is season bound, food
is not equally available throughout the year for poor farmers. Seasonal fluctuations in
food price also affect those who need to buy food. In addition, natural calamities make
the farmers more vulnerable to food insecurity. In particular, rainfed farming is more
susceptible to draughts, meaning such farmers are vulnerable to food insecurity.
2.3.2 Food insecurity at regional and district level
The geography of Nepal extends from the southern plains of the Terai to the northern
Himalayas, with the hilly region in between. The Terai region with plain areas and fertile
soil is mostly food sufficient, whereas the hills and mountains are almost always food
9 PovcalNet: the on-line tool for poverty measurement developed by the Development Research Group of
the World Bank, http://iresearch.worldbank.org/PovcalNet/index.htm?3, accessed on 15th June 2012.

22
Foo
dgr
ain
s Th
ou
san
d m
etr
ic t
on
s
deficit in aggregate (Figure 13). Government data for the years 2009/10 and 2010/11
shows that there has been much improvement in food surplus in the Terai and a decrease
in food deficit in the hills and mountains. Such improvements in food availability can
partly be attributed to increased production and more importantly, to a revised
population estimate, after the preliminary results of the 2011 population census showed
that there was a much lower population than projected, mainly due to out-migration.
Figure 13: Surplus of the foodgrain by physiographic regions
600
400
200
2009/10
2010/11
0
-200
Mountain Hill Terai
-400
-600
Data source: MOAC 2011
For development purposes, the country is divided into five development regions—
Eastern, Central, Western, Mid-western and Far-western. Three physiographic regions
and five development regions overlaid each other gives 15 ecological regions in the
country. The food production and requirements for each of these regions, for the last two
years (2009/10 and 2010/11) are presented in figure 14 and figure 15.
The eastern and western development regions are food surplus, and the central region is
food deficit. The mid and far western regions, and the Terai district are food surplus, but
the hill and mountain districts are food deficit. The Mid western hills and central Terai
regions that were food deficit in 2009/10 turned to be food surplus in the year 2010/11,
mainly due to out-migration. In general, the Terai region and whole of the Eastern region
is food surplus.
The district-wise food self sufficiency data offers a closer picture. In this regard, the ten
most food surplus districts, in the order of surplus quantity are Kapilvastu, Rupandehi,
Syangja, Jhapa, Bara, Bardiya, Kanchanpur, Parsa, Nawalparasi and Ilam (Figure 16).
According to the government data, 33 out of 75 districts were food deficit in the year
2010/11 (MOAC 2011). The ten most food deficit districts in the order of deficit quantity
are Kathmandu, Lalitpur, Siraha, Bhaktapur, Mahottari, Makwanpur, Rautahat, Sarlahi,

23
Dolakha and Bajhang. Though there are 33 food insufficient districts, including major
cities like Kathmandu, Bhaktapur and Lalitpur, only those districts in far and mid western
hills and mountains are really food insecure. Among the hill and mountain districts, the
most insecure are those districts with limited road transport infrastructure and market
development.
Figure 14: Food requirement and
production in 2009/10
Figure 15: Food requirement and
production in 2010/11
FW.Terai
FW.Hills
FW.Mountain
MW.Terai
MW.Hills
MW.Mountain
W.Terai
W.Hills
W.Mountain
C.Terai
C.Hills
C.Mountain
E.Terai
E.Hills
E.Mountain
Requirement
Production
0.0 200.0 400.0 600.0 800.0 1000.0
Foodgrains in thousand metric tons
FW.Terai
FW.Hills
FW.Mountain
MW.Terai
MW.Hills
MW.Mountain
W.Terai
W.Hills
W.Mountain
C.Terai
C.Hills
C.Mountain
E.Terai
E.Hills
E.Mountain
Requirement
Production 0 200 400 600 800 1000
Foodgrains in thousand metric tons
Data source: MOAC 2010 and 2011.
While at a national aggregate level Nepal is near food self-sufficient, the data
demonstrates that internally there are great disparities. Indeed, at a national aggregate
level, the food deficit is one percent on average, with a deficit of between two to four
percent during some years. However, there are regions in the country where people
chronically suffer from food insecurity. In particular, the mid and far western hills and
mountain regions are food insecure, and require external assistance. Though food
insufficiency is found in some districts with large urban centres, people in general are not
food insecure in the accessible areas. In a real sense, the food deficit districts in the order
of deficit quantity are Dolakha, Bajhang, Baitadi, Bajura, Achham, Rolpa, Dalchula,
Humla, Dadeldhura, Kalikot, Doti, Udaypur, Pyuthan, and Jumla. The overall existence
of these disparities in levels of food security, show that within Nepal, food security is a
regional, district and to some extent even household specific issue.
The World Food Programme (WFP) has assisted the Ministry of Agriculture and
Cooperatives (MOAC) in mapping food-insecure areas using the Nepal Food Security

24
Figure 16: District food self sufficiency
Kapilbastu
Rupandehi
Syangja J hapa
Bara
Bardiya Kanchanpur
P arsa Naw alparasi
Illam Mo rang Kho tang
Dhanusha Nuw akot
Bho jpur Kailali
Lamjung Baglung
Dang Tanahu
Sankhuw ashava Surkhet Go rkha
Taplejung Sindhupalchok
Rukum Dhankuta
Myagdi P arbat Banke
Terhathum Chitw an
Ramechap Okhaldhunga
Gulmi Solukhumbu
P alpa Salyan Dolpa
Arghakhanchi Dailekh Manang Sindhuli Mustang
Kaski P anchthar
Mugu Sunsari
Rasuw a J ajarkot
Dhading Kavre J umla
P yuthan Udayapur
Doti Kaliko t
Dadeldhura Humla
Darchula Ro lpa
Achham Bajura Baitadi Saptari
Bajhang Dolakha
Sarlahi Rautahat
Makw anpur Maho ttari Bhaktapur
Siraha Lalitpur
Kathmandu
-400 -300 -200 -100 0 100 200
Foodgr ain sur plus (de fic it) in thousands tons
Source: MOAC 2011

25
Monitoring System (NeKSAP). This system collects, analyzes and presents information on
household food security, emerging crises, markets and nutrition for all of the districts.
District Food Security Networks validate exchange and generate up-to-date food security
information. As the SAARC Food Bank can be triggered only by emergency10, or
shortfall11 in national food production or stock, the results of monitoring are not linked to
this system in a manner which can address local level food insecurity.
External food assistance is necessary for food deficit regions, districts and households.
Food assistance comes either through the food distribution system of the government -
mainly through Nepal Food Corporation (NFC) or through external food aid operated by
the WFP. In the case of regional food deficit, NFC buys food from the surplus areas and
distributes food in the deficit areas. However, in the event of a national food deficit, the
NFC has not assured international source of supply from which it can obtain the food
necessary for reinforcing its public food distribution system.
2.4 Public Food Distribution System
Nepal‘s public food distribution system is not well developed. The NFC, established in
1974, is responsible for distributing foodgrain, maintaining buffer stock and handling
food aids. It has a head office in Kathmandu, eight zonal offices, 26 branch offices and 58
depot offices, with a total of 459 employees—only 10.6 percent of whom are technically
inclined. It has rice mills in Rajapur (Bardia), Janakpur (Dhanusha) and Mahendranagar
(Kanchanpur) which have the capacity of producing 2.0, 1.0 and 0.5 metric tons per hour
respectively. The Corporation has 31 office buildings and 159 warehouses with nearly
100,000 metric tons capacity. It has 43.3 ha of land in the Terai, 87.2 ha of land in the
hills, prime locations in the Kathmandu valley and 60.0 ha of land in the mountain areas.
A food testing laboratory and half a dozen warehouses are under construction (NFC
2011).
The NFC operates foodgrain distribution through procurement, storage, transportation
and distribution of foodgrain. The procurement of foodgrain is done during the
harvesting season at its own procurement price, either directly from the farmers or from
the traders in the production area. The main production area of Nepal is the Terai. NFC
has wide coverage of warehouses in different strategic locations for storage and
distribution of foodgrain (Figure 17). During the period of armed conflict in the country,
some warehouses were occupied by security forces, and some others by local clubs. NFC
is in the process of regaining the control over these warehouses. NFC distributes food in
10 A food emergency shall mean a state or condition in which a member state, having suffered a severe and
unexpected natural or man-made calamity, is unable to cope with such a state of condition by using its
national reserve (Ahmed et al., 2011). 11 Food shortage shall mean a state or condition in which a member country has suffered a production
shortfall and/or storage shortfall and find it difficult to cope with such a state or condition by using its
national reserve (Ahmed et al., 2011).

26
deficit areas—mainly hilly and mountain districts. But a part of the food is also sold in
Kathmandu valley. The transportation for remote areas is done at government subsidy.
Though NFC used to distribute foodgrain in 30 remote districts, the districts covered were
downsized to 23 remote districts in 2011. The downsizing of NFC coverage is for
increasing the role of private sector in food marketing in newly opened road corridors.
Figure 17: Locations and capacity of warehouses
Source: NFC 2012
NFC acquires foodgrain either by procurement or through food aid. The food aid started
in 1979/80. In 1982/83, a large (57 percent) contribution of food aid led to the NFC
handling 130 thousand metric tons of foodgrain, which remains the highest in its history.
From the conflict period onwards, however, the operation of NFC has decreased
drastically, handling only around 20 thousand metric tons a year. This decrease is
attributed to an increase in road access to many districts that were previously
inaccessible. With 159 warehouses located in 63 out of 75 districts the foodgrain sold less
than the foodgrain acquired (Figure 18). However, the amount of the foodgrain sold by
NFC is very small as compared to the volume of production. For example, foodgrain sold
in year 2010/11 amounted to only 0.38 percent of the total foodgrain production in the
country.
The distribution of foodgrain in the remote areas is assisted by District Food Management

27
Foodgrain ac quire d
Foodgrain sold
Food
grain
thou
sand
met
ric to
ns
Committee (DFMC) chaired by Chief District Officer. Local line agencies and political
parties are the members of the Committee. The Committee demands a food supply quota
from the NFC. In case of inadequacy of the fixed quota, the Committee also recommends
for an additional quota of foodgrain for the district. The foodgrain prices are, however, set
by the NFC according to cost price basis.
Figure 18: Foodgrain purchase and sales by NFC over decades 140
120
100
80
60
40
20
0
Data source: NFC 2012
In its early days, till 1982/83, the warehouses of the corporation were over utilized and
the construction of new warehouses was rapid. But from the start of the decade long
armed conflict in 1996/97 the capacity of the existing warehouses h never been fully
utilized (Figure 19). The capacity utilization of the warehouses in 2010/11 was only one-
third. Due to low capacity utilization, new warehouses were not constructed in this
decade. Some of the warehouses were however used by security forces and local clubs for
other purposes. Some unused warehouses have been rented out to other institutions such
as Agriculture Input Company Limited, Nepal Telecom and the press.
The efficiency of NFC is measured in terms of subsidy per kg of foodgrain distributed, and
tons of foodgrain sold per employee of the corporation. The subsidy per kg is steadily
increasing (in nominal terms), except for a period of decline in the year 2010/11. The
quantity of foodgrain handled per employee hovers at around 40 metric tons (Figure 20).
The focus of food supply has changed. A decade ago NFC used to sell 60 percent of the
foodgrain it handled in the Kathmandu valley (Table 8). In 2010/11 NFC supplied only 18
percent of the grain to Kathmandu valley and instead supplied 73 percent of foodgrain it
handled to remote villages.

28
Num
ber
of g
odow
ns
Food
grain
in m
etric
tons
and
subs
idy R
s/kg
1974
/75
1976
/77
1978
/79
1980
/81
1982
/83
1984
/85
1986
/87
1988
/89
1990
/91
1992
/93
1994
/95
1996
/97
1998
/99
2000
/01
2002
/03
2004
/05
2006
/07
2008
/09
2010
/11
1974
/75
1976
/77
1978
/79
1980
/81
1982
/83
1984
/85
1986
/87
1988
/89
1990
/91
1992
/93
1994
/95
1996
/97
1998
/99
2000
/01
2002
/03
2004
/05
2006
/07
2008
/09
2010
/11
Capa
city
util
izat
ion
%
Figure 19: Number of warehouses and their capacity utilization
350
350
300 300
250 Capacity utilization of godowns (%) Number of godown
250
200 200
150 150
100 100
50 50
0 0
Data source: NFC 2012
Figure 20: Efficiency of NFC measures in terms of handling costs
90.00
80.00
70.00
60.00
50.00
40.00
30.00
20.00
10.00
Foodgrain sold per employee (mt)
Interest and transport subsidy (Rs/kg)
0.00
Data source: NFC 2012
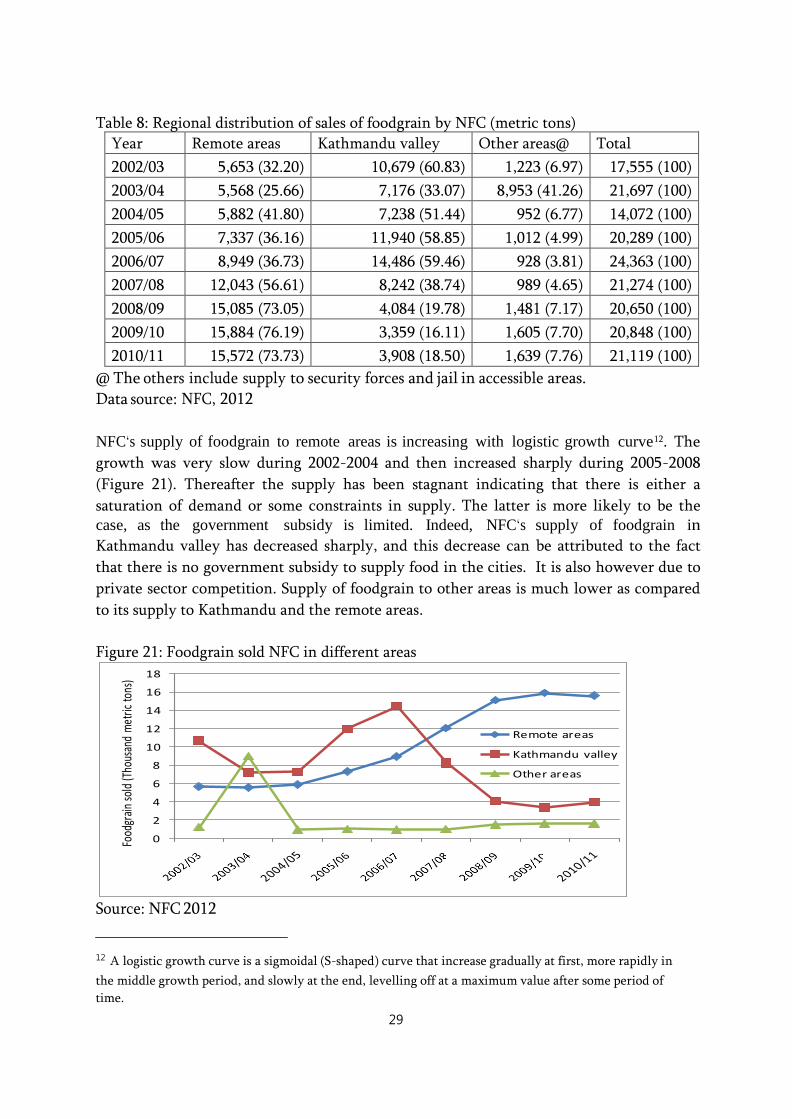
29
Year Remote areas Kathmandu valley Other areas@ Total
2002/03 5,653 (32.20) 10,679 (60.83) 1,223 (6.97) 17,555 (100)
2003/04 5,568 (25.66) 7,176 (33.07) 8,953 (41.26) 21,697 (100)
2004/05 5,882 (41.80) 7,238 (51.44) 952 (6.77) 14,072 (100)
2005/06 7,337 (36.16) 11,940 (58.85) 1,012 (4.99) 20,289 (100)
2006/07 8,949 (36.73) 14,486 (59.46) 928 (3.81) 24,363 (100)
2007/08 12,043 (56.61) 8,242 (38.74) 989 (4.65) 21,274 (100)
2008/09 15,085 (73.05) 4,084 (19.78) 1,481 (7.17) 20,650 (100)
2009/10 15,884 (76.19) 3,359 (16.11) 1,605 (7.70) 20,848 (100)
2010/11 15,572 (73.73) 3,908 (18.50) 1,639 (7.76) 21,119 (100)
Food
grai
n so
ld (T
hous
and
met
ric to
ns)
Table 8: Regional distribution of sales of foodgrain by NFC (metric tons)
@ The others include supply to security forces and jail in accessible areas. Data source: NFC, 2012
NFC‘s supply of foodgrain to remote areas is increasing with logistic growth curve12. The
growth was very slow during 2002-2004 and then increased sharply during 2005-2008
(Figure 21). Thereafter the supply has been stagnant indicating that there is either a
saturation of demand or some constraints in supply. The latter is more likely to be the case, as the government subsidy is limited. Indeed, NFC‘s supply of foodgrain in
Kathmandu valley has decreased sharply, and this decrease can be attributed to the fact
that there is no government subsidy to supply food in the cities. It is also however due to
private sector competition. Supply of foodgrain to other areas is much lower as compared
to its supply to Kathmandu and the remote areas.
Figure 21: Foodgrain sold NFC in different areas 18
16
14
12
10
8
6
4
2
0
Remote areas
Kathmandu valley
Other areas
Source: NFC 2012
12 A logistic growth curve is a sigmoidal (S-shaped) curve that increase gradually at first, more rapidly in
the middle growth period, and slowly at the end, levelling off at a maximum value after some period of
time.

30
District Government of Nepal Foreign aid Total
Proposed
quota
(revised)
Transpor
t cost
Propose
d quota
Transport
cost
Proposed
quota
Transpo
rt
Cost
1 Taplejung 280 1,136 0 0 250 1,136
2
Sankhuwasa
va
260
3,365
0
0
200
3,365
3 Bhojpur 330 2,836 0 0 250 2,836
4
Solukhumb
u
295
12,153
0
0
350
12,153
5
Okhaldhun
ga
255
2,068
0
0
200
2,068
6 Khotang 670 12,980 0 0 620 12,980
7 Manang 440 13,534 0 0 440 13,534
8 Gorkha 600 12,047 0 0 600 12,047
9 Mustang 150 1,840 0 0 150 1,840
1
0
Rukum
700
4,050
0
0
550
4,050
1
1
Rolpa
460
2,595
0
0
400
2,595
1
2
Dailekh
670
2,251
0
0
850
2,251
1
3
Jajarkot
790
9,721
0
0
720
9,721
Much lower than the preceding years, NFC in 2011/12 has a plan to distribute 14,987
metric tons of foodgrain in remote areas, subsidized by the government (Table 9). A large
quantity of the foodgrain quota is allocated for Bajura district (11.14 percent) followed by
Dolpa (10.39 percent) and Mugu (10.38 percent). NFC received Rs 110 million in Japanese
aid (Kennedy round13 KR1) in the year 2011/12, and has decided to distribute 2,013
metric tons of foodgrain in Mugu, Dolpa, Jumla, Humla and Kalikot districts. The KR1
food aid provided since 1970 can be used exclusively for the procurement of rice and its
shipping services, including internal transportation. The amount received from the sale of
the rice is deposited in the counterpart fund, which in turn is utilized for the
implementation of economic and social development projects agreed between Japan and
Nepal.
Table 9: Foodgrain quota (proposed) and transportation costs (2011/12)
(Quota in metric tons and transportation costs in Rs 1000)
13Providing aid to developing countries was one of the objectives of the Kennedy round—the sixth session
of General Agreement on Tariffs and Trade (GATT) trade negotiations held in 1964-1967 in Geneva,
Switzerland.

31
District Government of Nepal Foreign aid Total
Proposed
quota
(revised)
Transpor
t cost
Propose
d quota
Transport
cost
Proposed
quota
Transpo
rt
Cost
1
4
Jumla
945
12,539
400
6,118
1,150
18,657
1
5
Humla
970
96,343
353
44,026
1,130
140,369
1
6
Mugu
1,555
63,506
500
30,355
1,560
93,861
1
7
Dolpa
1,557
65,404
490
24,881
1,690
90,285
1
8
Kalikot
790
8,598
270
4,620
820
13,218
1
9
Bajhang
410
4,077
0
0
400
4,077
2
0
Bajura
1,670
21,123
0
0
1,150
21,123
2
1
Achham
480
2,377
0
0
450
2,377
2
2
Baitadi
330
5,362
0
0
350
5,362
2
3
Darchula
380
10,095
0
0
450
10,095
Total 14,987 370,000 2,013 110,000 14,730 480,000
Note: Subsidized food supply is discontinued to districts of Panchthar, Tehrathum, Sindhuli, Dhading, Banglung, Myagdi and Pyuthan. Source: NFC 2012
The average transportation subsidy provided by the government is Rs 24.69 per kg and
ranges from Rs 3.36 per kg provided for Dailekh district to Rs 99.32per kg for Humla
district (Figure 22). The transportation subsidy for the donor assisted programme (KR1) is
higher than in the government programme. The average transportation subsidy provided
by the donor programme is Rs 54.64 per kg, ranging from Rs 15.30 for Jumla to the
highest of Rs 124.72 per kg in Humla. This is because KR1 foodgrain need to be
transported from the point of entry to the country to the deficit districts, whereas NFC
reserve is transported from the nearest warehouse. The transportation cost depends on
the distance from the food store to the target district.
The Government of Nepal has a policy of increasing foodgrain buffer stock. The buffer
stock of 15,000 metric tons maintained in 2010/11 was increased to 25,000 metric tons in
2011/12. During the same period, Nepal‘s contribution to SAARC Food Bank doubled

32
from 4,000 metric tons to 8,000 metric tons, maintained in the form of rice. The national
buffer stock is maintained in eight strategic locations within the country, with the
highest stock maintained in Kathmandu, and the lowest in Pokhara (Table 10 and Figure 23). Similarly, Nepal‘s share of the reserve for SAARC Food Bank is located in five
locations, of which four coincide with the national reserve. The majority (75 percent) of
the Food Bank is located in eastern part of the country, and only a small quantity (12
percent) is located in the western part. The reason for this disparity is that the food
storages with low likeliness of immediate movement are designated as the reserve for the
SAARC Food Bank. It is cheaper to store food in the place of procurement than it is to
transport and store the food in a food insecure region. This indicates that NFC officials
feel that food from the SAARC food reserve is less likely to move as compared to the
national buffer stock.
Figure 22: Transportation cost per kg of grain for different districts
Humla
Dolpa
Solukhumbu
Mugu
Manang
Darchula
Total
Gorkha
Khotang
Baitadi
Jumla
Sankhuwasava
Bajura
Jajarkot
Mustang
Kalikot
Bajhang
Bhojpur
Okhaldhunga
Rukum
Rolpa
Achham
Taplejung
Dailekh
Donor
Government
Source: NFC, 2012
0 20 40 60 80 100 120 140
Transportation subsidy (Rs/kg)

33
Location of
warehouse
Approved National Foodgrain buffer
stock
SAARC Food Bank
2010/11 2011/12 2010/11 2011/12
Biratnagar 1.00 3.00 1.00 2.00
Birtamod 0 0 1.00 2.00
Lahan 0.50 1.00 0 0
Birganj 1.50 2.50 1.00 2.00
Kathmandu 7.00 10.00 0.50 1.00
Pokhara 0.50 0.50 0 0
Nepalganj 1.50 2.50 0 0
Surkhet 1.50 2.50 0 0
Dhangari 1.50 3.00 0.50 1.00
Total 15.00 25.00 4.00 8.00
Food
gra
in s
tock
Tho
usan
d m
t
Table 10: NFC national buffer stock and SAARC Food Bank (‗000 metric tons)
Source: NFC 2012
Figure 23: Buffer stock and SAARC Food Bank at different locations
12
10
10
Buffer stock
8 SAARC Food Bank
6
4 3
2.5 2 2 2
2 1
0 0 0
1
0.5
3
2.5 2.5
1
0 0 0
NFC currently maintains a national buffer stock of 25,000 metric tons of rice to meet
emergency requirements and the government has a policy of increasing the stock to
50,000 metric tons. As per the Foodgrain Buffer Stock Programme Operation Procedure
(2006) approved by the government, the stock holder (NFC) will deliver the stock to
persons or organizations from the district or region specified upon the order of Ministry
of Commerce and Supplies (MOCS) (Article 4). As per the provision (Article 5), NFC is to
replenish the stock immediately.

34
In addition to the buffer stock and SAARC Food Reserve14, NFC handles food aid received
from donor agencies. NFC implements food safety-net programme of the government by
supplying foodgrain to food deficit districts. It provides food to consumers at fair prices
and often provides food as a means to intervene in the foodgrain market and to stabilize
prices. NFC manages food aid from donor agencies and holds food stocks for emergency.
NFC is cutting down the number of districts gradually as its role gets smaller when
remote inaccessible districts get linked with road networks. Though the coverage of NFC
decreased from 30 districts to 23 districts, the quantity of food distribution made by the
Corporation is not decreasing. Though NFC is playing an important role in maintaining
food security in remote districts, the quantity supplied is less than adequate to influence
the price and supply in the market. The handling is much less than one percent of the
total consumption. Moreover, most foodgrain distribution by NFC arguably goes to
government employees and those people residing at and near the district headquarters.
3. Challenges and opportunities of public distribution system
3.1 Opportunities of PDS
Operated by NFC, PDS offers an opportunity to strengthen food security in the country.
According to the strategic plan (2011-2013) developed by the Department of Commerce,
the government is planning to prepare a supply policy for facilitating supply management
and making it transparent and reliable. It comprises of policies to develop and strengthen
PDS through cooperatives and low price shops for reducing frictions on the supply of
goods and services (DOC 2011). Supply management also includes the provision of buffer
stock of essential food commodities for controlling price rise and market stabilization.
PDS increases access to food for food insecure regions and households.
PDS can stabilize food price by purchasing the food from the country‘s surplus areas
during the harvesting season and selling the same food in the food deficit areas during the
time of shortage. Thus, PDS can help regional as well as seasonal spread of foodgrain.
Agricultural production in Nepal fluctuates from year to year. PDS can store foodgrain
during years of good harvest and sell the grains in years of poor harvest, thus stabilizing
year to year fluctuations in food prices. For this purpose, national buffer stock of
foodgrain is initiated, though with small quantity. PDS is an instrument for
implementation of public policies in securing food security, maintaining the price level
during the harvest season, and checking the price rise before the harvest season.
PDS can help the poor by reducing their vulnerability to food insecurity. PDS system can
be used as a mechanism for distribution of subsidized food for the poor. It is a safety-net
14 NFC maintains 8,000 metric tons of SAARC Food Bank reserve. But, NFC officials are not clear about the
provisions for withdrawal of the food from the Bank.

35
programme for vulnerable communities, particularly in food deficit areas. PDS can
stabilize the price in the market during the lean season, and during periods of erratic food
supply (Puri 2012).
PDS is helpful in implementing food aids in collaboration with national and international
agencies such as World Food Programme. PDS is currently being used for the operation
of Food for Work Programme, which is self-targeted to food deficit households. It
capitalizes the flow labour resources, in order to develop the infrastructures necessary for
increasing food production and improving food transportation. The food production
increases through the construction of irrigation canals, and food transportation improves
through the construction of roads.
PDS can be strengthened and linked to the SAARC Food Bank, not only for maintaining
the reserve committed by Nepal, but also for the operationalization of the Bank by
distributing the foodgrain released from it and replenishing the stock during successive
harvesting seasons.
3.2 Challenges of PDS
Developing PDS system is itself a challenge. It involves a large budget, high risks, and
large number of human resources and infrastructures. Furthermore, it involves the
process of buying, storing and transporting food to deficit areas. The process involves
large costs, particularly as the public sector is less efficient than the private sector. Indeed,
the operational cost of PDS is disproportionately higher than the would-be-cost of the
private sector in supplying the same quantity of the food. As foodgrain are semi-
perishable and can only be stored for two to three years, the operations involve high risks
of damage and pest problems, which further add to the renovation handling costs. A large
number of human resources are necessary for the buying, storing, transportation and
distribution of foodgrain. It involves warehouse facilities and transport infrastructure.
The huge costs of operation also increase the risks of moral hazards. Jenkins and Goetz
(2002) studied PDS in India and reported that it suffers from management shortcomings
such as inappropriate timing of procurement, poor forecasting capacity, inadequate
logistics, cost inefficiencies, poor quality foodgrain, and the exclusion of large numbers of
the poor from the system. Compared to other SAARC countries, PDS in Nepal is
relatively ineffective, mainly due to expensive internal transport, storage, and handling
costs (Pyakurel et al. 2005).
PDS has the danger of replacing the food market in the sensitive areas in the country, and
creating uncertainty among private food suppliers. For example, the supply of subsidised
food in remote areas often displaces food traders, which in turn results in the local people
becoming more vulnerable, at the very time when the government cannot supply enough
food for the people in these areas. NFC's distribution to remote areas has not been
effectively targeted at the most needy households, despite a heavy financial burden on

36
the government (Pyakurel et al. 2005).
PDS also discourages the farmers from growing food, as the distribution of subsidised food
dampens local food prices. This creates chronic dependency of the villages on food aid.
Thus, the heavily subsidized foodgrain distribution depresses the grain market price for
the local farmers and acts as disincentive for production and sales of foodgrain.
The distribution of rice can also lead to malnutrition. This is because the subsidized rice is
often cheaper than the other, more nutritious, locally produced foods. As a response to
this, the consumption habit shifts towards rice consumption, in effect worsening the
nutritional status of the consumers, even though they consume a good amount of calories
through rice. This also results in crop biodiversity loss, which increases the vulnerability
of the farmers toward long term food insecurity and crop failure, due to a narrow genetic
base.
Having no effective public institutional mechanism to monitor food distribution, it is not
known if food is received by the hungry and vulnerable groups and targeted population
in the regions. Even less is known about the quality of food distributed, and the
proportion of foodgrain used for local alcohol production, and for the feeding of poultry
and livestock (Dahal and Khanal 2010).
PDS politicises the food supply making the local people more vulnerable at the time of
political incompatibilities between the local government and national government.
Distribution of rice by PDS increasingly creates dependency on rice, which has limited
production in the country.
The food transportation and interest subsidies to NFC contribute to fiscal deficit. The
subsidy crossed Rs 700 million in the year 2009/10 and reduced slightly in 2010/11. Over
the years, the subsidy amount is increasing and the food purchased is decreasing (Figure
24). The trends over the last 35 years show that transportation subsidy is increasing at the
rate of 13.04 percent per annum, whereas, the amount of foodgrain purchased is
decreasing at the current rate of 2.7 percent per annum. At the same time, increases in
the national buffer stock and the maintenance of the food reserve for the SAARC Food
Bank will increase the interest subsidy. During the same period the food aid is decreasing
at the rate of 0.60 percent per annum. The increasing burden to the government treasury
and decreasing supply of foodgrain by NFC indicates that the practice is unsustainable.

37
Sub
sid
ies
in R
s m
illio
n
19
74
/75
19
76
/77
19
78
/79
19
80
/81
19
82
/83
19
84
/85
19
86
/87
19
88
/89
19
90
/91
19
92
/93
19
94
/95
19
96
/97
19
98
/99
20
00
/01
20
02
/03
20
04
/05
20
06
/07
20
08
/09
20
10
/11
Foo
dgr
ain
pu
rch
ase
d T
ho
usa
nd
s m
etr
ic t
on
s
Figure 24: Subsidies on food transportation and interest subsidies on food reserve
800
700
600
500
400
300
200
100
0
Transport subsidy
Interest subsidy
Foodgrain purchased
100
90
80
70
60
50
40
30
20
10
0
4. Commitments for SAARC Food Bank and Issues on its Operationalization
The SAARC Food Reserve, the previous version of the SAARC Food Bank (SFB), was
established in 1988 but was not operationalised in its 20 years of life until till 2007. This
was mainly due to the stringent condition of making it a necessity for countries to first
declare an emergency before any operationalization could occur. This reserve was not
established as an institution. Nor was any other institution formed to support the
operation of the reserve. Similarly, no systematic procedures or articles were drafted for
the purpose. Likewise, no provision was made to meeting the costs involved15. South
Asian countries during this period neither faced a balance of payment crisis, nor declared
food emergencies. It is however, also claimed that the non-operationalization was because
of the political problems in South Asia, whereby countries did not trust each other and
politicians did not have much concern for food security. Likewise, the food reserve did
not have a mechanism to monitor and follow up on what was agreed16. The non-
functional Food Reserve was converted to SAARC Book Bank by 14th SAARC summit in
Islamabad in 2007, with an intention of making its operationalization a reality. The Bank
is expected to act as a regional food security reserve for SAARC member countries during
food shortages and emergencies, as well as provide regional support to national food
security efforts, foster inter-country partnerships and regional integration, and solve
regional food shortages through collective actions.
Schedule-I of the agreement on establishing the SAARC Food Bank specified the shares of
foodgrain of each member for the reserve. The reserve of Afghanistan, was however,
decided later. It was mentioned that the reserves would remain the property of the
individual member countries, and would be in addition to their national reserves. India
15 Mathema, SB 2012, personal correspondence. 16 Adhikari, J 2012, personal correspondence.
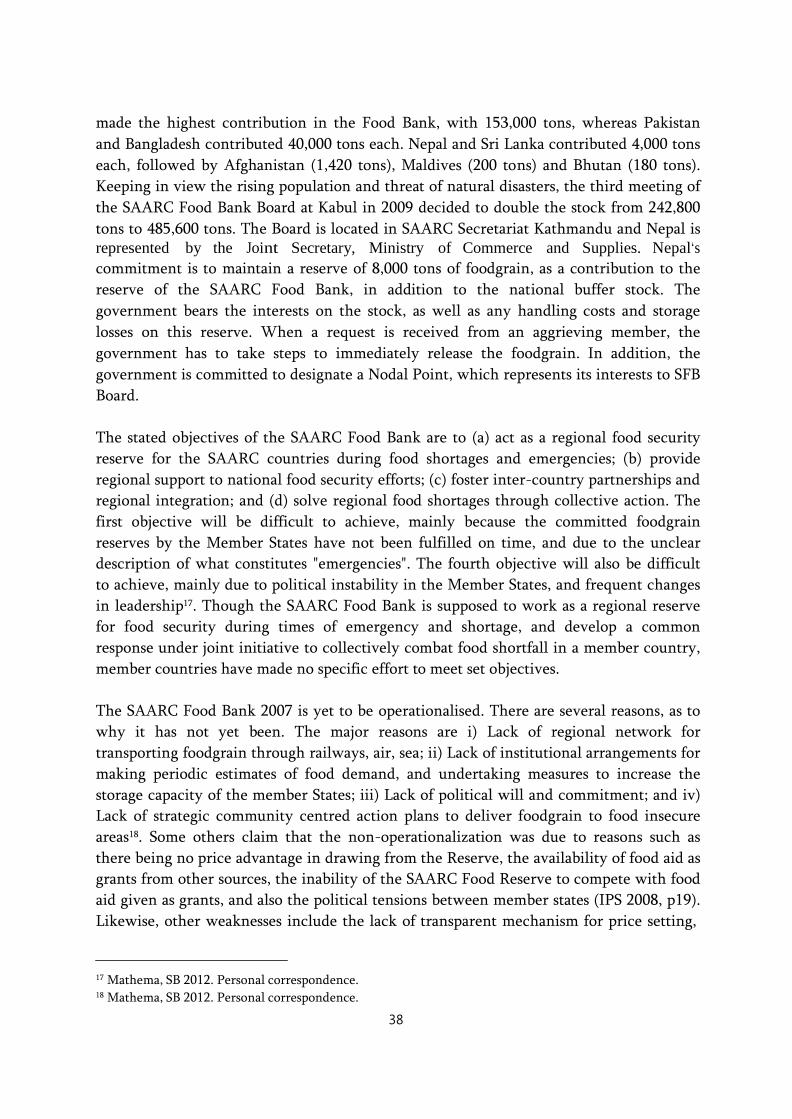
38
made the highest contribution in the Food Bank, with 153,000 tons, whereas Pakistan
and Bangladesh contributed 40,000 tons each. Nepal and Sri Lanka contributed 4,000 tons
each, followed by Afghanistan (1,420 tons), Maldives (200 tons) and Bhutan (180 tons).
Keeping in view the rising population and threat of natural disasters, the third meeting of
the SAARC Food Bank Board at Kabul in 2009 decided to double the stock from 242,800
tons to 485,600 tons. The Board is located in SAARC Secretariat Kathmandu and Nepal is represented by the Joint Secretary, Ministry of Commerce and Supplies. Nepal‘s
commitment is to maintain a reserve of 8,000 tons of foodgrain, as a contribution to the
reserve of the SAARC Food Bank, in addition to the national buffer stock. The
government bears the interests on the stock, as well as any handling costs and storage
losses on this reserve. When a request is received from an aggrieving member, the
government has to take steps to immediately release the foodgrain. In addition, the
government is committed to designate a Nodal Point, which represents its interests to SFB
Board.
The stated objectives of the SAARC Food Bank are to (a) act as a regional food security
reserve for the SAARC countries during food shortages and emergencies; (b) provide
regional support to national food security efforts; (c) foster inter-country partnerships and
regional integration; and (d) solve regional food shortages through collective action. The
first objective will be difficult to achieve, mainly because the committed foodgrain
reserves by the Member States have not been fulfilled on time, and due to the unclear
description of what constitutes "emergencies". The fourth objective will also be difficult
to achieve, mainly due to political instability in the Member States, and frequent changes
in leadership17. Though the SAARC Food Bank is supposed to work as a regional reserve
for food security during times of emergency and shortage, and develop a common
response under joint initiative to collectively combat food shortfall in a member country,
member countries have made no specific effort to meet set objectives.
The SAARC Food Bank 2007 is yet to be operationalised. There are several reasons, as to
why it has not yet been. The major reasons are i) Lack of regional network for
transporting foodgrain through railways, air, sea; ii) Lack of institutional arrangements for
making periodic estimates of food demand, and undertaking measures to increase the
storage capacity of the member States; iii) Lack of political will and commitment; and iv)
Lack of strategic community centred action plans to deliver foodgrain to food insecure
areas18. Some others claim that the non-operationalization was due to reasons such as
there being no price advantage in drawing from the Reserve, the availability of food aid as
grants from other sources, the inability of the SAARC Food Reserve to compete with food
aid given as grants, and also the political tensions between member states (IPS 2008, p19).
Likewise, other weaknesses include the lack of transparent mechanism for price setting,
17 Mathema, SB 2012. Personal correspondence. 18 Mathema, SB 2012. Personal correspondence.

39
the time taking system of decision making of the SAARC Food Bank Board, the
difficulties involved in meeting the condition of an eight percent shortfall in production,
and the limited linkages of the PDS within food insecure areas.
4.1 Mechanisms to link the national food distribution system with the SAARC Food Bank
Though the Agreement on Establishing the SAARC Food Bank was signed in 2007, the
operationalization of the Bank has still not occurred. Not a single member so far has been
able to access food from the Bank. Realizing this fact, the declaration of seventeenth
SAARC Summit (2011) at Addu, Maldives, commits to resolve the operational issues
related to the SAARC Food Bank by the next session of the Council of Ministers in 2012,
with a view to ensuring its effective functioning (paragraph 9). The Bank, if properly
operationalised, is expected to contribute enormously in addressing food insecurity in the
region.
No specific mechanism is yet developed for linking the SAARC Food Bank to the PDS
operated by NFC in Nepal. The officials of NFC are not provided with enough
information, or the plans necessary for empowering them to mobilize the food from the
Bank at the time of need. NFC has its own network of warehouses in 63 out of 75 districts
that can be utilized for distribution of foodgrain in case of need, but a practical
mechanism for drawing the food is lacking.
4.2 Critical appraisal of SAARC Food Bank from Nepal‘s perspectives
4.2.1 Inadequate Food Reserve
In South Asia, food production and consumption vary drastically from country to country
(Table 11). Export, import, and stock variations depend on the yearly crop production.
The amount of food earmarked by all the countries as the SAARC reserve (486,000 metric
tons) is comparative to 15.2 percent of the domestic production of Sri Lanka, 7.5 percent
of the production of Nepal and only 0.2 percent of the domestic food production of India.
If the food reserve of the entire SAARC Food Bank is drawn by Sri Lanka, the food with
be enough to feed its people for 55 days. For Nepal, the food from the Bank would be
enough to feed its population for 27 days. For India, the entire foodgrain reserve from the
Bank would not be enough to feed its population for even a single day. This effectively
means that although the Food Bank can help smaller countries in case of food shortage, it
is not enough to help India. When some of the members cannot benefit from the Bank, it
is difficult to chart out conditions conducive for its operationalization.

40
Table 11: Food balance sheets of South Asian countries and comparison with SAARC Food Bank (‗000 metric tons)
Element Bangladesh India Nepal Pakistan Sri Lanka
1 Production Quantity 30,372.84 212,344.09 6,103.29 33,033.88 2,150.48
2 Import Quantity 3,569.74 2,742.23 317.76 163.95 1,199.06
3 Stock Variation -2,694.84 -2,263.93 86.49 -2,568.66 31.63
4 Export Quantity 21.70 9,938.17 8.64 4,092.99 191.07
5 Domestic supply quantity 31,226.04 202,884.21 6,498.90 26,536.19 3,190.10
6 Feed 56.43 7,950.46 733.84 1,402.39 103.21
7 Seed 444.04 6,601.10 171.60 1,577.97 47.42
8 Waste 2,185.60 8,208.40 661.15 846.00 167.45
9 Processed 0.00 411.50 5.02 3.67 10.89
10 Food consumption 28,529.80 177,681.65 4,846.32 22,480.07 2,853.17
11 Other Utility 10.33 2,032.32 83.53 228.10 8.17
12 SAARC Food Bank as % of
domestic supply
1.56
0.24
7.48
1.83
15.23
13 Supply per day 85.55 555.85 17.80 72.70 8.74
14 Days SAARC Food Bank enough for 5.68 0.87 27.30 6.68 55.61
15 8% of domestic production 2,429.83 16,987.53 488.26 2,642.71 172.04
Source: FAOSTAT, 2007
The condition for being eligible to withdraw food from the Bank is either that of an
emergency, or of a shortfall of food production by 8 percent. However, this percentage of
shortfall in production requires much larger quantity of foodgrain than the Bank has in
its reserve. For example, an 8 percent decrease in food production in Nepal means a
decrease by 488,260 metric tons, whereas the entire reserve of the Food Bank is only
486,000 metric tons. For larger countries like India, Pakistan and Bangladesh, the 8
percent decrease in production is much bigger than the amount of the foodgrain in the
Food Bank. It means, if the production shortfall is below the 8 percent, the member is not
eligible to withdraw foodgrain, and if the shortfall is 8 percent or above, the food reserve
in the Food Bank is not enough to meet the requirement. Thus, the SAARC Food Bank
has little role to play for the large countries in South Asia. This is why the food reserves
have never been utilized despite pressing demands in certain situations.
4.2.2 Qualifying for drawing from Food Reserve
Since the establishment of the SAARC Food Security reserve in 1988, neither Nepal, nor
any other member has declared a food emergency that makes them eligible to withdraw
food from the Reserve. Realizing this fact, the Agreement for Establishing the Food Bank
added the provision for enabling the countries to withdraw food in the case of a food
41
Prod
uctio
n as %
to th
e pa
st th
ree y
ear a
vera
ge
1992
/93
1993
/94
1994
/95
1995
/96
1996
/97
1997
/98
1998
/99
1999
/00
2000
/01
2001
/02
2002
/03
2003
/04
2004
/05
2005
/06
2006
/07
2007
/08
2008
/09
2009
/10
2010
/11
shortage, due to production shortfall, and /or storage shortfall (Article V number 3). But,
the necessary condition for this shortfall is that the production of foodgrain in the current
year must be 8 percent lower than the average of the production or storage of the
previous three years. Analysis of the food production data of the last two decades shows
that Nepal would never have qualified this condition during past two decades, as the
shortfall in the production of foodgrain was not more than 6.31 percent, even in the
severe drought year 1992/93 (Figure 25). It is not clear, however, from the agreement as
to how the storage shortfall would be measured. One exception given by the agreement is
that in specific cases, a member country may initiate a request on a seasonal basis, which
considers the impact of seasonal shortfall on annual production. It is not likely that a
shortfall of seasonal production by 8 percent can be deemed as a shortfall. If such shortfall
is allowed, Nepal has 16 percent probability that it will qualify for drawing foodgrain
from the reserve. The SAARC Food Bank Board has authority to revise this percent as per
need. But, like all other SAARC agreements, there is no time frame, and there are
accountability clogs (IPS 2008, p9). Moreover, the decisions and recommendations of the
Board shall be taken on the basis of unanimity (Article X), which means that unless all
the members agree for a revision of the conditions necessary for the operationalization of
the Bank, it is not likely to become operational.
Figure 25: Foodgrain, rice and wheat production as percent to the three year average
124
116
108
100
92
Foodgr ain
84 Ric e
Whe at
76
4.2.3 Procedure for drawing from the reserve No clearly specified provision is available with regards to food transportation mechanism,
border formalities, and institutional mechanisms for the swift delivery of foodgrain to the
country of need. Conditions specified for withdrawal of foodgrain from the Bank, are
difficult to meet, both until and unless there is emergency or severe shortage of more
than eight percent at an annual basis. Withdrawal of foodgrain is easier in the case of an
emergency than in the case of shortage. The procedure for the withdrawal of foodgrain

42
by a member, from its own share of the reserve is easier than withdrawing from the
reserve of other members. In case of emergencies, a member can withdraw food from its
share of the reserve by serving a notice to the Board and other members. In the case of a
food shortage, the foodgrain can be withdrawn only after three months19 from the date of
the notice (Article VIII). If particular members individual share of the reserve is not
enough to address its own emergency or shortage, then the member can notify the
amount of foodgrain required through its designated Nodal Point. The Deputy General
Manager (DGM) of NFC is the designated Nodal Point in Nepal. The country receiving
the request for food is to take immediate steps for speedy release of the requested
foodgrain (Article VI). For the operationalization of the Bank, a country has either to
declare emergency or give prior notice. The condition of three months prior notice for withdrawing from one‘s own reserve restricts the members from using the reserve in the
case of immediate problem of food shortage, particularly during the pre-harvest season.
The private sector is not allowed to transact the foodgrain from the Bank. The Nodal
Point is responsible for transacting all activities on behalf of the private sector importers
(Article X). This condition obstructs the private sector from efficient food transaction and
utilization. The members, however, are allowed to develop appropriate guidelines for
involving the private sector in conformity with its national legislations, procedures and
requirements.
The lengthy process of price determination is a hurdle for getting access to the food
reserves of other countries. Indeed, the members need to negotiate the prices, terms and
conditions of payment for each request that they make, which may take a long time. For
facilitating the process of negotiation, the Board is to approve a guideline (Article IX),
although, no information is available to demonstrate that the Board has approved any
such guideline. It is however, stated that in the case of emergency, the humanitarian
aspects will be given due importance while determining prices. Broad principles of price
determination includes that the price should be lower for the members, than to the non-
members, and shall represent market price (both domestic and international). These
principles do not guarantee that the foodgrain from the Bank will be cheaper than those
from the market. The lengthy process of withdrawal will be an added cost, pushing the
needy members to prefer food trade to using the Bank. Lack of motivation of the member
to withdraw food from the Bank limits the scope of its operationalisation.
4.3 Discussions on operational issues
Considering the terms and conditions set for the withdrawal of foodgrain from the
SAARC Food Bank, and the inadequacy of the automatic provisions for price setting,
boarder facilitations, transactions, and transportation, it is less likely that the foodgrain
from the Bank will be easily available at the time of need. Discussions with policy makers
19However, for withdrawing food from the voluntary reserve the notice period is one month.

43
reveal that the mechanism necessary for withdrawing foodgrain from the Bank is far from
clear.
The pricing mechanism for the food is not clear. Some provisions are set that the quoted
price needs to be lower than the price generally charged or quoted for countries beyond
the region. As the Bank is not for beyond the region, the provision refers to the price
quoted for commercial transactions and not for the food from the Bank. Nevertheless, it is
not clear that the price should be lower, and by what percent. Another clause states that
the price quoted should be representative of the domestic and international market price,
and that a national treatment is needed in calculating cost components. These statements
clearly show that the pricing be done on market price basis, or cost price basis, including
handling charges. Additional formalities of the Bank can add inefficiencies, and pricing at
the market price basis clearly discourages the needy countries from withdrawing food from the Bank. Possible introduction of ‗red tapism‘, and other inefficiency in price
determination makes the implementation of a pricing mechanism under the SFB a
difficult task.
Private traders are not allowed to transact for the food, even after the permission of the
Nodal Point. Nodal Point withdrawing and transacting the food on behalf of the private
sector increases the operational costs, discouraging the private sector. All these conditions
taken together make an arguably sure recipe for failure in the operationalization of
SAARC Food Bank. It is hard to find any suggestions as to how a pricing mechanism can
be implemented under the Food Bank mechanism.
The policy makers consulted are satisfied with the coverage of food items. Some of them,
however, added their concern for adding pulses in the food reserve. Policy makers other
than those working in NFC are less concerned with the storage of foodgrain. Decision
makers in NFC are concerned with the cumbersome work necessary for changing the
stock of foodgrain in order to avoid quality loss. The foodgrain need to be changed every
two to three years. NFC is using principle of first-in-first-out (FIFO) for changing the
stock of the grain. The system for withdrawing the food and replenishing the stock is still
not clearly documented.
No specific strategy is available to link PDS with the regional food bank. As both the
national food buffer stock for PDS, and regional food reserve for the Bank are maintained
by NFC, under the order and expenses of Ministry of Commerce and Supplies (MOCS), no
problem in institutional linkages is visualized. Policy makers have not felt any need for a
decentralized food distribution system outside the purview of NFC.
No special arrangement is found for LDCs in the operation of the SFB. It is still not well
documented how countries in immediate need can be assisted to benefit from the system.
Though small countries and LDCs are more vulnerable to food insecurity, no special and

44
differential provision is made for such countries. For geographically large countries, loss
in food production due to some natural calamities in one part of the country can be
pooled to other less affected areas, reducing the risk of hunger. But, for a small country,
the entire country may get affected by calamities such as droughts, and this can lead to
food insecurity. LDCs have low level of technology bases from which they can increase
food production and adapt to the shocks of natural calamities that are being accentuated
by climate change. Recognizing the problem of smallness of size and low levels of
development, the importance of regional collective actions is higher for food security in
LDCs.
5. Summary
Rice, wheat and maize are the staple foods in Nepal. The country is nearly food self-
sufficient, with some five percent deficits in odd years. However, within the country,
food security varies from region to region. Mountain areas and the mid-western hills are
food insecure, and urban areas are food insufficient. The public distribution system is not
well developed. Nepal Food Corporation (NFC) procures food from food surplus Terai
areas and sells in food deficit areas with the aid of government transportation subsidy.
Though NFC is entrusted with maintaining a food reserve for the SAARC Food Bank of
8,000 metric tons, the corporation is not clear about how this food can be withdrawn in
the time of need. NFC has never attempted to withdraw food from the Food Reserve. In
two and a half decades of history of SAARC food reserve and food bank, the foodgrain
have not once been utilization for reducing hunger and malnutrition among the South
Asian people. Inadequacy of political determination can be taken as the major hindrance
to the operation of the food reserve.
Though the name of the reserve was changed to the SAARC Food Bank in 2007, South
Asian countries have no swift process through which they can draw food at the time of
need. The SAARC Food Bank Board was formed for setting necessary mechanisms for the
operationalization of the Food Bank. However, the board's decisions need to be
unanimous. Also the process of calling annual meetings and deciding unanimously is time
consuming. Indeed, such processes can take longer to occur, than it takes for a famine to
take lives of South Asian people residing in food insecure areas. In effect, this means that
the Board is unresponsive to some of the challenges affecting the food security and lives
of many within certain parts of LDCs. The SAARC Food Bank agreement has no special
and differential provision for LDCs.
6. Recommendations
The recommendations emerging from the study are presented in two sections—national
level and regional level.

45
6.1 Recommendations at national level
6.1.1 Nepal government
A built-in policy and institutional mechanisms are necessary in order for the food
reserves to be distributed to food insecure, remote, rural and vulnerable areas. Such
mechanisms include the use of PDS, use of a food coupon system, and the linking of food
supply to the credit system. The establishment of fair price shops and food depots can also
be useful for implementing food coupons.
Considering the annual fluctuation of foodgrain production by two to seven percent,
Nepal needs to maintain a national food reserve of at least five percent of its annual consumption. Considering the annual need of 5.07 million metric tons of cereals, Nepal‘s
food reserve of 25,000 metric tons is not sufficient, and it needs to increase 10 times in
order to maintain the 250,000 metric tons of food reserve necessary to cope with an
abnormal food crisis, arising due to adverse situations and production shortfall. Increasing
access to the SAARC Food Bank can reduce the amount needed for the national reserve,
saving costs and reducing the risks of food insecurity. However, Nepal needs to fulfil its
share of foodgrain 8,000 metric tons of good quality foodgrain for this reserve, and ensure
such commitments are fulfilled on time. The government needs to regularly assess the
areas of the country facing food emergency and shortage.
Nepal's food situation is not stable. Considering the time series data of the 'Food Balance
Sheet', there were years when foodgrain were in shortage. The distribution of food in
food insecure areas is not effective, and although the WFP and the NFC are helping,
neither have done so in an effective manner. In this background, the Government of
Nepal can play an important role in fulfilling the food requirement of deficit areas
through the SAARC Food Bank. A portion of the subsidy received by the NFC for
transportation can be given to the community for the storage and distribution of food.
6.1.2 Local governments in Nepal
For the efficient distribution of foodgrain in food insecure areas, PDS can be linked to
local level institutions such as the local governments, cooperatives, and local charity
organizations. The District Food Security Committee can coordinate all the concerned
institutions in the district including the NFC branch, local NGOs and local charity
organizations. Such decentralization is necessary at a time when Nepal is leading towards
a federal state. PDS can also be linked to self-help groups or local institutions working for
food security. The government needs to implement PDS by developing targeted programs
for the identified food insecure regions and groups. A close linkage from PDS to the Bank
is necessary for the swift operation of Food Bank. PDS can use food coupons and subsidies
to immediately meet the food needs of the poor. PDS can utilize the help of local
governments, local level NGOs, and charity organizations in order to quickly reach
people in need.
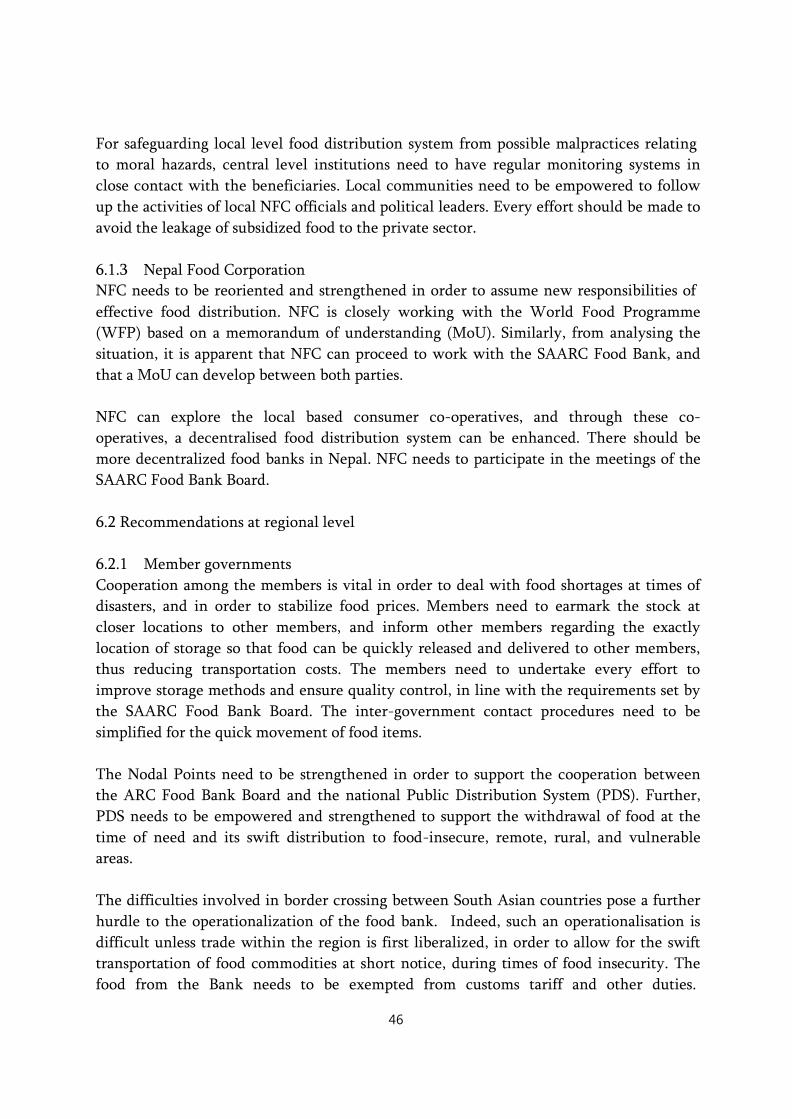
46
For safeguarding local level food distribution system from possible malpractices relating to moral hazards, central level institutions need to have regular monitoring systems in
close contact with the beneficiaries. Local communities need to be empowered to follow
up the activities of local NFC officials and political leaders. Every effort should be made to
avoid the leakage of subsidized food to the private sector.
6.1.3 Nepal Food Corporation
NFC needs to be reoriented and strengthened in order to assume new responsibilities of
effective food distribution. NFC is closely working with the World Food Programme
(WFP) based on a memorandum of understanding (MoU). Similarly, from analysing the
situation, it is apparent that NFC can proceed to work with the SAARC Food Bank, and
that a MoU can develop between both parties.
NFC can explore the local based consumer co-operatives, and through these co-
operatives, a decentralised food distribution system can be enhanced. There should be
more decentralized food banks in Nepal. NFC needs to participate in the meetings of the
SAARC Food Bank Board.
6.2 Recommendations at regional level
6.2.1 Member governments
Cooperation among the members is vital in order to deal with food shortages at times of
disasters, and in order to stabilize food prices. Members need to earmark the stock at
closer locations to other members, and inform other members regarding the exactly
location of storage so that food can be quickly released and delivered to other members,
thus reducing transportation costs. The members need to undertake every effort to
improve storage methods and ensure quality control, in line with the requirements set by
the SAARC Food Bank Board. The inter-government contact procedures need to be
simplified for the quick movement of food items.
The Nodal Points need to be strengthened in order to support the cooperation between
the ARC Food Bank Board and the national Public Distribution System (PDS). Further,
PDS needs to be empowered and strengthened to support the withdrawal of food at the
time of need and its swift distribution to food-insecure, remote, rural, and vulnerable
areas.
The difficulties involved in border crossing between South Asian countries pose a further
hurdle to the operationalization of the food bank. Indeed, such an operationalisation is
difficult unless trade within the region is first liberalized, in order to allow for the swift
transportation of food commodities at short notice, during times of food insecurity. The
food from the Bank needs to be exempted from customs tariff and other duties.
47
Interconnectedness of the food reserves is necessary to reduce the cost of transportation.
For example, food transportation from northern Uttar Pradesh of India would be cheaper
for those in the Mid-western hills of Nepal than the food transportation from Eastern
Nepal. Similarly, the food reserve in Eastern Nepal can be utilized for meeting the
shortfall in eastern parts of India. Effective pricing policies and border facilitation have
great potentials to reduce costs of food transportation and ensuring food security in South
Asia. The food prices should be 20 percent lower than the commercial trading price for
the same quality of foodgrain. The terms and conditions of payment need to be pre-
established by the Board.
6.2.2 SAARC Food Bank Board
SAARC Food Bank Board has the authority to develop procedures for the
operationalization of the Bank. However, its lengthy mechanisms for the convening of
meetings and decision making, delays the delivery of food. Clarity is needed on
procedures for the withdrawal of foodgrain by a member country from its own share of
the reserve, on the determination of foodgrain prices available in the reserve of other
members, on institutional arrangements supporting the Board, and on the conditions for
the replenishment of the reserve. For facilitating the effective operationalization of the
Bank, the Board needs to operationally define what constitutes an emergency case and a
shortfall. It needs to authorize Nodal Points of the member countries to use food check in
order to decide, at short notice, whether to draw the foodgrain from its own reserve. The
food needs to be released immediately after getting the food check by the authority that
holds the foodgrain. The Nodal Point needs full authority to request other Nodal Points to
release the food (Figure 26). The Nodal Points require the authority to accept food checks
from other members and immediately dispatch the food to the needy member.
The member country should follow Article IX, Determination of Price, as mentioned in
Agreement on Establishing the SAARC Food Bank. This requires revision now and then.
For getting immediate access to the food reserve in other member countries, the
conditions for price setting should be agreed in advance so that there will be no need to
negotiate at the time of food shortage or emergency. The Board needs to set a pre-
established mechanism for pricing, releasing, transportation, border crossing and
distribution of the foodgrain at any time when a member feels that its people are
suffering from food insecurity. Special preference needs to be given to LDCs in food
pricing, releasing and border crossing. In developing pre-established pricing mechanisms,
care should be given so that no member can increase the food price by incorporating its
inefficiency in production, storage, and handling.
48
Figure 26: Coordination for operation of SAARC Food Bank
SAARC Food Bank Board
Coordination
Food reserve
within the country
Food release at short
notice
Issue food
check Nodal Point
Request for
food check
Food reserve in
other members
Food dispatch at
pre-set price and
conditions
Local
government
Public Distribution
System
Local NGOs /
charity
Food insecure people, district, region
The SAARC Food Bank Board has a mandate of developing a common response under joint initiative to collectively combat food shortfall in a member country. In developing
such common responses, it needs to take the concerns of LDCs more seriously. The major
concerns are the low level of food production technology, the less developed
infrastructures and the low affordability of food for the poor. LDCs require support in
production technology and infrastructure, and also in the supply of food at a lower price.
The Board needs to simplify the conditions for replenishing food after the harvest, so that
it will actually function like a bank. The Board needs to carry out further study, in order
to better understand the effects of food release from the bank on food security, on the
local food market, on food trade and on food production.
The Board needs to obtain technical assistance from food security experts by inviting
papers in Board meetings. Inclusion of the representatives of food related ministries from
the member countries would add value to the Board.
Continuity of the Board members is necessary for its effective functioning. For this
purpose, the members can nominate the Board members for a fixed term in such a way
that no more than two members will be new in each Board meeting. For example, if
Board members are nominated for four years, and two board members retire every year,
then there will be a continuity of experience within the board. To start with this scheme,

49
the members for the first time should nominate their representative for varying years20.
6.2.3 SAARC Secretariat
The SAARC Food Bank Board should have a dedicated secretariat for implementing its
decisions. The Board needs to be empowered to link the Food Bank to international
institutions concerned with food security, such as the International Food Policy Research
Institute (IFPRI) and the International Fund for Agricultural Development (IFAD).
Linking the Food Bank to such institutions is a key in securing the funds necessary for the
smooth and efficient operations of the Food Bank. The Board should have the authority to
request for official development assistance (ODA) to increasing the food stock in South
Asia and for helping LDCs in the region in particular. The agreement establishing the
SAARC Food Bank needs to be revised to introduce special and differential provisions for
LDCs in the region, particularly in reference to food supply and pricing. If a LDC member
country is given access to the Bank‘s food reserves, the member should have the option to
either pay the food provider or to increase an equivalent amount of food in its own
reserve in the next harvesting season.
Due to production season or food shortages in the domestic market, it is often difficult for
needy countries to restore their food reserves within six months after withdrawing. In
this regard, the SAARC Food Bank agreement needs to be revised in order to give the
members at least one full year to restore the depleted reserves. Similarly, the terms ‗emergency‘ and ‗shortage‘ need to be clearly defined to include the severity of each
particular case.
20 For the first time, two countries nominate the SFB Board member for four years, two countries for three
years, two members for two years and rest two members for one year. From second time and onward, every
member needs to nominate its member for four years.

50
References
Ahmed, M. F., A. A. Polash, B. U. Maruf, M. S. Ullah, M. K. Akanda, S. A. Haque, M. S.
Iqbal, and R. K. Chowdhury. 2011. ―SAARC Food Bank: Will It Be Enough Broad Based.‖
Briefing Paper for Building Opinion 4, People‘s Campaign on 17th SAARC Summit,
November. Accessed June 13, 2012.
http://www.alternative-regionalisms.org/wp-content/uploads/2012/03/saarc-food-
bank.pdf.
APPROSC and JM Associates. 1995. ―Nepal Agriculture Perspective Plan.‖ Final Report. Kathmandu.
Carrasco, B., and H. Mukhopadhyay. 2012. ―Food Price Escalation in South Asia—A
Serious and Growing Concern.‖ Working Paper Series 10. Manila: Asian Development
Bank.
CBS. 2011a. Poverty in Nepal: Summary report based on third living standard survey
2010. Kathmandu: Central Bureau of Statistics.
CBS. 2011b. Nepal Living Standard Survey 2010/2011. Statistical Report Volume Two.
Kathmandu: Central Bureau of Statistics.
DOC, 2011. Strategic Plan of Department of Commerce (2011-2013). Kathmandu:
Department of Commerce.
FAO and SAARC. 2008. Final Report: Regional Strategies and Program for Food Security in SAARC Member States. FAO Regional Office for Asia and Pacific Bangkok, SAARC
Secretariat, Kathmandu, Nepal.
FAO. 2010. The State of Food Insecurity. Rome: Food and Agriculture Organization of
the United Nations.
FAO. 2011. The State of Food Insecurity. Rome: Food and Agriculture Organization of
the United Nations.
FAO. 2012. ―Hunger Dimensions.‖ In FAO Statistical Year Book 2012. Rome: Food and
Agriculture Organization.
Frankenberger, T. R., T. Walters, E. Kiff, and G. D. Awasthi. 2010. Nepal: An Evaluation of WFP‘s Portfolio Vol I Full report. Report number: OE/2010/010. Office of Evaluation
Measuring Results, Sharing Lessons, World Food Program.

51
GAFSP. 2010. ―Attachment 2 - Nepal Agriculture and Food Security Country Investment
Plan.‖ The Global Agriculture & Food Security Program. Accessed on February 25, 2012.
http://www.gafspfund.org/gafsp/sites/gafspfund.org/files/Documents/Nepal%204%20of%2
09%20Country%20Investment%20Plan.pdf.
HLTF. 2009. ―Nepal Country fiche.‖ High Level Task Force on the Global Food Security
Crisis. Accessed on February 26, 2012.
http://un-foodsecurity.org/sites/default/files/09November_fiche_Nepal.pdf.
ICIMOD. 2008. ―Food Security in the Hindu Kush Himalayan region.‖ ICIMOD Position
Paper. Kathmandu: The International Centre for Integrated Mountain Development.
IDL Group. 2006. Agriculture Perspective Plan: Implementation Status Report. Volume I. Bristol.
IMF. 2011. NEPAL: 2011 ARTICLE IV CONSULTATION. IMF Country Report No
11/318. Washington DC: International Monetary Fund.
Institute of Policy Studies (IPS). 2008. ―Strengthening Economic & Social Integration in
South Asia.‖ Summary of Proceedings of Regional Conference, Colombo, May 30 – 31.
Jenkins, R., and A. M. Goetz. 2002. ―Civil Society Engagement and India‘s Public
Distribution System: Lessons from the Rationing Kruti Samiti in Mumbai.‖ Presented at
'Making Services Work for Poor People' World Development Report 2003/04 Workshop,
Eynsham Hall, Oxford, November 4-5 . Accessed on May 19, 2012.
http://www.righttofoodindia.org/data/jenkins-goetz2002civil-society-engagement-
pds.pdf.
Korachais, C. 2011. ―Human Assets Index Computing retrospective series from 1970 to
2008.‖ FERDI Working Paper, Fondation pour es études et recherches sur le développement international.
Mittal, S., and D. Sethi. 2009. ―Food Security in South Asia: Issues and Opportunities.‖
Working paper 240. Indian Council for Research on International Economic Relations.
MOAC and AICC. 2004. National Agricultural Policy 2061. Ministry of Agriculture and
Cooperatives, and Agricultural Information and Communication Center, Kathmandu.
MOAC and AICC. 2010b. Attachment 1: National Agriculture Sector Development
Priority (NASDP) for the Medium-Term (2010/11 - 2014/15). Ministry of Agriculture and
Cooperatives, and Agricultural Information and Communication Center, Kathmandu.

52
MOAC. 2010a. Validation Workshop Report on National Agriculture Sector Development Priority (NASDP) and National Medium-Term Priority Framework (NMTPF). Ministry of Agriculture and Cooperatives, Kathmandu.
MOAC. 2010c Statistical Information on Nepalese Agriculture 2009/2010 (2066/067). Ministry of Agriculture and Cooperatives, Agri-Business Promotion and Statistics
Division, Kathmandu.
MOAC. 2011. Statistical Information in Nepalese Agriculture. Ministry of Agriculture and
Cooperatives, Kathmandu.
MOF. 2011. Economic Survey 2010/11. Ministry of Finance, Kathmandu.
National Planning Commission (NPC). 2011a. ―Nepal Status Paper.‖ Presented in United
Nations Conference on Sustainable Development 2012, Rio, Brazil, 2011a.
National Technical Working Group (NTWG). 2007. ―Country Position Paper: Nepal.‖
Presented at a special programme on Regional Food Security.
NFC. 2011. Glimpses of Nepal Food Corporation. Published on the occasion of 37th
Anniversary, Nepal Food Corporation, Kathmandu.
NPC and FAO. 2008. FAO: Support for Inclusion of Food Security Objectives, Policies,
Programmes and Monitoring in the PRSP/Interim Plan of Nepal. FNOP/INT/109/NOR.
National Planning Commission, Kathmandu.
NPC. 2010a. The Food Security Atlas of Nepal. ISBN 978-9937-2-2529-8. National
Planning Commission, Food Security Monitoring Task Force.
NPC. 2010b. Millennium Goal Needs Assessment for Nepal 2010. By Agriculture and
Food Security Task Group, National Planning Commission, Kathmandu.
NPC. 2011b. Three Year Plan. National Planning Commission, Kathmandu.
Pandey, P. R. 2009. ―Trade Policy as an Instrument to Ensure Food Security: A case of
Nepal.‖ Bangkok: United Nations Economic and Social Commission for Asia and the
Pacific (UN ESCAP).
Pokharel, R. K., R. Houston, P. Harvey, R. Bishwakarma, J. Adhikari, K. D. Pant, and R.
Gartoulla. Nepal Nutrition Assessment and Gap Analysis, Final Report. Child Health
Division, Ministry of Health and Population, Kathmandu.
53
Puri, R. 2012. ―Reforming the Public Distribution System: Lessons from Chhattisgarh.‖
Economic and Political Weekly 47 (5): 21-23. Accessed on May 19, 2012.
http://ssrn.com/abstract=2004959.
Pyakurel, B., Y. B. Thapa, and D. Roy. 2005. ―Trade liberalization and food security in
Nepal.‖ MTID Discussion Paper 88, International Food Policy Research Institute.
Accessed on May 19, 2012.
http://www.ifpri.org/sites/default/files/publications/mtidp88.pdf.
Robinson, M. J. D. 2011. ―Regional grain banking for food security: past and present
realities from SAARC initiatives.‖ CUTS International, Jaipur.
SAARC. 2010. Thimphu Silver Jubilee Declaration. 16th SAARC Summit,
SAARC/summit.16/15, Thimphu, April 28-29.
Singh, R. B., and A. Prevatt. 2010. FAO-USAID Joint Mission on National Programme for
Food Security in Nepal. FAO and USAID, Nepal, June 18.
UN. 2004. Committee for Development Policy: Report on the sixth session (29 March – 2
April 2004). Official Records, Supplement No 13. Economic and Social Council, United Nations.
UN. 2008. Handbook on the Least Developed Country Category: Inclusion, Graduation
and Special Support Measures. Committee for Development Policy and Department of
Economic and Social Affairs.
UN. 2009. ―Data Retrieval.‖ Development Policy and Analysis Division (DESA), United
Nations. Accessed on March 21, 2012.
UN. 2010. World Statistics Pocketbook 2010. New York: United Nations Publication.
UN. 2011. ―Programme of Action for the Least Developed Countries for the Decade 2011- 2020.‖ Fourth United Nations Conference on the Least Developed Countries, Istanbul,
Turkey, May 9-13.
United Nations World Food Programme (WFP). 2009. ―A subregional Hunger Index for
Nepal.‖By Siemon Hollema and Miriam Bishokarma. Kathmandu, Nepal.
WFP. 2010. ―Nepal Operations Summary.‖ Rome: United Nations World Food
Programme.

54
World Bank. 2006. ―World Development Report: Equity and Development.‖ Washington
DC.
World Bank. 2012. ―World Development Report: Gender Equality and Development.‖
Washington DC.

55
Annexes
Annex I: List of policy makers consulted
Name Designation Institute
1 Rajendra Prasad Baskota Acting DGM NFC
2 Khadga Bahadur Khadka Division Chief Planning Division, NFC
3 Moti Raj Shakya Senior Officer Planning Division, NFC
Chandra Man Shrestha Staff Purchase Division, NFC
4 Naindra Prasad Upadhaya Joint Secretary Ministry of Commerce and
Supplies (member of SFB
Board)
5 Himal Thapa Under Secretary Ministry of Commerce and
Supplies
6 Binod Prasad Acharya Under Secretary Ministry of Commerce and
Supplies
7 Dr Sudarshan Bhakta
Mathema
Freelance
Consultant
8 Ganesh Prasad Dhakal Joint Secretary Office of the President (former
member of SFB Board)
9 Dr. Jagannath Adhikari Freelance
consultant
Martin Chautari,
10 Chandra Bahadur Thapa National Consultant Food and Agriculture
Organization of UN

56
Annex II: Questionnaire for survey
Nepal Case Study on
The LDC Issues for the Operationalization of the SAARC Food Bank
Questionnaire for survey of policymakers and other stakeholders
Name:
Designation, if any:
Office, if any:
1. I want to know why South Asian Food Security Reserve (SAFSR) 1988 did not get
operationalised.
2. Any idea why SAARC Food Bank 2007 is not yet operationalized?
3. The SAARC Food Bank has 4 objectives:
act as a regional food security reserve for the SAARC countries during food
shortages and emergencies;
provide regional support to national food security efforts;
foster inter-country partnerships and regional integration; and
solve regional food shortages through collective action.
Do you feel that the SAARC Food Bank can achieve these objectives? Yes/no
If no, which objective is not likely to be achieved and why?
4. Would you like to tell something about the commitments of the government to
operationalise the regional food bank?
5. Do you feel convenient on the coverage of food items (rice and wheat), storage (at
different locations) and withdrawal conditions?
6. Would you like to suggest any policy and institutional mechanisms that can be
introduced for the regional food bank to be able to be accessible for poor people
in food-insecure remote, rural and vulnerable areas in mountains and Mid- and
Far- western hills?
7. Do you have any suggestion how NFC can be linked with the SAARC Food Bank
(strategically and institutionally)?
8. Would you like to suggest any institutional options to NFC to implement a

57
decentralized distribution system, for example, with certain institutional
arrangements at the community level (through local governments or self-help
groups or community seed banks)?
9. Do you have any suggestion on the pricing mechanism under the SAARC Food
Bank?
10. Would you like to suggest anything to Nepal government to benefit from the
SAARC Food Bank?
11. Any suggestion how should the mapping of food-insecure areas and distribution
of food can be done?
12. Any suggestion how the food distribution activities of SAARC Food Bank, World
Food Programme and NFC can be coordinated?
13. Any other suggestions for Operationalization of the SAARC Food Bank
Thanks a lot!!!

58
National
expenditure
Agriculture Irrigation Forestry Total
expenditure in
agriculture
sector
% to total
expenditure
1998/99 59579.0 2018.6 3051.6 1208.8 6279.0 10.54
1999/00 66272.5 2239.1 3161.7 1304.5 6705.3 10.12
2000/01 79835.1 2433.6 4085.0 1303.6 7822.2 9.80
2001/02 80072.2 2696.3 3184.9 1638.7 7519.9 9.39
2002/03 84006.1 1971.0 2344.6 1645.1 5960.7 7.10
2003/04 89442.6 2016.2 2472.0 1783.5 6271.7 7.01
2004/05 102560.4 2334.7 2332.4 1992.8 6659.9 6.49
2005/06 110889.2 2702.9 2866.4 1823.2 7392.5 6.67
2006/07 133604.6 4140.4 3463.9 1865.1 9469.4 7.09
2007/08 161349.9 6269.7 4089.1 2160.1 12518.9 7.76
2008/09 219662.0 4957.0 6289.5 2723.2 13969.7 6.36
2009/10 259689.1 6588.9 8652.1 3327.9 18568.9 7.15
Annex III: Expenditure of Government on Agriculture and Irrigation (1998/99 2009/10)
(Rs. in Million) Agriculture Irrigation
Current Capital Total Current Capital Total
1998/99 1,696.0 322.6 2,018.6 326.9 2,724.7 3,051.6
1999/00 1,695.0 544.1 2,239.1 362.4 2,799.3 3,161.7
2000/01 1,881.6 552.0 2,433.6 400.4 3,684.6 4,085.0
2001/02 2,190.9 505.4 2,696.3 271.4 2,913.5 3,184.9
2002/03 1,784.0 187.0 1,971.0 503.7 1,840.9 2,344.6
2003/04 1,856.0 160.2 2,016.2 401.1 2,070.9 2,472.0
2004/05 2,117.2 217.5 2,334.7 410.9 1,921.5 2,332.4
2005/06 2,437.5 265.4 2,702.9 403.7 2,462.7 2,866.4
2006/07 2,766.2 1,374.2 4,140.4 451.3 3,012.6 3,463.9
2007/08 3,057.9 3,211.8 6,269.7 484.0 3,605.1 4,089.1
2008/09 4,401.0 556.9 4,957.0 593.7 5,695.8 6,289.5
2009/10 5,950.3 638.6 6,588.9 677.5 7,974.6 8,652.1
Source: MOF 2011 Economic Survey 2010/11 Ministry of Finance, Kathmandu
Annex IV: Total expenditures and agriculture sector expenditures (Rs million)

59
Annex V: Foreign Aid Disbursement on Agriculture and Irrigation (1984/85 2009/10)
(Rs. in million) Agriculture Irrigation
Grant Loan Total Grant Loan Total
1984/85 89.4 376 465.4 154.8 294.4 449.2
1985/86 83.9 542.3 626.2 103.3 473.9 577.2
1986/87 61.1 287.2 348.3 59.7 455 514.7
1987/88 70.6 482.7 553.3 23 453.3 476.3
1988/89 82.6 446.9 529.5 71.1 720.8 791.9
1989/90 92.5 443.7 536.2 46.9 725.5 772.4
1990/91 62.4 547.2 609.6 20.4 414.9 435.3
1991/92 126.4 270.4 396.8 93.9 1065 1,158.9
1992/93 171.4 553.5 724.9 192.9 834.2 1,027.1
1993/94 263.9 1801 2,064.9 82.7 1631 1,713.7
1994/95 492.4 810 1,302.4 313.7 1,569.4 1,883.1
1995/96 83.8 1,013.5 1,097.3 109.8 1,992.7 2,102.5
1996/97 162.4 273.7 436.1 171.6 1,876.8 2,048.4
1997/98 144.4 780.5 924.9 NA 1,681.9 1,681.9
1998/99 100.5 808.9 909.4 192.5 2,003.0 2,195.5
1999/00 79 788.3 867.3 205.3 1,867.8 2,073.1
2000/01 27.5 778.8 806.3 347.1 2,436.8 2,783.9
2001/02 289.5 607.2 896.7 183.5 1,895.9 2,079.4
2002/03 141.3 433.2 574.5 245.1 996.4 1,241.5
2003/04 193.8 481.1 674.9 409.1 993.1 1,402.2
2004/05 457.7 294.3 752 489.8 895.8 1,385.6
2005/06 460.3 365.5 825.8 795 575.8 1,370.8
2006/07 633.5 1,419.8 2,053.3 546.8 185.1 731.9
2007/08 568.2 2,039.7 2,607.9 676.9 198.6 875.5
2008/09 362.1 362.1 724.2 962.0 322.0 1284.0
2009/10 492.0 460.7 952.9 1461.0 555.8 2016.0
Source: Economic Survey 2010/11, MOF.
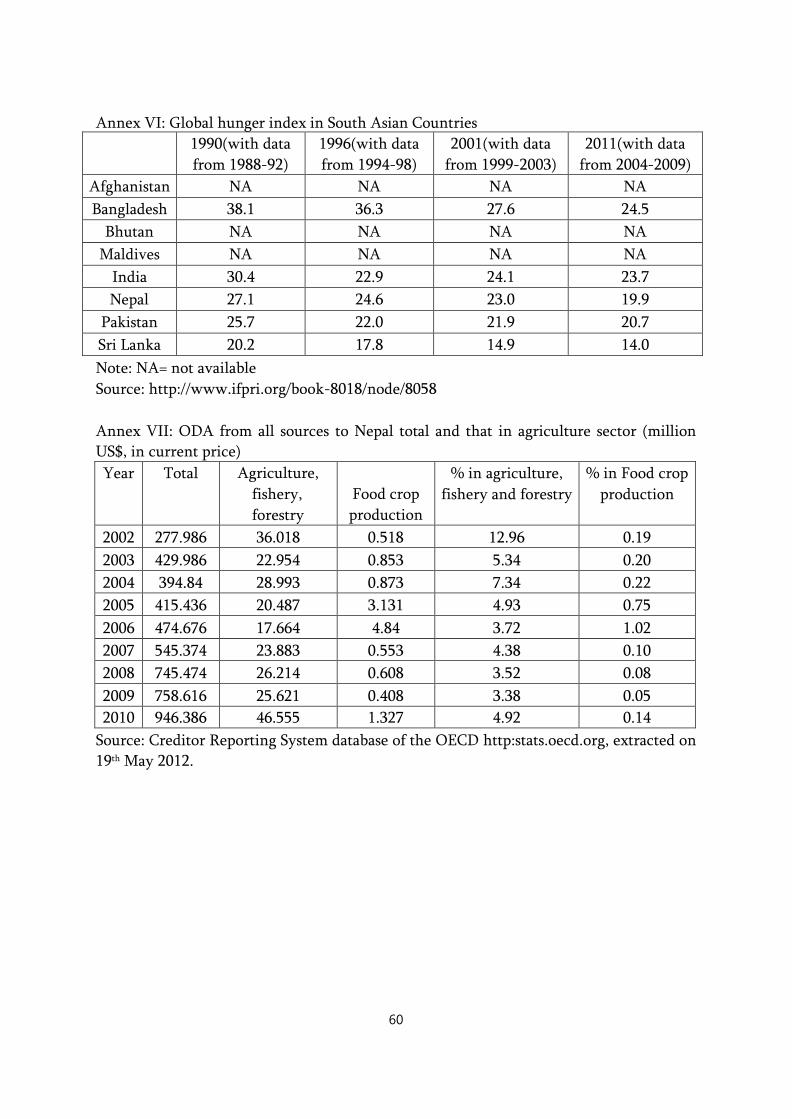
60
1990(with data
from 1988-92)
1996(with data
from 1994-98)
2001(with data
from 1999-2003)
2011(with data
from 2004-2009)
Afghanistan NA NA NA NA
Bangladesh 38.1 36.3 27.6 24.5
Bhutan NA NA NA NA
Maldives NA NA NA NA
India 30.4 22.9 24.1 23.7
Nepal 27.1 24.6 23.0 19.9
Pakistan 25.7 22.0 21.9 20.7
Sri Lanka 20.2 17.8 14.9 14.0
Year Total Agriculture,
fishery,
forestry
Food crop
production
% in agriculture,
fishery and forestry
% in Food crop
production
2002 277.986 36.018 0.518 12.96 0.19
2003 429.986 22.954 0.853 5.34 0.20
2004 394.84 28.993 0.873 7.34 0.22
2005 415.436 20.487 3.131 4.93 0.75
2006 474.676 17.664 4.84 3.72 1.02
2007 545.374 23.883 0.553 4.38 0.10
2008 745.474 26.214 0.608 3.52 0.08
2009 758.616 25.621 0.408 3.38 0.05
2010 946.386 46.555 1.327 4.92 0.14
Annex VI: Global hunger index in South Asian Countries
Note: NA= not available Source: http://www.ifpri.org/book-8018/node/8058
Annex VII: ODA from all sources to Nepal total and that in agriculture sector (million
US$, in current price)
Source: Creditor Reporting System database of the OECD http:stats.oecd.org, extracted on 19th May 2012.
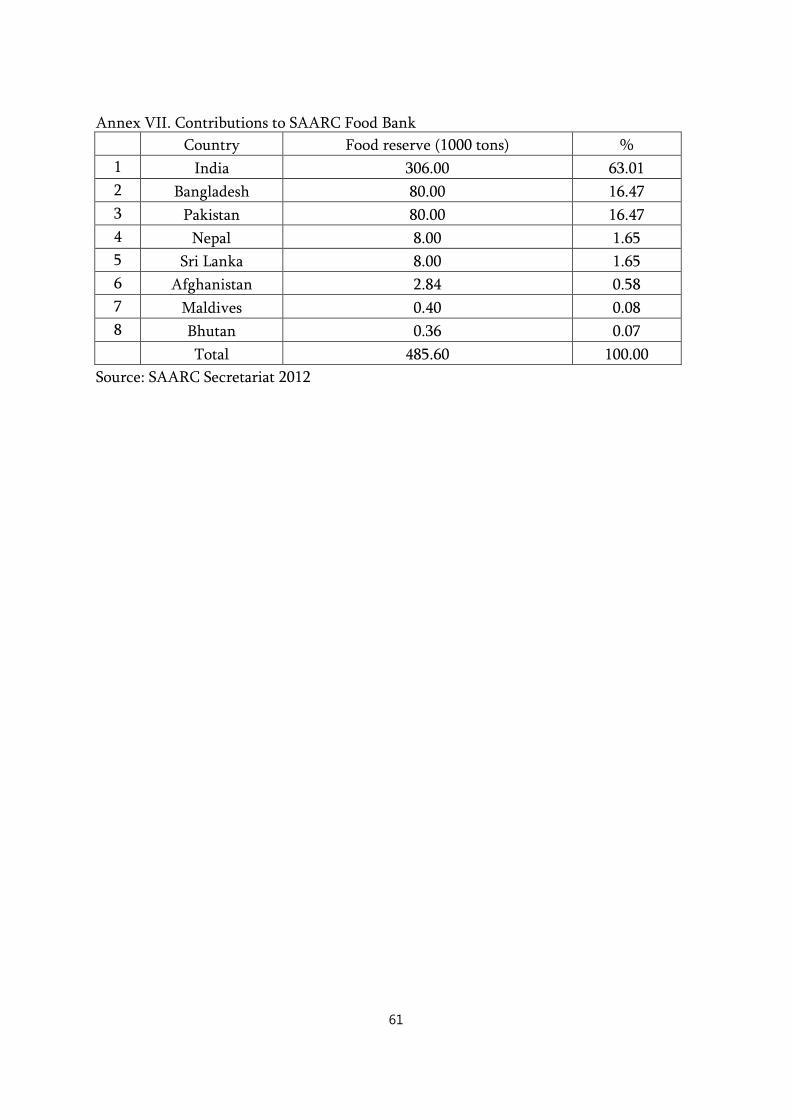
61
Country Food reserve (1000 tons) %
1 India 306.00 63.01
2 Bangladesh 80.00 16.47
3 Pakistan 80.00 16.47
4 Nepal 8.00 1.65
5 Sri Lanka 8.00 1.65
6 Afghanistan 2.84 0.58
7 Maldives 0.40 0.08
8 Bhutan 0.36 0.07
Total 485.60 100.00
Annex VII. Contributions to SAARC Food Bank
Source: SAARC Secretariat 2012


