Describing and re-creating what you see Show the class a poster or object and ask them to decribe what they can see as accurately as they can. Sit two students back to back and give one of them a simple geometric design. As this person to describe the design so that the second person can reproduce it accurately.
Alhambra pattern This tiling pattern may be found in the Alhambra palace in Granada, Spain. • How would you describe
this pattern to someone who cannot see it?
• Describe how individual tiles may have been constructed.
Visualising Ask students to shut their eyes and imagine a situation in which something is changing. Ask them to describe what they 'see'.
Cube of cheese Imagine you have a cube of cheese and a knife. Imagine you cut off one small corner of the cheese. What shape do you get? Imagine cutting more and more parallel slices off the cheese. How will your triangle change? What shapes will be revealed? Keep going until there is no cheese left! Now change the angle of your knife....
Looking for structure Give students a problem that encourages them to look for different structures within a context. Ask them to use their structures to make generalisations. In the example shown, they may be asked: • In what different ways can you count
the cables? • Can you see the diagram in different
ways? o Can you see it as composed of
parallellograms or triangles ? o Can you see a 3 dimensional
shape ?
Suspension bridge cables
When making a cable for a suspension bridge, many strands are assembled into a hexagonal formation and then 'compacted' together. This diagram illustrates a 'size 5' cable made up of 61 strands. How many strands are needed for a size 10 cable? How many for a cable that is size n?
The Alhambra pattern task and the Suspension bridge cables task are both taken from Swan and Crust (1993) Mathematics Programmes of Study, Inset for Key Stages 3 and 4, National Curriculum Council, York.
Looking for structure Ask students to draw or make a model of a structure that they can see. For example, they could use matchsticks, modelling clay and polythene film to make a model of this diamond crystal structure.
Diamond crystal in matrix
Look at this image of a diamond in its matrix rock. What structure does it appear to have?
Similarities and differences Show students three objects. "Which is the odd one out?" "Describe properties that two share that the third does not." "Choose a different object from the three and justify it as the odd one out."
(a) (b) (c)
(a) y = x2-6x+8 (b) y = x2-6x+9 (c) y = x2-6x+10
Show students some silhouettes of animals. "Can you name the animals?" "Cut out the 20 cards and arrange the animals into groups." "Write down the criteria you used to establish the groups." "Show your groups to another student. Can they work out what your criteria were from your groupings?"
Properties and definitions Show students an object. "Look at this object and write down all its properties." "Does any single property constitute a definition of the object? If not, what other object has that property?" "Which pairs of properties constitute a definition and which pairs do not?"
"Look at this animal and write down all its features." "Does any single feature uniquely identify the bird? If not, what other animal has that property/feature?" "Which pairs of properties would uniquely decribe the bird? which pairs do not?"
Creating and testing a definition Ask students to write down the definition of a polygon, or some other mathematical word. "Exchange definitions and try to improve them." Show students a collection of objects. "Use your definition to sort the objects." "Now improve your definitions."
Which of these is a polygon according to your definition?
Ask students to write down a description of a bird, or some other plant or animal. "Exchange descriptions and try to improve them." Ask the students to look at silhouettes of some animals. “Using only your description, decide which of these animals can be called ‘birds’." "Now improve your description."
Which of these is a bird according to your description?
Classifying using a two-way table Give students a two-way table to sort a collection of objects. "Create your own objects and add these to the table." "Try to justify why particular entries are impossible to fill."
(The silhouettes of animals are taken from Nuffield-Chelsea Curriculum Trust, 1987).
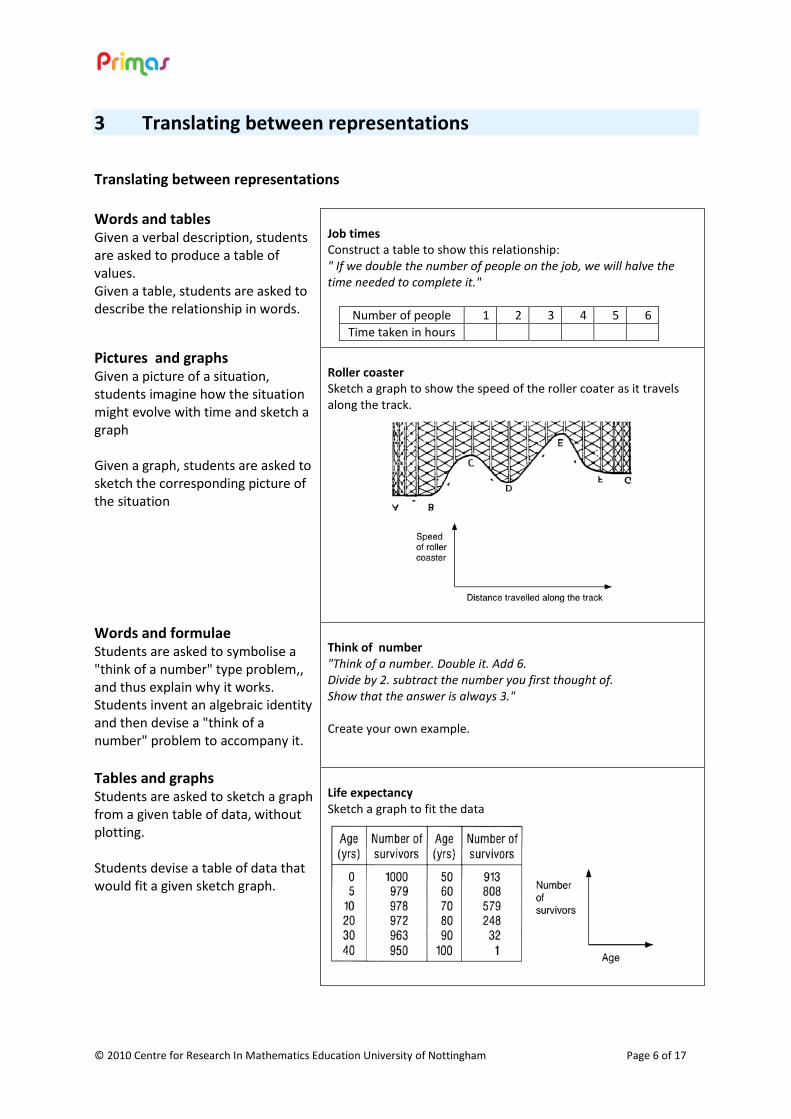
Translating between representations Words and tables Given a verbal description, students are asked to produce a table of values. Given a table, students are asked to describe the relationship in words.
Job times Construct a table to show this relationship: " If we double the number of people on the job, we will halve the time needed to complete it."
Number of people 1 2 3 4 5 6 Time taken in hours
Pictures and graphs Given a picture of a situation, students imagine how the situation might evolve with time and sketch a graph Given a graph, students are asked to sketch the corresponding picture of the situation
Roller coaster Sketch a graph to show the speed of the roller coater as it travels along the track.
Words and formulae Students are asked to symbolise a "think of a number" type problem,, and thus explain why it works. Students invent an algebraic identity and then devise a "think of a number" problem to accompany it.
Think of number "Think of a number. Double it. Add 6. Divide by 2. subtract the number you first thought of. Show that the answer is always 3." Create your own example.
Tables and graphs Students are asked to sketch a graph from a given table of data, without plotting. Students devise a table of data that would fit a given sketch graph.
Translating between representations (continued) Tables and formulae Given a table of data, students search for a general rule which governs it. Students use this rule to make predictions.
Tournaments The table shows the number of matches (m) that are required for a league tournament, where each team plays every other team twice, once at home and once away. Find a formula that gives the relationship between the number of teams (n) and the number of matches (m).
Number of teams (n) 2 3 4 5 6 7 8 Number of matches (m) 2 6 12 20 30 42 56
Use your formula to predict new entries in the table. (E.g. How many matches do 20 teams require ?)
Formulae and graphs Students plot the points on a spreadsheet and try to fit an algebraic function to the data using trial and improvement methods. This involves translating directly back and forth between graphs and formulae, building up valuable intuitions about the shapes of various functions.
Penguins Try to fit a function of the form y = axn to the graph showing average heights and weights of five types of penguin. Predict the weight of a now extinct penguin whose height was believed to be 150 cm.
Height (cm)
Weight (kg wt)
Emperor 114 29.48 King 94 15.88 Yellow eyed 65 5.44 Fjordland 56 3.18 Southern blue 41 1.13
05
101520253035
0 50 100 150
Height (cm)
Roller coaster and Life Expectancy were taken from Swan (1985) The Language of Functions and Graphs, Shell Centre for Mathematical Education/Joint Matriculation Board. Tournments was adapted from Swan (1983) Problems with Patterns and Numbers, Shell Centre for Mathematical Education/Joint Matriculation Board. These examples also appeared in Swan and Crust (1993) Mathematics Programmes of Study, Inset for Key Stages 3 and 4, National Curriculum Council, York.
Matching different representations Each group of students is given a set of cards. They are invited to sort the cards into sets, so that each set of cards have equivalent meaning. As they do this, they have to explain how they know that cards are equivalent. They also construct for themselves any cards that are missing. The cards are designed to force students to discriminate between commonly confused representations. Card Set A: Algebra expressions
Swan, M. (2008), A Designer Speaks: Designing a Multiple Representation Learning Experience in Secondary Algebra. Educational Designer: Journal of the International Society for Design and Development in Education, 1(1), article 3.
Work on the following problem together. Trees About how many trees are needed each day to provide newspapers for your country?
Try to make a reasonable estimate based on facts that you already know.
In solving this question, you have had to make assumptions and construct a chain of reasoning. Write down a list of estimation questions that would be suitable for your own class.
What measures do your students meet in everyday life? Make a list: Possible activities for students: Comparing measures Give students two ways of measuring something. Ask students to compare them and say why one is better than another.
Measuring slope
Creating measures Ask students to devise a measure for an everyday phenomenon and then use it.
How would you measure: • the "compactness" of a geometrical shape? • the "stickiness" of adhesive tape? • the "bendiness" of a river? • the "difficulty" of a bend in the road? • the "fitness" of a person?
Measuring compactness The inadequacy of using area ÷ perimeter as a measure of compactness may be seen by comparing two similar shapes of different sizes. Consider, say a square of side two units and a square of side three units. We would say that they are equally compact as they are both squares, but using the ratio area ÷ perimeter, their measures would be different: 4/8 = 0.5 and 9/12 = 0.75.
We could adapt this measure to make it dimensionless by using the formula: C =ap2 ,
where a = area and p = perimeter. This would then give the value 1/16 to both squares. This ratio
takes a maximum value wShen the shape is circular. In this case, C =πr2
(2πr)2 =1
4π.
In order to make the measure lie between 0 and 1, we could therefore scale the measure by multiplying by 4π. This is used by geographers and is called the Circularity ratio (Selkirk, 1982): Circularity ratio
C1 =4πap2 where a = area; p = perimeter of the shape
One criticism of this measure is that it is difficult to define and calculate p when one is trying to measure very large, irregular boundaries like countries or river basins. Other possible measures, also quoted by Selkirk, are: Form ratio
C2 =4aπl2 where a = area; l = length of a line joining the two most distant points
Compactness ratio
C3 =a
πR2 where a = area; R = radius of smallest circle that surrounds the shape
Radius ratio
C4 =
rR
where r = radius of largest circle that will fit inside the shape;
R = radius of smallest circle that surrounds the shape
Each group of students is given a set of statements on cards. Usually these statements are related in some way. They have to decide whether they are always, sometimes or never true.
• If they think it is always or never true, then they must try to explain how they can be sure. • If they think it is sometimes true, they must define exactly when it is true and when it is not.
Pay rise
Max gets a pay rise of 30%. Jim gets a pay rise of 25%.
So Max gets the bigger pay rise.
Sale
In a sale, every price was reduced by 25%. After the sale every price was
increased by 25%. So prices went back to where they started.
Area and perimeter
When you cut a piece off a shape you reduce its area and perimeter.
Right angles
A pentagon has fewer right angles than a rectangle.
Birthdays
In a class of ten students, the probability of two students being born on the same
day of the week is one.
Lottery
In a lottery, the six numbers 3, 12, 26, 37, 44, 45
are more likely to come up than the six numbers 1, 2, 3, 4, 5, 6.
Bigger fractions
If you add the same number to the top and bottom of a fraction, the fraction gets
bigger in value.
Smaller fractions
If you divide the top and bottom of a fraction by the same number, the fraction
gets smaller in value.
Square roots
The square root of a number is less than or equal to the number
Series
If the limit of the sequence of terms in an infinite series is zero, then the sum of the
Devising a fair test Students are asked to devise and conduct an experiment to find the relationship between two or more variables. As they do this, they must consider how they will control other variables. As they do this, they must consider how they will control other variables.
One lump or two?
It takes some time for sugar cubes to dissolve in coffee. What factors might affect the rate of dissolving? Devise and conduct an experiment to investigate the relationship between the rate of dissolving and one of these factors. Paper aeroplane
Width
Alice wants to know how to make a paper aeroplane that will fly for a long time. What factors might affect the flight time? Devise and conduct an experiment to investigate the relationship between the flight time and one of these factors.
Exploring how a calculator works Students are given a spreadsheet or online calculator to explore. The challenge is to find out how it works. For example, the calculator shown here is used on websites to help an adult decide if he or she is overweight. Students enter values for heights and weights and collect data in order to discover how the calculator calculates the BMI. There are many other examples online.
Body Mass Index
Try to find out how the calculator works out the body mass index from the height and weight of a person.
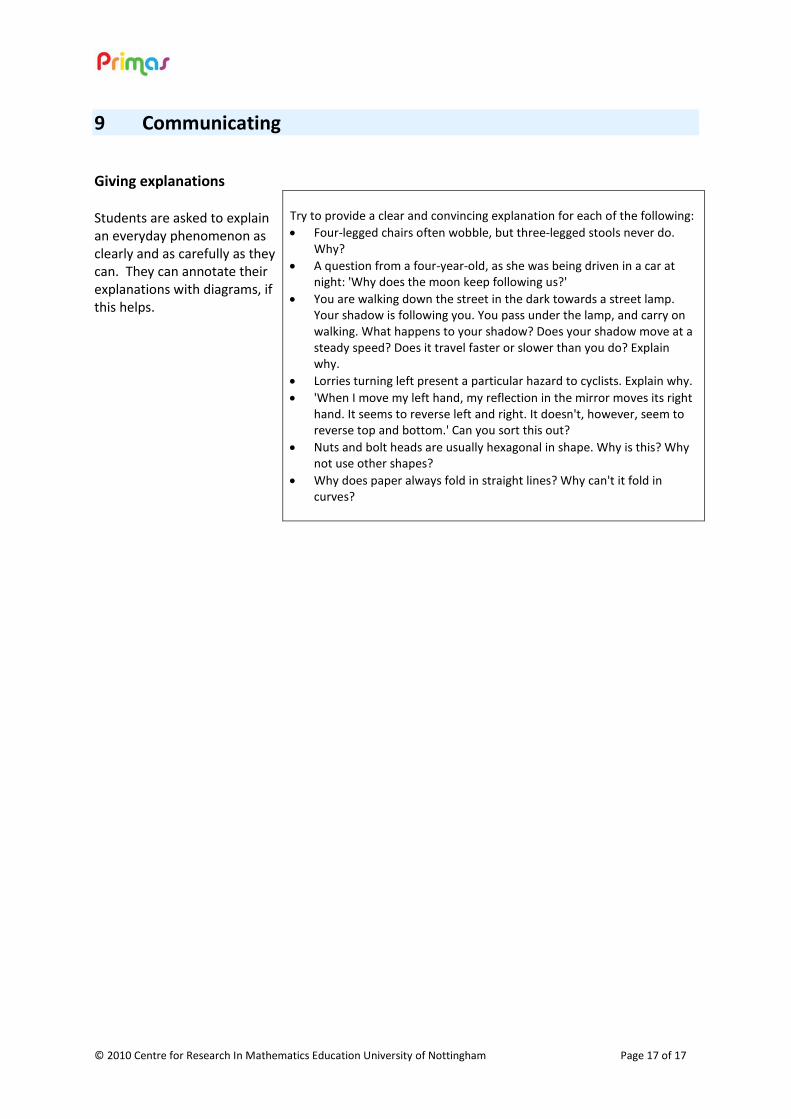
Giving explanations Students are asked to explain an everyday phenomenon as clearly and as carefully as they can. They can annotate their explanations with diagrams, if this helps.
Try to provide a clear and convincing explanation for each of the following: • Four-legged chairs often wobble, but three-legged stools never do.
Why? • A question from a four-year-old, as she was being driven in a car at
night: 'Why does the moon keep following us?' • You are walking down the street in the dark towards a street lamp.
Your shadow is following you. You pass under the lamp, and carry on walking. What happens to your shadow? Does your shadow move at a steady speed? Does it travel faster or slower than you do? Explain why.
• Lorries turning left present a particular hazard to cyclists. Explain why. • 'When I move my left hand, my reflection in the mirror moves its right
hand. It seems to reverse left and right. It doesn't, however, seem to reverse top and bottom.' Can you sort this out?
• Nuts and bolt heads are usually hexagonal in shape. Why is this? Why not use other shapes?
• Why does paper always fold in straight lines? Why can't it fold in curves?