Page 1
10/10/17
1
• Reading: Ch4; 125, 132-136 (structure determination)Ch4; 12-130 (Collagen)
• Problems: Ch4 (text); 10, 15
NEXT
• Reading: Ch1; 27-29Ch5; 157-158, 160-161
• Problems: Ch1 (text); 16Ch4 (text); 1, 2, 3, 4, 6, 7, 8
Lecture11(10/10/17)
OUTLINEProtein CharacterizationA. Quaternary structure
1. How determined; a. native sizeb. subunit size
2. UltracentrifugationB. Tertiary structure
1. X-ray diffraction/crystallography2. NMR spectroscopy3. Comparison: NMR versus X-ray crystallography
C. Secondary structure1. Circular dichroism (CD)
D. Collagen1. Special Fibrous Protein: 2. Clues to structure3. 4-S’s4. Biosynthesis 5. Disorders
Lecture11(10/10/17)
Page 2
10/10/17
2
ProteinCharacterization
QuaternaryStructure
MALDI
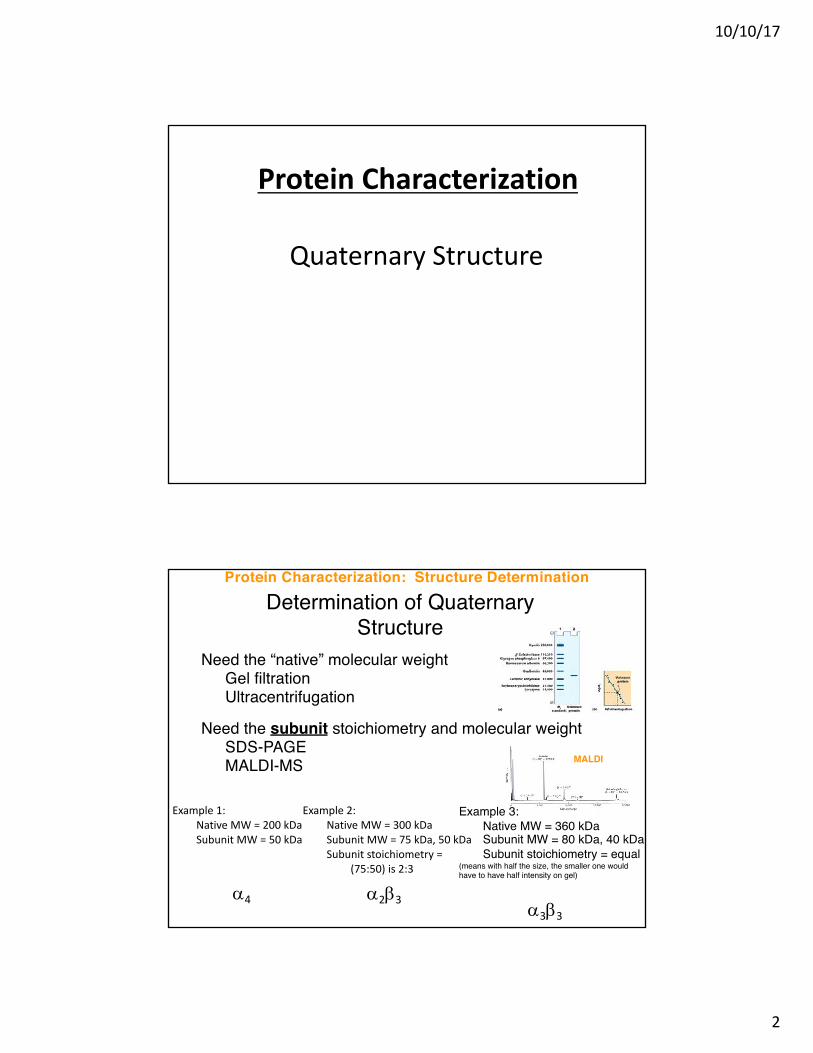
Determination of Quaternary Structure
Need the “native” molecular weightGel filtrationUltracentrifugation
Need the subunit stoichiometry and molecular weightSDS-PAGEMALDI-MS
Example2:NativeMW=300kDaSubunitMW=75kDa,50kDaSubunitstoichiometry=
(75:50)is2:3
a2b3
Example1:NativeMW=200kDaSubunitMW=50kDa
a4
Example 3: Native MW = 360 kDaSubunit MW = 80 kDa, 40 kDaSubunit stoichiometry = equal
(means with half the size, the smaller one would have to have half intensity on gel)
a3b3
Protein Characterization: Structure Determination
Page 3
10/10/17
3
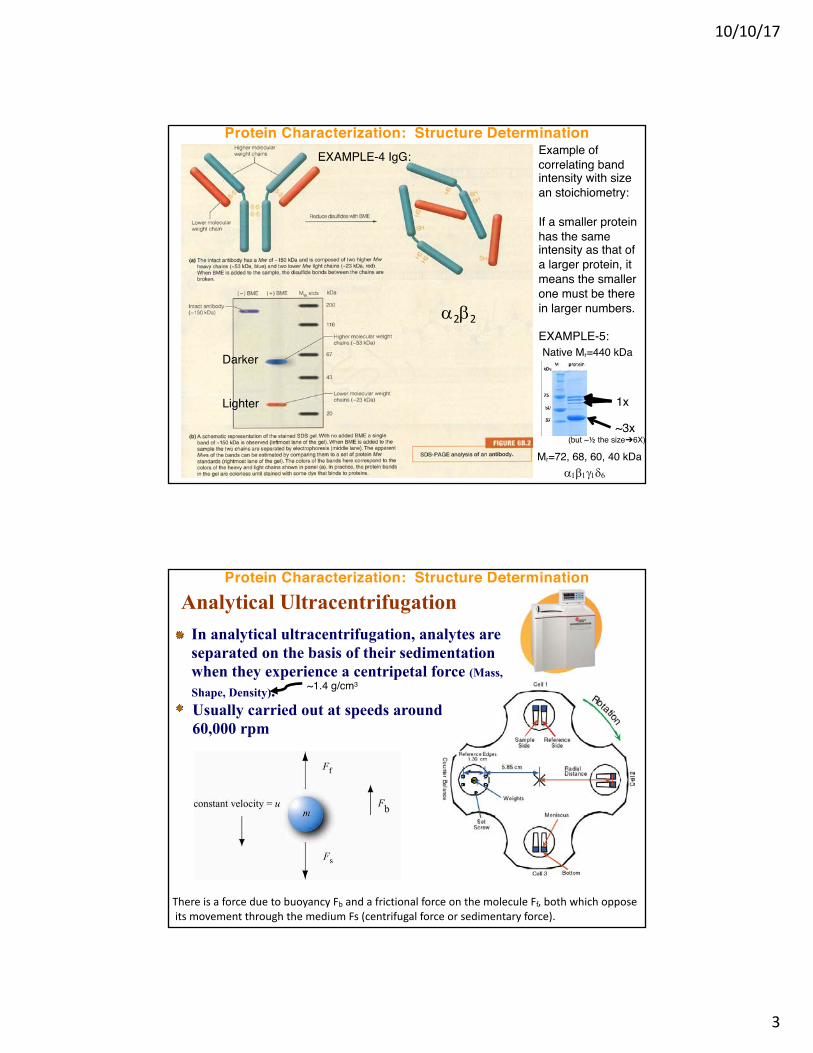
Protein Characterization: Structure DeterminationExample of correlating band intensity with size an stoichiometry:
If a smaller protein has the same intensity as that of a larger protein, it means the smaller one must be there in larger numbers.
EXAMPLE-5:
~3x
1x
a1b1g1d6
Mr=72, 68, 60, 40 kDa
Native Mr=440 kDa
EXAMPLE-4 IgG:
(but ~½ the size➔6X)
Darker
Lighter
a2b2
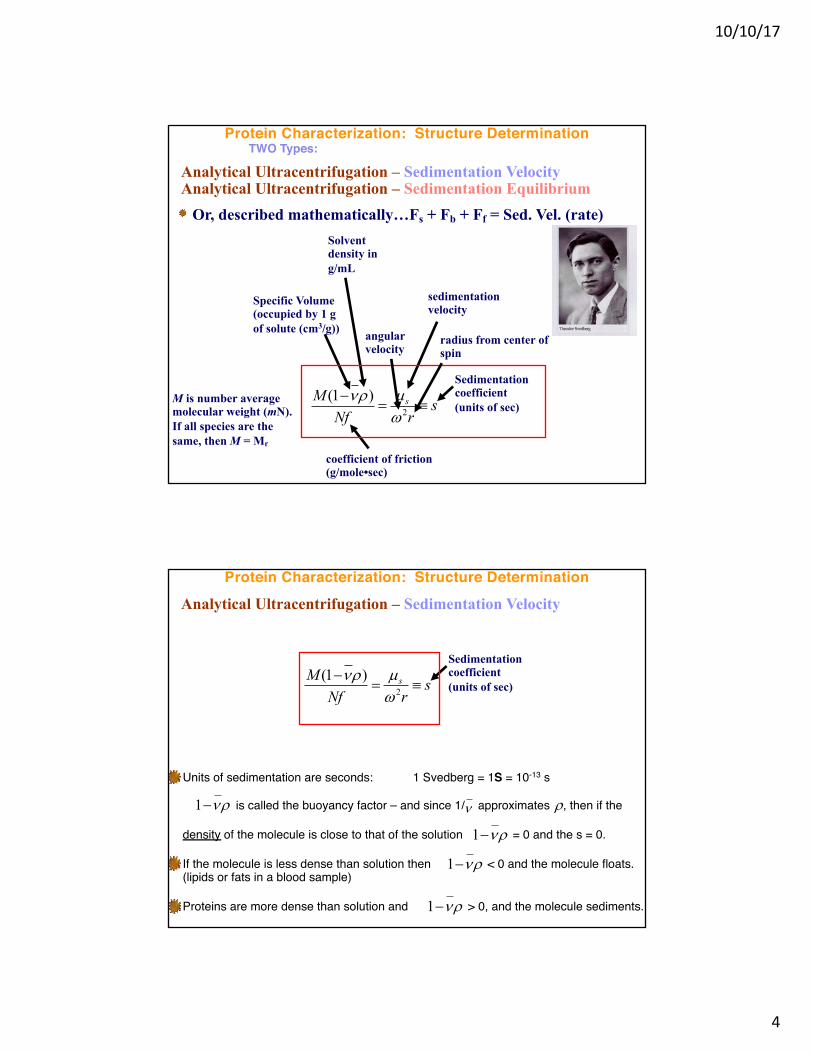
Analytical UltracentrifugationIn analytical ultracentrifugation, analytes are separated on the basis of their sedimentation when they experience a centripetal force (Mass,
Shape, Density).Usually carried out at speeds around 60,000 rpm
ThereisaforceduetobuoyancyFb andafrictionalforceonthemoleculeFf,bothwhichopposeitsmovementthroughthemediumFs(centrifugalforceorsedimentaryforce).
Protein Characterization: Structure Determination
~1.4 g/cm3
Page 4
10/10/17
4
Or, described mathematically…Fs + Fb + Ff = Sed. Vel. (rate)
srNf
M s º=-
2
)1(wµrn
coefficient of friction (g/mole•sec)
sedimentation velocity
Specific Volume (occupied by 1 g of solute (cm3/g))
Solvent density in g/mL
Sedimentation coefficient(units of sec)
radius from center of spin
angular velocity
Analytical Ultracentrifugation – Sedimentation Velocity
Protein Characterization: Structure Determination
Analytical Ultracentrifugation – Sedimentation Equilibrium
M is number average molecular weight (mN). If all species are the same, then M = Mr
TWO Types:
srNf
M s º=-
2
)1(wµrn
Sedimentation coefficient(units of sec)
Units of sedimentation are seconds: 1 Svedberg = 1S = 10-13 s
is called the buoyancy factor – and since 1/ approximates , then if the
density of the molecule is close to that of the solution = 0 and the s = 0.
If the molecule is less dense than solution then < 0 and the molecule floats. (lipids or fats in a blood sample)
Proteins are more dense than solution and > 0, and the molecule sediments.
rn-1 n r
rn-1
rn-1
Analytical Ultracentrifugation – Sedimentation Velocity
Protein Characterization: Structure Determination
rn-1
𝘥⩟
Page 5
10/10/17
5
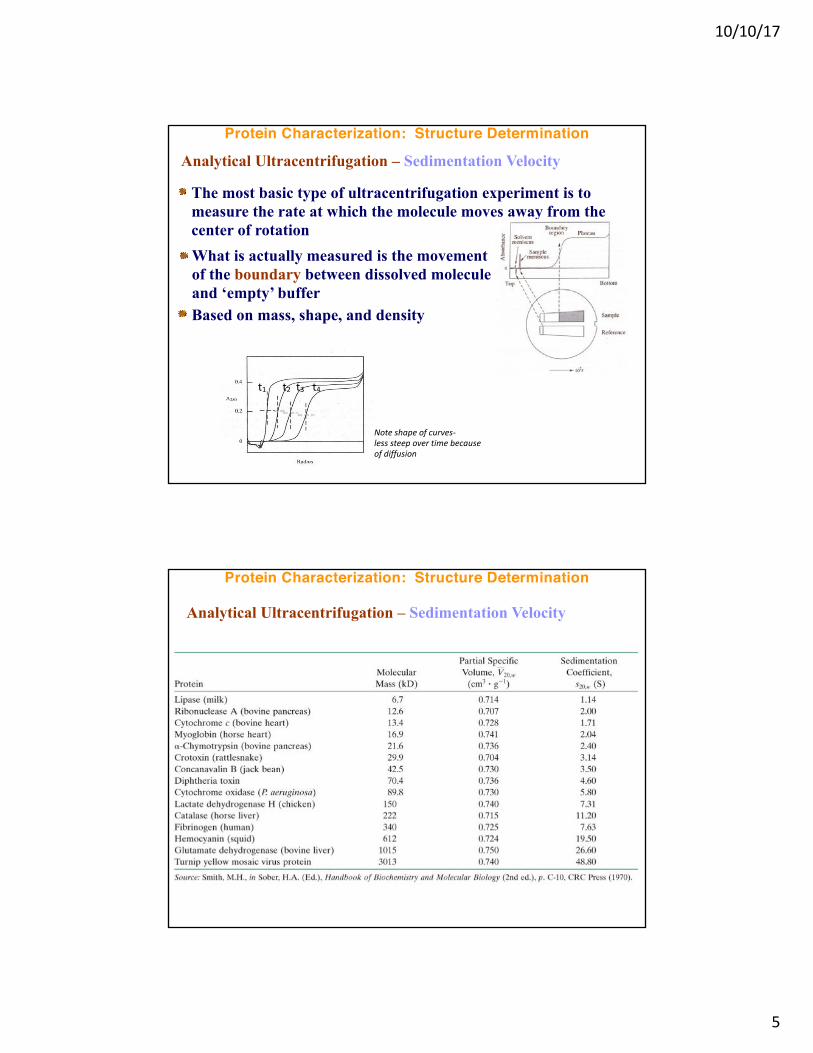
The most basic type of ultracentrifugation experiment is to measure the rate at which the molecule moves away from the center of rotation What is actually measured is the movement of the boundary between dissolved molecule and ‘empty’ buffer
t1 t2 t3 t4
Noteshapeofcurves-lesssteepovertimebecauseofdiffusion
Analytical Ultracentrifugation – Sedimentation Velocity
Based on mass, shape, and density
Protein Characterization: Structure Determination
Analytical Ultracentrifugation – Sedimentation Velocity
Protein Characterization: Structure Determination
Page 6
10/10/17
6
Analytical Ultracentrifugation – Sedimentation Equilibrium
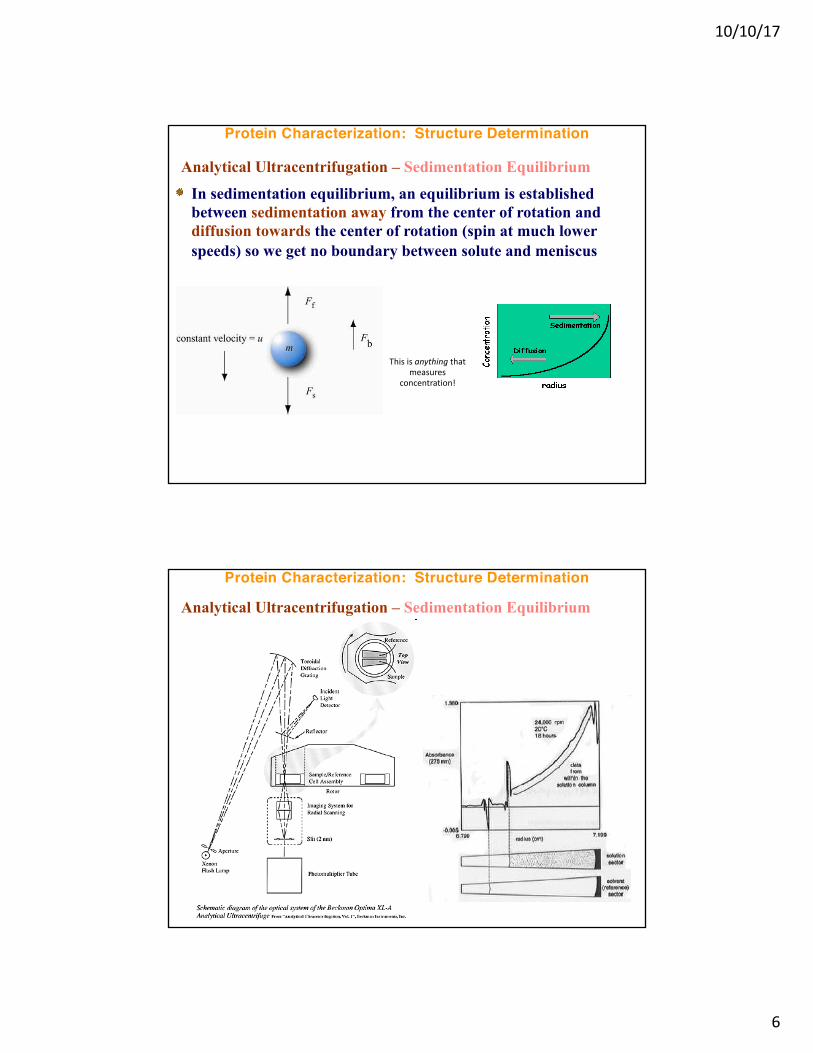
In sedimentation equilibrium, an equilibrium is established between sedimentation away from the center of rotation and diffusion towards the center of rotation (spin at much lower speeds) so we get no boundary between solute and meniscus
Thisisanything thatmeasures
concentration!
Protein Characterization: Structure Determination
Analytical Ultracentrifugation – Sedimentation Equilibrium
Protein Characterization: Structure Determination
Page 7
10/10/17
7
Analytical Ultracentrifugation – Sedimentation EquilibriumDeterminingMolecularWeight
2/)(0,
20
2
)( rrAA eCrC -= s
RTM 2)1( wrns -
=whereCanbedescribedbyequation:
ThisiscanbeexpressedintermsofM:
M =2kT ln
CAC0(r2 – r02)
____________________(1- vr) w2
_
Protein Characterization: Structure Determination
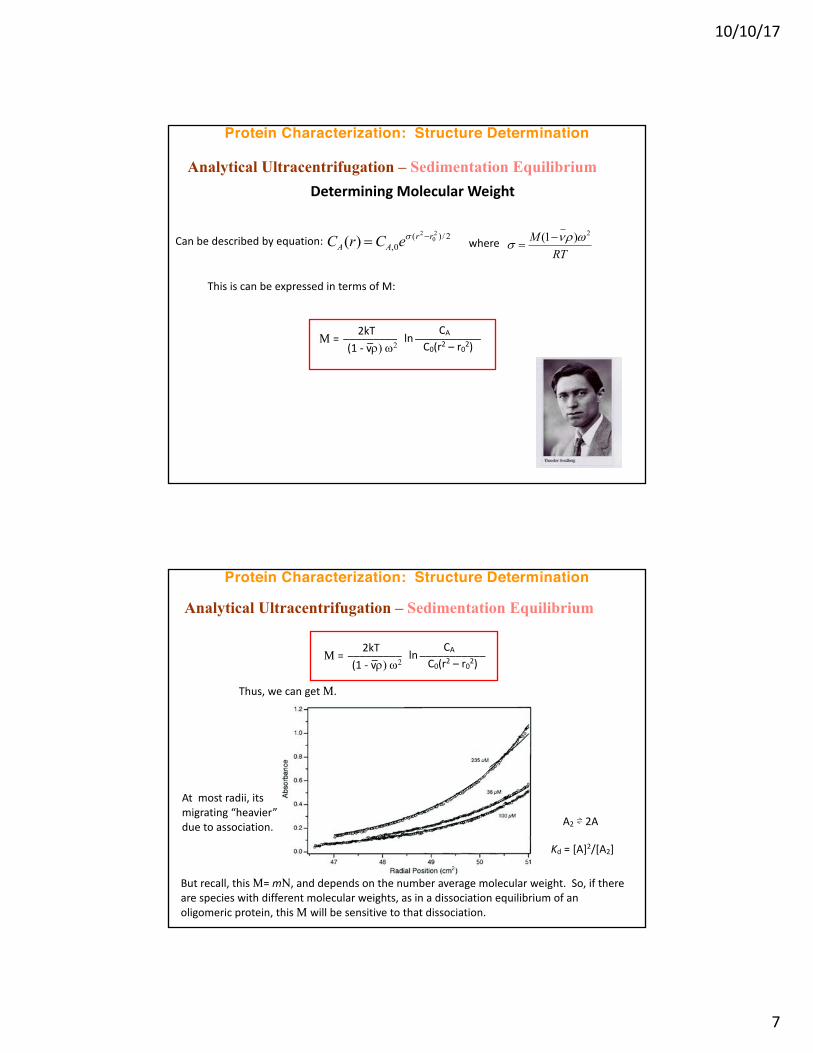
Analytical Ultracentrifugation – Sedimentation Equilibrium
M =2kT ln
CAC0(r2 – r02)
____________________(1- vr) w2
_
Thus,wecangetM.
Protein Characterization: Structure Determination
Butrecall,thisM=mN,anddependsonthenumberaveragemolecularweight.So,iftherearespecieswithdifferentmolecularweights,asinadissociationequilibriumofanoligomericprotein,thisM willbesensitivetothatdissociation.
A2 ⇌ 2A
Kd =[A]2/[A2]
Atmostradii,itsmigrating“heavier”duetoassociation.
Page 8
10/10/17
8
Protein Characterization
Tertiary Structure
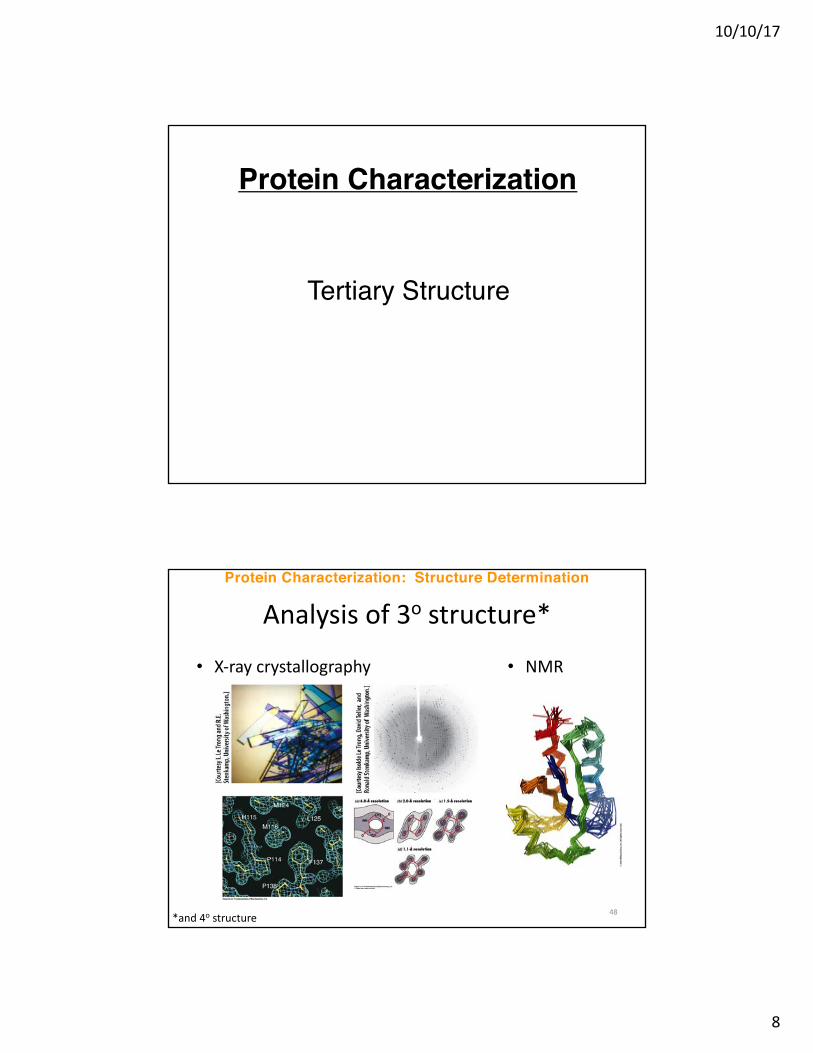
Analysisof3o structure*
• X-raycrystallography • NMR
48
Protein Characterization: Structure Determination
*and4o structure
Page 9
10/10/17
9
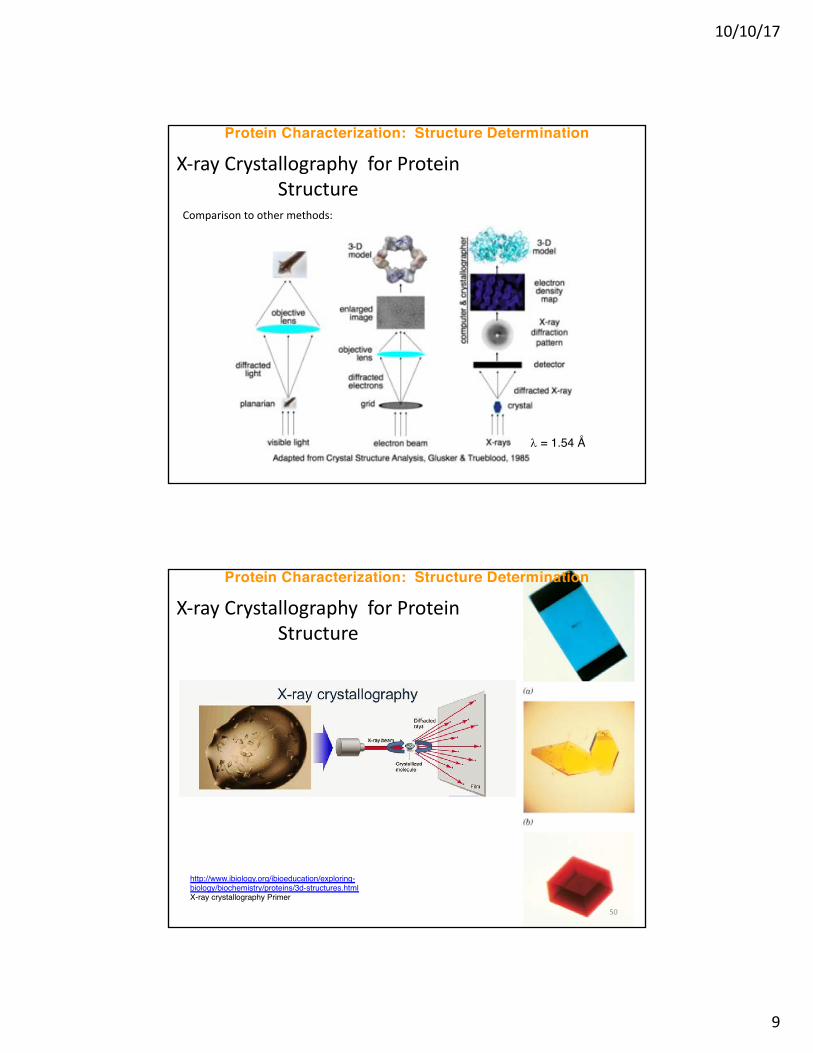
X-rayCrystallographyforProteinStructure
Protein Characterization: Structure Determination
Comparisontoothermethods:
l = 1.54 Å
X-rayCrystallographyforProteinStructure
50
Protein Characterization: Structure Determination
http://www.ibiology.org/ibioeducation/exploring-biology/biochemistry/proteins/3d-structures.htmlX-ray crystallography Primer
Page 10
10/10/17
10
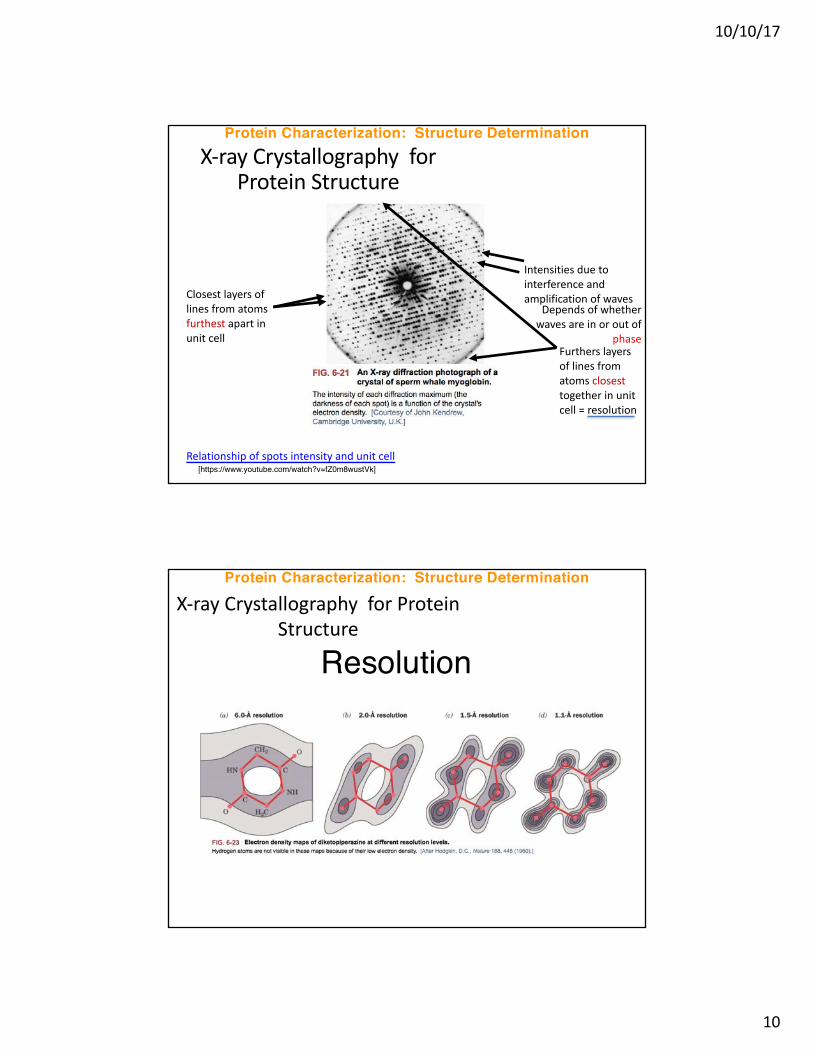
X-rayCrystallographyforProteinStructure
Closestlayersoflinesfromatomsfurthest apartinunitcell
Furtherslayersoflinesfromatomsclosesttogetherinunitcell=resolution
Intensitiesduetointerferenceandamplificationofwaves
Protein Characterization: Structure Determination
Dependsofwhetherwavesareinoroutof
phase
Relationshipofspotsintensityandunitcell[https://www.youtube.com/watch?v=fZ0m8wustVk]
X-rayCrystallographyforProteinStructure
Resolution
Protein Characterization: Structure Determination
Page 11
10/10/17
11
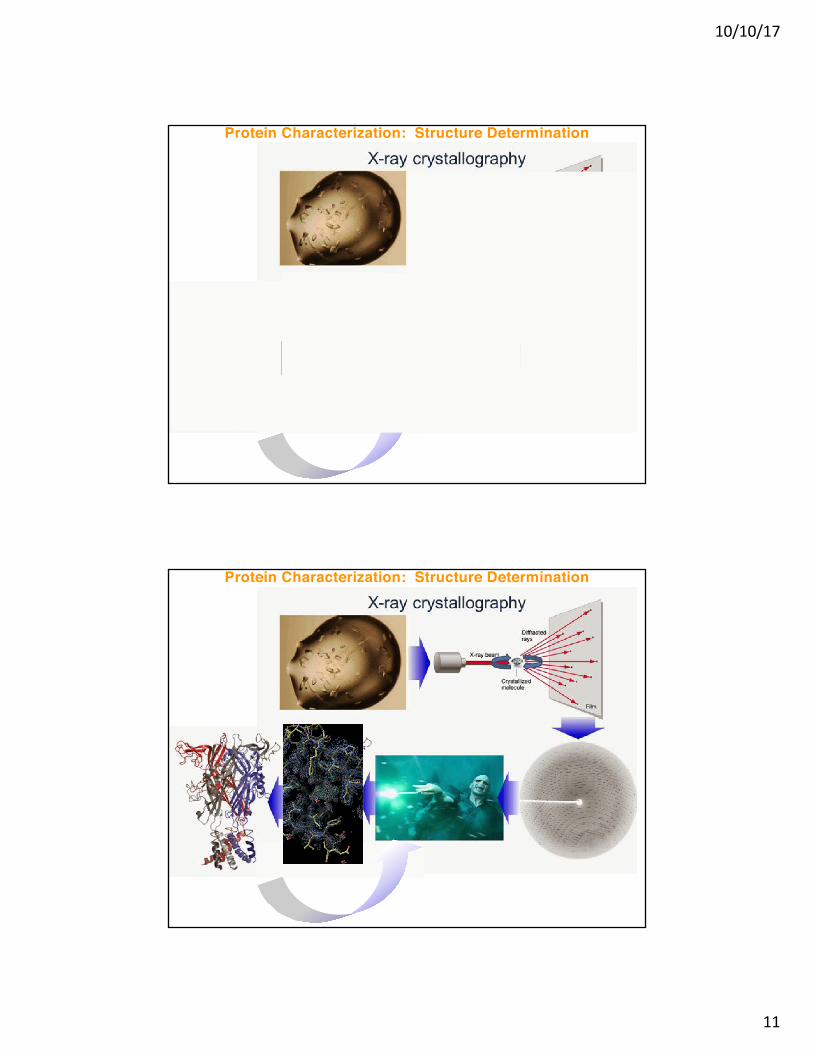
Protein Characterization: Structure Determination
Protein Characterization: Structure Determination
Page 12
10/10/17
12
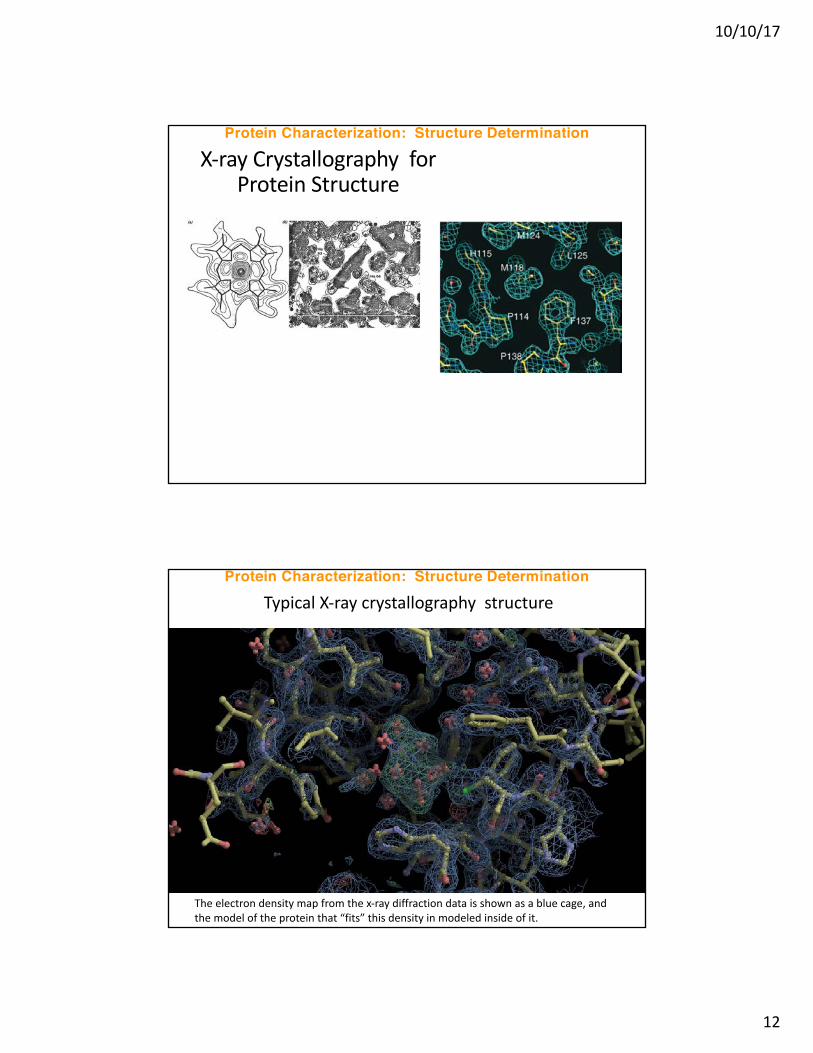
X-rayCrystallographyforProteinStructure
Protein Characterization: Structure Determination
Theelectrondensitymapfromthex-raydiffractiondataisshownasabluecage,andthemodeloftheproteinthat“fits”thisdensityinmodeledinsideofit.
TypicalX-raycrystallography structureProtein Characterization: Structure Determination
Page 13
10/10/17
13
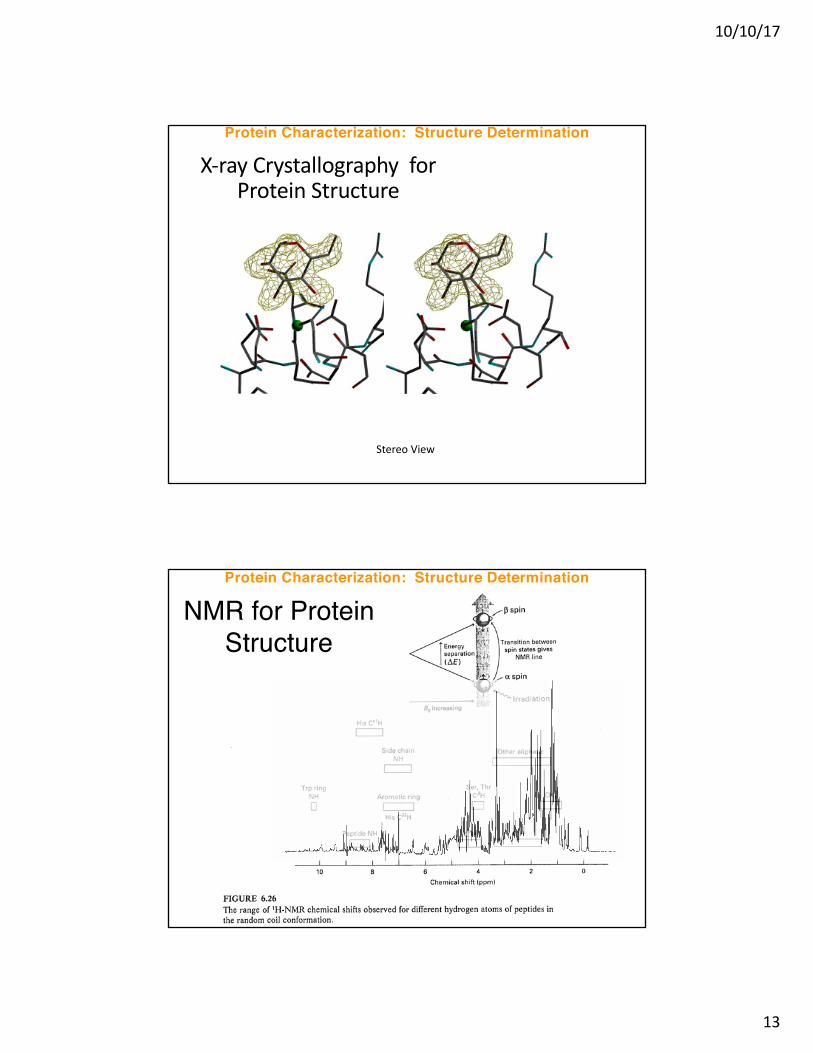
X-rayCrystallographyforProteinStructure
StereoView
Protein Characterization: Structure Determination
NMR for Protein Structure
Protein Characterization: Structure Determination
Page 14
10/10/17
14
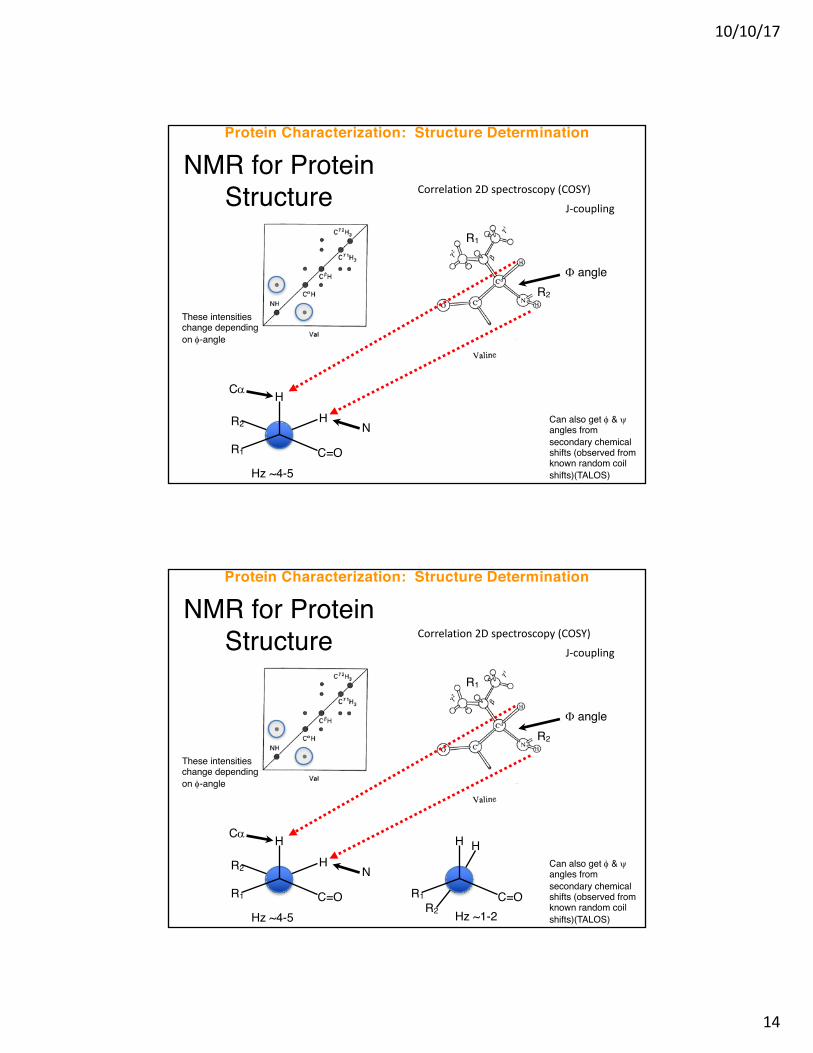
NMR for Protein Structure Correlation2Dspectroscopy(COSY)
HHR2
R1 C=O
H H
R2
R1 C=O
Ca
N
Hz ~4-5 Hz ~1-2
J-coupling
F angle
Protein Characterization: Structure Determination
R2
R1
These intensities change depending on f-angle
Can also get f & y angles from secondary chemical shifts (observed from known random coil shifts)(TALOS)
Page 15
10/10/17
15
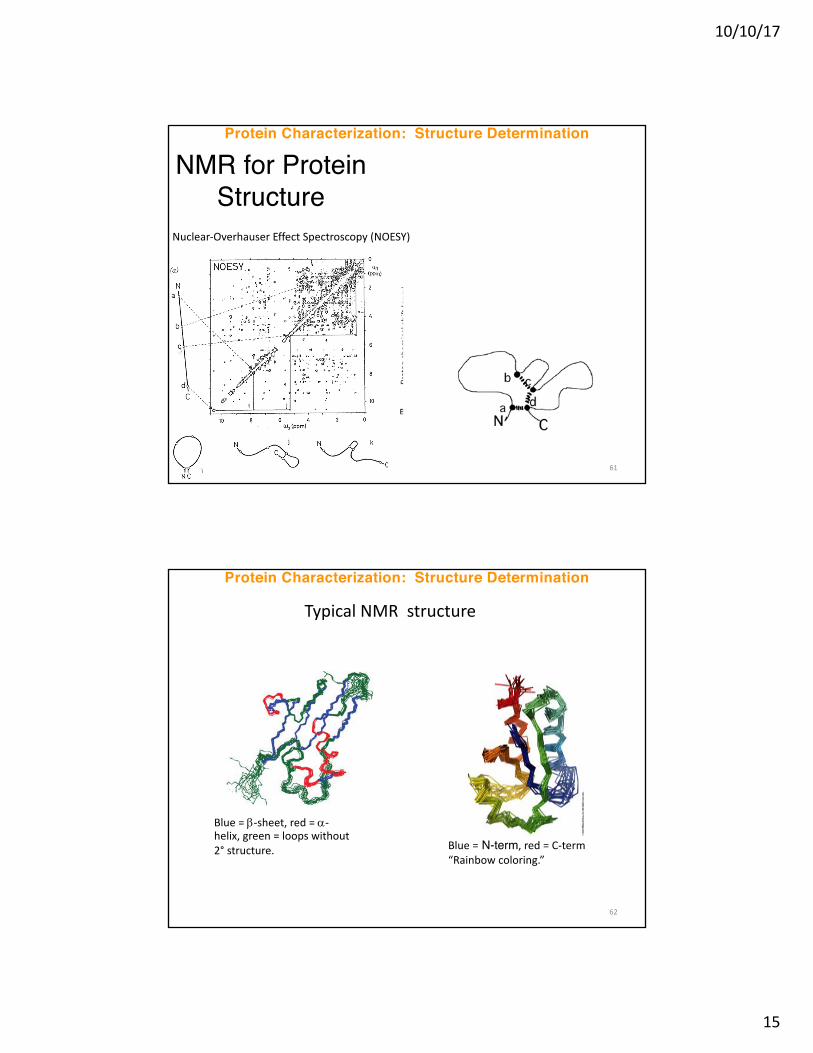
NMR for Protein Structure
Nuclear-Overhauser EffectSpectroscopy(NOESY)
61
Protein Characterization: Structure Determination
TypicalNMRstructure
Blue=b-sheet,red=a-helix,green=loopswithout2° structure.
62
Blue= N-term,red=C-term“Rainbowcoloring.”
Protein Characterization: Structure Determination
Page 16
10/10/17
16
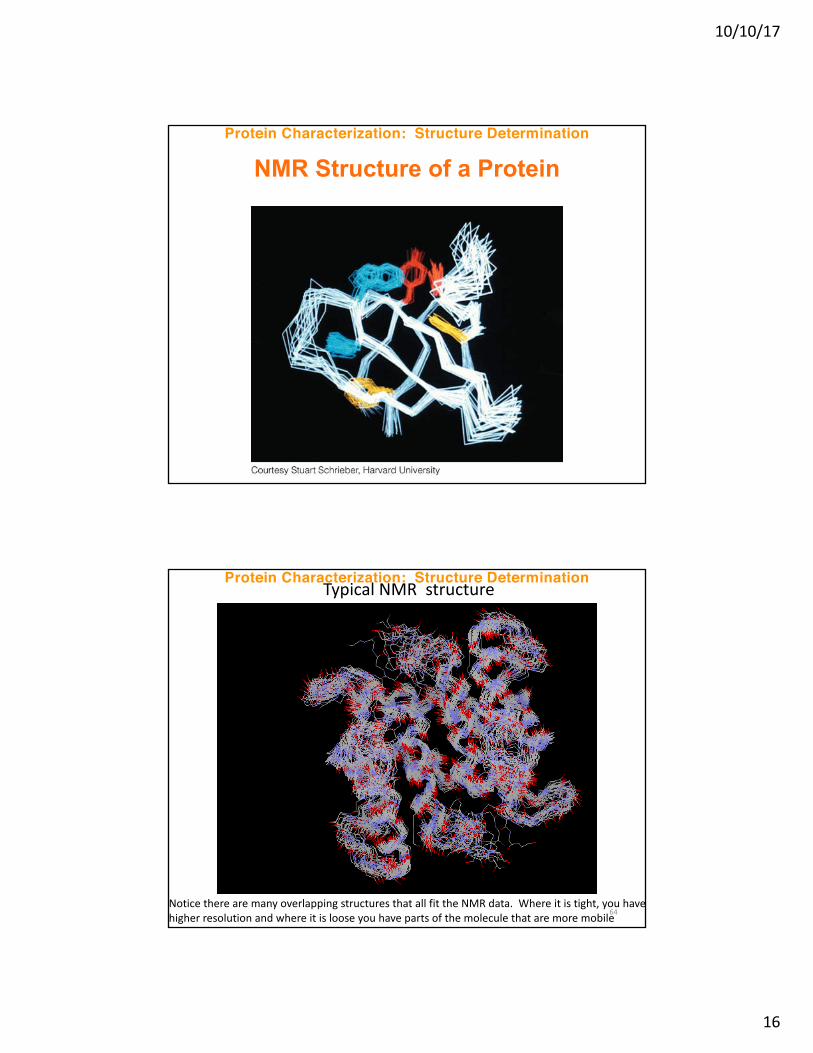
NMR Structure of a ProteinProtein Characterization: Structure Determination
TypicalNMRstructure
NoticetherearemanyoverlappingstructuresthatallfittheNMRdata.Whereitistight,youhavehigherresolutionandwhereitislooseyouhavepartsofthemoleculethataremoremobile64
Protein Characterization: Structure Determination
Page 17
10/10/17
17
Protein CharacterizationTertiaryStructure
Compare/Contrast X-ray crystallography and NMR:
1) Crystal vs. solution structures the same; not significant crystal constraints
2) NMR not as high resolution3) NMR better at predicting regions that are dynamic; X-ray
uses “B-factors” or even does not show, i.e., “disordered”4) X-ray cannot distinguish “rotomers” of Asn, Gln, Thr; NMR
is unambiguous5) X-ray much better at larger structures; NMR has
assignment problem only good for up to 30-40 kDa 65
Protein Characterization: Structure Determination
Protein Characterization
Secondary Structure
66
Page 18
10/10/17
18
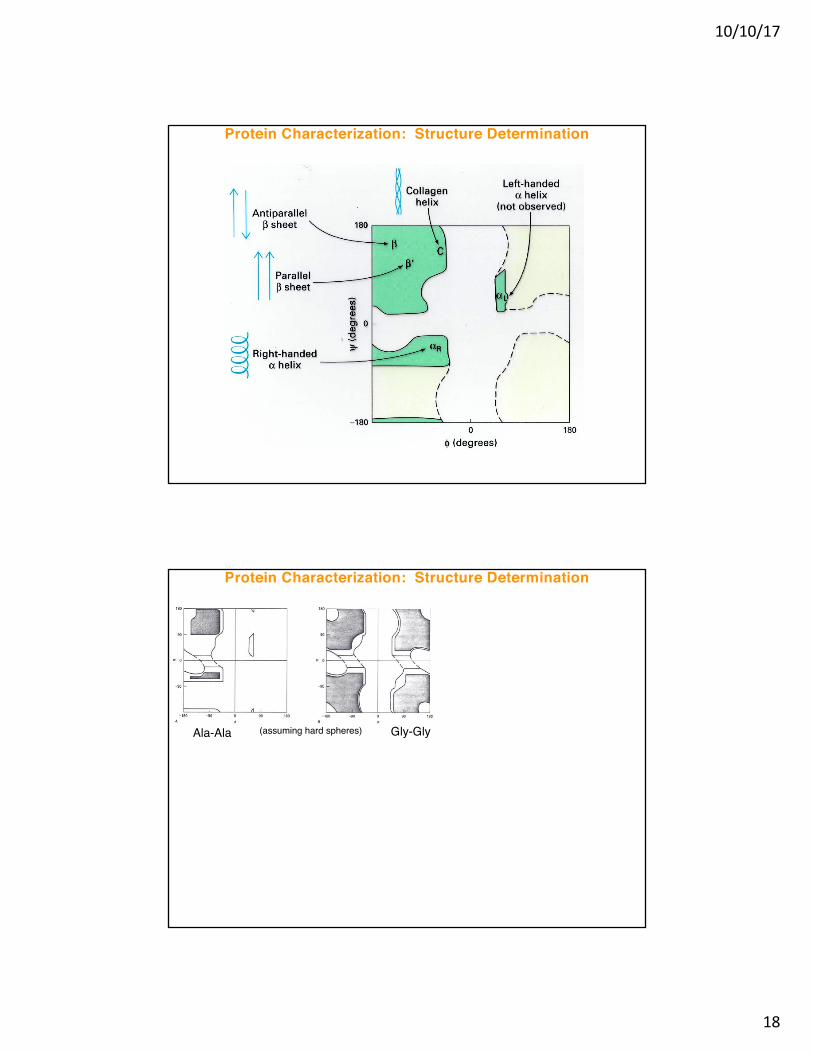
Protein Characterization: Structure Determination
Protein Characterization: Structure Determination
Ala-Ala Gly-Gly(assuming hard spheres)
(calculation with molecular dynamics including solvent (water))
NAc-Ala-Ala-NH2
Page 19
10/10/17
19
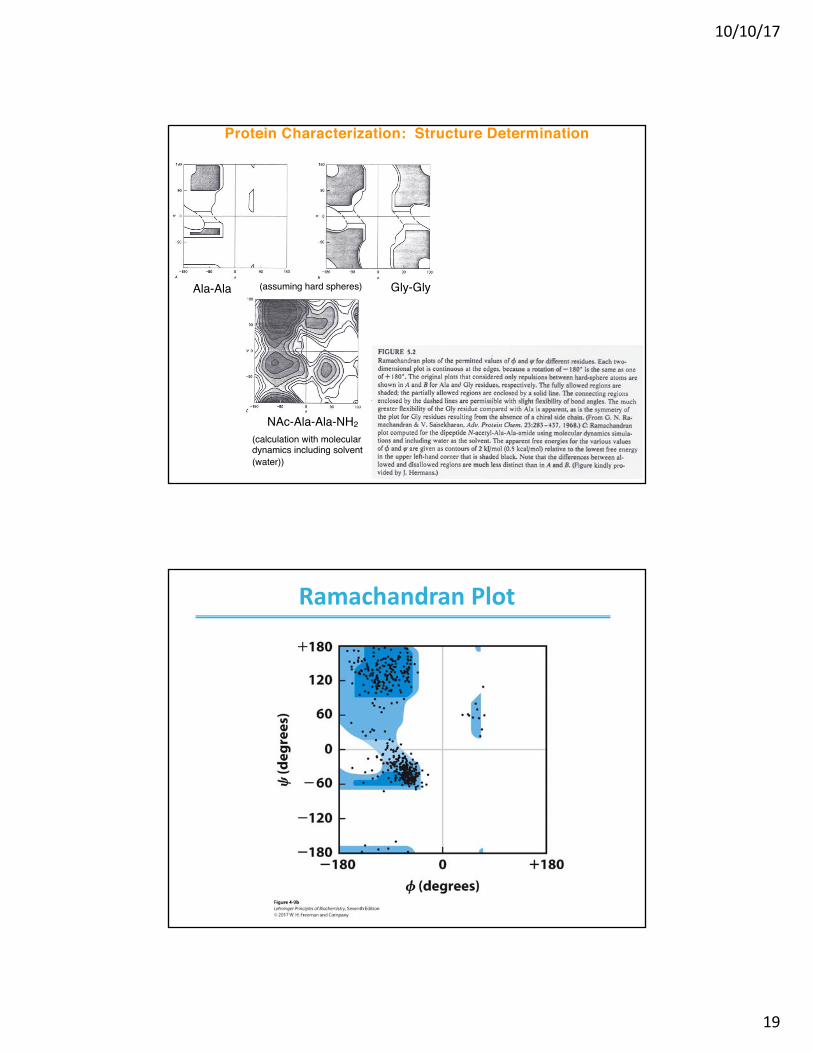
Protein Characterization: Structure Determination
Ala-Ala Gly-Gly(assuming hard spheres)
(calculation with molecular dynamics including solvent (water))
NAc-Ala-Ala-NH2
RamachandranPlot
Page 20
10/10/17
20
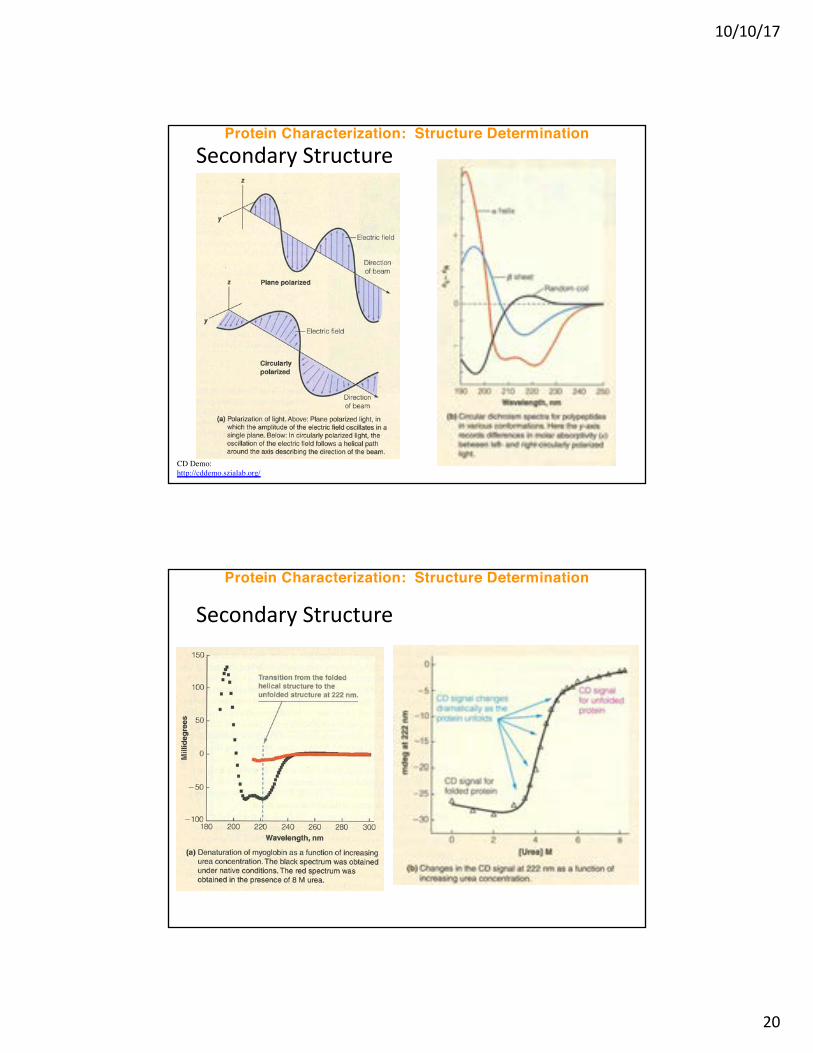
SecondaryStructureProtein Characterization: Structure Determination
CD Demo:http://cddemo.szialab.org/
SecondaryStructure
Protein Characterization: Structure Determination
Page 21
10/10/17
21
Collagen
73
3000 Å74
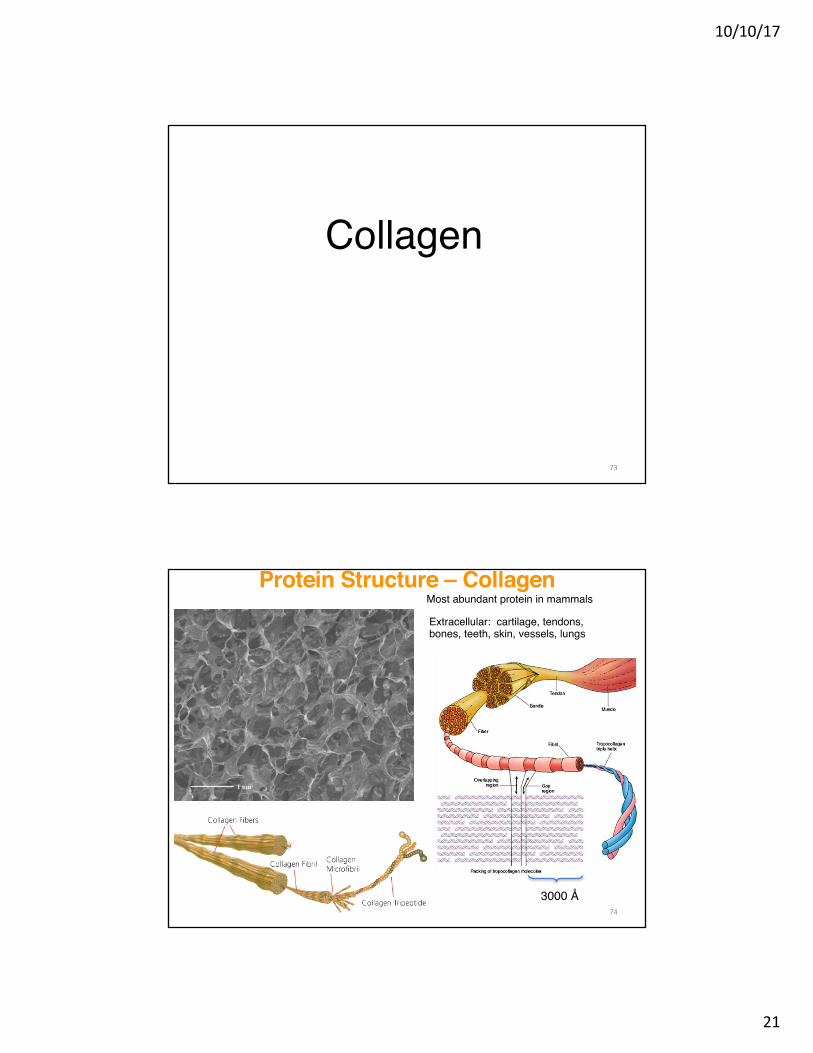
Protein Structure – CollagenExtracellular: cartilage, tendons, bones, teeth, skin, vessels, lungs
Most abundant protein in mammals
Page 22
10/10/17
22
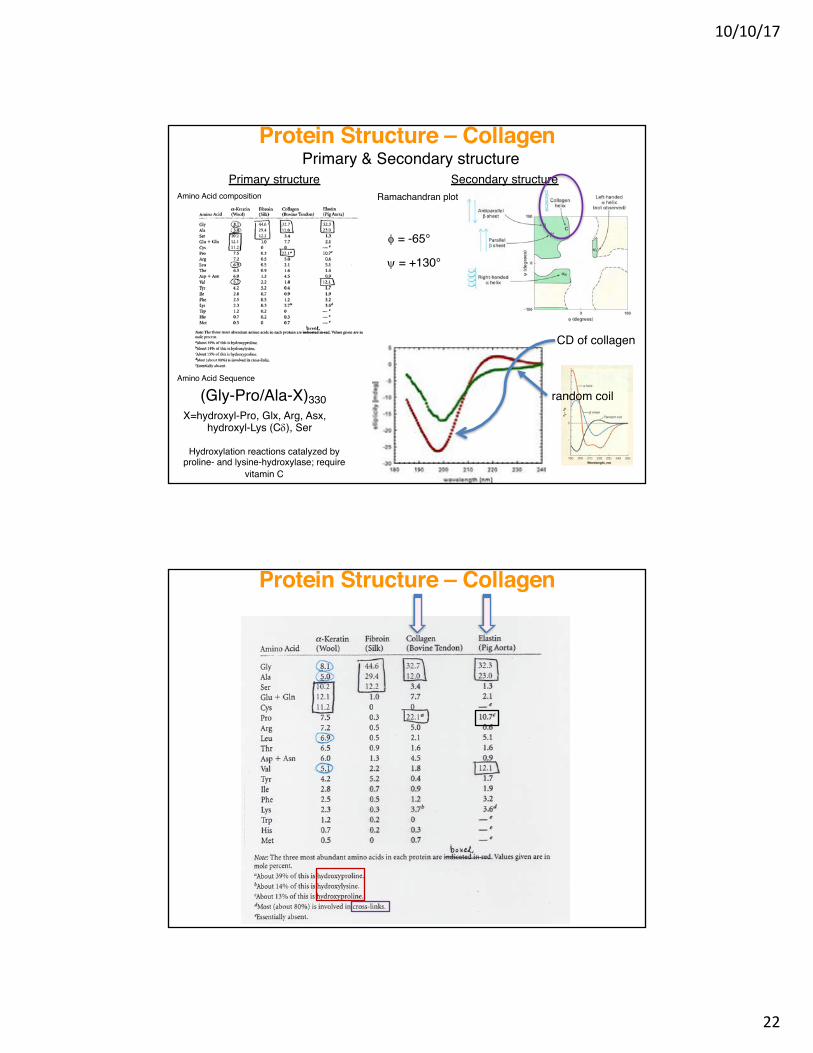
Primary & Secondary structurePrimary structure
(Gly-Pro/Ala-X)330X=hydroxyl-Pro, Glx, Arg, Asx,
hydroxyl-Lys (Cd), Ser
CD of collagen
Hydroxylation reactions catalyzed by proline- and lysine-hydroxylase; require
vitamin C
Amino Acid composition
Amino Acid Sequence
Secondary structureRamachandran plot
f = -65°
y = +130°
Protein Structure – Collagen
random coil
Protein Structure – Collagen
Page 23
10/10/17
23
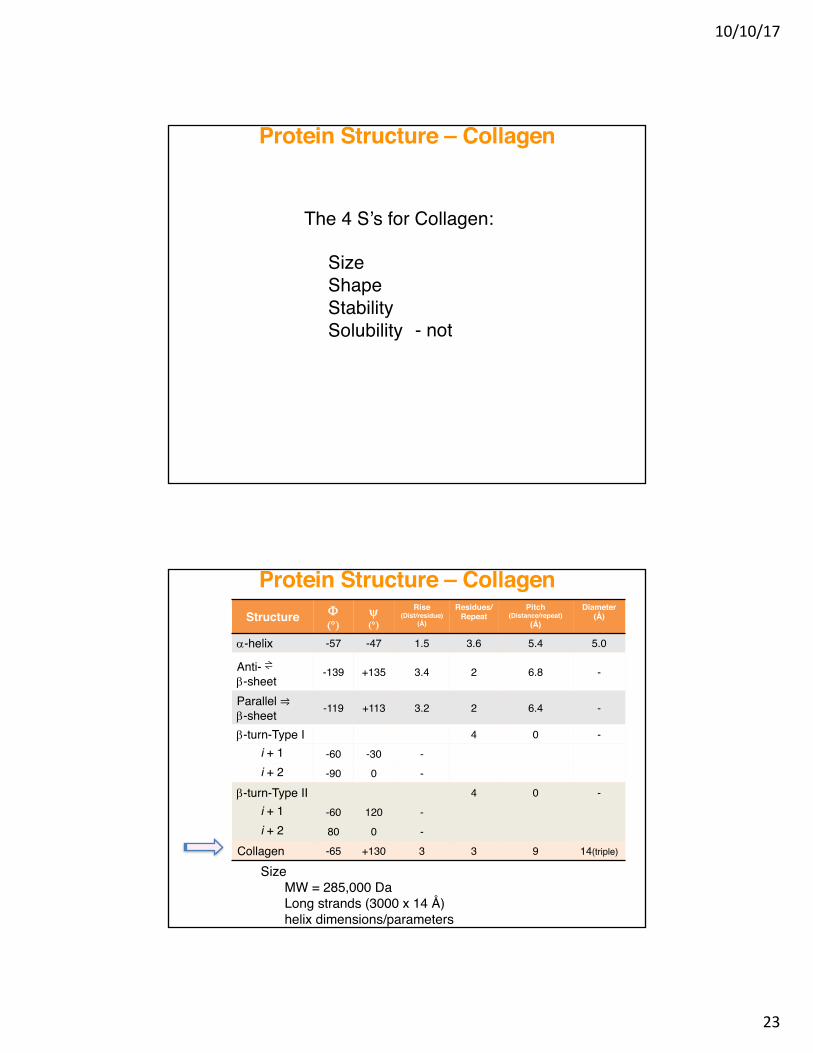
The 4 S’s for Collagen:
Size ShapeStabilitySolubility
Protein Structure – Collagen
- not
SizeMW = 285,000 DaLong strands (3000 x 14 Å)helix dimensions/parameters
Protein Structure – CollagenStructure F
(°)y(°)
Rise(Dist/residue)
(Å)
Residues/Repeat
Pitch(Distance/repeat)
(Å)
Diameter(Å)
a-helix -57 -47 1.5 3.6 5.4 5.0
Anti- ⇌b-sheet
-139 +135 3.4 2 6.8 -
Parallel ⥤b-sheet -119 +113 3.2 2 6.4 -
b-turn-Type I 4 0 -i + 1 -60 -30 -i + 2 -90 0 -
b-turn-Type II 4 0 -i + 1 -60 120 -i + 2 80 0 -
Collagen -65 +130 3 3 9 14(triple)
Page 24
10/10/17
24
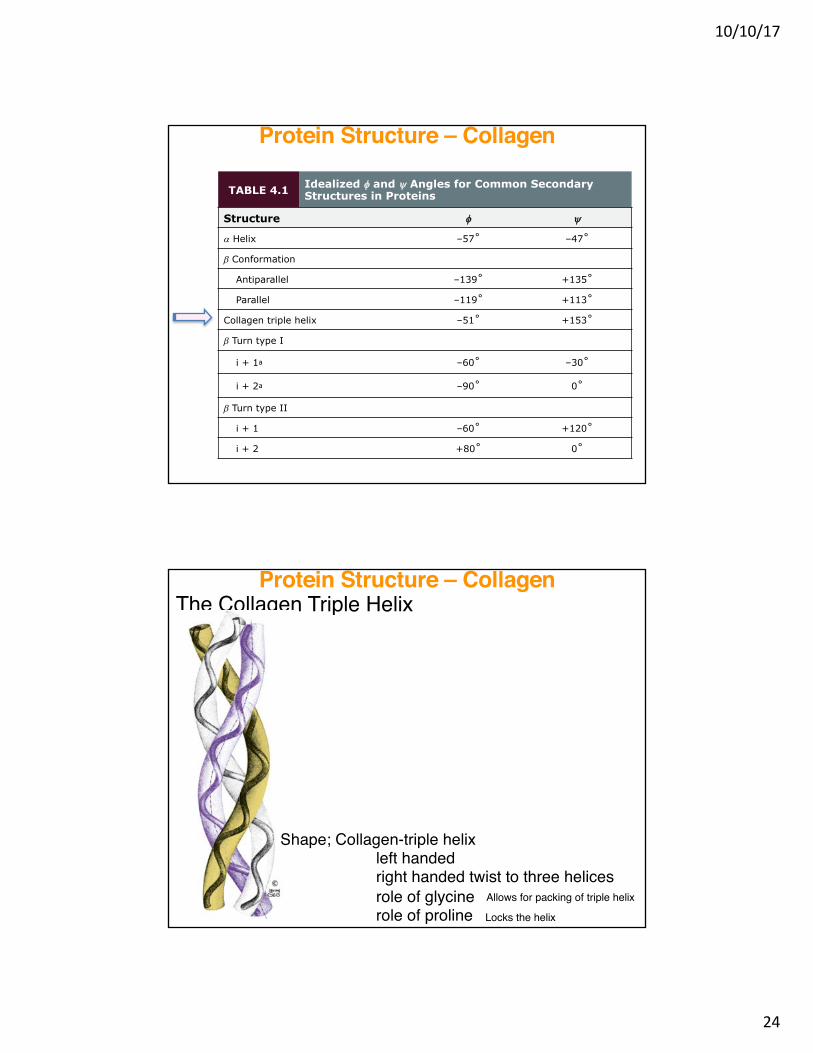
TABLE 4.1 Idealized f and y Angles for Common Secondary Structures in Proteins
Structure f y
a Helix –57˚ –47˚
b Conformation
Antiparallel –139˚ +135˚
Parallel –119˚ +113˚
Collagen triple helix –51˚ +153˚
b Turn type I
i + 1a –60˚ –30˚
i + 2a –90˚ 0˚
b Turn type II
i + 1 –60˚ +120˚
i + 2 +80˚ 0˚
Protein Structure – Collagen
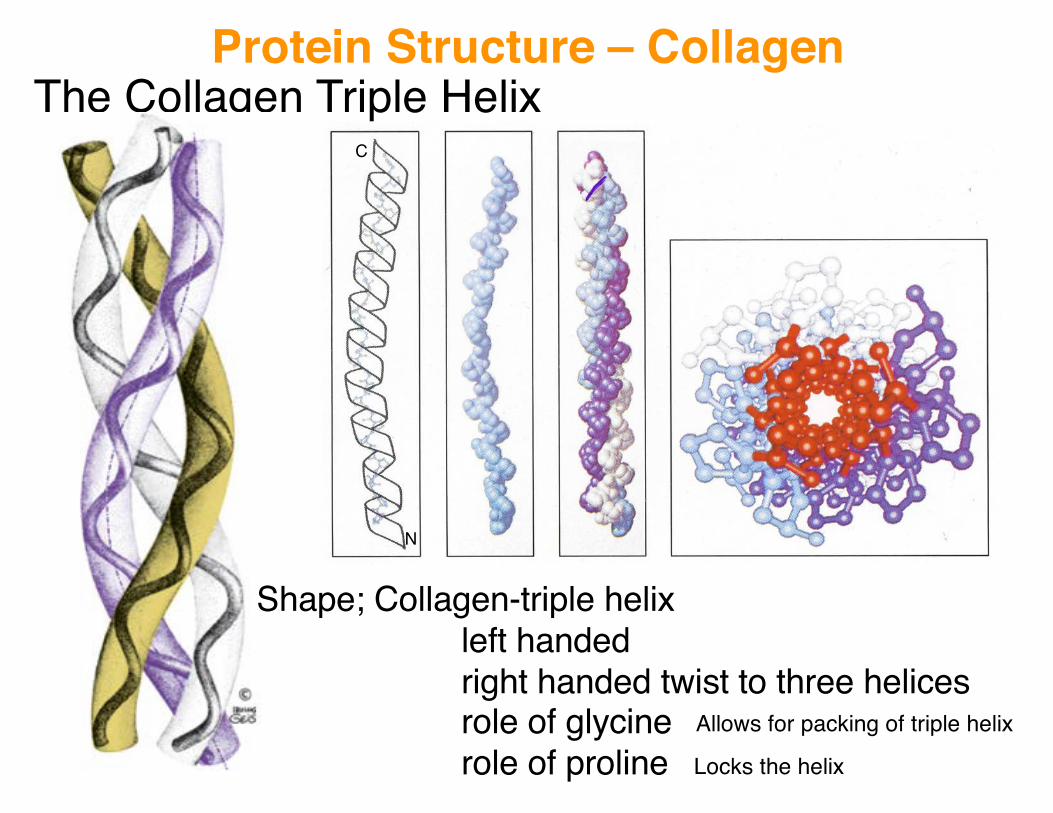
The Collagen Triple Helix
Shape; Collagen-triple helixleft handedright handed twist to three helicesrole of glycinerole of proline
Protein Structure – Collagen
N
C
Allows for packing of triple helix
Locks the helix
Page 25
The Collagen Triple Helix
Shape; Collagen-triple helixleft handedright handed twist to three helicesrole of glycinerole of proline
Protein Structure – Collagen
N
C
Allows for packing of triple helix
Locks the helix
Page 26
10/10/17
25
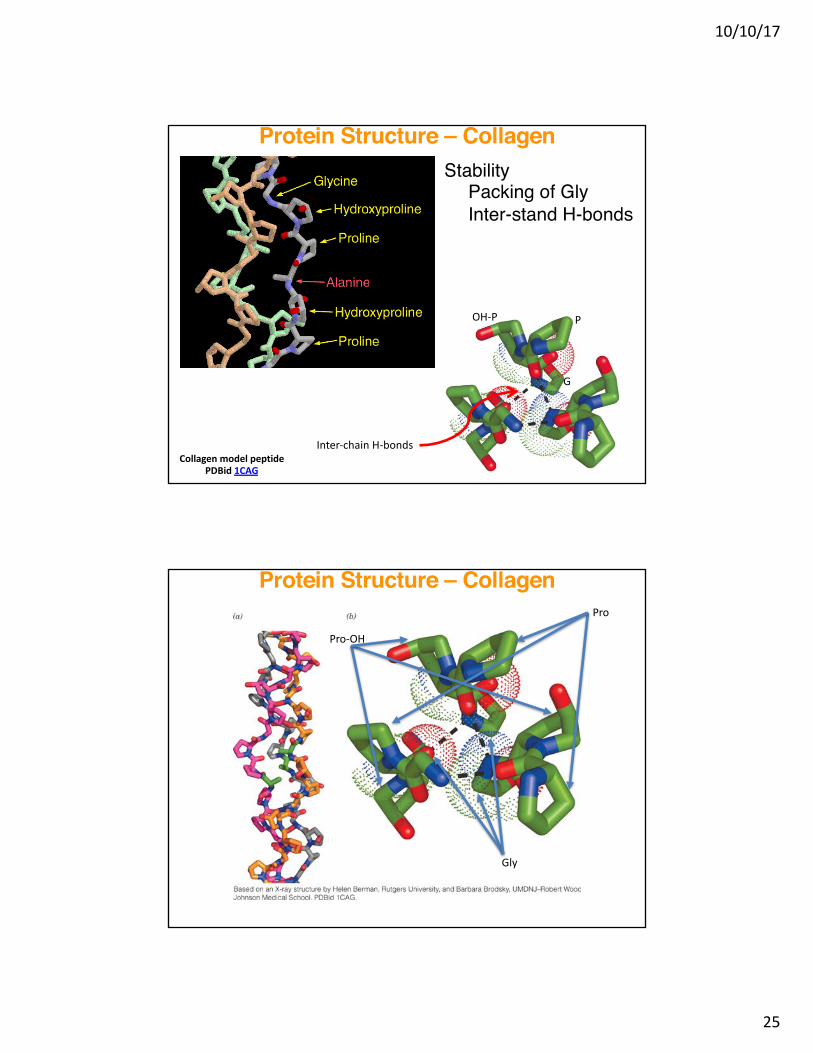
Inter-chainH-bonds
G
POH-P
StabilityPacking of GlyInter-stand H-bonds
Protein Structure – Collagen
CollagenmodelpeptidePDBid1CAG
Protein Structure – CollagenPro
Gly
Pro-OH
Page 27
10/10/17
26
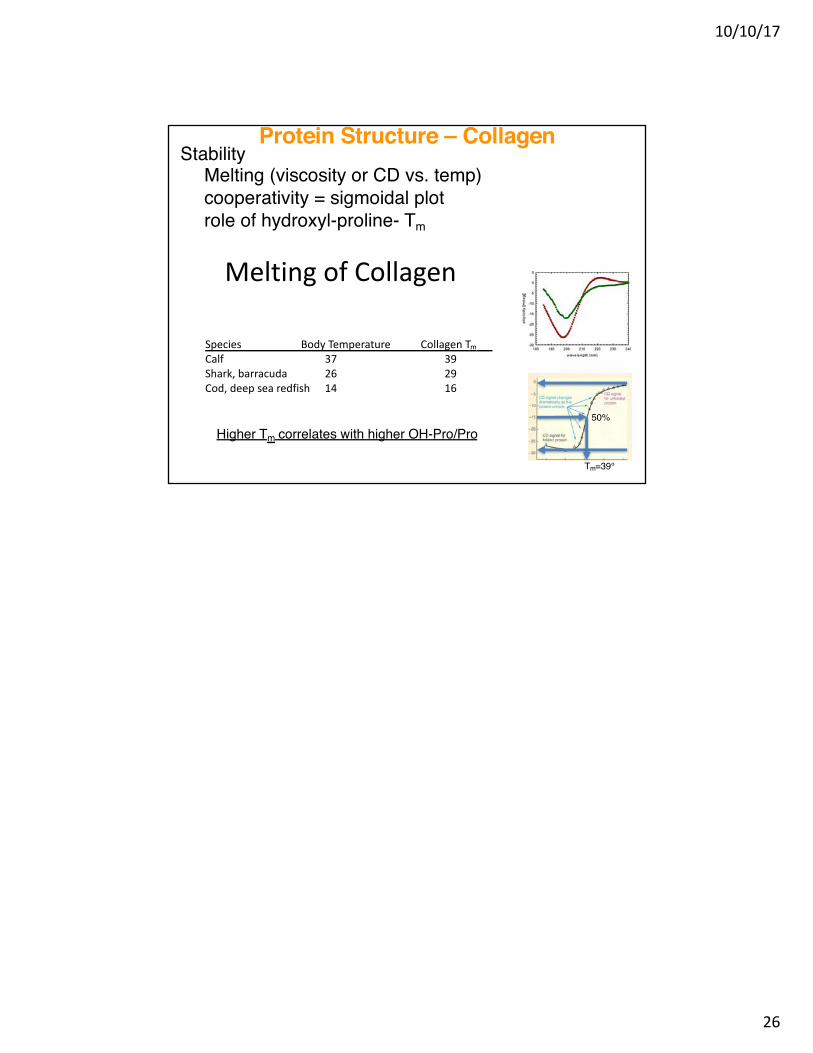
MeltingofCollagen
Species BodyTemperature CollagenTmCalf 37 39Shark,barracuda 26 29Cod,deepsearedfish 14 16
StabilityMelting (viscosity or CD vs. temp)cooperativity = sigmoidal plotrole of hydroxyl-proline- Tm
Higher Tm correlates with higher OH-Pro/Pro
Protein Structure – Collagen
50%
Tm=39°