Life Science Journal 2012;9(4) http://www.lifesciencesite.com http://www.lifesciencesite.com [email protected]5759 A Field Wireless Sensor System for Mangrove Ecology Environment in Taiwan: Design and Implementation Mei-Hsien Lin 1 , Hsu-Yang Kung 2 , Chia-Ling Li 2 , Chi-Hua Chen 3 , Wei Kuang Lai 1 1. Department of Computer Science and Engineering, National Sun Yat-sen University, Kaohsiung, Taiwan, R.O.C. 2. Department of Management Information Systems, National Pingtung University of Science and Technology, Pingtung, Taiwan, R.O.C. 3. Institute of Information Management, National Chiao Tung University, Hsinchu, Taiwan, R.O.C. [email protected]Abstract: This study is the first investigation of using wireless sensor networks (WSNs) for Mangroves protection and observation in Taiwan. In this paper, this study proposes a natural ecology sensing system (NESS), which consists of ecological environment sensor (EES), nature resource integrated computing server (NRICS), mobile user (MU), and ecological information service system (EISS). NESS can improve the traditional long-term observation method by providing a real-time and networked surveillance system. This paper considers the practical issues of deploying ecological environment sensors in the Mangroves protection area. In additions, feasible solutions are proposed to achieve sustainable energy supply and reliable data delivery with high accuracy. We also evaluate system performance in terms of energy consumption and packet loss rate at different duty cycles, and compare lifetime and data accuracy with different energy supply sources. According to implementation results, the proposed system is efficient and feasible for Mangroves observation, protection, and surveillance. [Mei-Hsien Lin, Hsu-Yang Kung, Chia-Ling Li, Chi-Hua Chen, Wei Kuang Lai. A Field Wireless Sensor System for Mangrove Ecology Environment in Taiwan: Design and Implementation. Life Sci J 2012;9(4):5759-5767] (ISSN:1097-8135). http://www.lifesciencesite.com . 857 Keywords: Wireless sensor network; accuracy adjustment; natural environment monitoring; field solar electric power system; mangrove 1. Introduction Mangroves are rare and protected trees and shrubs in Taiwan. They grow within Dan Shiu Mangroves protection area, where are on Dan Shui river mouth and near Mangroves station of Taipei mass rapid transit (MRT) as shown in Figure 1 (circled by dotted line). The main function of Mangroves is to keep the balance of biology and ecology in Dan Shui river. With the rapid development of Taipei city, the Mangroves range is seriously being affected by man-made and environmental effects such as the construction of MRT, tourism, polluted water, and greenhouse effect. Such factors will cause the unbalance of biology and ecology in the river. Recently, several articles are proposed and used for investigating the Mangroves observation and protection [7]. However, the data collection methodology of these articles adopts field survey. With field survey, researchers have to collect data by themselves in Dan Shiu Mangroves protection area. Therefore, such a method is labor intensive and dangerous, and cannot provide real-time and continuous data collection. To improve above drawbacks, this study designs and implements a natural ecology sensing system (NESS) using wireless sensor networks (WSNs). With the application of WSNs and Internet, researchers can perform long-term observation such as micro-climate and images collection at the remote site. In addition, the system can be used for surveillance of Dan Shiu Mangroves protection area, i.e. real-time invasion detection and alarm. In recent years, several papers are proposed that WSNs are used for real-time data collection in the field [4, 9, 11, 13]. In [6], the authors proposed and implemented a reactive and robustness event driven WSN for data collection in the field. They adopted SMAC as MAC protocol to address the problems of energy efficient and coordinated sleeping. In [19], the authors present a case study of a WSN. A multi-dimensional analysis methodology was used to reveal trends and gradients in collected data. In [6], a Trio system was proposed. This system is used in large scale and long-term observation using WSNs. This paper also considered several deployment issues such as scalable, sustainable, and fail-safe flexibility. In [5], the authors designed and implemented a system, INSIGHY, which is used for habit monitoring. The goal of this study is to extended deployment lifetime, remote querying configuration, ease of deployment, and reliability. These articles prove the application of WSN is an efficient and challenging way for environment monitoring, and offer many evaluation metrics for deploying in the field. The adopted ecological environment sensors of this paper are composed of temperature, humidity,
Transcript
Life Science Journal 2012;9(4) http://www.lifesciencesite.com
A Field Wireless Sensor System for Mangrove Ecology Environment in Taiwan: Design and Implementation
Mei-Hsien Lin 1, Hsu-Yang Kung 2, Chia-Ling Li 2, Chi-Hua Chen 3, Wei Kuang Lai 1
1. Department of Computer Science and Engineering, National Sun Yat-sen University, Kaohsiung, Taiwan, R.O.C. 2. Department of Management Information Systems, National Pingtung University of Science and Technology,
Pingtung, Taiwan, R.O.C. 3. Institute of Information Management, National Chiao Tung University, Hsinchu, Taiwan, R.O.C.
[email protected] Abstract: This study is the first investigation of using wireless sensor networks (WSNs) for Mangroves protection and observation in Taiwan. In this paper, this study proposes a natural ecology sensing system (NESS), which consists of ecological environment sensor (EES), nature resource integrated computing server (NRICS), mobile user (MU), and ecological information service system (EISS). NESS can improve the traditional long-term observation method by providing a real-time and networked surveillance system. This paper considers the practical issues of deploying ecological environment sensors in the Mangroves protection area. In additions, feasible solutions are proposed to achieve sustainable energy supply and reliable data delivery with high accuracy. We also evaluate system performance in terms of energy consumption and packet loss rate at different duty cycles, and compare lifetime and data accuracy with different energy supply sources. According to implementation results, the proposed system is efficient and feasible for Mangroves observation, protection, and surveillance. [Mei-Hsien Lin, Hsu-Yang Kung, Chia-Ling Li, Chi-Hua Chen, Wei Kuang Lai. A Field Wireless Sensor System for Mangrove Ecology Environment in Taiwan: Design and Implementation. Life Sci J 2012;9(4):5759-5767] (ISSN:1097-8135). http://www.lifesciencesite.com. 857 Keywords: Wireless sensor network; accuracy adjustment; natural environment monitoring; field solar electric power system; mangrove 1. Introduction
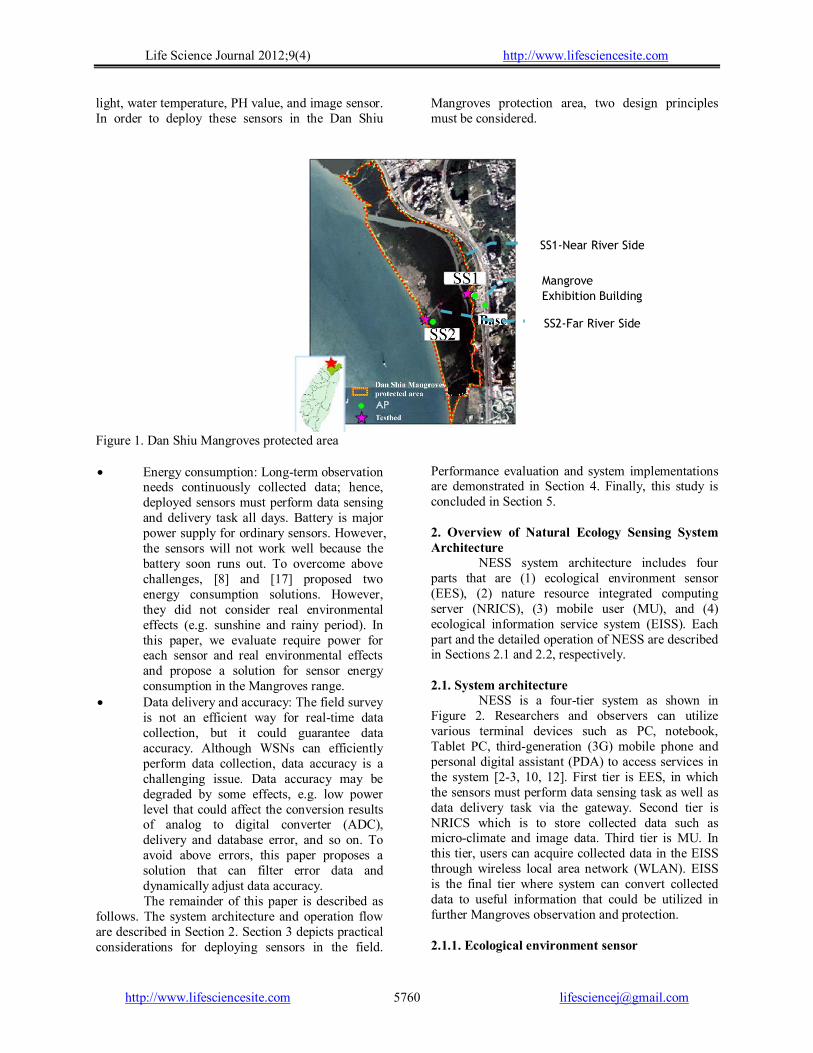
Mangroves are rare and protected trees and shrubs in Taiwan. They grow within Dan Shiu Mangroves protection area, where are on Dan Shui river mouth and near Mangroves station of Taipei mass rapid transit (MRT) as shown in Figure 1 (circled by dotted line). The main function of Mangroves is to keep the balance of biology and ecology in Dan Shui river. With the rapid development of Taipei city, the Mangroves range is seriously being affected by man-made and environmental effects such as the construction of MRT, tourism, polluted water, and greenhouse effect. Such factors will cause the unbalance of biology and ecology in the river.
Recently, several articles are proposed and used for investigating the Mangroves observation and protection [7]. However, the data collection methodology of these articles adopts field survey. With field survey, researchers have to collect data by themselves in Dan Shiu Mangroves protection area. Therefore, such a method is labor intensive and dangerous, and cannot provide real-time and continuous data collection. To improve above drawbacks, this study designs and implements a natural ecology sensing system (NESS) using wireless sensor networks (WSNs). With the application of WSNs and Internet, researchers can perform long-term observation such as micro-climate
and images collection at the remote site. In addition, the system can be used for surveillance of Dan Shiu Mangroves protection area, i.e. real-time invasion detection and alarm.
In recent years, several papers are proposed that WSNs are used for real-time data collection in the field [4, 9, 11, 13]. In [6], the authors proposed and implemented a reactive and robustness event driven WSN for data collection in the field. They adopted SMAC as MAC protocol to address the problems of energy efficient and coordinated sleeping. In [19], the authors present a case study of a WSN. A multi-dimensional analysis methodology was used to reveal trends and gradients in collected data. In [6], a Trio system was proposed. This system is used in large scale and long-term observation using WSNs. This paper also considered several deployment issues such as scalable, sustainable, and fail-safe flexibility. In [5], the authors designed and implemented a system, INSIGHY, which is used for habit monitoring. The goal of this study is to extended deployment lifetime, remote querying configuration, ease of deployment, and reliability. These articles prove the application of WSN is an efficient and challenging way for environment monitoring, and offer many evaluation metrics for deploying in the field.
The adopted ecological environment sensors of this paper are composed of temperature, humidity,
Life Science Journal 2012;9(4) http://www.lifesciencesite.com
light, water temperature, PH value, and image sensor. In order to deploy these sensors in the Dan Shiu
Mangroves protection area, two design principles must be considered.
Figure 1. Dan Shiu Mangroves protected area Energy consumption: Long-term observation
needs continuously collected data; hence, deployed sensors must perform data sensing and delivery task all days. Battery is major power supply for ordinary sensors. However, the sensors will not work well because the battery soon runs out. To overcome above challenges, [8] and [17] proposed two energy consumption solutions. However, they did not consider real environmental effects (e.g. sunshine and rainy period). In this paper, we evaluate require power for each sensor and real environmental effects and propose a solution for sensor energy consumption in the Mangroves range.
Data delivery and accuracy: The field survey is not an efficient way for real-time data collection, but it could guarantee data accuracy. Although WSNs can efficiently perform data collection, data accuracy is a challenging issue. Data accuracy may be degraded by some effects, e.g. low power level that could affect the conversion results of analog to digital converter (ADC), delivery and database error, and so on. To avoid above errors, this paper proposes a solution that can filter error data and dynamically adjust data accuracy. The remainder of this paper is described as
follows. The system architecture and operation flow are described in Section 2. Section 3 depicts practical considerations for deploying sensors in the field.
Performance evaluation and system implementations are demonstrated in Section 4. Finally, this study is concluded in Section 5. 2. Overview of Natural Ecology Sensing System Architecture
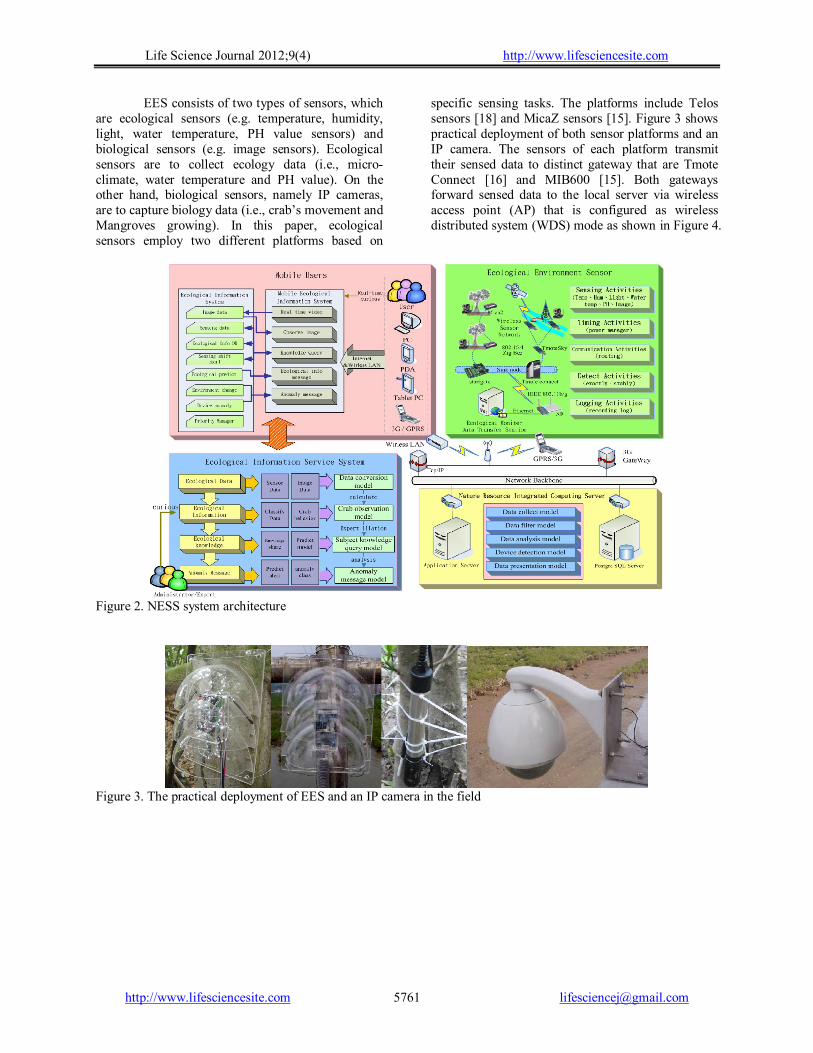
NESS system architecture includes four parts that are (1) ecological environment sensor (EES), (2) nature resource integrated computing server (NRICS), (3) mobile user (MU), and (4) ecological information service system (EISS). Each part and the detailed operation of NESS are described in Sections 2.1 and 2.2, respectively. 2.1. System architecture NESS is a four-tier system as shown in Figure 2. Researchers and observers can utilize various terminal devices such as PC, notebook, Tablet PC, third-generation (3G) mobile phone and personal digital assistant (PDA) to access services in the system [2-3, 10, 12]. First tier is EES, in which the sensors must perform data sensing task as well as data delivery task via the gateway. Second tier is NRICS which is to store collected data such as micro-climate and image data. Third tier is MU. In this tier, users can acquire collected data in the EISS through wireless local area network (WLAN). EISS is the final tier where system can convert collected data to useful information that could be utilized in further Mangroves observation and protection. 2.1.1. Ecological environment sensor
Mangrove
Exhibition Building
SS2-Far River Side
SS1-Near River Side
Life Science Journal 2012;9(4) http://www.lifesciencesite.com
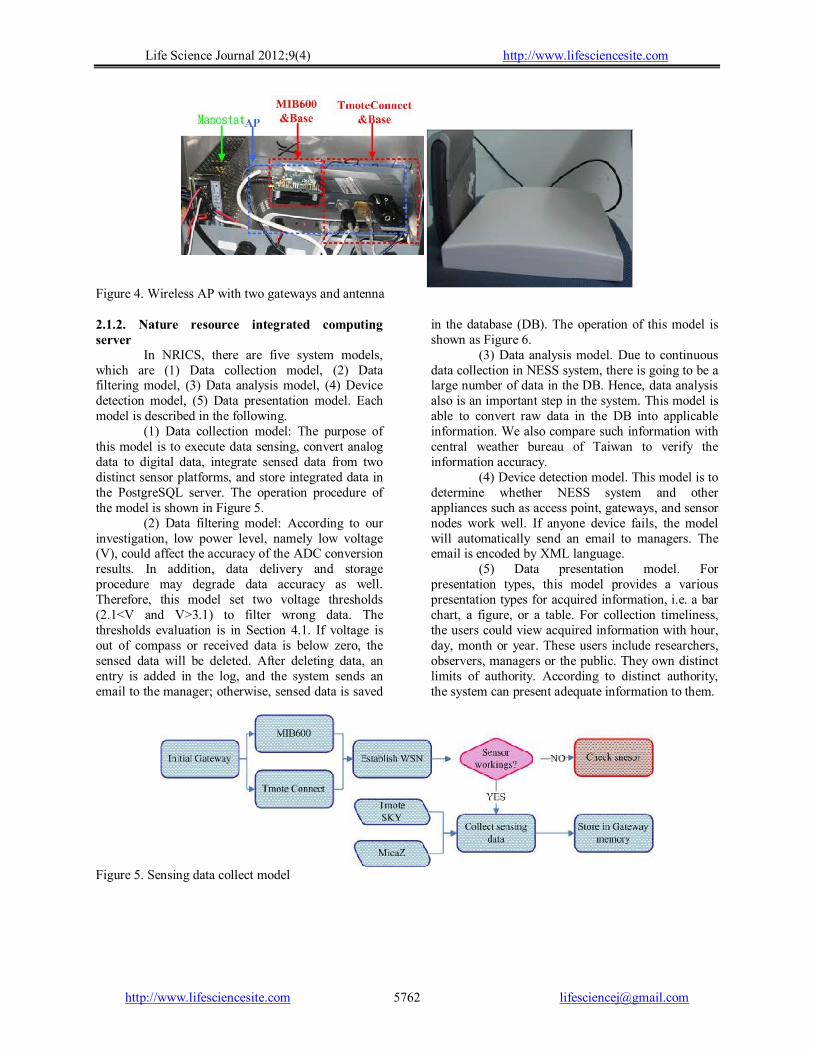
EES consists of two types of sensors, which are ecological sensors (e.g. temperature, humidity, light, water temperature, PH value sensors) and biological sensors (e.g. image sensors). Ecological sensors are to collect ecology data (i.e., micro-climate, water temperature and PH value). On the other hand, biological sensors, namely IP cameras, are to capture biology data (i.e., crab’s movement and Mangroves growing). In this paper, ecological sensors employ two different platforms based on
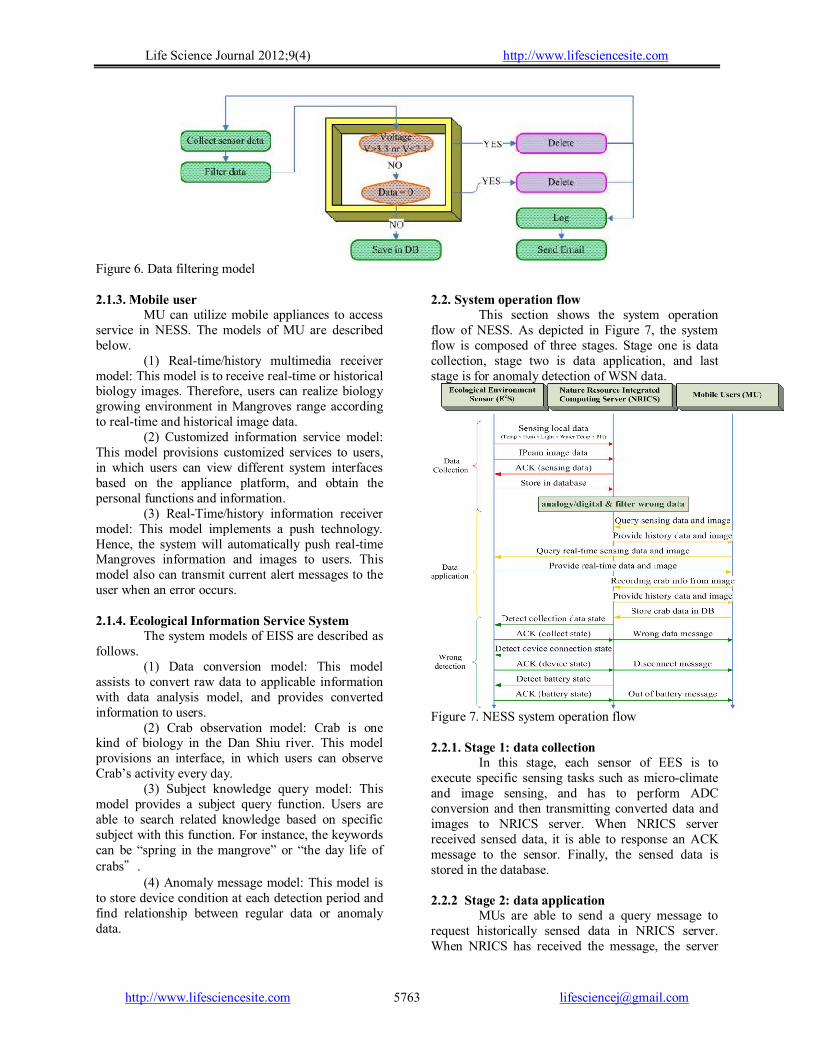
specific sensing tasks. The platforms include Telos sensors [18] and MicaZ sensors [15]. Figure 3 shows practical deployment of both sensor platforms and an IP camera. The sensors of each platform transmit their sensed data to distinct gateway that are Tmote Connect [16] and MIB600 [15]. Both gateways forward sensed data to the local server via wireless access point (AP) that is configured as wireless distributed system (WDS) mode as shown in Figure 4.
Figure 2. NESS system architecture
Figure 3. The practical deployment of EES and an IP camera in the field
Life Science Journal 2012;9(4) http://www.lifesciencesite.com
Figure 4. Wireless AP with two gateways and antenna 2.1.2. Nature resource integrated computing server
In NRICS, there are five system models, which are (1) Data collection model, (2) Data filtering model, (3) Data analysis model, (4) Device detection model, (5) Data presentation model. Each model is described in the following.
(1) Data collection model: The purpose of this model is to execute data sensing, convert analog data to digital data, integrate sensed data from two distinct sensor platforms, and store integrated data in the PostgreSQL server. The operation procedure of the model is shown in Figure 5.
(2) Data filtering model: According to our investigation, low power level, namely low voltage (V), could affect the accuracy of the ADC conversion results. In addition, data delivery and storage procedure may degrade data accuracy as well. Therefore, this model set two voltage thresholds (2.1<V and V>3.1) to filter wrong data. The thresholds evaluation is in Section 4.1. If voltage is out of compass or received data is below zero, the sensed data will be deleted. After deleting data, an entry is added in the log, and the system sends an email to the manager; otherwise, sensed data is saved
in the database (DB). The operation of this model is shown as Figure 6.
(3) Data analysis model. Due to continuous data collection in NESS system, there is going to be a large number of data in the DB. Hence, data analysis also is an important step in the system. This model is able to convert raw data in the DB into applicable information. We also compare such information with central weather bureau of Taiwan to verify the information accuracy.
(4) Device detection model. This model is to determine whether NESS system and other appliances such as access point, gateways, and sensor nodes work well. If anyone device fails, the model will automatically send an email to managers. The email is encoded by XML language.
(5) Data presentation model. For presentation types, this model provides a various presentation types for acquired information, i.e. a bar chart, a figure, or a table. For collection timeliness, the users could view acquired information with hour, day, month or year. These users include researchers, observers, managers or the public. They own distinct limits of authority. According to distinct authority, the system can present adequate information to them.
Figure 5. Sensing data collect model
Life Science Journal 2012;9(4) http://www.lifesciencesite.com
Figure 6. Data filtering model 2.1.3. Mobile user MU can utilize mobile appliances to access service in NESS. The models of MU are described below.
(1) Real-time/history multimedia receiver model: This model is to receive real-time or historical biology images. Therefore, users can realize biology growing environment in Mangroves range according to real-time and historical image data.
(2) Customized information service model: This model provisions customized services to users, in which users can view different system interfaces based on the appliance platform, and obtain the personal functions and information.
(3) Real-Time/history information receiver model: This model implements a push technology. Hence, the system will automatically push real-time Mangroves information and images to users. This model also can transmit current alert messages to the user when an error occurs. 2.1.4. Ecological Information Service System
The system models of EISS are described as follows.
(1) Data conversion model: This model assists to convert raw data to applicable information with data analysis model, and provides converted information to users.
(2) Crab observation model: Crab is one kind of biology in the Dan Shiu river. This model provisions an interface, in which users can observe Crab’s activity every day.
(3) Subject knowledge query model: This model provides a subject query function. Users are able to search related knowledge based on specific subject with this function. For instance, the keywords can be “spring in the mangrove” or “the day life of crabs”.
(4) Anomaly message model: This model is to store device condition at each detection period and find relationship between regular data or anomaly data.
2.2. System operation flow This section shows the system operation
flow of NESS. As depicted in Figure 7, the system flow is composed of three stages. Stage one is data collection, stage two is data application, and last stage is for anomaly detection of WSN data.
Figure 7. NESS system operation flow 2.2.1. Stage 1: data collection
In this stage, each sensor of EES is to execute specific sensing tasks such as micro-climate and image sensing, and has to perform ADC conversion and then transmitting converted data and images to NRICS server. When NRICS server received sensed data, it is able to response an ACK message to the sensor. Finally, the sensed data is stored in the database. 2.2.2 Stage 2: data application
MUs are able to send a query message to request historically sensed data in NRICS server. When NRICS has received the message, the server
Life Science Journal 2012;9(4) http://www.lifesciencesite.com
provisions sensed data to users. If users request real-time data, NRICS will forward the query message to EES. When EES has received the message, it provides real-time data to users directly. 2.2.3. Stage 3: wrong detection
To prevent whole system failure, NRICS system needs to periodically execute failure detection and check energy level of each sensor. If a failure occurs or batter runs out, NRICS will response the failure status to managers immediately. 3. Practical Deployment of Ecological Environment Sensor
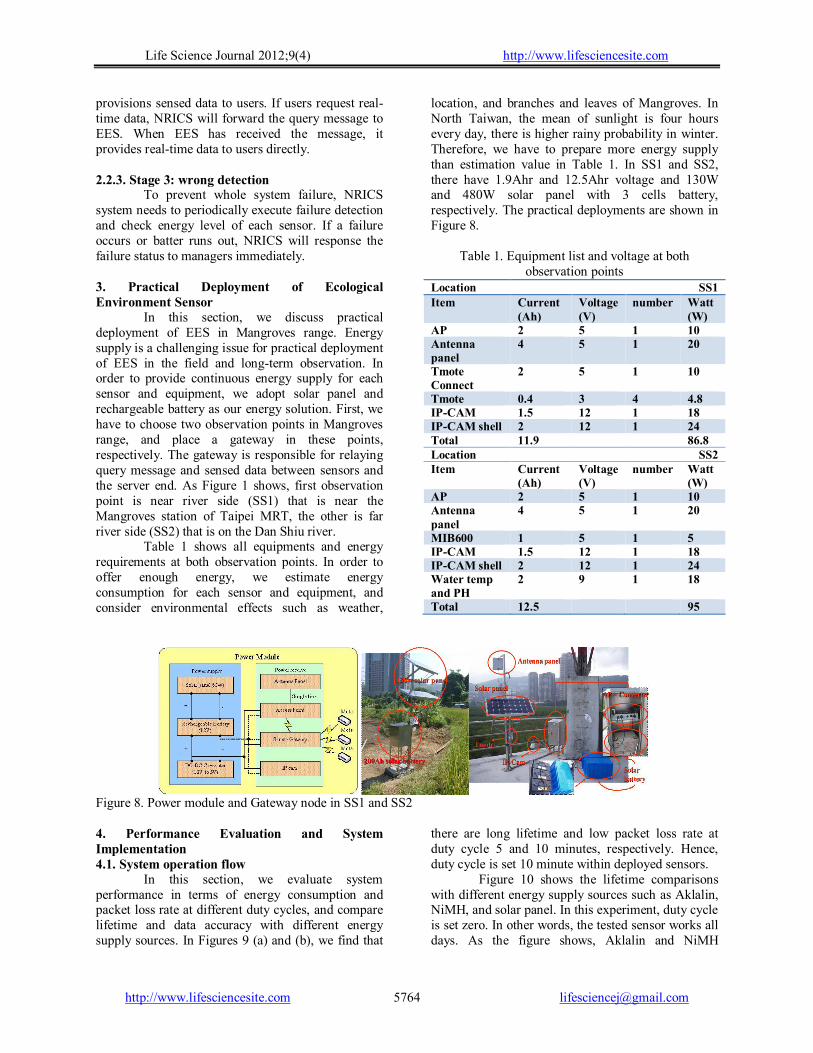
In this section, we discuss practical deployment of EES in Mangroves range. Energy supply is a challenging issue for practical deployment of EES in the field and long-term observation. In order to provide continuous energy supply for each sensor and equipment, we adopt solar panel and rechargeable battery as our energy solution. First, we have to choose two observation points in Mangroves range, and place a gateway in these points, respectively. The gateway is responsible for relaying query message and sensed data between sensors and the server end. As Figure 1 shows, first observation point is near river side (SS1) that is near the Mangroves station of Taipei MRT, the other is far river side (SS2) that is on the Dan Shiu river.
Table 1 shows all equipments and energy requirements at both observation points. In order to offer enough energy, we estimate energy consumption for each sensor and equipment, and consider environmental effects such as weather,
location, and branches and leaves of Mangroves. In North Taiwan, the mean of sunlight is four hours every day, there is higher rainy probability in winter. Therefore, we have to prepare more energy supply than estimation value in Table 1. In SS1 and SS2, there have 1.9Ahr and 12.5Ahr voltage and 130W and 480W solar panel with 3 cells battery, respectively. The practical deployments are shown in Figure 8.
Table 1. Equipment list and voltage at both observation points
MIB600 1 5 1 5 IP-CAM 1.5 12 1 18 IP-CAM shell 2 12 1 24 Water temp and PH
2 9 1 18
Total 12.5 95
Figure 8. Power module and Gateway node in SS1 and SS2 4. Performance Evaluation and System Implementation 4.1. System operation flow
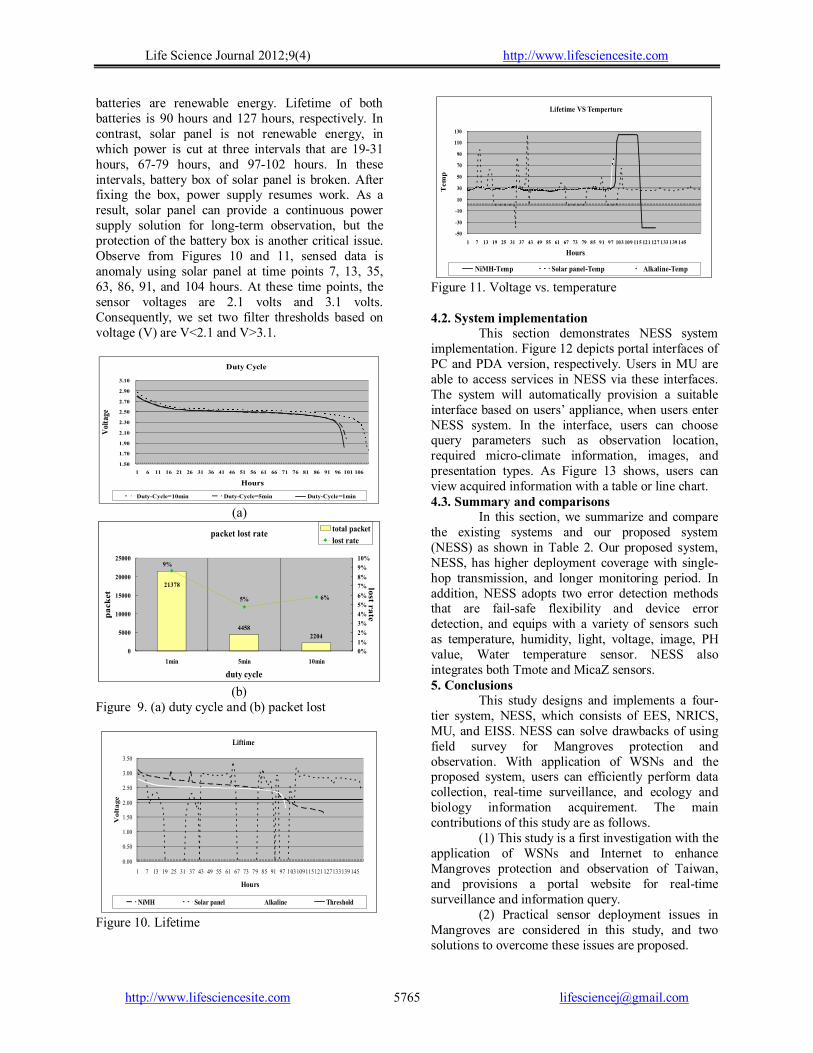
In this section, we evaluate system performance in terms of energy consumption and packet loss rate at different duty cycles, and compare lifetime and data accuracy with different energy supply sources. In Figures 9 (a) and (b), we find that
there are long lifetime and low packet loss rate at duty cycle 5 and 10 minutes, respectively. Hence, duty cycle is set 10 minute within deployed sensors.
Figure 10 shows the lifetime comparisons with different energy supply sources such as Aklalin, NiMH, and solar panel. In this experiment, duty cycle is set zero. In other words, the tested sensor works all days. As the figure shows, Aklalin and NiMH
Life Science Journal 2012;9(4) http://www.lifesciencesite.com
batteries are renewable energy. Lifetime of both batteries is 90 hours and 127 hours, respectively. In contrast, solar panel is not renewable energy, in which power is cut at three intervals that are 19-31 hours, 67-79 hours, and 97-102 hours. In these intervals, battery box of solar panel is broken. After fixing the box, power supply resumes work. As a result, solar panel can provide a continuous power supply solution for long-term observation, but the protection of the battery box is another critical issue. Observe from Figures 10 and 11, sensed data is anomaly using solar panel at time points 7, 13, 35, 63, 86, 91, and 104 hours. At these time points, the sensor voltages are 2.1 volts and 3.1 volts. Consequently, we set two filter thresholds based on voltage (V) are V<2.1 and V>3.1.
Figure 11. Voltage vs. temperature 4.2. System implementation
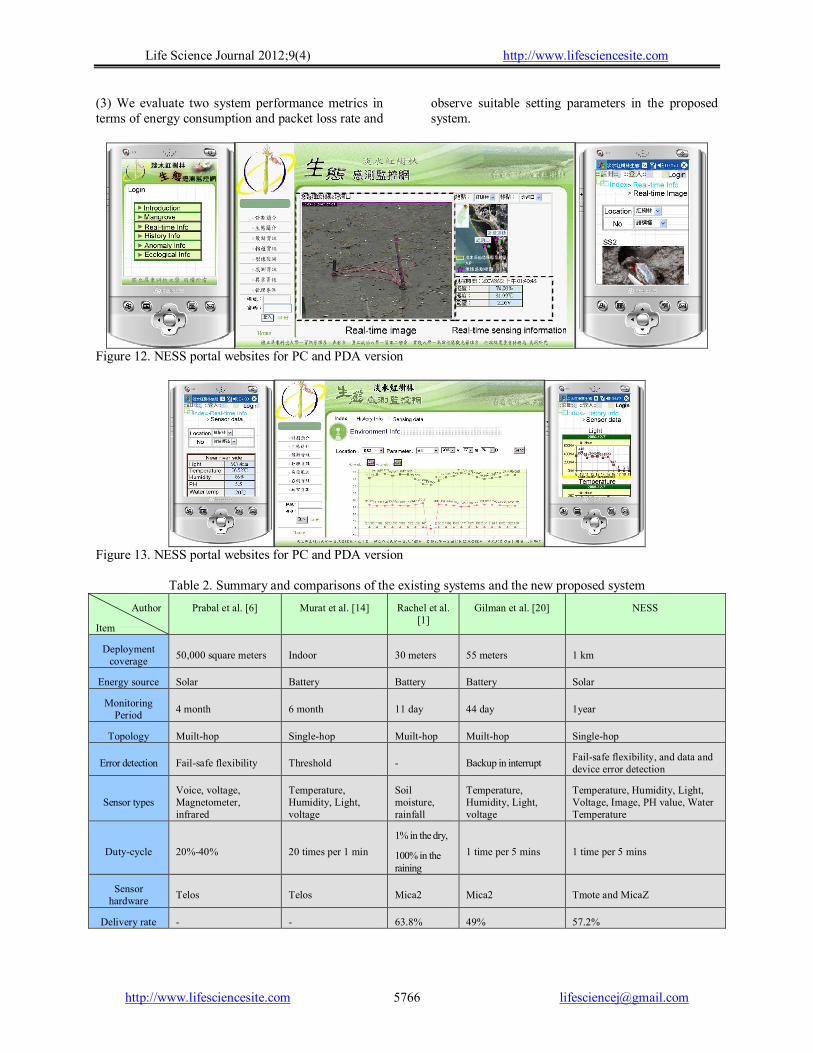
This section demonstrates NESS system implementation. Figure 12 depicts portal interfaces of PC and PDA version, respectively. Users in MU are able to access services in NESS via these interfaces. The system will automatically provision a suitable interface based on users’ appliance, when users enter NESS system. In the interface, users can choose query parameters such as observation location, required micro-climate information, images, and presentation types. As Figure 13 shows, users can view acquired information with a table or line chart. 4.3. Summary and comparisons
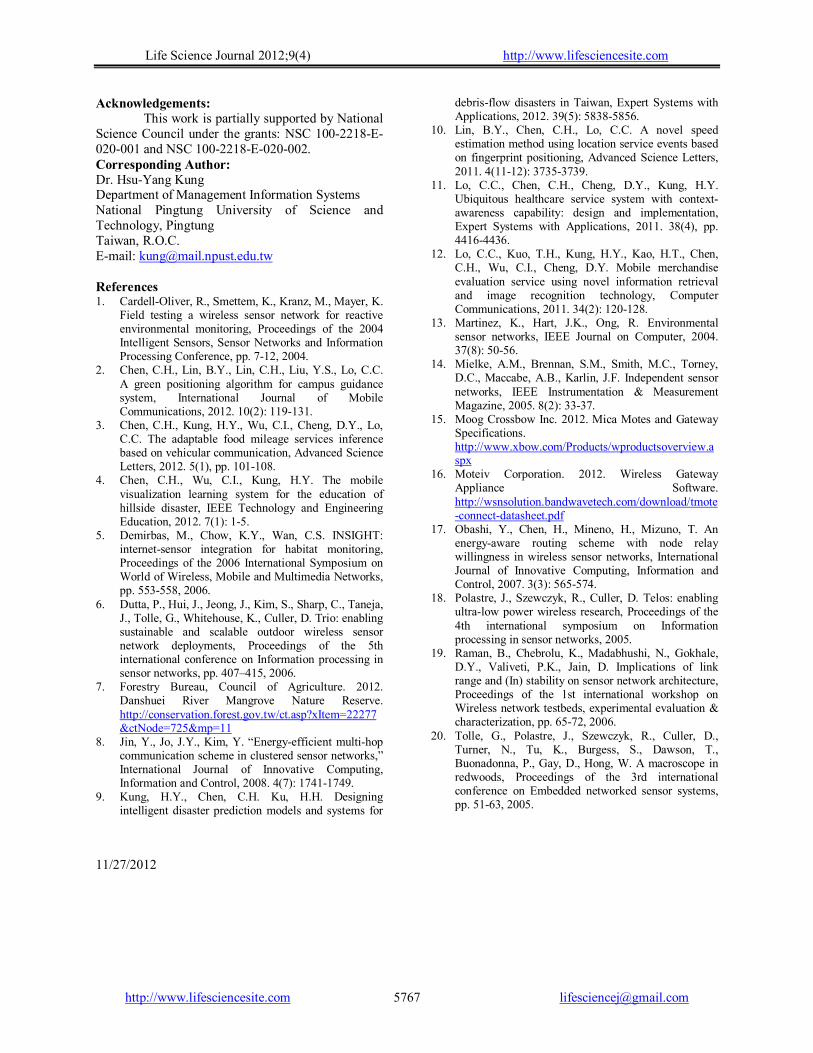
In this section, we summarize and compare the existing systems and our proposed system (NESS) as shown in Table 2. Our proposed system, NESS, has higher deployment coverage with single-hop transmission, and longer monitoring period. In addition, NESS adopts two error detection methods that are fail-safe flexibility and device error detection, and equips with a variety of sensors such as temperature, humidity, light, voltage, image, PH value, Water temperature sensor. NESS also integrates both Tmote and MicaZ sensors. 5. Conclusions
This study designs and implements a four-tier system, NESS, which consists of EES, NRICS, MU, and EISS. NESS can solve drawbacks of using field survey for Mangroves protection and observation. With application of WSNs and the proposed system, users can efficiently perform data collection, real-time surveillance, and ecology and biology information acquirement. The main contributions of this study are as follows.
(1) This study is a first investigation with the application of WSNs and Internet to enhance Mangroves protection and observation of Taiwan, and provisions a portal website for real-time surveillance and information query. (2) Practical sensor deployment issues in Mangroves are considered in this study, and two solutions to overcome these issues are proposed.
Life Science Journal 2012;9(4) http://www.lifesciencesite.com
Acknowledgements: This work is partially supported by National
Science Council under the grants: NSC 100-2218-E-020-001 and NSC 100-2218-E-020-002. Corresponding Author: Dr. Hsu-Yang Kung Department of Management Information Systems National Pingtung University of Science and Technology, Pingtung Taiwan, R.O.C. E-mail: [email protected] References 1. Cardell-Oliver, R., Smettem, K., Kranz, M., Mayer, K.
Field testing a wireless sensor network for reactive environmental monitoring, Proceedings of the 2004 Intelligent Sensors, Sensor Networks and Information Processing Conference, pp. 7-12, 2004.
2. Chen, C.H., Lin, B.Y., Lin, C.H., Liu, Y.S., Lo, C.C. A green positioning algorithm for campus guidance system, International Journal of Mobile Communications, 2012. 10(2): 119-131.
3. Chen, C.H., Kung, H.Y., Wu, C.I., Cheng, D.Y., Lo, C.C. The adaptable food mileage services inference based on vehicular communication, Advanced Science Letters, 2012. 5(1), pp. 101-108.
4. Chen, C.H., Wu, C.I., Kung, H.Y. The mobile visualization learning system for the education of hillside disaster, IEEE Technology and Engineering Education, 2012. 7(1): 1-5.
5. Demirbas, M., Chow, K.Y., Wan, C.S. INSIGHT: internet-sensor integration for habitat monitoring, Proceedings of the 2006 International Symposium on World of Wireless, Mobile and Multimedia Networks, pp. 553-558, 2006.
6. Dutta, P., Hui, J., Jeong, J., Kim, S., Sharp, C., Taneja, J., Tolle, G., Whitehouse, K., Culler, D. Trio: enabling sustainable and scalable outdoor wireless sensor network deployments, Proceedings of the 5th international conference on Information processing in sensor networks, pp. 407–415, 2006.
7. Forestry Bureau, Council of Agriculture. 2012. Danshuei River Mangrove Nature Reserve. http://conservation.forest.gov.tw/ct.asp?xItem=22277&ctNode=725&mp=11
8. Jin, Y., Jo, J.Y., Kim, Y. “Energy-efficient multi-hop communication scheme in clustered sensor networks,” International Journal of Innovative Computing, Information and Control, 2008. 4(7): 1741-1749.
9. Kung, H.Y., Chen, C.H. Ku, H.H. Designing intelligent disaster prediction models and systems for
debris-flow disasters in Taiwan, Expert Systems with Applications, 2012. 39(5): 5838-5856.
10. Lin, B.Y., Chen, C.H., Lo, C.C. A novel speed estimation method using location service events based on fingerprint positioning, Advanced Science Letters, 2011. 4(11-12): 3735-3739.
11. Lo, C.C., Chen, C.H., Cheng, D.Y., Kung, H.Y. Ubiquitous healthcare service system with context-awareness capability: design and implementation, Expert Systems with Applications, 2011. 38(4), pp. 4416-4436.
12. Lo, C.C., Kuo, T.H., Kung, H.Y., Kao, H.T., Chen, C.H., Wu, C.I., Cheng, D.Y. Mobile merchandise evaluation service using novel information retrieval and image recognition technology, Computer Communications, 2011. 34(2): 120-128.
13. Martinez, K., Hart, J.K., Ong, R. Environmental sensor networks, IEEE Journal on Computer, 2004. 37(8): 50-56.
17. Obashi, Y., Chen, H., Mineno, H., Mizuno, T. An energy-aware routing scheme with node relay willingness in wireless sensor networks, International Journal of Innovative Computing, Information and Control, 2007. 3(3): 565-574.
18. Polastre, J., Szewczyk, R., Culler, D. Telos: enabling ultra-low power wireless research, Proceedings of the 4th international symposium on Information processing in sensor networks, 2005.
19. Raman, B., Chebrolu, K., Madabhushi, N., Gokhale, D.Y., Valiveti, P.K., Jain, D. Implications of link range and (In) stability on sensor network architecture, Proceedings of the 1st international workshop on Wireless network testbeds, experimental evaluation & characterization, pp. 65-72, 2006.
20. Tolle, G., Polastre, J., Szewczyk, R., Culler, D., Turner, N., Tu, K., Burgess, S., Dawson, T., Buonadonna, P., Gay, D., Hong, W. A macroscope in redwoods, Proceedings of the 3rd international conference on Embedded networked sensor systems, pp. 51-63, 2005.