Life Science Journal 2012;9(4) http://www.lifesciencesite.com http://www.lifesciencesite.com [email protected]587 InvestigatingThe Effect of Number of Steps on Energy Dissipation of Stepped Spillways Based on the New Design Approach Mohammad Karami 1. Department of Civil Engineering, Dehloran branch,Islamic azad university, Dehaloran,iran [email protected]Abstract: Stepped spillways are hydraulic structures that, because of their significant capacity in energy dissipation, have been widely used by designers. Flow mechanism over them is complex and many investigations have been performed to study that mechanism. The effect of some parameters such as the number of steps in energy dissipation has not been fully investigated. In this study the latest design criteria have been reviewed and then an algorithm has been developed to design the stepped spillways which are based on the effect of number of steps. Results show that the number of steps affects the energy dissipation. With increasing the number of steps energy dissipation increases and then decreases. Thus for specific discharge and spillway slope, the number of steps can be optimized for maximum energy dissipation. By reducing design discharge the optimum number of steps increases. Research work on this subject can be continued in the future and various aspects of the design parameters may be investigated [Mohammad Karami . InvestigatingThe Effect of Number of Steps on Energy Dissipation of Stepped Spillways Based on the New Design Approach. Life Sci J 2012;9(4):587-592] (ISSN:1097-8135). http://www.lifesciencesite.com . 89 Keywords: Design discharge, Energy dissipation, Number of steps, Spillway slope. 1. Introduction The main objective of application of stepped spillways in structureof a reservoir dam is the high impact it has on the rate of energy flow. The height of a reservoir dam and its spillway during the floodmakes the water flow over the spillway toward the downstream. At this time, high kinetic energy of water can cause severe erosion of the river bottom, scour or erosion under the floor slab concrete foundation and flat or pond overflow and eventually cause phenomenon of cavitation. High construction costs overruns smooth (or overflow of water slides Oji standard) due to the high volume of excavation is usually in place in the coastal basins of peace and tranquility of the pond for proper hydraulic jump, high jump and the depth of resistance to the wall with height, including technical reasons, instead choosing to use an overflow spillway steps are smooth. In this option, a flat section of the spillway will be replaced with steps. Steps as large roughness and the flow resistance and thus increase the energy flow are beneficial. Another reason to use the stair concrete spillway dam has been a roller or the RCC. This is why the attention of researchers and designers now overflow with stairs too much. The mechanism of such structures on complex and much research is being done in recognition of its world- wide. New findings and changes in the previous design criteria, which sometimes are also associated with violations of the older theoryfaced with the problem and confusion and the different methods used to close in design. Also, recent studies showed that some overflow geometric profile of the stairs in the reports have remained unexplained or has not been provided a full report on them. From among these studies we can name Ohotsu et al. (2004) and Gonzalez et al. (2008). The aim of this study is the examination of a new method to design stepped spillways and the impact of number of the stairs on the energy wastage based on the design of the weir. Most researchers consider three different flow regimes based on the rate of energy dissipation mechanisms, namely a falling, non-falling as well as being second conversion (Chanson 1994, Chamani and Rajaratnam 1999). The falling type occurs inlow- flow discharge and the large step height. Each step acts as a separate vertical drop waterfall and the stream moves on overflow as downstream collision jets sequence at the bottom of the stairs. Non-falling type occurs in larger overflows with and lower step height. Due to the high discharge current, the stairs are completely submerged below the water level. In this regime, a false bottom is formed which connects successive steps of the trailing edge. The eddy currents are formed in this false bottom. Major part of this energydissipate in this regime is created of spin currents under false bottoms. There are three distinct regions in this regime: Area with smooth flow and without air, the spreading area with quasi-uniform current and, the fully developed area or uniform flow. The flow is without air and smooth over the spillway. With the growth of turbulent boundary layer and reaching the water level, air entersdownstream steps and the turbulence hits its peak. In case of the spillway being lengthy, the
Transcript
Life Science Journal 2012;9(4) http://www.lifesciencesite.com
Abstract: Stepped spillways are hydraulic structures that, because of their significant capacity in energy dissipation, have been widely used by designers. Flow mechanism over them is complex and many investigations have been performed to study that mechanism. The effect of some parameters such as the number of steps in energy dissipation has not been fully investigated. In this study the latest design criteria have been reviewed and then an algorithm has been developed to design the stepped spillways which are based on the effect of number of steps. Results show that the number of steps affects the energy dissipation. With increasing the number of steps energy dissipation increases and then decreases. Thus for specific discharge and spillway slope, the number of steps can be optimized for maximum energy dissipation. By reducing design discharge the optimum number of steps increases. Research work on this subject can be continued in the future and various aspects of the design parameters may be investigated [Mohammad Karami . InvestigatingThe Effect of Number of Steps on Energy Dissipation of Stepped Spillways Based on the New Design Approach. Life Sci J 2012;9(4):587-592] (ISSN:1097-8135). http://www.lifesciencesite.com. 89 Keywords: Design discharge, Energy dissipation, Number of steps, Spillway slope. 1. Introduction
The main objective of application of stepped spillways in structureof a reservoir dam is the high impact it has on the rate of energy flow. The height of a reservoir dam and its spillway during the floodmakes the water flow over the spillway toward the downstream. At this time, high kinetic energy of water can cause severe erosion of the river bottom, scour or erosion under the floor slab concrete foundation and flat or pond overflow and eventually cause phenomenon of cavitation.
High construction costs overruns smooth (or overflow of water slides Oji standard) due to the high volume of excavation is usually in place in the coastal basins of peace and tranquility of the pond for proper hydraulic jump, high jump and the depth of resistance to the wall with height, including technical reasons, instead choosing to use an overflow spillway steps are smooth. In this option, a flat section of the spillway will be replaced with steps. Steps as large roughness and the flow resistance and thus increase the energy flow are beneficial. Another reason to use the stair concrete spillway dam has been a roller or the RCC. This is why the attention of researchers and designers now overflow with stairs too much. The mechanism of such structures on complex and much research is being done in recognition of its world-wide. New findings and changes in the previous design criteria, which sometimes are also associated with violations of the older theoryfaced with the problem and confusion and the different methods used to close in design. Also, recent studies showed that some overflow geometric profile of the stairs in
the reports have remained unexplained or has not been provided a full report on them. From among these studies we can name Ohotsu et al. (2004) and Gonzalez et al. (2008). The aim of this study is the examination of a new method to design stepped spillways and the impact of number of the stairs on the energy wastage based on the design of the weir.
Most researchers consider three different flow regimes based on the rate of energy dissipation mechanisms, namely a falling, non-falling as well as being second conversion (Chanson 1994, Chamani and Rajaratnam 1999). The falling type occurs inlow-flow discharge and the large step height. Each step acts as a separate vertical drop waterfall and the stream moves on overflow as downstream collision jets sequence at the bottom of the stairs. Non-falling type occurs in larger overflows with and lower step height. Due to the high discharge current, the stairs are completely submerged below the water level. In this regime, a false bottom is formed which connects successive steps of the trailing edge. The eddy currents are formed in this false bottom. Major part of this energydissipate in this regime is created of spin currents under false bottoms. There are three distinct regions in this regime:
Area with smooth flow and without air, the spreading area with quasi-uniform current and, the fully developed area or uniform flow.
The flow is without air and smooth over the spillway. With the growth of turbulent boundary layer and reaching the water level, air entersdownstream steps and the turbulence hits its peak. In case of the spillway being lengthy, the
Life Science Journal 2012;9(4) http://www.lifesciencesite.com
current becomes foamy and will appear as white water.
Note that uniform flow, in the real sense of the word,does not form on the spillway, because the rotating three-dimensional vortex formed below the triangular false floor space between the stairs creates a non-uniform flow rate. For this reason, some researchers use the term quasi-uniform in case there is a long length overflow (Ohotso et al., 2004).
Since the aim of constructing spillways on the dam is to safely convey flood discharge to downstream, the stepped spillway design criteria with the maximum flood discharge, is anon-falling flow regime. Obviously, if the flood of overflow is relatively lower than the overflow design, there is possibility of creating falling regimes over the spillway. Conversion regime is a moderate situation which is accompanied with high dispersion of water droplets. Accordingly, many dynamic forces are exerted into the spillway structure, therefore,it is not recommended on its basis.
Little research has been done on this type of flow regime in the world (Chanson and Gonzalez, 2006). Materials and Methods
The first criterion for starting the non-falling regimewas presented by Rajaratnam (1990). He presented starting thenon-falling flow regime for 8/0 <h / dc. DC is the critical depth and H is the height of each step. These criteria are based on information from tests in the range of slopes 9/0 to 4/0 = h / 1. 1 is the horizontal length of each step. The next relationship was presented by Chanson (1994b). This relationship was based on available data from tests for slopes of1/2 to 2/0 = h / 1 (11 to 51 degrees). His studies showed that for the non-falling flow regime to occur, the discharge amount must become higher than flow from a more critical characteristic value. This characteristic discharge for the onset of non-falling regime was presented as equation 1:
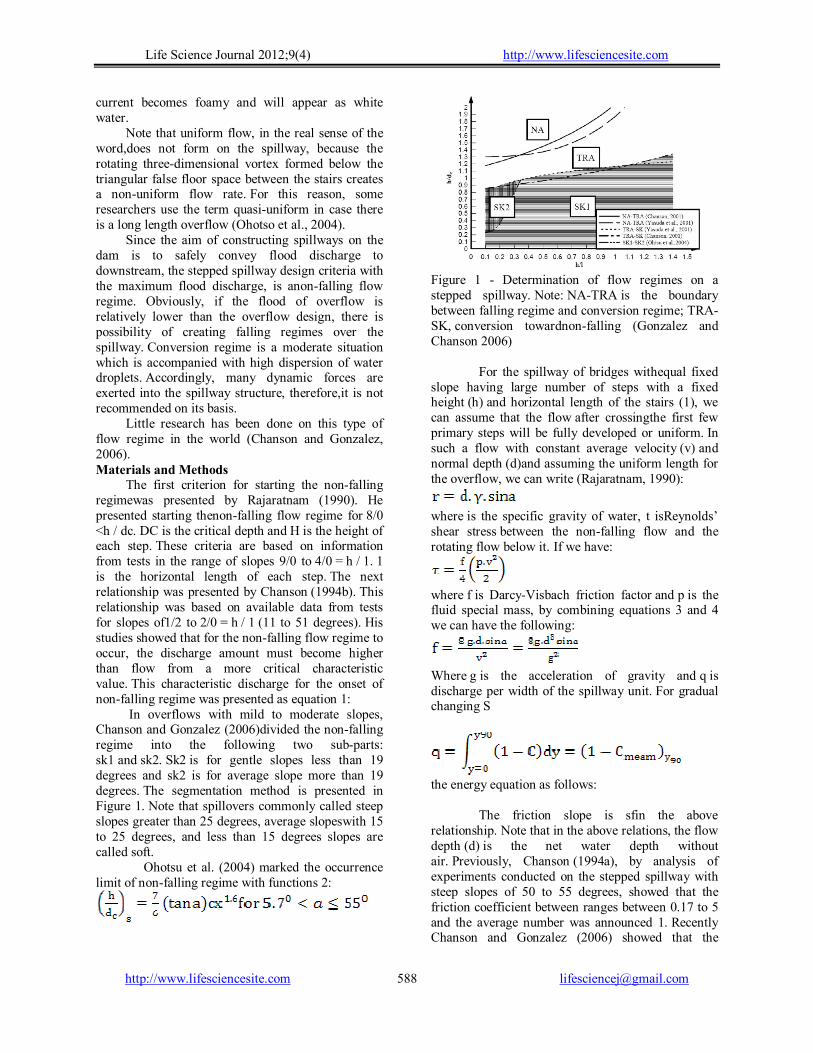
In overflows with mild to moderate slopes, Chanson and Gonzalez (2006)divided the non-falling regime into the following two sub-parts: sk1 and sk2. Sk2 is for gentle slopes less than 19 degrees and sk2 is for average slope more than 19 degrees. The segmentation method is presented in Figure 1. Note that spillovers commonly called steep slopes greater than 25 degrees, average slopeswith 15 to 25 degrees, and less than 15 degrees slopes are called soft.
Ohotsu et al. (2004) marked the occurrence limit of non-falling regime with functions 2:
Figure 1 - Determination of flow regimes on a stepped spillway. Note: NA-TRA is the boundary between falling regime and conversion regime; TRA-SK, conversion towardnon-falling (Gonzalez and Chanson 2006)
For the spillway of bridges withequal fixed slope having large number of steps with a fixed height (h) and horizontal length of the stairs (1), we can assume that the flow after crossingthe first few primary steps will be fully developed or uniform. In such a flow with constant average velocity (v) and normal depth (d)and assuming the uniform length for the overflow, we can write (Rajaratnam, 1990):
where is the specific gravity of water, t isReynolds’ shear stress between the non-falling flow and the rotating flow below it. If we have:
where f is Darcy-Visbach friction factor and p is the fluid special mass, by combining equations 3 and 4 we can have the following:
Where g is the acceleration of gravity and q is discharge per width of the spillway unit. For gradual changing S
the energy equation as follows:
The friction slope is sfin the above
relationship. Note that in the above relations, the flow depth (d) is the net water depth without air. Previously, Chanson (1994a), by analysis of experiments conducted on the stepped spillway with steep slopes of 50 to 55 degrees, showed that the friction coefficient between ranges between 0.17 to 5 and the average number was announced 1. Recently Chanson and Gonzalez (2006) showed that the
Life Science Journal 2012;9(4) http://www.lifesciencesite.com
coefficient of friction is changing between 0.1 and0.25, and its average is 0.2.As noted, this is because the flow is highly aerated over the spillway and energydissipate occurs because of water flow and therefore depth of the air should be deducted from total depth. It should be reminded that the air density is eight hundred times the less than that of water and itsshear stress impact will be far lesser. Thus we have:
where C is the concentration of air bubbles
and y90 corresponds to the depth in which the air comprises 90 percent.
It is noted that the concentration of air bubbles at a certain point vary in different dyswith different values of c. Test results of Gonzalez et al (2008) show that the hyperbolic tangent function of the concentration distribution of air bubbles can be used here: In the above equation, k and D0 are obtained from the following relations:
D0 is a parameter dependent upon the average
concentration of air bubbles (C mean ). The spillway designers do not have the concentration distribution of air bubbles, so the researchers have tried to simplify the regression relationships provide for designers. From these relationshipsne can refer to Ohotsu et al. (2004) as follows:
D= 0.3 for 5.70<a<190 D=-0.00024a2+0.0214a-0.0357 for190≤a≤550 Friction factor is presented by the following equation Ohotsu et al. (2004):
for 0.1≤
A= -1.7*10-3a2+6.4*10-2a-1.5*10-1
fmax=-4.2*10-4a2+1.6*10-2a+3.2*10-2 for 5.70≤a≤190 A= 0.452 fmax=2.32*10-5a2-2.75*10-3a+2.31*10-1 for 190≤a≤550
The aeration locations (aeration start) from
the spillway crest and the water depth at that point are obtained by the following relations (Chanson, 19):
Designer should check that the spillway length be larger than LI. In this case, the quasi-uniform flow will occur over the spillway. Ohotsu et al.(2004) proposed the following relationship for the quasi-uniform flow:
for 5.70≤a≤550 that is:
The remaining energy in quasi-uniform flow on the spillway is calculated as follows:
Life Science Journal 2012;9(4) http://www.lifesciencesite.com
The remaining energy in spillovers on non-uniform flow is calculated as follow:
Relative energy dissipateis determined as follows:
In this study, first,an algorithm for the
design of spillway hydraulic regime of quasi-uniform is presented which is usable for related operators. The proposed method is based on the results of tests conducted worldwide on a large-scale physical models and can be safely used for the prototype design (Ohotsu et al, 2004).Then, based on thedeveloped algorithm, examination of the effect of number of steps on energy dissipate will be conducted; because as previously mentioned, in the available literature, choosing the appropriate number of steps for the better design of the spillway has gone untapped.
Below, the step by step spillway design methodis explained: 1 - Height (Hdam) and the spillway slope (a) are obtained from topographic and locational map; the discharge amount (Q) is estimated based on the flood with a given return period. An initial assumed width (W) of overflow is chosen. 2 - The critical depth is calculated form this relationship: 3 - The next parameter Hdam /d c is determined. 4 - Height of stairs is chosen for the non-falling regime to occur such that 0.25 ≤ h / d c ≤ (h / d c) s where (h / d c) s is obtained from equation 2. According to Chanson and Gonzalez (2006), in most stepped spillways in the building of Gabion dams and roller concrete dams, step heights in the executive area ranges from 0.2 to 0.9 meters that can be used as a criterion in selecting the proper height of stair design. 5 - The amount h / d c is determined. 6 - The amount of is calculated from the relationship12. If the condition was established, the
quasi-uniform flow has been produced and the friction factor is calculated from equation 10. 7 - Flow depth is calculated using relationship 5. Flow rate as is obtained as such:…. 8 - The average concentration of air bubbles is calculated from equation 9 and y90 is obtained from equation 7. 9 - Protective side walls heightis determined from h w=1.4 y90. The remaining energy of quasi-uniform or non-uniform flow regime is calculated by relationship 13 or 14. 10 - Residual energy with quasi-uniform or non-uniform flow regime is determined with relationship 13 or 14. 11 - Relative energy dissipateis determined using equation 15.
The proposed algorithm for the step by step design of overflow was formulated in the Excel spreadsheet. The purpose is to examine the effect of the number of steps on the energy wastage. The more energy is dissipated, the more will be reduced the amount of administrative costs for constructing energy depreciatingfacilities like peace pond. Discussion and Results
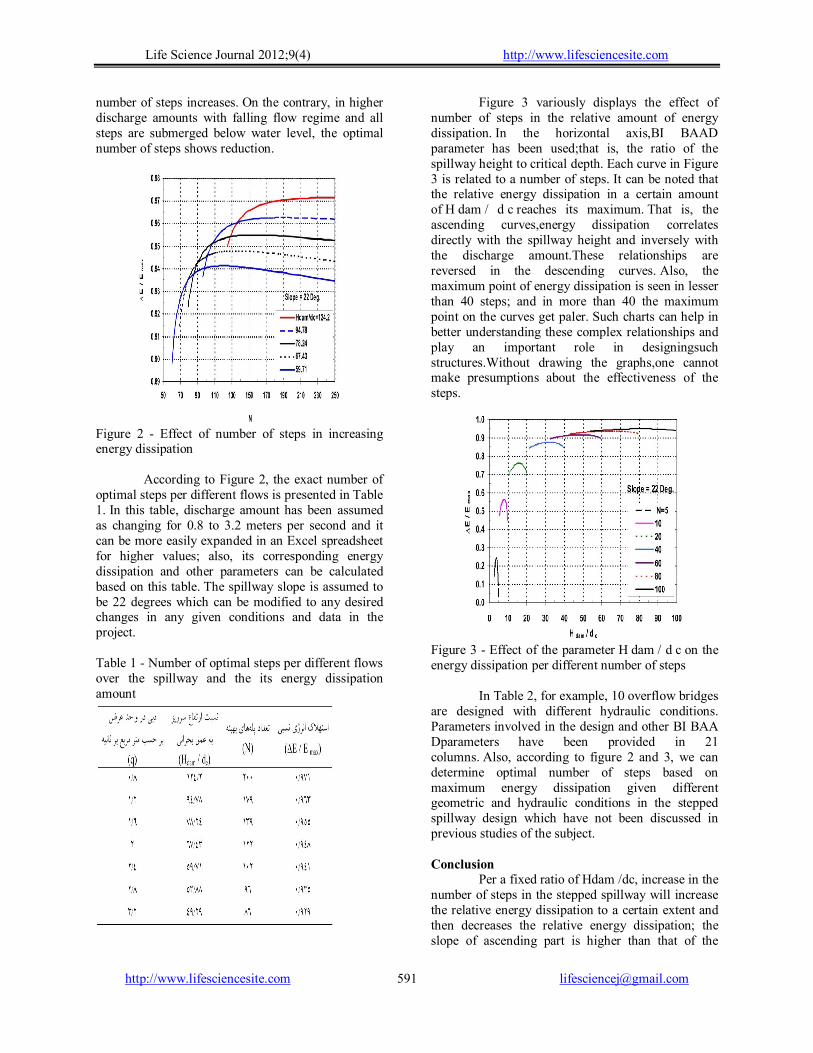
Figure 2 presents changes in the energy dissipation curve on the vertical axis proportioned to the number of steps in the horizontal axis. From other influential parameters, one can mention the total spillway height, slope and discharge amount. In this figure, the spillway slope is assumed to have a constant 22 degrees, and discharge in the height and width unit hasbeen taken as changing. That is, the ratio of BI BAAD H dam / d c changes from 59.71 to 124.2. Figure 2 has been plotted based on the proposed algorithm for designing the stepped spillway.
According to figure 2, corresponding to a constant rate of Hdam / dc, increasing number of steps causes the increase in energy dissipation to a certain extent, and then makes the relative energy dissipation reduce. The slope of the ascending part, however, is greater than that of the descending one.
It can be seen that,corresponding to any Hdam /dc, of an optimized number of steps to maximize energy dissipation can be determined. Also, per a fixed number of steps with Hdam /dc reached from 59.71 to 124.2, the relative energy dissipation rises.
According to figure 2, with reduction of the dam discharge or augmentation of the height of the spillway, the optimal number of steps also shows increases.
This shows that although the current regime is assumed as non-falling, but with reduced flow and a tendency toward the falling regime, the optimal
Life Science Journal 2012;9(4) http://www.lifesciencesite.com
number of steps increases. On the contrary, in higher discharge amounts with falling flow regime and all steps are submerged below water level, the optimal number of steps shows reduction.
Figure 2 - Effect of number of steps in increasing energy dissipation
According to Figure 2, the exact number of optimal steps per different flows is presented in Table 1. In this table, discharge amount has been assumed as changing for 0.8 to 3.2 meters per second and it can be more easily expanded in an Excel spreadsheet for higher values; also, its corresponding energy dissipation and other parameters can be calculated based on this table. The spillway slope is assumed to be 22 degrees which can be modified to any desired changes in any given conditions and data in the project. Table 1 - Number of optimal steps per different flows over the spillway and the its energy dissipation amount
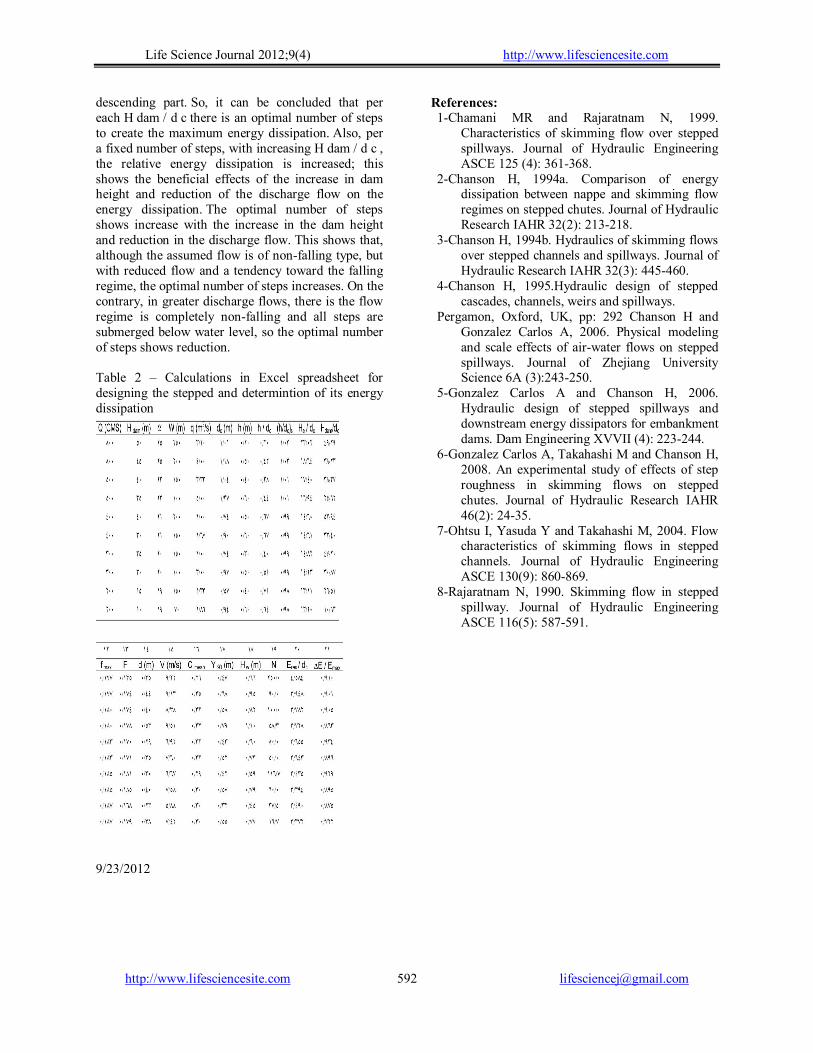
Figure 3 variously displays the effect of number of steps in the relative amount of energy dissipation. In the horizontal axis,BI BAAD parameter has been used;that is, the ratio of the spillway height to critical depth. Each curve in Figure 3 is related to a number of steps. It can be noted that the relative energy dissipation in a certain amount of H dam / d c reaches its maximum. That is, the ascending curves,energy dissipation correlates directly with the spillway height and inversely with the discharge amount.These relationships are reversed in the descending curves. Also, the maximum point of energy dissipation is seen in lesser than 40 steps; and in more than 40 the maximum point on the curves get paler. Such charts can help in better understanding these complex relationships and play an important role in designingsuch structures.Without drawing the graphs,one cannot make presumptions about the effectiveness of the steps.
Figure 3 - Effect of the parameter H dam / d c on the energy dissipation per different number of steps
In Table 2, for example, 10 overflow bridges are designed with different hydraulic conditions. Parameters involved in the design and other BI BAA Dparameters have been provided in 21 columns. Also, according to figure 2 and 3, we can determine optimal number of steps based on maximum energy dissipation given different geometric and hydraulic conditions in the stepped spillway design which have not been discussed in previous studies of the subject.
Conclusion
Per a fixed ratio of Hdam /dc, increase in the number of steps in the stepped spillway will increase the relative energy dissipation to a certain extent and then decreases the relative energy dissipation; the slope of ascending part is higher than that of the
Life Science Journal 2012;9(4) http://www.lifesciencesite.com
descending part. So, it can be concluded that per each H dam / d c there is an optimal number of steps to create the maximum energy dissipation. Also, per a fixed number of steps, with increasing H dam / d c , the relative energy dissipation is increased; this shows the beneficial effects of the increase in dam height and reduction of the discharge flow on the energy dissipation. The optimal number of steps shows increase with the increase in the dam height and reduction in the discharge flow. This shows that, although the assumed flow is of non-falling type, but with reduced flow and a tendency toward the falling regime, the optimal number of steps increases. On the contrary, in greater discharge flows, there is the flow regime is completely non-falling and all steps are submerged below water level, so the optimal number of steps shows reduction.
Table 2 – Calculations in Excel spreadsheet for designing the stepped and determintion of its energy dissipation
References: 1-Chamani MR and Rajaratnam N, 1999.
Characteristics of skimming flow over stepped spillways. Journal of Hydraulic Engineering ASCE 125 (4): 361-368.
2-Chanson H, 1994a. Comparison of energy dissipation between nappe and skimming flow regimes on stepped chutes. Journal of Hydraulic Research IAHR 32(2): 213-218.
3-Chanson H, 1994b. Hydraulics of skimming flows over stepped channels and spillways. Journal of Hydraulic Research IAHR 32(3): 445-460.
4-Chanson H, 1995.Hydraulic design of stepped cascades, channels, weirs and spillways.
Pergamon, Oxford, UK, pp: 292 Chanson H and Gonzalez Carlos A, 2006. Physical modeling and scale effects of air-water flows on stepped spillways. Journal of Zhejiang University Science 6A (3):243-250.
5-Gonzalez Carlos A and Chanson H, 2006. Hydraulic design of stepped spillways and downstream energy dissipators for embankment dams. Dam Engineering XVVII (4): 223-244.
6-Gonzalez Carlos A, Takahashi M and Chanson H, 2008. An experimental study of effects of step roughness in skimming flows on stepped chutes. Journal of Hydraulic Research IAHR 46(2): 24-35.
7-Ohtsu I, Yasuda Y and Takahashi M, 2004. Flow characteristics of skimming flows in stepped channels. Journal of Hydraulic Engineering ASCE 130(9): 860-869.
8-Rajaratnam N, 1990. Skimming flow in stepped spillway. Journal of Hydraulic Engineering ASCE 116(5): 587-591.


![Pensacola Journal. (Pensacola, Florida) 1907-05-12 [p 8].ufdcimages.uflib.ufl.edu/UF/00/07/59/11/00849/00330.pdfHowe than with cause never with time with that 24 cause cause that Iary](https://static.documents.pub/doc/80x56/610fa6c8cc67b2140e3dcaac/pensacola-journal-pensacola-florida-1907-05-12-p-8-howe-than-with-cause-never.jpg)


![Life Science Journal 2012;9(4) ...€¦ · with velocities bigger than , the dynamic friction force reduces with velocity [12]. where is the electron density and is called coulomb](https://static.documents.pub/doc/80x56/5eab7e5e9ddb2e2d036e0109/life-science-journal-201294-with-velocities-bigger-than-the-dynamic-friction.jpg)
