Page 1
8/13/2019 Lins Neto et al 2013
http://slidepdf.com/reader/full/lins-neto-et-al-2013 1/13
Page 2
8/13/2019 Lins Neto et al 2013
http://slidepdf.com/reader/full/lins-neto-et-al-2013 2/13
in rainforests [10-12] or to climate change [13]. Accord-
ing to some studies, rainfall is among the main factors
associated with changes in phenology of species found
in arid and semi-arid ecosystems [14,15]. However, other
authors argue that the phenology of some species found
in dry forests do not simply depend on rainfall, but also,
on the water status of the plant [16,17], for example the
capacity to store water and nutrients to be used during
drought periods [18]. In any case, rainfall is an environ-
mental variable that cannot be neglected in phenological
studies conducted in dry forests. Higher insolation and
consequent photosynthetic rates of plants located at forest
edges seem to promote higher rates of flowering, fruiting
[19,20] and leaf flush [21], and higher temperatures tend
to increase leaf fall [22]. Similarly, a study performed in
fragments of the Atlantic forest in northeastern Brazil
recorded both higher reproductive activity and greater
intensity of phenophases at the forest edge as comparedto the forest interior [12]. However, this pattern may not
occur for some species (as pointed out by Laurance et al.
[6] for Amazonian species) and may also depend on the
time since edge creation [7]. Other aspects to be consid-
ered are the effects of different forms of land management
on the phenology of some species [23]. Flowering and
fruiting of some species may suffer strong influence of
human management. Otero-Arnaiz et al. [23], for ex-
ample, found that Polaskia chichipe individuals cultivated
had presented a higher intensity of fruiting compared to
wild individuals of the same species. As for flowering,
Stenocereus stellatus individuals had presented a highernumber of flowers in anthesis than the ones presented by
wild area individuals [24].
An important approach for studying plant phenology
involves the use of local people’s knowledge of pheno-
logical events. For centuries, human populations have
been selecting and managing plants to meet their basic
needs and accumulating knowledge about the plants’
biology, ecology and phenology [25-28]. Thus, access to
representation of people about the ecosystem enables
the understanding of processes of environmental change,
such transformation of the landscape. This information
may be very useful for rapid diagnostics because the de-
termination of phenological patterns requires long moni-toring periods [29]. Thus, ethnobotanical studies related
to plant phenology may contribute to successful man-
agement strategies for plant resources, especially for
prominent species such as Spondias tuberosa Arruda
(Anacardiaceae).
Spondias tuberosa (locally known as umbuzeiro) is a
native fruit tree that occurs in northeastern and part of
southeastern Brazil [30] in areas of dry forests called
Caatinga [31]. Spondias tuberosa is an andromonoecious
species that is pollinated by a wide range of insects
[9,32,33] and dispersed by vertebrates [34]. This species
represents an important resource for pollinators and dis-
persers because it flowers and fruits during the dry sea-
son. Furthermore, its fruits are an important source of
nutrition and represent an alternative income source for
people during the dry season. As a result, S. tuberosa is
widely known and managed in the semi-arid region of
northeastern Brazil and is also considered a "sacred
plant" [35-38]. The umbuzeiro is rarely cut down and
may be found in both conserved and cultivated areas
and even in Homegardens such as the backyards of
houses [38]. Some studies have investigated differences
in the reproductive biology of S. tuberosa in areas with
different management regimes in the Caatinga [32,33],
but there are no studies related to the influence of differ-
ent management regimes on its phenology, or on the
local people’s perceptions of this species’ phenophases.
In the city of Altinho, Pernambuco state, there is a rural
community called Carão. Carão is located in a Caatingaarea with relatively well-preserved native vegetation, along
with areas used for pasture, crops and Homegardens. Indi-
viduals of S. tuberosa are found in all these habitats [38].
The main questions of this study were: a) Are there differ-
ences in the vegetative and reproductive phenology of
S. tuberosa in areas under different management regimes?
b) Are local people’s perceptions of phenophases of
S. tuberosa similar to the actual patterns observed for the
species?
Our hypotheses are a) There are few phenological
differences among individuals of S. tuberosa located in
areas under different management regimes because they are very close to each other [39], especially the flowering
and fruiting. Moreover, because the Caatinga is a much
more open vegetation type than rainforests, there is
likely no noticeable edge effect [40] and this further
decreases the likelihood of finding differences in plant
phenology. b) The local people‘s perceptions of S. tuberosa
phenology tends to be in agreement with the phenological
data obtained in the field, as this is a widely known and
used species. This similarity tends to be higher for the
fruiting phenology, since the fruits are the main product
used in the region [28,38,41]. These assumptions are held
on the following premises: Carão community people
maintain a close relationship with the resource, evidencedin the highlighted role that this species has within the
community [38,42], the intensity of flowering and fruiting
observed in a study on the reproductive success of the
species, developed in the same area of the present study,
had found similarities between the landscape units as for
this aspect [9] and a study conducted with species in
incipient state of domestication in the semi-arid region of
Mexico revealed that the phenology of this species did not
vary in relation to management regimes to which these
populations are subjected [43]. Almeida et al [9] found
no significant differences in the reproductive success of
Neto et al. Journal of Ethnobiology and Ethnomedicine 2013, 9:10 Page 2 of 13
http://www.ethnobiomed.com/content/9/1/10
Page 3
8/13/2019 Lins Neto et al 2013
http://slidepdf.com/reader/full/lins-neto-et-al-2013 3/13
individuals of S. tuberousa in the landscape units, justified
here more general analysis of the activity and intensity of
phenophases the species, thereby allowing emphasize local
perception of phenological pattern of S. tuberosa.
MethodsStudy area
This study was conducted in an area of Caatinga
[9,38,42,44] with deciduous and sub-deciduous tree spe-
cies near a rural community called “Carão” in Altinho
city, Pernambuco state, Brazil. The city is located in the
Borborema highland, with altitudes ranging from 650 to
1000 meters and generally medium to high soil fertility.
The climate is classified as semi-arid hot; the rainy
season takes place from February to August. In this con-
text, the influence of different landscape management
regimes on the phenology of S. tuberosa was evaluated
in five landscape units (LUs) in the region, namely:Mountain (area with vegetation in regeneration for
nearly 50 years – 628m of altitude above sea level),
Mountain Base (area of vegetation in regeneration for
nearly 15 years – 498 m of altitude above sea level),
Pastures (areas of native grassland - 486m of altitude
above sea level), Cultivated Areas (cultivated areas of
maize and beans- 469 m of altitude above sea level), and
Homegardens (backyards - 463 m of altitude above sea
level). The choice of these landscape units was based on
the study conducted by Lins Neto et al. [45] in which it
was determined the history of land use, as well as the
landscape units, recognized by the main informants of the place, as well as the study of Almeida et al. [9],
which evaluated the fruit and flower production, pollin-
ator guild and frequency of floral visitors of Spondias
tuberosa individuals submitted to different soil manage-
ment regimes. It is noteworthy that both works men-
tioned above were conducted in the same area of the
present study. For more information on historical land-
use, the reader is referred to the study of Lins Neto et al.
[45]. Yet in the latter, a complete analysis of soil fertility
has indicated that areas of native pasture and gardens
presented high fertility soils [45].
Social and cultural aspects of Carão are available in
Araújo et al. [44], Almeida et al. [9] and Lins Neto et al.[38]. However, some information relevant to the present
study should be mentioned.
There are currently 189 people living in 61 houses in
Carão. The main economic activity is agro-pastoralism
with mainly subsistence agriculture (especially corn and
bean monocultures and cattle and goat farming). Near
Carão there is a hill, locally known as the Serra (mountain)
covered almost entirely with native vegetation that has
been in a process of regeneration for nearly 50 years [28].
The top of the hill is flat and there are fields of corn, beans
and cassava, which are important for the region’s food
supply. At the base of the hill is a transitional area between
the hill and flatter areas, locally known as the Baixio (low-
lands), where some houses are established, most of which
are organized into a village. There are also shops, Catholic
and Protestant churches and an elementary school. In the
flat areas, there are areas of native grasslands and mono-
cultures close to the houses. Other areas of constant activ-
ity are the backyards of houses, where residents usually
maintain animal and plant (wild and cultivated) cultures.
Phenology of Spondias tuberosa Arruda
For evaluated the pattern phenological of S. tuberosa
evaluated the activity, intensity and synchronization of
reproductive and vegetative phenophases, as well as its
relationship with rainfall, in each LU, ten individuals of
this specie were randomly selected from each population
(totaling 50 individuals) to be included in monthly mon-itoring between February 2007 and January 2009. The
phenophases considered were flowering (flower buds
plus flowers at anthesis), fruiting (immature plus mature
fruits), leaf flush and leaf fall. The activity was deter-
mined by recording the presence or absence of each
phenophase. Estimated the percentage of monthly vari-
ation of phenological changes in each individual, and
was employed the method proposed by Fournier [46] to
evaluate the intensity of each phenophase. This method
consists of apply a semi-quantitative interval scale with
five categories (0–4) and intervals of 25% between each
category for each phenophase considered, and calculatethe intensity index. The Fournier index per month for
each LUs for each phenophase, ranges from 0 to 100%.
To evaluate variation in the synchronization of pheno-
logical phases among individuals of the same LU, and
among LUs, a flowering synchrony index was applied
[47,48]. The synchronization of each phenophase (Xi)
was measured separately for ten individuals of each
landscape unit by summing the number of months
where there was an overlap of the phenophase between
a focal individual and the rest of the sample. This
synchronization was calculated using the following
formula: [Xi = Σij/(N-1) fi], where Σij is the sum of
the number of months in which individuals i and jshowed a synchrony in one phenophase (with i being
different from j); fi is the number of months in which
individual i exhibited a particular phenophase and N is
the total number of individuals in the sample. The syn-
chrony index of the species Z is calculated by the arith-
metic mean of Xi, as follows: Z = ΣXi/N. This index
ranges from 0 (no synchrony) to 1 (perfect synchrony)
[47,48].
Rainfall is a relevant variable in the case of the Caatinga,
therefore this was correlated with the intensity of phe-
nophases. The rainfall data were obtained from the
Neto et al. Journal of Ethnobiology and Ethnomedicine 2013, 9:10 Page 3 of 13
http://www.ethnobiomed.com/content/9/1/10
Page 4
8/13/2019 Lins Neto et al 2013
http://slidepdf.com/reader/full/lins-neto-et-al-2013 4/13
monitoring carried out daily by an experimental basis the
Instituto Agronômico de Pernambucano (IPA), which is
set at about 13 km from the study area.
It is worth mentioning that the approach serves the
purpose of phenological general characterization of phe-
nophases of Spondias tuberosa Arruda under different
conditions of soil management in order to establish a
solid connection with the local perception of those
phenophases.
Local people’s perceptions of phenophases
A collaborative approach, characterized by the sharing of
experiences between the researcher and the residents,
was used to assess the perceptions of Carão residents
regarding the phenophases of S. tuberosa. This approach
valued the knowledge of local people and resulted in de-
termination of the most appropriate strategies to im-
prove planning and actions [49]. This study is part of theresearch project “Traditional knowledge, phenology and
morphological and genetic variability in populations of
Spondias tuberosa Arruda (Anacardiaceae) in semi-arid
Northeast” that was approved by the Ethics Committee on
Research Involving Humans of the Centro de Ciências da
Saúde, Universidade Federal de Pernambuco (registry
number 401/08). Despite the phenological studies had
begun in 2007, the only ethnobotanical approach was
developed in 2009, after the aproval of the ethics commit-
tee. Everybody that chose to participate in the study sign a
Free Consent and Understanding Agreement.
The participative method used in this study is consist-ent with an approach called “Score Exercises” that is
commonly used to determine the relative importance of
the environment and/or resources; the approach consists
of local people quantifying the importance of a given
resource [49,50]. The method was adapted for this study
with the development of a table called the “Phenological
Calendar” with the phenophases as the column labels
and months as the row labels. All those people (112
informants) known from previous ethnobotanical studies
in this community [38] who have mentioned knowledge
and/or use of S. tuberosa were invited to participate in
the activity (70 people). Only 26 people were able to par-
ticipate and they were randomly assigned to four groups.Despite this low number of respondents, it is empha-
sized that the vast majority of informants (10 people) of
the community when it comes to knowledge and use of
umbuzeiro, identified in a previous study [38], partici-
pated in this activity. Thus, four groups were formed
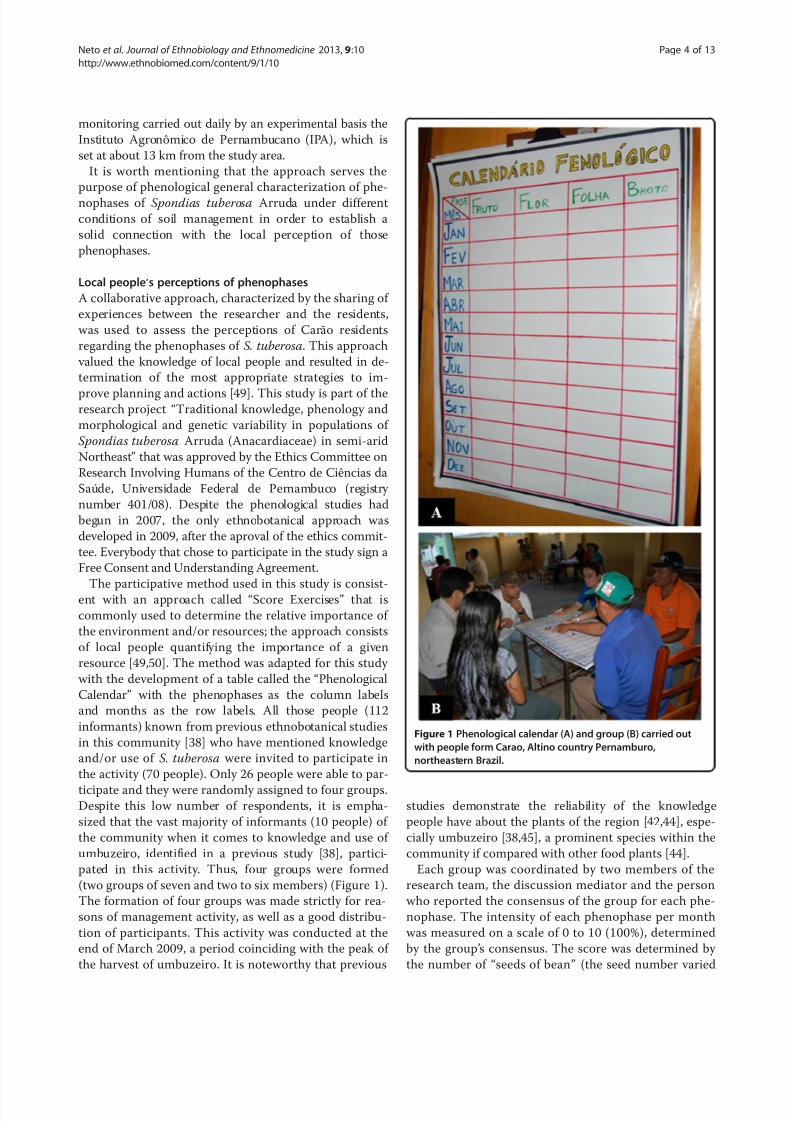
(two groups of seven and two to six members) (Figure 1).
The formation of four groups was made strictly for rea-
sons of management activity, as well as a good distribu-
tion of participants. This activity was conducted at the
end of March 2009, a period coinciding with the peak of
the harvest of umbuzeiro. It is noteworthy that previous
studies demonstrate the reliability of the knowledge
people have about the plants of the region [42,44], espe-
cially umbuzeiro [38,45], a prominent species within the
community if compared with other food plants [44].
Each group was coordinated by two members of the
research team, the discussion mediator and the person
who reported the consensus of the group for each phe-
nophase. The intensity of each phenophase per month
was measured on a scale of 0 to 10 (100%), determined
by the group’s consensus. The score was determined by
the number of “seeds of bean” (the seed number varied
Figure 1 Phenological calendar (A) and group (B) carried out
with people form Carao, Altino country Pernamburo,
northeastern Brazil.
Neto et al. Journal of Ethnobiology and Ethnomedicine 2013, 9:10 Page 4 of 13
http://www.ethnobiomed.com/content/9/1/10
Page 5
8/13/2019 Lins Neto et al 2013
http://slidepdf.com/reader/full/lins-neto-et-al-2013 5/13
from 0, absence of phenophase, 10, maximum intensity,
100%, phenophase of the month) placed in each table
cell, (each cell corresponded to one month) (Figure 1).
For this analysis, two main habitat types were considered:
native vegetation, which comprises the LUs Mountain
Base and Mountain, and managed areas, represented by
Pasture, Cultivated Areas and Homegardens. These two
groups were necessary because most people stated that
there is no distinction of phenophases within the managed
areas and within native vegetation areas. Similarly, pheno-
logical data were grouped into native vegetation and man-
aged areas for comparison with the information on the
“Phenological Calendar”.
Data analysis
To the phenological characterization of the species in
the different areas of landscape management, we tested
the variation in intensity among LUs, within in year;between years, within LUs; and differences in mean
intensity (across two years) among LUs were used a one-
way ANOVA (significance level of 5%) with a posterior
test of Tukey. Concerning the data of proportion, it was
necessary its change into angular values (arcoseno√x/100),
and only then apply the ANOVA test. A Spearman’s rank
correlation coefficient was used to test the correlation
between monthly rainfall and the intensity of phenophases
in each landscape unit. The Bioestat 5.0 [51] computer
program was used for all analyses.
To test the variation between the perceived intensity
of phenophases obtained by "phenological calendar" ac-tivity with the intensity measured over two years ini-
tially, the perception data were multiplied by 10, since
the scale used for phenological timing activity was from
0 to 10. Then both perceived and monitored intensity
during two years were transformed to angular values
(√ arcoseno x/100) and subsequently tested the variation
of the data by ANOVA (one way) with a posteriori
Tukey test at 5% probability. The Bioestat 5.0 [51] com-
puter program was used for all analyses. Differences in
the perception of intensity of phenophases were also
verify using one way ANOVA.
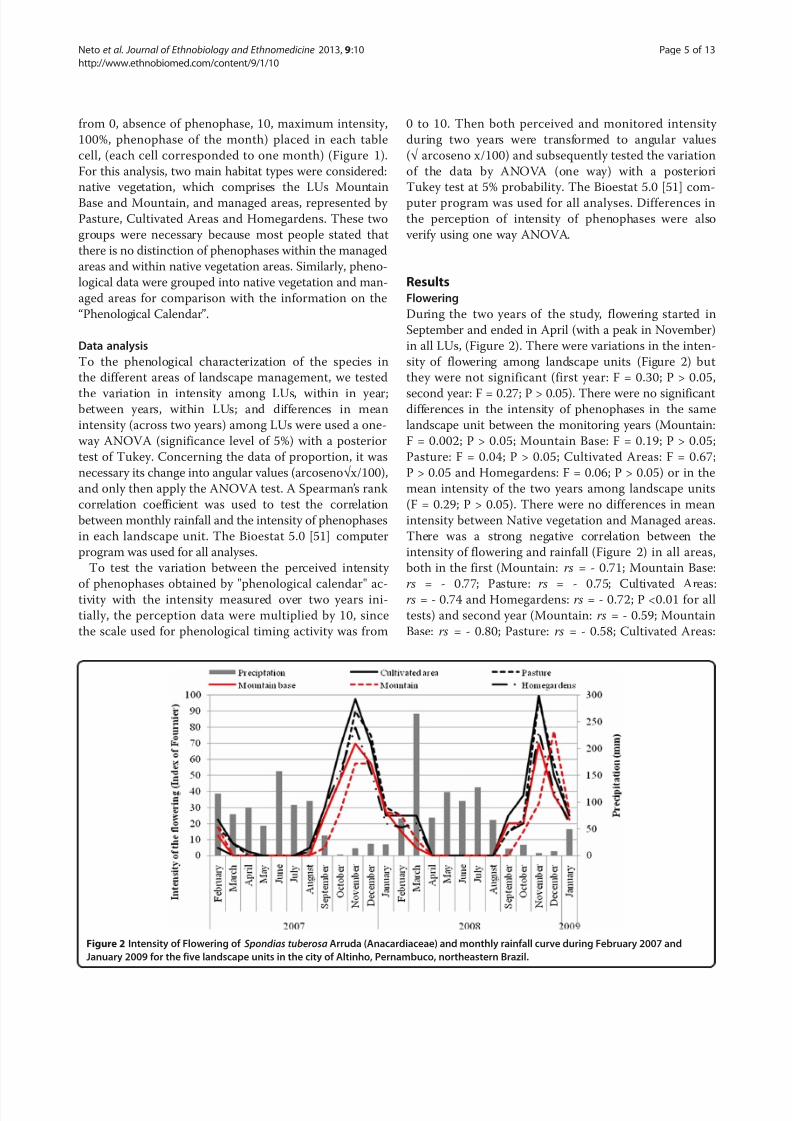
ResultsFlowering
During the two years of the study, flowering started in
September and ended in April (with a peak in November)
in all LUs, (Figure 2). There were variations in the inten-
sity of flowering among landscape units (Figure 2) but
they were not significant (first year: F = 0.30; P > 0.05,
second year: F = 0.27; P > 0.05). There were no significantdifferences in the intensity of phenophases in the same
landscape unit between the monitoring years (Mountain:
F = 0.002; P > 0.05; Mountain Base: F = 0.19; P > 0.05;
Pasture: F = 0.04; P > 0.05; Cultivated Areas: F = 0.67;
P > 0.05 and Homegardens: F = 0.06; P > 0.05) or in the
mean intensity of the two years among landscape units
(F = 0.29; P > 0.05). There were no differences in mean
intensity between Native vegetation and Managed areas.
There was a strong negative correlation between the
intensity of flowering and rainfall (Figure 2) in all areas,
both in the first (Mountain: rs = - 0.71; Mountain Base:
rs = - 0.77; Pasture: rs = - 0.75; Cultivated Areas:rs = - 0.74 and Homegardens: rs = - 0.72; P <0.01 for all
tests) and second year (Mountain: rs = - 0.59; Mountain
Base: rs = - 0.80; Pasture: rs = - 0.58; Cultivated Areas:
Figure 2 Intensity of Flowering of Spondias tuberosa Arruda (Anacardiaceae) and monthly rainfall curve during February 2007 and
January 2009 for the five landscape units in the city of Altinho, Pernambuco, northeastern Brazil.
Neto et al. Journal of Ethnobiology and Ethnomedicine 2013, 9:10 Page 5 of 13
http://www.ethnobiomed.com/content/9/1/10
Page 6
8/13/2019 Lins Neto et al 2013
http://slidepdf.com/reader/full/lins-neto-et-al-2013 6/13
rs = - 0.73 and Homegardens: rs = - 0.62, P <0.01 for all
tests).
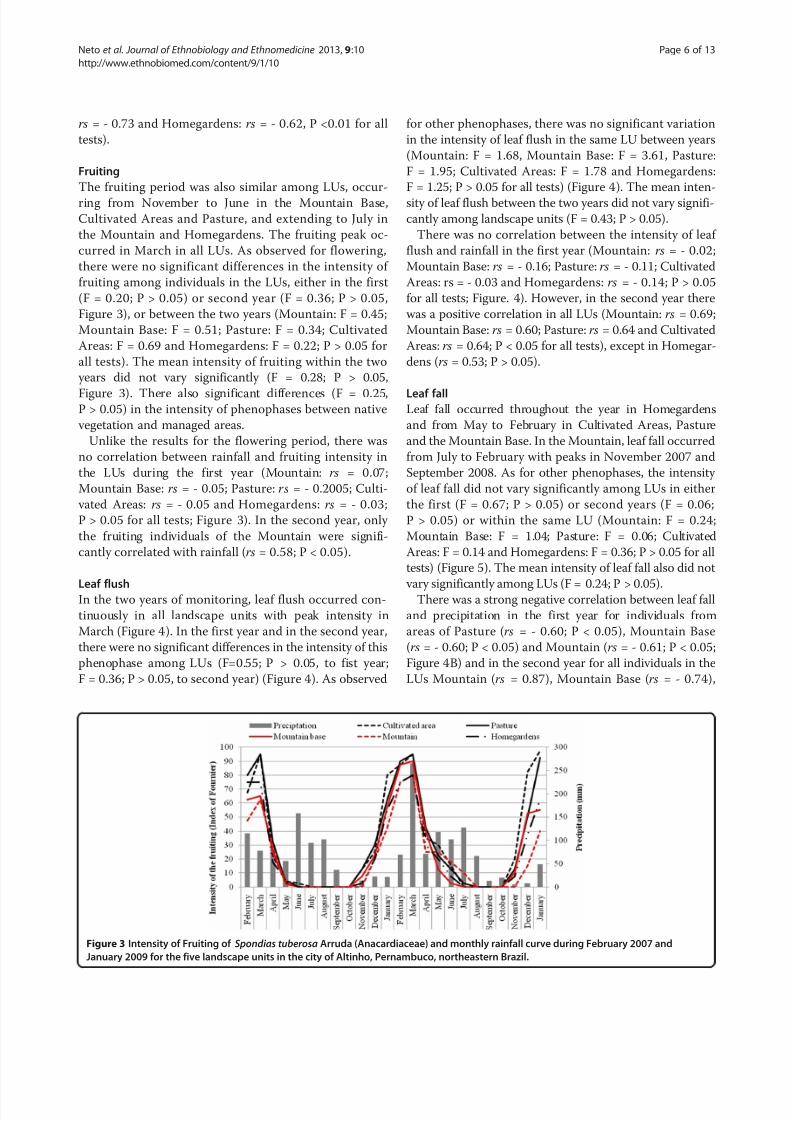
Fruiting
The fruiting period was also similar among LUs, occur-
ring from November to June in the Mountain Base,
Cultivated Areas and Pasture, and extending to July in
the Mountain and Homegardens. The fruiting peak oc-
curred in March in all LUs. As observed for flowering,
there were no significant differences in the intensity of
fruiting among individuals in the LUs, either in the first
(F = 0.20; P > 0.05) or second year (F = 0.36; P > 0.05,
Figure 3), or between the two years (Mountain: F = 0.45;
Mountain Base: F = 0.51; Pasture: F = 0.34; Cultivated
Areas: F = 0.69 and Homegardens: F = 0.22; P > 0.05 for
all tests). The mean intensity of fruiting within the two
years did not vary significantly (F = 0.28; P > 0.05,
Figure 3). There also significant differences (F = 0.25,P > 0.05) in the intensity of phenophases between native
vegetation and managed areas.
Unlike the results for the flowering period, there was
no correlation between rainfall and fruiting intensity in
the LUs during the first year (Mountain: rs = 0.07;
Mountain Base: rs = - 0.05; Pasture: rs = - 0.2005; Culti-
vated Areas: rs = - 0.05 and Homegardens: rs = - 0.03;
P > 0.05 for all tests; Figure 3). In the second year, only
the fruiting individuals of the Mountain were signifi-
cantly correlated with rainfall (rs = 0.58; P < 0.05).
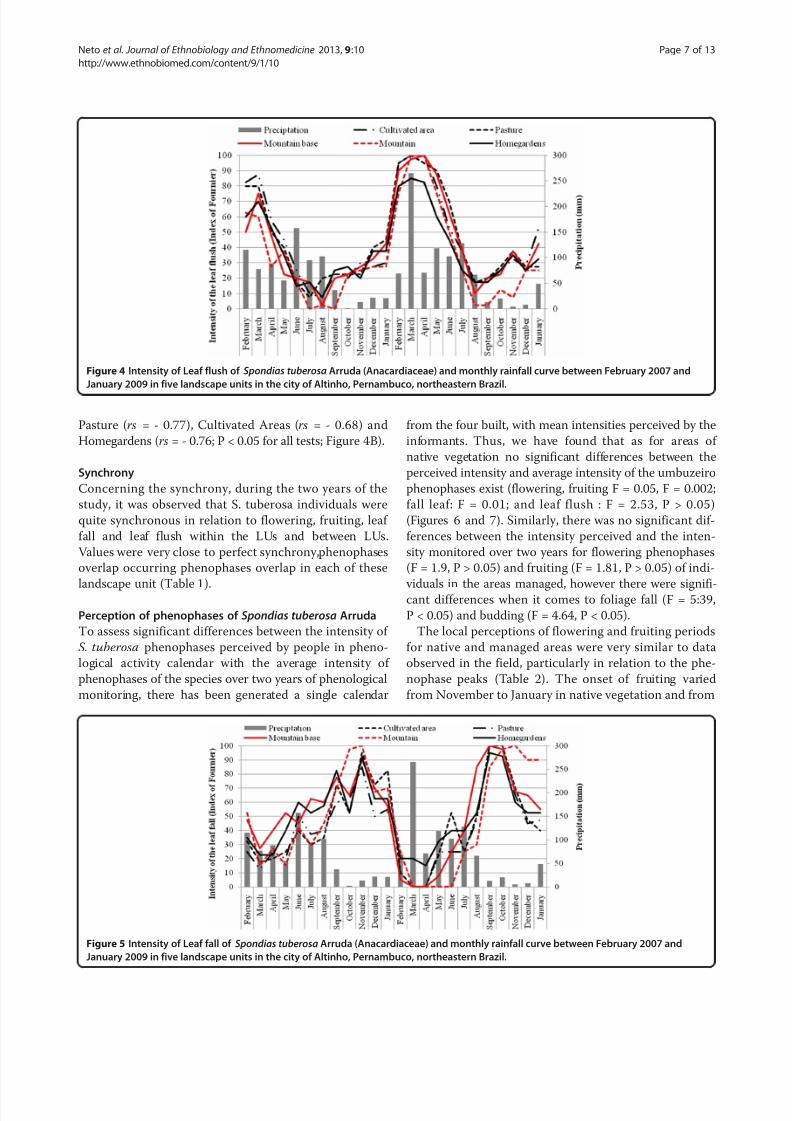
Leaf flushIn the two years of monitoring, leaf flush occurred con-
tinuously in all landscape units with peak intensity in
March (Figure 4). In the first year and in the second year,
there were no significant differences in the intensity of this
phenophase among LUs (F=0.55; P > 0.05, to fist year;
F = 0.36; P > 0.05, to second year) (Figure 4). As observed
for other phenophases, there was no significant variation
in the intensity of leaf flush in the same LU between years
(Mountain: F = 1.68, Mountain Base: F = 3.61, Pasture:
F = 1.95; Cultivated Areas: F = 1.78 and Homegardens:
F = 1.25; P > 0.05 for all tests) (Figure 4). The mean inten-
sity of leaf flush between the two years did not vary signifi-
cantly among landscape units (F = 0.43; P > 0.05).
There was no correlation between the intensity of leaf
flush and rainfall in the first year (Mountain: rs = - 0.02;
Mountain Base: rs = - 0.16; Pasture: rs = - 0.11; Cultivated
Areas: rs = - 0.03 and Homegardens: rs = - 0.14; P > 0.05
for all tests; Figure. 4). However, in the second year there
was a positive correlation in all LUs (Mountain: rs = 0.69;
Mountain Base: rs = 0.60; Pasture: rs = 0.64 and Cultivated
Areas: rs = 0.64; P < 0.05 for all tests), except in Homegar-
dens (rs = 0.53; P > 0.05).
Leaf fallLeaf fall occurred throughout the year in Homegardens
and from May to February in Cultivated Areas, Pasture
and the Mountain Base. In the Mountain, leaf fall occurred
from July to February with peaks in November 2007 and
September 2008. As for other phenophases, the intensity
of leaf fall did not vary significantly among LUs in either
the first (F = 0.67; P > 0.05) or second years (F = 0.06;
P > 0.05) or within the same LU (Mountain: F = 0.24;
Mountain Base: F = 1.04; Pasture: F = 0.06; Cultivated
Areas: F = 0.14 and Homegardens: F = 0.36; P > 0.05 for all
tests) (Figure 5). The mean intensity of leaf fall also did not
vary significantly among LUs (F = 0.24; P > 0.05).There was a strong negative correlation between leaf fall
and precipitation in the first year for individuals from
areas of Pasture (rs = - 0.60; P < 0.05), Mountain Base
(rs = - 0.60; P < 0.05) and Mountain (rs = - 0.61; P < 0.05;
Figure 4B) and in the second year for all individuals in the
LUs Mountain (rs = 0.87), Mountain Base (rs = - 0.74),
Figure 3 Intensity of Fruiting of Spondias tuberosa Arruda (Anacardiaceae) and monthly rainfall curve during February 2007 and
January 2009 for the five landscape units in the city of Altinho, Pernambuco, northeastern Brazil.
Neto et al. Journal of Ethnobiology and Ethnomedicine 2013, 9:10 Page 6 of 13
http://www.ethnobiomed.com/content/9/1/10
Page 7
8/13/2019 Lins Neto et al 2013
http://slidepdf.com/reader/full/lins-neto-et-al-2013 7/13
Pasture (rs = - 0.77), Cultivated Areas (rs = - 0.68) and
Homegardens (rs = - 0.76; P < 0.05 for all tests; Figure 4B).
Synchrony
Concerning the synchrony, during the two years of the
study, it was observed that S. tuberosa individuals were
quite synchronous in relation to flowering, fruiting, leaf
fall and leaf flush within the LUs and between LUs.
Values were very close to perfect synchrony,phenophases
overlap occurring phenophases overlap in each of these
landscape unit (Table 1).
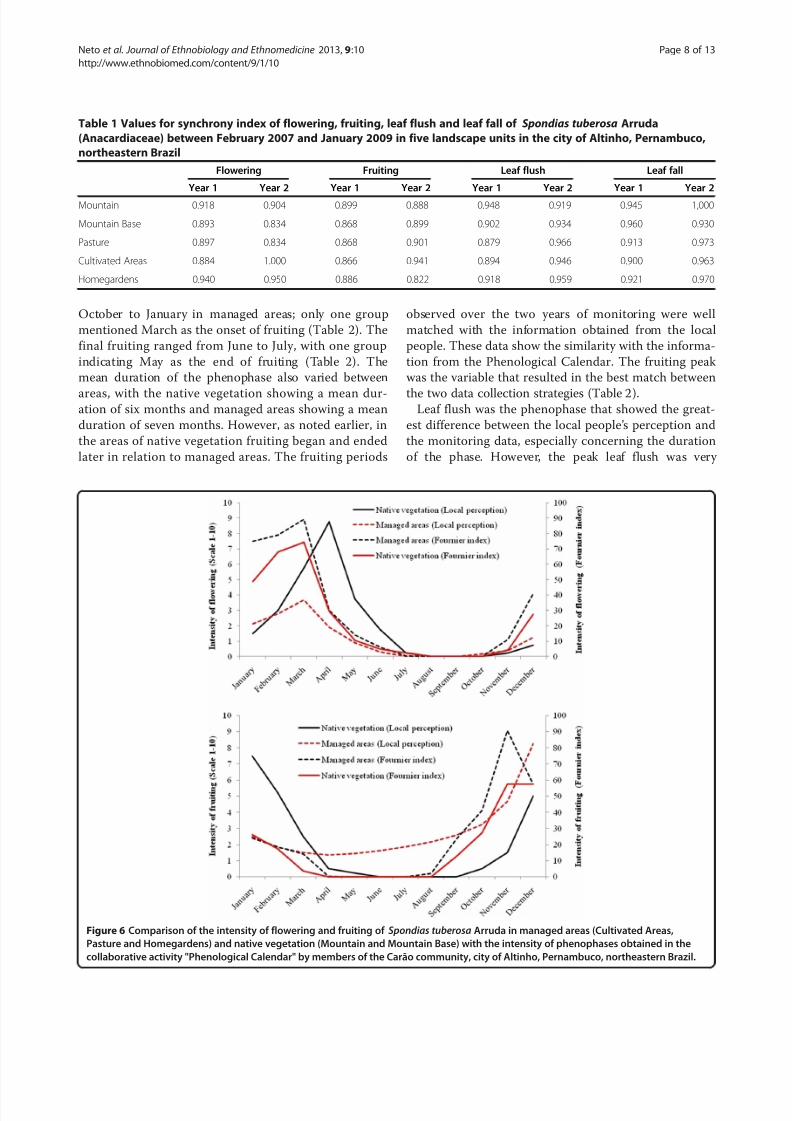
Perception of phenophases of Spondias tuberosa Arruda
To assess significant differences between the intensity of
S. tuberosa phenophases perceived by people in pheno-
logical activity calendar with the average intensity of
phenophases of the species over two years of phenological
monitoring, there has been generated a single calendar
from the four built, with mean intensities perceived by the
informants. Thus, we have found that as for areas of
native vegetation no significant differences between the
perceived intensity and average intensity of the umbuzeiro
phenophases exist (flowering, fruiting F = 0.05, F = 0.002;
fall leaf: F = 0.01; and leaf flush : F = 2.53, P > 0.05)
(Figures 6 and 7). Similarly, there was no significant dif-
ferences between the intensity perceived and the inten-
sity monitored over two years for flowering phenophases
(F = 1.9, P > 0.05) and fruiting (F = 1.81, P > 0.05) of indi-
viduals in the areas managed, however there were signifi-cant differences when it comes to foliage fall (F = 5:39,
P < 0.05) and budding (F = 4.64, P < 0.05).
The local perceptions of flowering and fruiting periods
for native and managed areas were very similar to data
observed in the field, particularly in relation to the phe-
nophase peaks (Table 2). The onset of fruiting varied
from November to January in native vegetation and from
Figure 4 Intensity of Leaf flush of Spondias tuberosa Arruda (Anacardiaceae) and monthly rainfall curve between February 2007 and
January 2009 in five landscape units in the city of Altinho, Pernambuco, northeastern Brazil.
Figure 5 Intensity of Leaf fall of Spondias tuberosa Arruda (Anacardiaceae) and monthly rainfall curve between February 2007 and
January 2009 in five landscape units in the city of Altinho, Pernambuco, northeastern Brazil.
Neto et al. Journal of Ethnobiology and Ethnomedicine 2013, 9:10 Page 7 of 13
http://www.ethnobiomed.com/content/9/1/10
Page 8
8/13/2019 Lins Neto et al 2013
http://slidepdf.com/reader/full/lins-neto-et-al-2013 8/13
October to January in managed areas; only one group
mentioned March as the onset of fruiting (Table 2). The
final fruiting ranged from June to July, with one group
indicating May as the end of fruiting (Table 2). The
mean duration of the phenophase also varied between
areas, with the native vegetation showing a mean dur-ation of six months and managed areas showing a mean
duration of seven months. However, as noted earlier, in
the areas of native vegetation fruiting began and ended
later in relation to managed areas. The fruiting periods
observed over the two years of monitoring were well
matched with the information obtained from the local
people. These data show the similarity with the informa-
tion from the Phenological Calendar. The fruiting peak
was the variable that resulted in the best match between
the two data collection strategies (Table 2).Leaf flush was the phenophase that showed the great-
est difference between the local people’s perception and
the monitoring data, especially concerning the duration
of the phase. However, the peak leaf flush was very
Table 1 Values for synchrony index of flowering, fruiting, leaf flush and leaf fall of Spondias tuberosa Arruda
(Anacardiaceae) between February 2007 and January 2009 in five landscape units in the city of Altinho, Pernambuco,
northeastern Brazil
Flowering Fruiting Leaf flush Leaf fall
Year 1 Year 2 Year 1 Year 2 Year 1 Year 2 Year 1 Year 2
Mountain 0.918 0.904 0.899 0.888 0.948 0.919 0.945 1,000
Mountain Base 0.893 0.834 0.868 0.899 0.902 0.934 0.960 0.930
Pasture 0.897 0.834 0.868 0.901 0.879 0.966 0.913 0.973
Cultivated Areas 0.884 1.000 0.866 0.941 0.894 0.946 0.900 0.963
Homegardens 0.940 0.950 0.886 0.822 0.918 0.959 0.921 0.970
Figure 6 Comparison of the intensity of flowering and fruiting of Spondias tuberosa Arruda in managed areas (Cultivated Areas,
Pasture and Homegardens) and native vegetation (Mountain and Mountain Base) with the intensity of phenophases obtained in the
collaborative activity "Phenological Calendar" by members of the Carão community, city of Altinho, Pernambuco, northeastern Brazil.
Neto et al. Journal of Ethnobiology and Ethnomedicine 2013, 9:10 Page 8 of 13
http://www.ethnobiomed.com/content/9/1/10
Page 9
8/13/2019 Lins Neto et al 2013
http://slidepdf.com/reader/full/lins-neto-et-al-2013 9/13
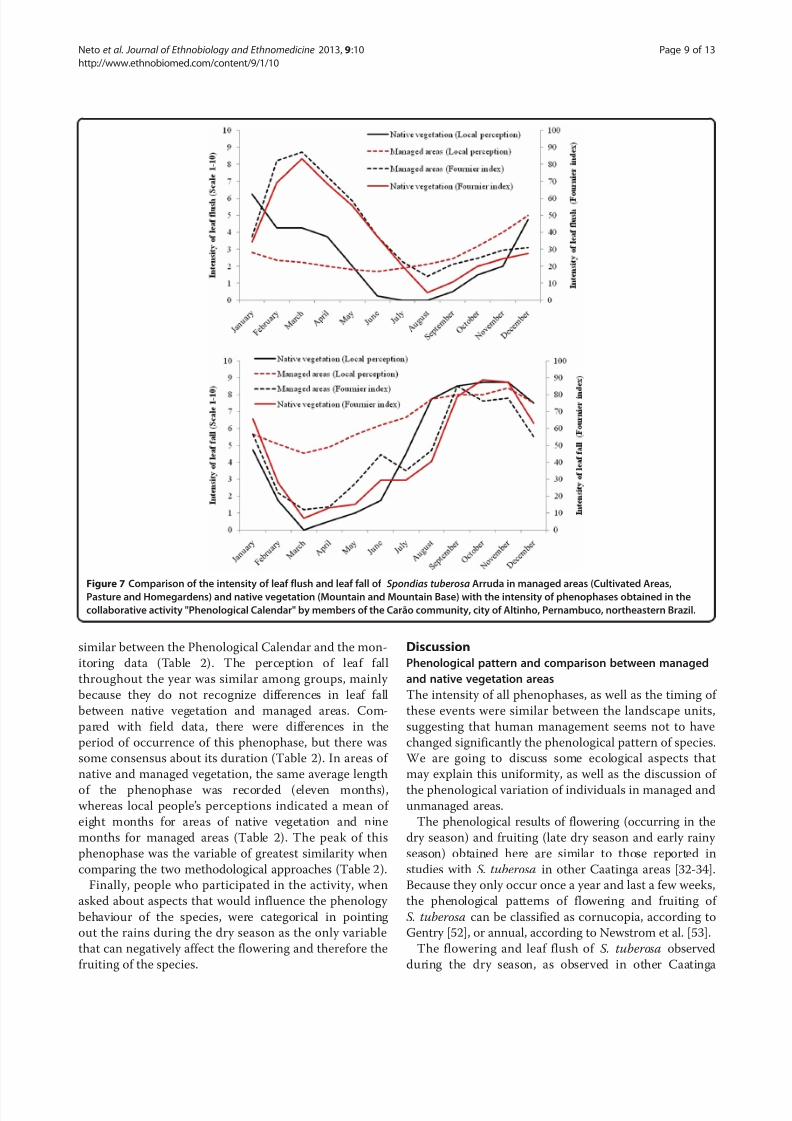
similar between the Phenological Calendar and the mon-
itoring data (Table 2). The perception of leaf fall
throughout the year was similar among groups, mainly
because they do not recognize differences in leaf fall
between native vegetation and managed areas. Com-
pared with field data, there were differences in the
period of occurrence of this phenophase, but there was
some consensus about its duration (Table 2). In areas of
native and managed vegetation, the same average length
of the phenophase was recorded (eleven months),whereas local people’s perceptions indicated a mean of
eight months for areas of native vegetation and nine
months for managed areas (Table 2). The peak of this
phenophase was the variable of greatest similarity when
comparing the two methodological approaches (Table 2).
Finally, people who participated in the activity, when
asked about aspects that would influence the phenology
behaviour of the species, were categorical in pointing
out the rains during the dry season as the only variable
that can negatively affect the flowering and therefore the
fruiting of the species.
DiscussionPhenological pattern and comparison between managed
and native vegetation areas
The intensity of all phenophases, as well as the timing of
these events were similar between the landscape units,
suggesting that human management seems not to have
changed significantly the phenological pattern of species.
We are going to discuss some ecological aspects that
may explain this uniformity, as well as the discussion of
the phenological variation of individuals in managed andunmanaged areas.
The phenological results of flowering (occurring in the
dry season) and fruiting (late dry season and early rainy
season) obtained here are similar to those reported in
studies with S. tuberosa in other Caatinga areas [32-34].
Because they only occur once a year and last a few weeks,
the phenological patterns of flowering and fruiting of
S. tuberosa can be classified as cornucopia, according to
Gentry [52], or annual, according to Newstrom et al. [53].
The flowering and leaf flush of S. tuberosa observed
during the dry season, as observed in other Caatinga
Figure 7 Comparison of the intensity of leaf flush and leaf fall of Spondias tuberosa
Arruda in managed areas (Cultivated Areas,Pasture and Homegardens) and native vegetation (Mountain and Mountain Base) with the intensity of phenophases obtained in the
collaborative activity "Phenological Calendar" by members of the Carão community, city of Altinho, Pernambuco, northeastern Brazil.
Neto et al. Journal of Ethnobiology and Ethnomedicine 2013, 9:10 Page 9 of 13
http://www.ethnobiomed.com/content/9/1/10
Page 10
8/13/2019 Lins Neto et al 2013
http://slidepdf.com/reader/full/lins-neto-et-al-2013 10/13
plants [14,54,55] can be explained by the presence of
organs that can accumulate water (such as roots) [56]
and by the stem, which has a low wood density [18].
The phenology of plants that accumulate water does not
depend on rainfall [57,58], even in ecosystems such as
arid environments where rainfall strongly influences the
phenology [14,18,54,59]. It is believed that some species
of tropical dry forest plants flourish in the dry season
because the wet season is used for vegetative growth
[60,61]. Moreover, the typical loss of leaves during the
dry season favors flower visibility for pollinators [60].
Although flowering and fruiting may vary within and
among populations [62], individuals of the same speciesthat occupy adjacent regions tend to have similar pheno-
logical events during similar periods due to phylogenetic
constraints [39]. This explains the similarity in syn-
chronization and intensity of phenological events of
S. tuberosa among the LUs. The similarity in phenological
patterns observed among areas under different manage-
ment regimes has been reported by Oaxaca-Villa et al.
[43] in wild and managed populations of Escontria chio-
tilla (Cactaceae) in a semi-arid region of Mexico. How-
ever, other studies emphasize that in managed areas the
intensity of fruit is higher when compared to unmanaged
areas [23,24,27]. Individuals of cultivated populations of
Stenocereus stellatus, species in an advanced state of do-
mestication, have presented an increased number of flowers
in anthesis if compared to individuals of wilderness areas
[24]. Barreto et al. [32], while studying populations of
Spondias tuberosa recorded more flowers and less fruits in
natural areas in relation to managed areas. They attributed
these differences to the fact that there is major pollina-
tor activity (and therefore less competition for pollinators
among individual plants) in managed areas, resulting in
higher chances of fruit formation. Another study conducted
with populations of S. tuberosa has also found that indivi-
duals located in corn fields, areas under intensive soil man-agement, produced significantly more inflorescences if
compared to other landscape units studied [9]. However,
these authors found that there is no significant difference in
the fruit production of the species if considered the land-
scape units studied, in addition to that, despite the intense
flowering, reproductive success was limited to only one
fruit per inflorescence in most individuals. The authors
conclude that the possible explanation is the sharing of pol-
linators with individuals of other species that flower during
the same period, such as Myracrodruon urundeuva Fr All
(Anacardiaceae), Prosopis juliflora (Sw.) DC. and Mimosa
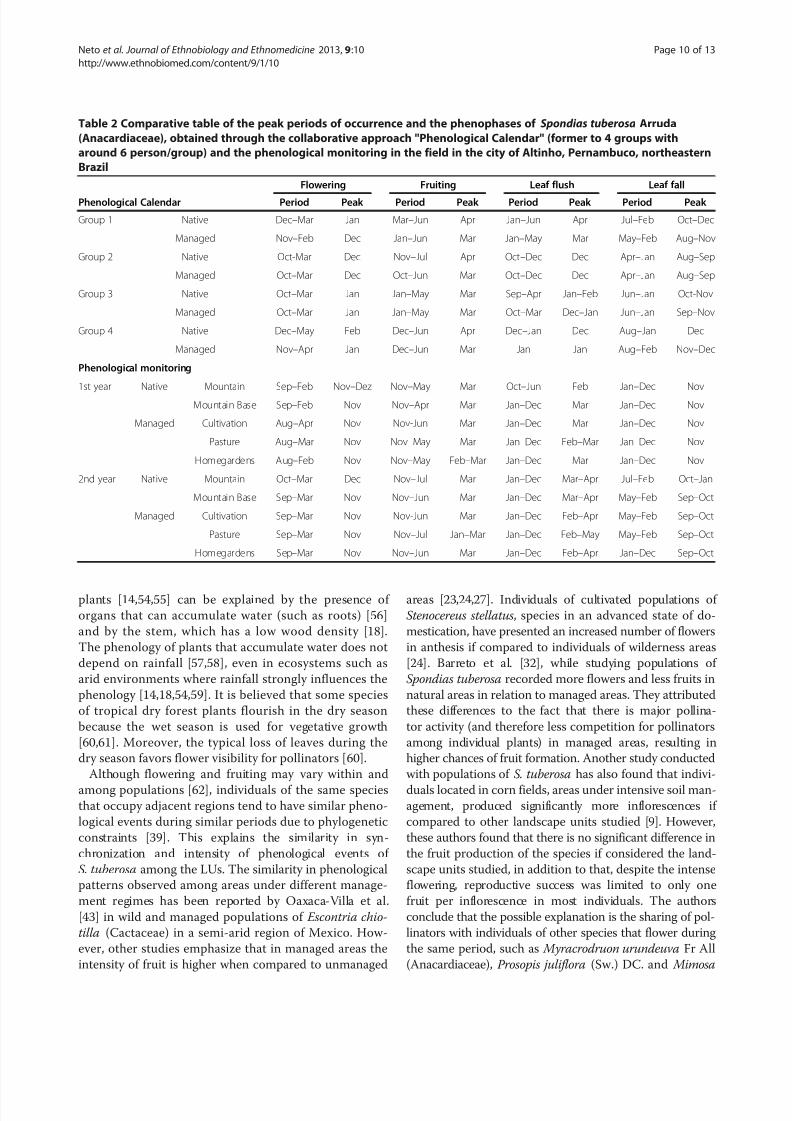
Table 2 Comparative table of the peak periods of occurrence and the phenophases of Spondias tuberosa Arruda
(Anacardiaceae), obtained through the collaborative approach "Phenological Calendar" (former to 4 groups with
around 6 person/group) and the phenological monitoring in the field in the city of Altinho, Pernambuco, northeastern
Brazil
Flowering Fruiting Leaf flush Leaf fall
Phenological Calendar Period Peak Period Peak Period Peak Period Peak
Group 1 Native Dec–Mar Jan Mar–Jun Apr Jan–Jun Apr Jul–Feb Oct–Dec
Managed Nov–Feb Dec Jan–Jun Mar Jan–May Mar May–Feb Aug–Nov
Group 2 Native Oct-Mar Dec Nov–Jul Apr Oct–Dec Dec Apr–Jan Aug–Sep
Managed Oct–Mar Dec Oct–Jun Mar Oct–Dec Dec Apr–Jan Aug–Sep
Group 3 Native Oct–Mar Jan Jan–May Mar Sep–Apr Jan–Feb Jun–Jan Oct-Nov
Managed Oct–Mar Jan Jan–May Mar Oct–Mar Dec–Jan Jun–Jan Sep–Nov
Group 4 Native Dec–May Feb Dec–Jun Apr Dec–Jan Dec Aug–Jan Dec
Managed Nov–Apr Jan Dec–Jun Mar Jan Jan Aug–Feb Nov–Dec
Phenological monitoring
1st year Native Mountain Sep–Feb Nov–Dez Nov–May Mar Oct–Jun Feb Jan–Dec Nov
Mountain Base Sep–Feb Nov Nov–Apr Mar Jan–Dec Mar Jan–Dec Nov
Managed Cultivation Aug–Apr Nov Nov-Jun Mar Jan–Dec Mar Jan–Dec Nov
Pasture Aug–Mar Nov Nov–May Mar Jan–Dec Feb–Mar Jan–Dec Nov
Homegardens Aug–Feb Nov Nov–May Feb–Mar Jan–Dec Mar Jan–Dec Nov
2nd year Native Mountain Oct–Mar Dec Nov–Jul Mar Jan–Dec Mar–Apr Jul–Feb Oct–Jan
Mountain Base Sep–Mar Nov Nov–Jun Mar Jan–Dec Mar–Apr May–Feb Sep–Oct
Managed Cultivation Sep–Mar Nov Nov-Jun Mar Jan–Dec Feb–Apr May–Feb Sep–Oct
Pasture Sep–Mar Nov Nov–Jul Jan–Mar Jan–Dec Feb–May May–Feb Sep–Oct
Homegardens Sep–Mar Nov Nov–Jun Mar Jan–Dec Feb–Apr Jan–Dec Sep–Oct
Neto et al. Journal of Ethnobiology and Ethnomedicine 2013, 9:10 Page 10 of 13
http://www.ethnobiomed.com/content/9/1/10
Page 11
8/13/2019 Lins Neto et al 2013
http://slidepdf.com/reader/full/lins-neto-et-al-2013 11/13
tenuiflora Bent. (Fabaceae - Mimosoideae), making the re-
productive success so low. Accordingly, the present results,
at first sight, suggest that populations of S. tuberosa are not
reflecting in their phenological behavior, mainly, in flower-
ing and fruiting, the changes related to environmental
changes, however, when considering the findings of
Almeida et al. [9], seems to be clear that ecological interac-
tions maintained by the species indicate a new structure for
communities, suggesting an indirect effect of the domesti-
cation of landscapes.
As for phenophases overlap, the strong synchrony among
individuals of S. tuberosa within and among the LUs sup-
ports the idea that in dry tropical forests there is a high sea-
sonal synchrony in phenological patterns [57]. Phenological
patterns possibly result from selective pressure exerted
either by abiotic factors (such as intensity and duration of
the dry season) [63,64] or by biotic factors (including inter-
actions with animals such as herbivores, pollinators andseed dispersers) [65,66]. Thus, the synchrony observed here
is especially important for flowering, since it favors gene
flow among individuals and thus contributes to the main-
tenance of genetic variability in populations [19]. A study
conducted in isolated populations of Spondias mombin in
Panama also recorded a high synchrony in flowering and
fruiting [11]; this synchrony may therefore be a characteris-
tic of the genus.
These observations allow us to conclude that beyond
the truism that species respond differently to the effects of
handling, due to genetic and environmental heterogeneity
[41], the strong synchrony observed between individualslocated in different management areas indicate that timing
mechanisms as for reproductive isolation have not occu-
rred [24]. Probably this explains what we have observed in
this study. This finding reinforces that an interspecific
sharing of pollinators is the most likely explanation for
the low reproductive success observed in populations of
S. tuberosa under different soil management ways [9]. On
the other hand, populations of Polaskia chichipe has its
flowering peak ranging among wild populations, cultivated
and managed ones, and being later in the latter [23]. This
observed pattern provides reproductive isolation of popu-
lations, since individuals within populations are visited by
pollinators at different times of individuals from otherpopulations [23].
Phenological calendar versus phenological monitoring
The similarity between phenological patterns recorded
in the field and those obtained from the Phenological
Calendar (especially in relation to flowering and fruiting)
reveal how traditional knowledge may be useful for
understanding biological phenomena. The greatest si-
milarity in relation to reproductive phenology may be
explained by the fact that S. tuberosa occupies a pro-
minent place in the local community, with well-known
characteristics and food uses (of fruits) [38]. Moreover,
the species provides shade for animals during the dry
season in the Caatinga by maintaining its leaves, which
reinforces the importance of S. tuberosa for the local
population [38]. Nevertheless, the leaf flush phase had
the lowest similarity with the phenological monitoring
data.
In the Yucatán peninsula, a study conducted with
Spondias pupurea also found that people are familiar
with the phenophases of this kind, highlighting the flow-
ering and fruiting, showing the existence of a clear rela-
tionship between the local classification of fruit types
with the phenology of Spondias pupurea [28]. For
example, people recognize and classify S. purpurea in
three main classes, which are consistent with the period
of the year in which the fetching of the fruit is done.
However, this study advances if related to the latter
establishing a direct comparison of the perception of activity and intensity of S. tuberosa phenophases with
concrete data as for the species phenology monitoring.
Thus, the phenological calendar proposed here reveals
itself as an innovative and efficient concerning the access
to knowledge on biological phenomena.
Another interesting aspect reported by Ruenes-Morales
et al. [28] is the influence of rain on the productivity of
S. purpurea individuals. According to the authors, infor-
mants reported that when the rains come during the dry
season they affect the annual harvest, reducing fruit pro-
duction. This perception was also evidenced by Carão
people, who have also pointed the rain as the environmen-tal variable that would affect the production of umbuzeiro
individuals.
The aspects presented above, together with the studies
conducted by Lins Neto et al. [38] and Lins Neto et al.
[45] reinforce the prominence of S. tuberosa in Carão
community, highlighting the close relationship people
have with this plant. This way, our study provides strong
evidences that the popular knowledge accumulated over
generations is an excellent tool for rapid diagnosis of the
phenology of a plant species. Phenological studies re-
quire long periods of observation to generate robust data
and to increase predictive power [29,53,67,68]. However,
when decisions must be made quickly and long-termstudies are infeasible, the use of traditional knowledge
may facilitate appropriate and immediate conservation
strategies.
Studies carried out in different part of the world, be
concluded phenological studies satisfactory indicators of
environmental changes, especially changes in ecosystem
processes [69-72]. Thus, the perception of variations and
reflections of these phenological changes within a global
perspective reveals itself as importatnt tool for rapid
diagnosis environment, assisting in the construction and
development of strategies for the conservation of natural
Neto et al. Journal of Ethnobiology and Ethnomedicine 2013, 9:10 Page 11 of 13
http://www.ethnobiomed.com/content/9/1/10
Page 12
8/13/2019 Lins Neto et al 2013
http://slidepdf.com/reader/full/lins-neto-et-al-2013 12/13
resources. However, it should be noted that the Phe-
nological Calendar does not replace conventional phe-
nological analysis, but complements it, especially for
constructing future projections. This is because local
people have knowledge of climate cycles that are not
always detected in short term phenological studies, as
they may occur at time intervals that do not coincide
with the research period. Most importantly, more studies
need to be developed in order to confirm the usefulness
of traditional knowledge in the inference of plant phe-
nology, especially reproductive phenophases, for other
species and other ecosystems. Therefore, other systems
and other approaches must be considered for strengthen
the proposal that traditional knowledge is strong enough
for diagnoses of phenology as confident indicator for seve-
ral purposes such as climate change and conservation.
Competing interests The authors declare that they have no competing interests.
Authors’ contributions
All authors contributed with writing of the manuscript. All authors read and
approved the final manuscript.
Acknowledgements
The authors thank Mr. Miguel de Andrade Jr., Secretary of Agriculture and
Supply, City Hall of Altinho, for logistical support; Prof. Dr. Luis Fernando
Alberti/UNESP-Rio Claro for his help with the phenological analysis; FACEPE
for the doctoral scholarship given to the first author, as well as financial
support of the project "Conhecimento tradicional e variabilidade morfológica
e genética em populações de Spondias tuberosa Arruda (Anacardiaceae) no
semi-árido Nordestino." (FACEPE-APQ-1162-2.03/08); Conselho Nacional de
Desenvolvimento Científico e Tecnológico (www.cnpq.br) for financial
support and a research productivity scholarship given to U.P. Albuquerque;all members of the Laboratory of Applied Ethnobotany/UFRPE for their
contribution in all the analysis and the Carão community for the openness
and generosity in sharing their knowledge with us.
Author details1Biology Department, Universidade Federal do Piauí, Campus Professora
Cinobelina Elvas, BR 135, km 3, Planalto Horizonte, Piauí, Brazil. 2Laboratório
de Etnobotânica Aplicada, Universidade Federal Rural de Pernambuco
(UFRPE), Recife, Brazil. 3Department of Ecology and Zoology, Universidade
Federal de Santa Catarina, Florianópolis, Brazil. 4Department of Biology,
Universidade Federal Rural de Pernambuco, Recife, Brazil.
Received: 11 July 2012 Accepted: 19 January 2013
Published: 31 January 2013
References1. Cunningham SA: Effects of habitat fragmentation on the reproductive
ecology of four plant species in Mallec Woodland. Conserv Biol 2000,
14:758–768.
2. Fuchs EJ, Lobo JA, Quesada M: Effects of Forest Fragmentation and
Flowering Phenology on the Reproductive Success and Mating Patterns
of the Tropical Dry Forest Tree Pachira quinata. Conserv Biol 2003,
17:149–157.
3. Aizen MA, Feinsinger P: Forest fragmentation, pollination, and plant
reproduction in a Chaco Dry Forest, Argentina. Ecology 1994, 75:330–351.
4. Aizen MA, Feinsinger P: Habitat fragmentation, native insect pollinators,
and feral honey bees in Argentine "Chaco Serrano". Ecol Appl 1994,
4:378–392.
5. Tabarelli M, Cardoso JMC, Gascon C: Forest fragmentation, synergisms and
the impoverishment of neotropical Forest. Biodivers Conserv 2004,
13:1419–1425.
6. Laurance WF, Merona JMR, Andrade A, Laurance SG, D'Angelo S, Lovejoy TE,
Vasconcelos HL: Rain-forest fragmentation and the phenology of
Amazonian tree communities. J Trop Ecol 2003, 19:343–347.
7. Ferraz DK, Artes R, Mantovani W, Magalhães LM: Fenologia de árvores em
fragmento de mata em São Paulo. Rev Bras Biol 1999, 59:305–317.
8. Freitas L, Bolmgren K: Synchrony is more than overlap: measuring
phonological synchronization considering time length and intensity.Revista Brasileira de Botânica 2008, 31:721–724.
9. Almeida ALS, Albuquerque UP, Castro CC: Reproductive biology of
Spondias tuberosa Arruda (Anacardiaceae), an endemic fructiferous
species of the caatinga (dry forest), under different management
conditions in northeastern Brazil. J Arid Environ 2010, 75(4):330–337.
10. Restrepo C, Gomez N, Heredia S: Anthropogenic edges, treefall gaps,
and fruit-frugivore interactions in a neotropical montane forest.
Ecology 1999, 80:668–685.
11. Adler GH, Kiepinski KA: Reproductive phenology of a tropical canopy tree,
Spondias mombin. Biotropica 2000, 32:686–692.
12. Cara PAA: Efeito de borda sobre a fenologia, as síndromes de polinização e a
dispersão de sementes de uma comunidade arbórea na floresta Atlântica ao
norte do rio São Francisco. Recife, Brazil: PhD thesis. Universidade Federal de
Pernambuco, Biology Department; 2006.
13. Corlett RT, Lafrankie JV: Potential impacts of climate change on tropical
Asian forest through an influence on phenology. Climatical Change 1998,39:439–453.
14. Machado ICS, Barros LM, Sampaio E: Phenology of caatinga species at
Serra Talhada, PE, Northeastern Brazil. Biotropica 1997, 29:57–68.
15. Valdez-Hernández M, Andrade JL, Jackson PC, Rebolledo-Vieyra M:Phenology of five tree species of a tropical dry forest in Yucatan,
Mexico: effects of environmental and physiological factors. Plant Soil
2010, 329:155–171.
16. Borchert R: Soil and stem water storage determine phenology and
distribution of tropical dry forest trees. Ecology 1994, 75:1437–1449.
17. Borchert R, Rivera G, Hagnauer W: Modification of vegetative phenology
in a tropical semi-deciduous forest by abnormal drought and rain.
Biotropica 2002, 34:27–39.
18. Lima ALA, Rodal MJM: Phenology and wood density of plants growing in
the semi-arid region of northeastern Brazil. J Environ 2010, 74:1363–1373.
19. Wright SJ, Calderon O: Phylogenetic patterns of flowering phenology.
J Ecol 1995, 83:937–948.
20. Aldrich PR, Hamrick JL: Reproductive dominance of pasture trees in afragmented tropical forest mosaic. Science 1998, 281:103–105.
21. Lovejoy TE, Bierregaard RO Jr, Rylands AB, Malcolm JR, Quintela CE, Harper
LH, Brown KS Jr, Powell AW, Powell GVN, Schubart HOR, Hays MB: Edge
and other tropical lowland rain forest trees. II. Pollination systems.
Am J Bot 1986, 72:345–356.
22. Sizer N, Tanner EVJ: Responses of woody plant seedlings to edge
formation in a lowland tropical rainforest, Amazonia. Biology Conservation1999, 91:135–142.
23. Otero-Arnaiz A, Casas A, Bartolo C, Pérez-Negrón E, Valiente-Banuet A: Evolution
of Polaskia chichipe (Cactaceae) under domestication in the Tehuacán valley,
central Mexico: reproductive biology. Am J Bot 2003, 90:593–602.
24. Casas A, Valiente-Banuet A, Rojas-Martínez A, Dávila P: Reproductive
biology and the process of domestication of the columnar cactus
Stenocereus stellatus in Central México. Am J Bot 1999, 86:534–542.
25. Gonzáles-Insuasti MS, Martorell C, Caballero J: Factors that influence the
intensity of non-agricultural management of plant resources. Agroforest Systems 2008, 74:1–15.
26. Guillén S, Terrazas T, De la Barrera E, Casas A: Germination differentiation
patterns of wild and domesticated columnar cacti in a gradient of
artificial selection intensity. Genet Resour Crop Evol 2011, 58(3):409–423.
27. Ortíz F, Stoner KE, Pérez-Negrón E, Casas A: Pollination biology of
Myrtillocactus schenckii (Cactaceae) in wild and managed populations of
the Tehuacán Valley, México. J Arid Environ 2010, 74:897–904.
28. Ruenes-Morales MR, Casas A, Jimenéz-Osornio JJ, Caballero J: Etnobotánica
de Spondias purpurea L. (Anacardiaceae) en la península de Yucatán.
Interciencia 2010, 35:247–254.
29. Pinto AM, Morellato LPC, Barbosa AP: Fenologia reprodutiva de Dipteryx
odorata (Aubl.) Willd (Fabaceae) em duas áreas de floresta na Amazônia
Central. Acta Amazônica 2006, 38:643–650.
30. Santos CAF: Dispersão da variabilidade fenotípica do umbuzeiro no
semi-árido brasileiro. Pesquisa Agropecuaria Brasilica 1997, 32:923–930.
Neto et al. Journal of Ethnobiology and Ethnomedicine 2013, 9:10 Page 12 of 13
http://www.ethnobiomed.com/content/9/1/10
Page 13
8/13/2019 Lins Neto et al 2013
http://slidepdf.com/reader/full/lins-neto-et-al-2013 13/13
31. Andrade-Lima D: The caatingas dominium. Revista Brasileira de Botânica
1981, 4:149–153.
32. Barreto LS, Leal SM, Anjos JC, Castro MS: Tipos polínicos dos visitantes
florais do umbuzeiro (Spondias tuberosa, Anacardiaceae), no Território
Indígena Pankararé, Raso da Catarina, Bahia, Brasil. Revista Virtual Candombá 2006, 2:80–85.
33. Nadia TL, Machado IC, Lopes AV: Partilha de polinizadores e sucessoreprodutivo de Spondias tuberosa e Ziziphus joazeiro, espécies
endêmicas da caatinga. Revista Brasileira de Biociências 2007, 5:357–359.
34. Griz LMS, Machado ICS: Fruiting phenology and seed dispersal syndromes
in caatinga, a tropical dry forest in the northeast of Brazil. J Trop Ecol
2001, 17:303–321.
35. Cavalcanti NB, Resende GM, Brito, Lima JB: Extrativismo do imbuzeiro(Spondias tuberosa Arruda) como fonte alternativa de renda para
pequenos produtores no semi-árido nordestino: um estudo de caso.
Ciência Agrotécnica 1996, 20:529–533.
36. Cavalcanti NB, Lima JB, Resende GM, Brito LTL: Ciclo reprodutivo do
umbuzeiro (Spondias tuberosa Arruda) no semiárido do Nordeste
brasileiro. Revista Ceres 2000, 47:421–439.
37. Cavalcanti NB, Resende GM, Brito LTL: Processamento do fruto do
imbuzeiro (Spondias tuberosa Arruda). Ciência Agrotécnica 2000,
24:252–259.
38. Lins Neto EMF, Peroni N, Albuquerque UP: Traditional knowledge andmanagement of umbu (Spondias tuberosa, Anacardiaceae): an endemic
species from the semi-arid region of northeastern brazil. Econ Bot 2010,
64:11–21.
39. San Martin-Gajardo I, Morellato LPC: Inter and intraspecific variation on
reproductive phenology of the Brazilian Atlantic forest Rubiaceae:
ecology and phylogenetic constraints. Rev Biol Trop 2003, 51:691–698.
40. Santos AMM, Santos BA: Are the vegetation structure and composition of the shrubby Caatinga free from edge influence? Acta Botanica Brasilica
2008, 22:1077–1084.
41. Blancas J, Casas A, Lira R, Caballero J: Traditional management and
morphological patterns of Myrtillocactus ackenckii (Cactaceae) in the
Tehuacán Valley, central México. Econ Bot 2009, 63:375–387.
42. Nascimento VT, Moura NP, Vasconcelos MAS, Maciel MIS, Albuquerque UP:
Chemical characterization of native wild plants of dry seasonal forests of
the semi-arid region of northeastern Brazil. Food Res Int 2011,
44:2112–2119.
43. Oaxaca-Villa B, Casas A, Valiente-Banuet A: Reproductive biology in wildand silvicultural managed populations of Escontria chiotilla (Cactaceae)
in the Tehuacán Valley, Central Mexico. Genet Resour Crop Evol 2006,
53:277–287.
44. Araújo TA, Alencar NL, Amorim ELC, Albuquerque UP: A new approach to
study medicinal plants with tannins and flavonoids contents from the
local knowledge. J Ethnopharmacol 2008, 120:72–80.
45. Lins Neto EMF, Peroni N, Maranhão CMC, Maciel MIS, Albuquerque UP:Analysis of umbu (Spondias tuberosa Arruda (Anacardiaceae)) in different
landscape management regimes. Environ Monit Assess 2012,
184:4489–4499.
46. Fournier LA: Un método cuantitativo para la medición de características
fenológicas em árboles. Turrialba 1974, 24:422–423.
47. Augspurger CK: Reproductive synchrony of a tropical shrub: experimental
studies on effects of pollinators and seed predators on Hybanthus
prunifolius (Violaceae). Ecology 1981, 62:775–788.
48. Augspurger CK: Phenology, flowering synchrony, and fruit set of sixneotropical shrubs. Biotropica 1983, 15:257–267.
49. Sieber SS, Albuquerque UP: Método participativos na pesquisa
Etnobiológica. In Métodos e técnicas na pesquisa Etnobiológica e
Etnoecológica. Edited by Albuquerque UP, Lucena RFP, Cunha LVF. Recife:
PE: NUPEEA; 2010.
50. Sheil D, Puri RK, Basuki I, Heist M, Wan M, Liswanti N, Rukmiyati Sardjono
MA, Samsoedin I, Sidiyasa K, Chrisandini Permana E, Angi EM, Gatzweiler F,
Johnson B, Wijaya A: Explorando la biodiversidad, el medio ambiente y las
perspectives de los pobladores en areas boscosas: método para la valoración
multidisciplinaria Del paisage. 2nd edition. Borgor: CIFOR; 2004.
51. Ayres M Jr, Ayres M, Ayres DL: BIOESTAT versão 5.0: aplicações estatísticas nas
áreas das ciências bio-médicas. Belém: Sociedade Civil Mamirauá /MCT CNPq; 2007.
52. Gentry AH: Flowering phenology and diversity in tropical Bignoniaceae.
Biotropica 1974, 6:64–68.
53. Newstrom LE, Frankie GW, Baker HG: A new classification for plant
phenology based on flowering patterns in lowland Tropical Rain Forest
trees at La Selva, Costa Rica. Biotropica 1994, 26:141–159.
54. Ragusa-Netto J, Silva RR: Canopy phenology of a dry forest in western
Brazil. Braz J Biol 2007, 67(3):569–575.
55. Barbosa DCA, Barbosa MCA, Lima LCM: Fenologia de espécies lenhosas da
Caatinga. In Ecologia e Conservação da Caatinga . Edited by Leal IR, TabarelliM, Silva JMC. Recife: UFPE; 2003:657–693.
56. Epstein L: A riqueza do umbuzeiro. Bahia Agrícola 1998, 2:31–34.
57. Reichet P, Borchert R: Water stress and tree phenology in a tropical dry
forest the lowlands of Costa Rica. J Appl Ecol 1984, 72:61–74.
58. Pratt RB, Jacobsen AL, Ewers FW, Davis SD: Relationships among xylem
transport, biomechanics and storage in stems and roots of nine
Rhamnaceae species of the California chaparral. New Phytolitologist 2007,
174:787–798.
59. Justiniano MJ, Fredericksen TS: Phenology of tree species in Bolivian dry
forests. Biotropica 2000, 32:276–281.
60. Janzen DH: Syncronization of sexual reproduction of tree within the dry
season in central. American Evolution 1967, 21:620–637.
61. Bawa KS, Kang H, Grayum MH: Relationships among time, frequency, and
duration of flowering i n tropical rain forest tree. Am J Bot 2003, 90:877–887.
62. Smith CM, Brostein JL: Site variation in reproductive synchrony in tree
Neotropical. J Biogeogr 1996, 23:477–486.
63. Borchert R: Responses of tropical trees to rainfall seasonality and its
long-term changes. Climatic Change 1998, 39:381–393.
64. Morellato LPC: As estações do ano na floresta . In Ecologia e preservação de
uma floresta tropical urbana. Edited by Morellato PC, Leitão-Filho HF.
Campinas: Editora da Unicamp; 1995:37–41.
65. Wright SJ, Van Schaik CP: Light and the phenology of tropical trees. Am
Nat 1994, 143:192–199.
66. Morellato LPC, Talora DC, Takahasi A, Bencke CC, Romera CE, Zipparro BV:
Phenology of Atlantic Rain Forest tree: a comparative study. Biotropica
2000, 32:811–823.
67. Newstrom LE, Frankie GW, Baker HG, Colwell RK: Diversity of long-term
flowering patterns. In Ecology and Natural History of a Neotropical Rain
Forest . Edited by Hespenheide HA, Hartshorn GS. La Selva: The University of
Chicago Press, Chicago; 1994:142–160.
68. Chapman CA, Chapman LJ, Struhsakei TT, Zanne AE, Clark CJ, Poulsen JR: A
long-term evaluation of fruiting phenology: importance of climate
change. J Trop Ecol 2005, 21:31–
45.69. Cleland EE, Chuine I, Menzel A, Mooney HA, Schwartz MD: Shifting plant
phenology in response to global change. Trends Ecol Evol 2007, 22(7):357–365.
70. Bertin RI: Plant phenology and distribution in relation to recent climate
change. J Torrey Botanical Soc 2008, 135(1):126–146.
71. Chmielewski FM, Rötzer T: Response of tree phenology to climate change
across Europe. Agric Forest Meterology 2001, 108:101–112.
72. Kitinya KT, Onwonga RN, Onyango C, Mbuvi JP, Kironchi G: Climate Change
and Variability: Farmers’ Perception, Experience and Adaptation
Strategies in Makueni County, Kenya, Asian. J Agric Saf Rural Dev 2012,
2(3):411–421.
doi:10.1186/1746-4269-9-10Cite this article as: Neto et al.: Phenology of Spondias tuberosa Arruda(Anacardiaceae) under different landscape management regimes and aproposal for a rapid phenological diagnosis using local knowledge.
Journal of Ethnobiology and Ethnomedicine 2013 9:10.
Neto et al. Journal of Ethnobiology and Ethnomedicine 2013, 9:10 Page 13 of 13
http://www.ethnobiomed.com/content/9/1/10