Area sources and their importance for population exposure (Dispersion modelling in Taiyuan, China). Liu, Li (Norwegian Institution for Air Research/UIO) Larssen, Steinar (Norwegian Institution for Air Research) Cao, Jie (Shanxi Environmental Information Center) - PowerPoint PPT Presentation
Area sources and their importance for population exposure (Dispersion modelling in Taiyuan, China) Liu, Li (Norwegian Institution for Air Research/UIO) Larssen, Steinar (Norwegian Institution for Air Research) Cao, Jie (Shanxi Environmental Information Center) Zhang, Daisheng (Shanxi Environmental Information Center) 17-19 Oct.2004 Oslo, Norway
Transcript
Area sources and their importance for population exposure
(Dispersion modelling in Taiyuan, China)
Liu, Li (Norwegian Institution for Air Research/UIO)
Larssen, Steinar (Norwegian Institution for Air Research)
Cao, Jie (Shanxi Environmental Information Center)
Zhang, Daisheng (Shanxi Environmental Information Center)
17-19 Oct.2004 Oslo, Norway
Master Plan Against Air Pollution in Shanxi Province
Data collection (Emission etc.)
A dispersion model system (AIRQUIS) has been used for cities to study surface concentraions and exposures for basecase (2000) and different control options and scenarios
By using model results and cost-benefit analysis in order to have action plan for air pollutions reduction
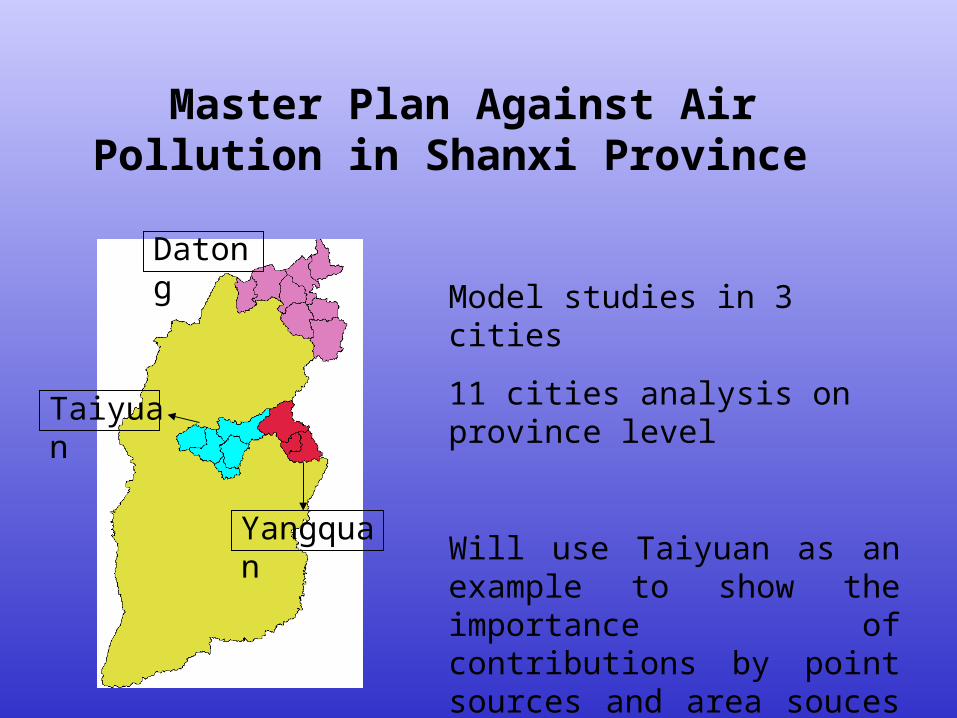
Master Plan Against Air Pollution in Shanxi Province
Datong
Taiyuan
Yangquan
Model studies in 3 cities
11 cities analysis on province level
Will use Taiyuan as an example to show the importance of contributions by point sources and area souces (house holds etc.)
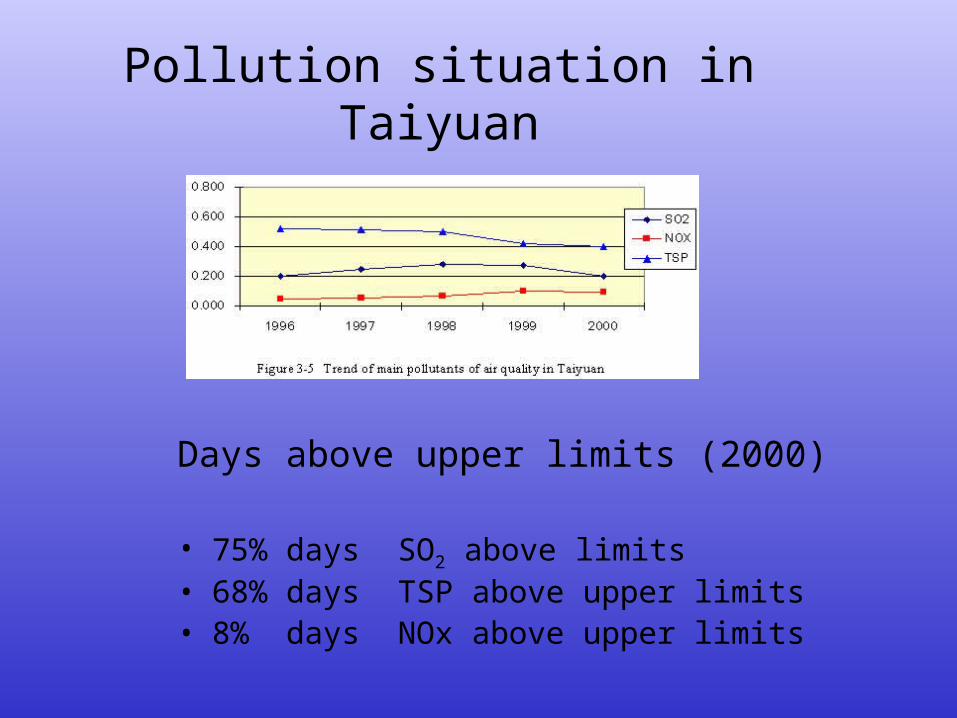
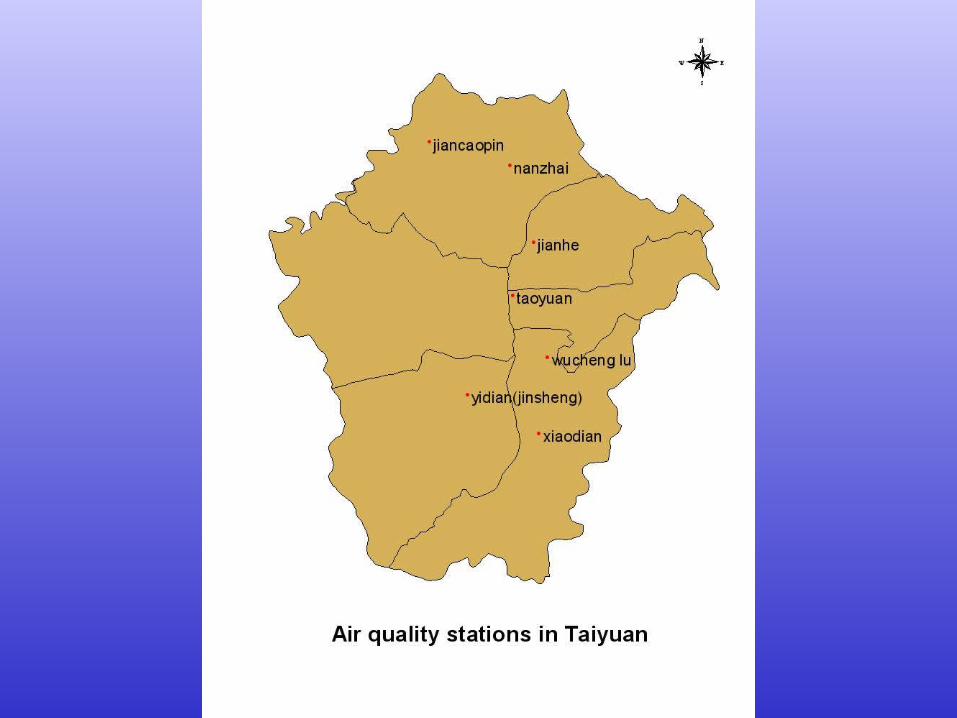
Pollution situation in Taiyuan
Days above upper limits (2000)
• 75% days SO2 above limits• 68% days TSP above upper limits• 8% days NOx above upper limits
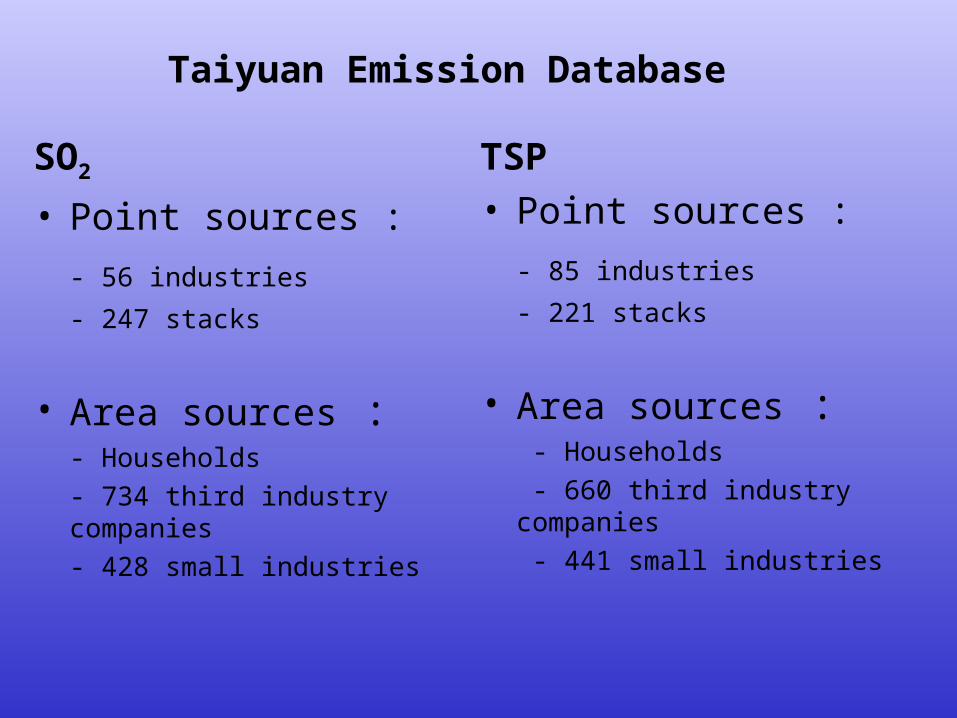
Taiyuan Emission Database
SO2
• Point sources :
- 56 industries
- 247 stacks
• Area sources :- Households
- 734 third industry companies- 428 small industries
TSP• Point sources :
- 85 industries
- 221 stacks
• Area sources : - Households - 660 third industry companies - 441 small industries
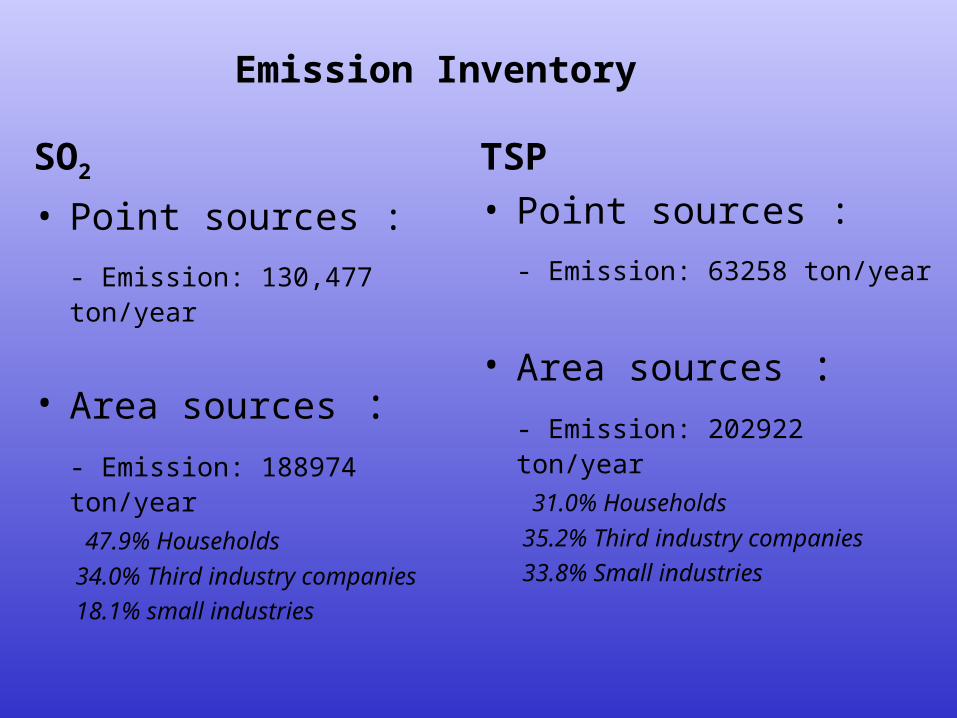
Emission Inventory
SO2
• Point sources :
- Emission: 130,477 ton/year
• Area sources :- Emission: 188974 ton/year
47.9% Households
34.0% Third industry companies 18.1% small industries
TSP• Point sources :
- Emission: 63258 ton/year
• Area sources :- Emission: 202922 ton/year
31.0% Households
35.2% Third industry companies 33.8% Small industries
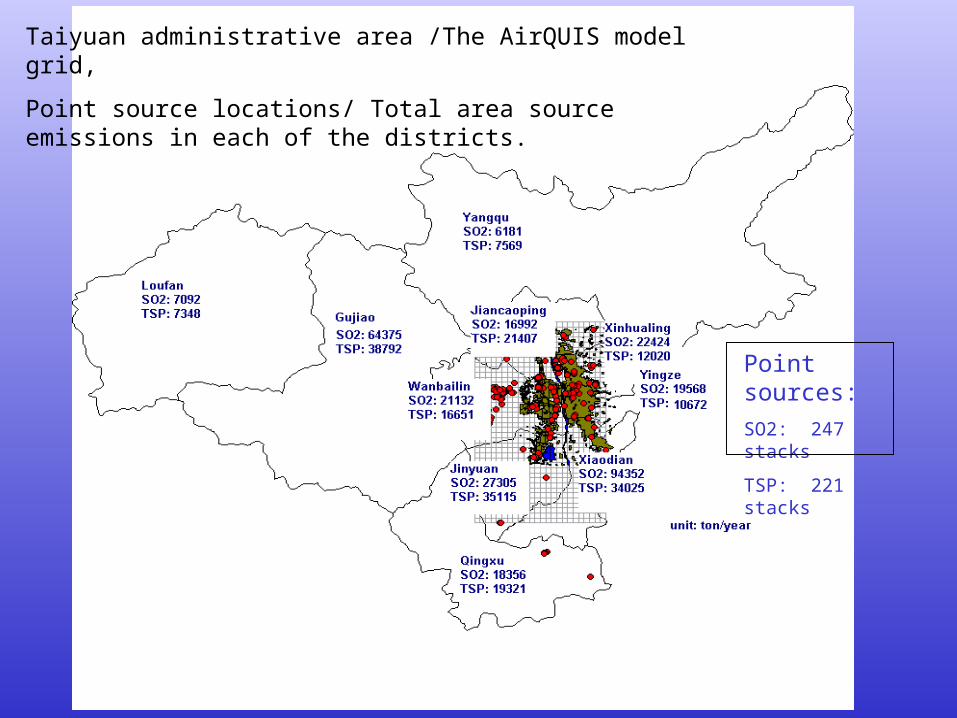
Taiyuan administrative area /The AirQUIS model grid,
Point source locations/ Total area source emissions in each of the districts.
Point sources:
SO2: 247 stacks
TSP: 221 stacks
Seasonal variation factor
Heating season
SO2: 1.6
TSP: 1.2
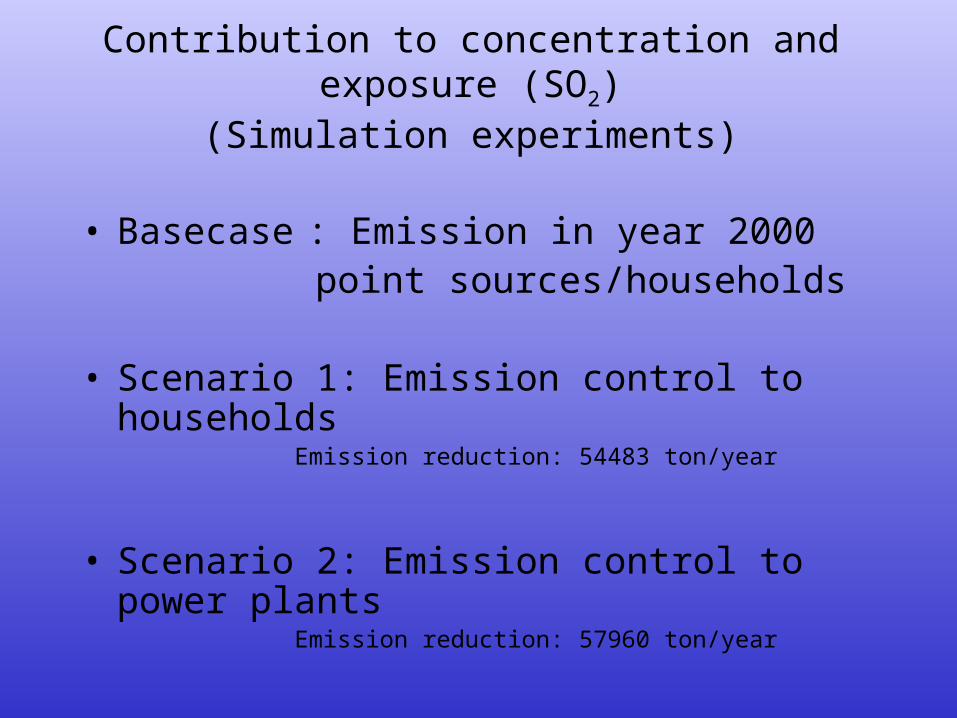
Contribution to concentration and exposure (SO2)(Simulation experiments)
• Basecase : Emission in year 2000 point sources/households
• Scenario 1: Emission control to householdsEmission reduction: 54483 ton/year
• Scenario 2: Emission control to power plants Emission reduction: 57960 ton/year
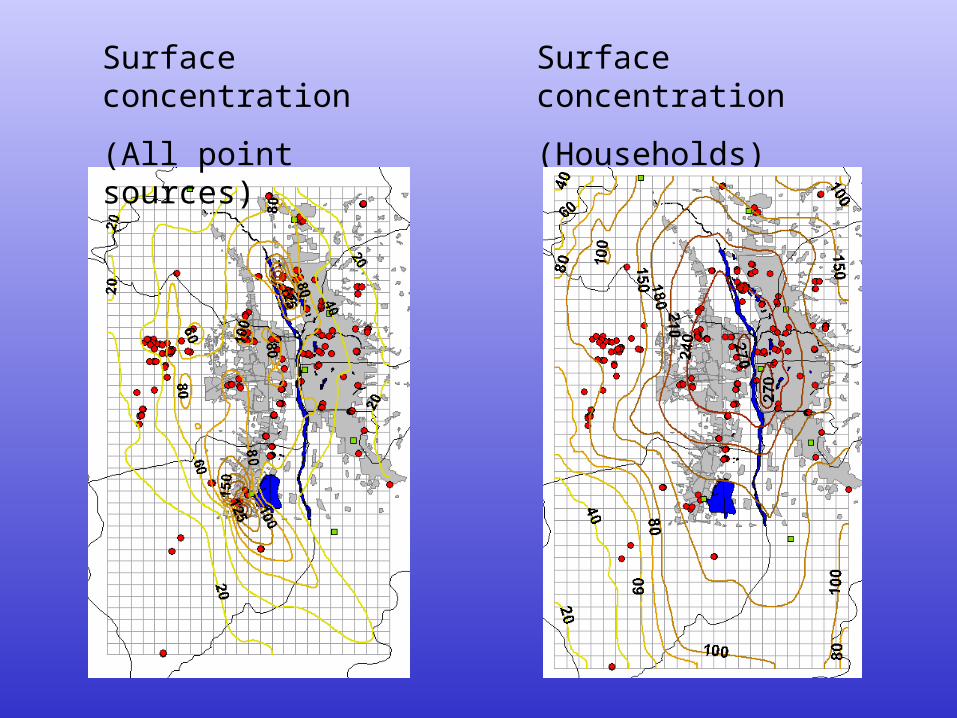
Surface concentration
(All point sources)
Surface concentration
(Households)
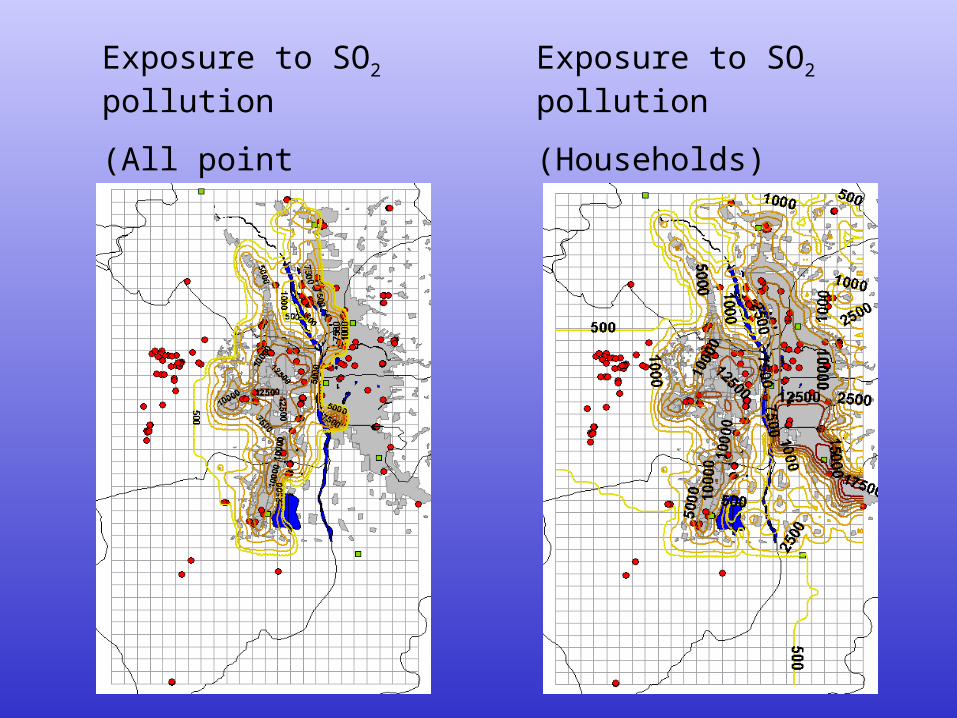
Exposure
Number of persons exposed to SO2 concentration above 60ug/m3 in each grid (1km × 1km)
Exposure to SO2 pollution
(All point sources)
Exposure to SO2 pollution
(Households)
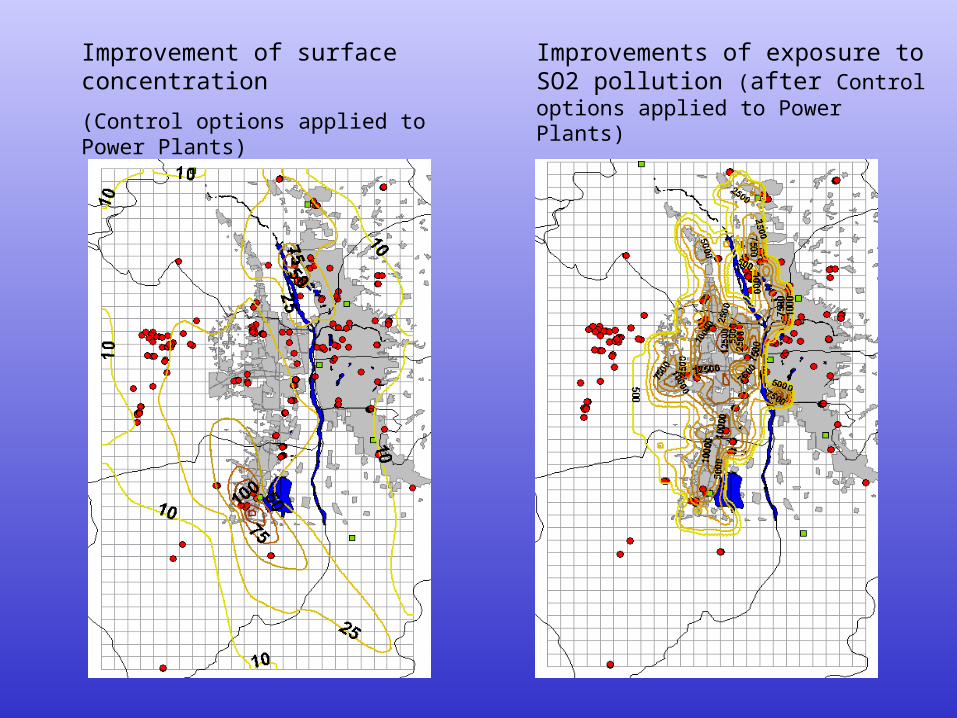
Improvement of surface concentration
(Control options applied to Power Plants)
Improvements of exposure to SO2 pollution (after Control options applied to Power Plants)
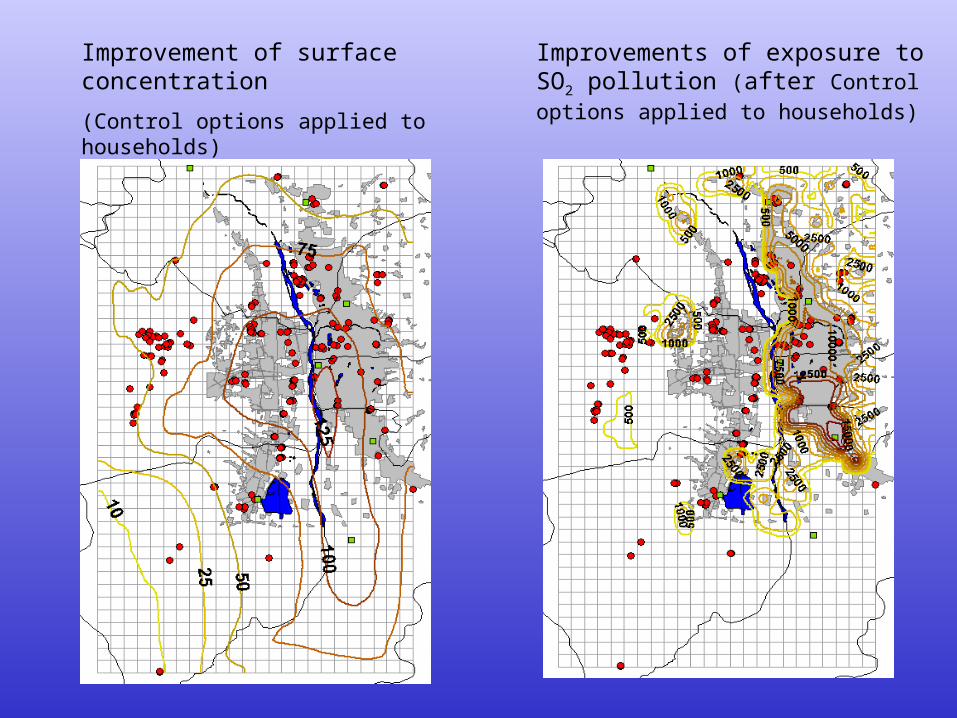
Improvement of surface concentration
(Control options applied to households)
Improvements of exposure to SO2 pollution (after Control options applied to households)
Summary:
1. SO2 emission from point sources is smaller than area sources in Taiyuan. Emission from house holds sector is about 2/3 of total point sorces emssions.
2. The TSP emission from area sources is about 3 times of emission from point sources. Emission from house holds sector is about the same compared with total point sources.
3. The emissions both for SO2 and TSP from ´The third industrial companies´ are important as well. Maybe less import for indoor air quality, but it has strong impact on surface concentrations.
4. Area sources have much higher risk for increasing the surface concentration and population exposure to air pollution
5. The control options applied to area sources are much more efficient to improve the air quality and health damage