Abstract. The analysis of time series databases is very important in the area of medicine. Most of the approaches that address this problem are based on nu-merical algorithms that calculate distances, clusters, index trees, etc. However, a symbolic rather than numerical analysis is sometimes needed to search for the characteristics of the time series. Symbolic information helps users to effi-ciently analyse and compare time series in the same or in a similar way as a domain expert would. This paper focuses on the process of transforming nu-merical time series into a symbolic domain and on the definition of both this domain and a distance for comparing symbolic temporal sequences. The work is applied to the isokinetics domain within an application called I4.
Keywords: Time series characterization, isokinetics, symbolic distance, infor-mation extraction and text mining.
1 Introduction
An important domain for the application of time series analysis in the medical field is physiotherapy and, more specifically, muscle function assessment based on isokinetics data.
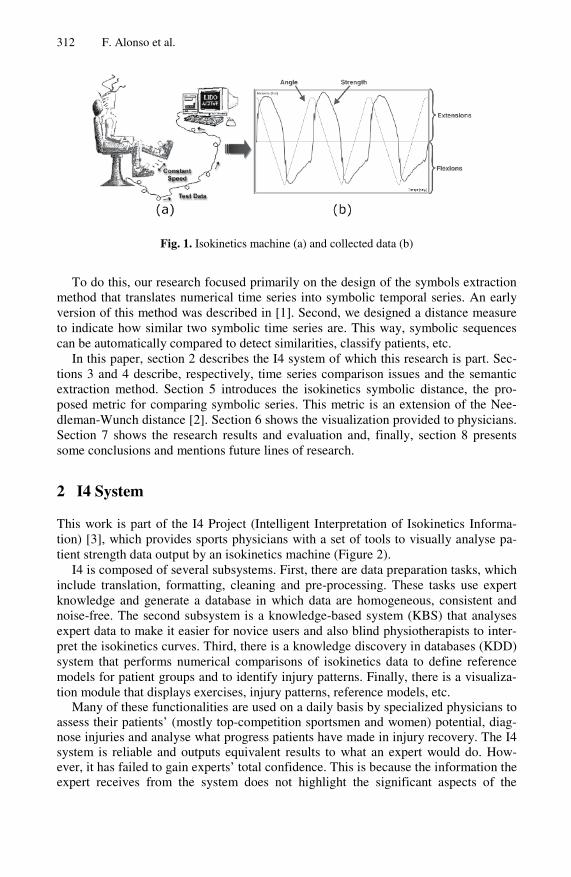
Isokinetics data is retrieved by an isokinetics machine (Fig. 1a), on which patients perform exercises at maximum strength. To assure that the patient performs exercises at constant speed, the machine puts up the required resistance to the strength the patient exerts. Our patients are chiefly sportspeople. Therefore, we decided to focus on knee exercises (extensions and flexions) since most of the data and knowledge gathered by sports physicians is related to this joint. The data takes the form of a strength curve with additional information on the angle of the knee (Fig. 1b). The positive values of the curve represent extensions (knee angle from 90º to 0º) and the negative values represent flexions (knee angle from 0º to 90º).
After observing experts at work, we found that they apply their knowledge and expertise to focus on certain sections of the isokinetics time series and ignore others. Therefore, we looked for a way of bringing the system output closer to the informa-tion sports physicians deal with in their routine work, since they demand a representa-tion related to their own way of thinking and operating. Hence, symbolic series have been used as an alternative that more closely resembles an expert’s conceptual mechanisms.
312 F. Alonso et al.
Fig. 1. Isokinetics machine (a) and collected data (b)
To do this, our research focused primarily on the design of the symbols extraction method that translates numerical time series into symbolic temporal series. An early version of this method was described in [1]. Second, we designed a distance measure to indicate how similar two symbolic time series are. This way, symbolic sequences can be automatically compared to detect similarities, classify patients, etc.
In this paper, section 2 describes the I4 system of which this research is part. Sec-tions 3 and 4 describe, respectively, time series comparison issues and the semantic extraction method. Section 5 introduces the isokinetics symbolic distance, the pro-posed metric for comparing symbolic series. This metric is an extension of the Nee-dleman-Wunch distance [2]. Section 6 shows the visualization provided to physicians. Section 7 shows the research results and evaluation and, finally, section 8 presents some conclusions and mentions future lines of research.
2 I4 System
This work is part of the I4 Project (Intelligent Interpretation of Isokinetics Informa-tion) [3], which provides sports physicians with a set of tools to visually analyse pa-tient strength data output by an isokinetics machine (Figure 2).
I4 is composed of several subsystems. First, there are data preparation tasks, which include translation, formatting, cleaning and pre-processing. These tasks use expert knowledge and generate a database in which data are homogeneous, consistent and noise-free. The second subsystem is a knowledge-based system (KBS) that analyses expert data to make it easier for novice users and also blind physiotherapists to inter-pret the isokinetics curves. Third, there is a knowledge discovery in databases (KDD) system that performs numerical comparisons of isokinetics data to define reference models for patient groups and to identify injury patterns. Finally, there is a visualiza-tion module that displays exercises, injury patterns, reference models, etc.
Many of these functionalities are used on a daily basis by specialized physicians to assess their patients’ (mostly top-competition sportsmen and women) potential, diag-nose injuries and analyse what progress patients have made in injury recovery. The I4 system is reliable and outputs equivalent results to what an expert would do. How-ever, it has failed to gain experts’ total confidence. This is because the information the expert receives from the system does not highlight the significant aspects of the
Symbol Extraction Method and Symbolic Distance 313
isokinetics series in a language that he or she can easily understand. It is this state of affairs that has led to the need to build a symbolic comparison method into the I4 symbolic data subsystem. Not only should this symbolic method produce equally reli-able results, but it should also provide a reasonable explanation of the results in terms of the domain under study.
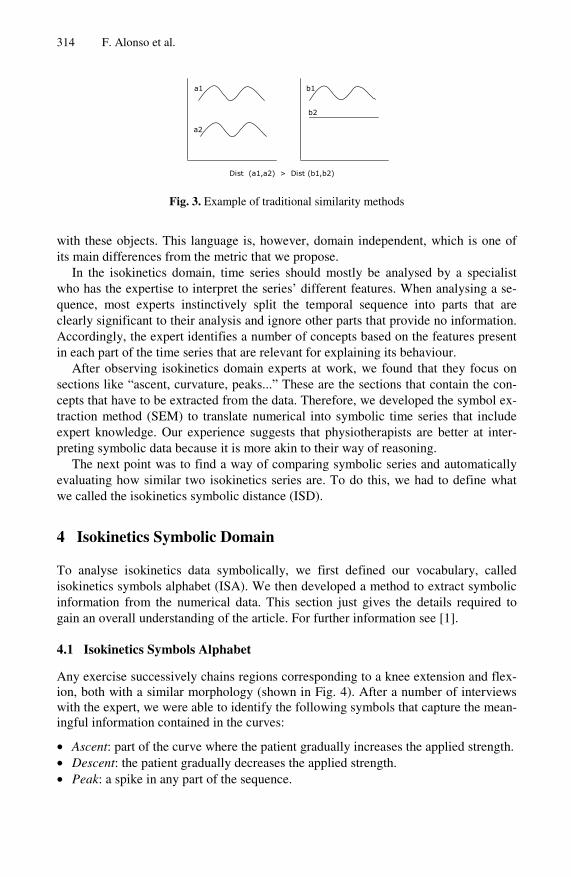
There has been a lot of research in the area of numerical time series comparison [4,5,6,7]. Most of these methods are based on comparing the values of separate points in each series rather than on the overall appearance of these series. In the case of Fig. 3, for example, they would indicate that series b1 and b2 resemble each other more closely than a1 and a2.
We, however, are interested in the morphology of the isokinetics curves rather than in the strength value exerted at any given point in time. Although a simple time trans-lation would solve the problem for the example in Fig. 3, this translation would over-look the patients’ strength values (which is not unimportant) and would not be a valid solution in all cases or for all parts of the sequence.
In the field of morphological comparison, there is a shape definition language (SDL) [8] for retrieving objects based on shapes contained in the histories associated
314 F. Alonso et al.
a1
a2
b1
b2
Dist (a1,a2) > Dist (b1,b2)
Fig. 3. Example of traditional similarity methods
with these objects. This language is, however, domain independent, which is one of its main differences from the metric that we propose.
In the isokinetics domain, time series should mostly be analysed by a specialist who has the expertise to interpret the series’ different features. When analysing a se-quence, most experts instinctively split the temporal sequence into parts that are clearly significant to their analysis and ignore other parts that provide no information. Accordingly, the expert identifies a number of concepts based on the features present in each part of the time series that are relevant for explaining its behaviour.
After observing isokinetics domain experts at work, we found that they focus on sections like “ascent, curvature, peaks...” These are the sections that contain the con-cepts that have to be extracted from the data. Therefore, we developed the symbol ex-traction method (SEM) to translate numerical into symbolic time series that include expert knowledge. Our experience suggests that physiotherapists are better at inter-preting symbolic data because it is more akin to their way of reasoning.
The next point was to find a way of comparing symbolic series and automatically evaluating how similar two isokinetics series are. To do this, we had to define what we called the isokinetics symbolic distance (ISD).
4 Isokinetics Symbolic Domain
To analyse isokinetics data symbolically, we first defined our vocabulary, called isokinetics symbols alphabet (ISA). We then developed a method to extract symbolic information from the numerical data. This section just gives the details required to gain an overall understanding of the article. For further information see [1].
4.1 Isokinetics Symbols Alphabet
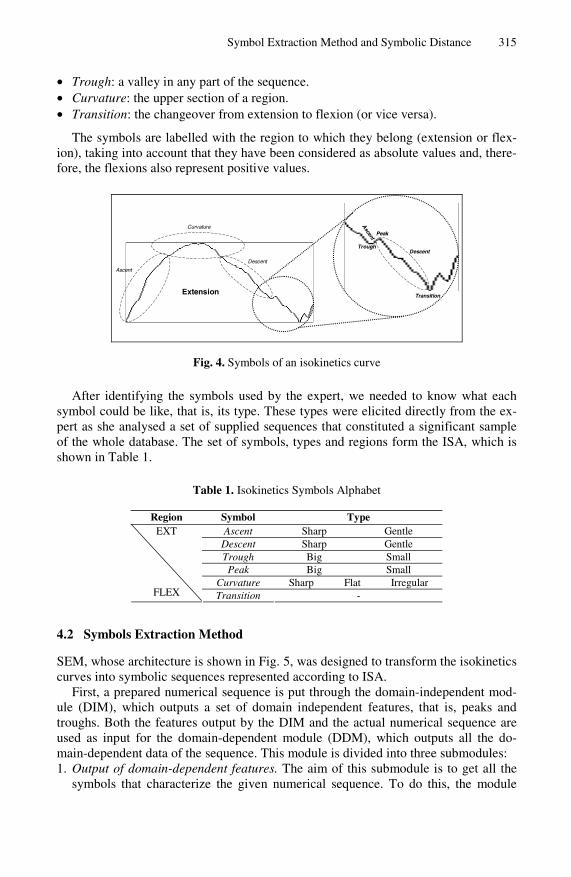
Any exercise successively chains regions corresponding to a knee extension and flex-ion, both with a similar morphology (shown in Fig. 4). After a number of interviews with the expert, we were able to identify the following symbols that capture the mean-ingful information contained in the curves:
• Ascent: part of the curve where the patient gradually increases the applied strength. • Descent: the patient gradually decreases the applied strength. • Peak: a spike in any part of the sequence.
Symbol Extraction Method and Symbolic Distance 315
• Trough: a valley in any part of the sequence. • Curvature: the upper section of a region. • Transition: the changeover from extension to flexion (or vice versa).
The symbols are labelled with the region to which they belong (extension or flex-ion), taking into account that they have been considered as absolute values and, there-fore, the flexions also represent positive values.
Extension
Curvature
Descent
DescentTrough
Ascent
Peak
Transition
Fig. 4. Symbols of an isokinetics curve
After identifying the symbols used by the expert, we needed to know what each symbol could be like, that is, its type. These types were elicited directly from the ex-pert as she analysed a set of supplied sequences that constituted a significant sample of the whole database. The set of symbols, types and regions form the ISA, which is shown in Table 1.
Table 1. Isokinetics Symbols Alphabet
Region Symbol Type Ascent Sharp Gentle
Descent Sharp Gentle Trough Big Small Peak Big Small
Curvature Sharp Flat Irregular
EXT
FLEX Transition -
4.2 Symbols Extraction Method
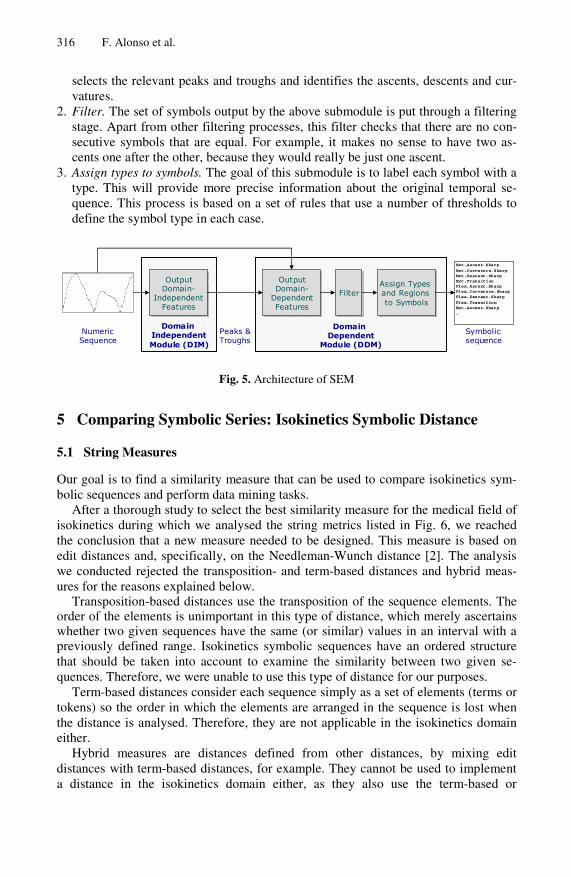
SEM, whose architecture is shown in Fig. 5, was designed to transform the isokinetics curves into symbolic sequences represented according to ISA.
First, a prepared numerical sequence is put through the domain-independent mod-ule (DIM), which outputs a set of domain independent features, that is, peaks and troughs. Both the features output by the DIM and the actual numerical sequence are used as input for the domain-dependent module (DDM), which outputs all the do-main-dependent data of the sequence. This module is divided into three submodules: 1. Output of domain-dependent features. The aim of this submodule is to get all the
symbols that characterize the given numerical sequence. To do this, the module
Ascent
316 F. Alonso et al.
selects the relevant peaks and troughs and identifies the ascents, descents and cur-vatures.
2. Filter. The set of symbols output by the above submodule is put through a filtering stage. Apart from other filtering processes, this filter checks that there are no con-secutive symbols that are equal. For example, it makes no sense to have two as-cents one after the other, because they would really be just one ascent.
3. Assign types to symbols. The goal of this submodule is to label each symbol with a type. This will provide more precise information about the original temporal se-quence. This process is based on a set of rules that use a number of thresholds to define the symbol type in each case.
Our goal is to find a similarity measure that can be used to compare isokinetics sym-bolic sequences and perform data mining tasks.
After a thorough study to select the best similarity measure for the medical field of isokinetics during which we analysed the string metrics listed in Fig. 6, we reached the conclusion that a new measure needed to be designed. This measure is based on edit distances and, specifically, on the Needleman-Wunch distance [2]. The analysis we conducted rejected the transposition- and term-based distances and hybrid meas-ures for the reasons explained below.
Transposition-based distances use the transposition of the sequence elements. The order of the elements is unimportant in this type of distance, which merely ascertains whether two given sequences have the same (or similar) values in an interval with a previously defined range. Isokinetics symbolic sequences have an ordered structure that should be taken into account to examine the similarity between two given se-quences. Therefore, we were unable to use this type of distance for our purposes.
Term-based distances consider each sequence simply as a set of elements (terms or tokens) so the order in which the elements are arranged in the sequence is lost when the distance is analysed. Therefore, they are not applicable in the isokinetics domain either.
Hybrid measures are distances defined from other distances, by mixing edit distances with term-based distances, for example. They cannot be used to implement a distance in the isokinetics domain either, as they also use the term-based or
Symbol Extraction Method and Symbolic Distance 317
transposition-based distances for their definition and, therefore, do not take into ac-count the order of the sequence elements.
Measures
Based on Transpositions
JaroJaro-Winkler
…
Hybrids
Recursive MatchingSoftTFIDF
Edit Distances
LevenshteinSmith-Waterman
Monge ElkanNeedleman-Wunch
….
Term-Based
JaccardTFIDF
or cosine similarityJensen-Shannon
Simplified F-S…
Fig. 6. Types of Strings Measures
5.2 Isokinetics Symbolic Distance
The family that best meet the needs of the isokinetics domain is edit distances, as it takes into account the order of the components and the morphology of the sequence. However, none of the edit distances we examined exactly fits our problem, because the symbols used in the isokinetics domain also have an associated type that needs to be taken into account to calculate the distances. This led us to propose a variation on the Needleman-Wunch distance. The suggested distance, the isokinetics symbolic dis-tance (ISD), allocates a variable cost to the insert and delete operations depending on the symbol and symbol type to be inserted or deleted. It also allocates a variable cost to the substitute operation depending on the symbol and symbol type that are substi-tuted.
The researched isokinetics sequences are composed of three repetitions, and each repetition is composed of an extension and a flexion. Therefore, an isokinetics se-quence contains six parts, each of which is represented by the notation shown in (1).
<Zone><Repetition><Sequence> (1)
where <Zone> can take the value E (for Extension) or F (for Flexion), <Repeti-tion> can take the value R1, R2 or R3 depending on whether it is repetition 1, 2 or 3, and<Sequence> can take the value S1 or S2 depending on the sequence 1 or 2.
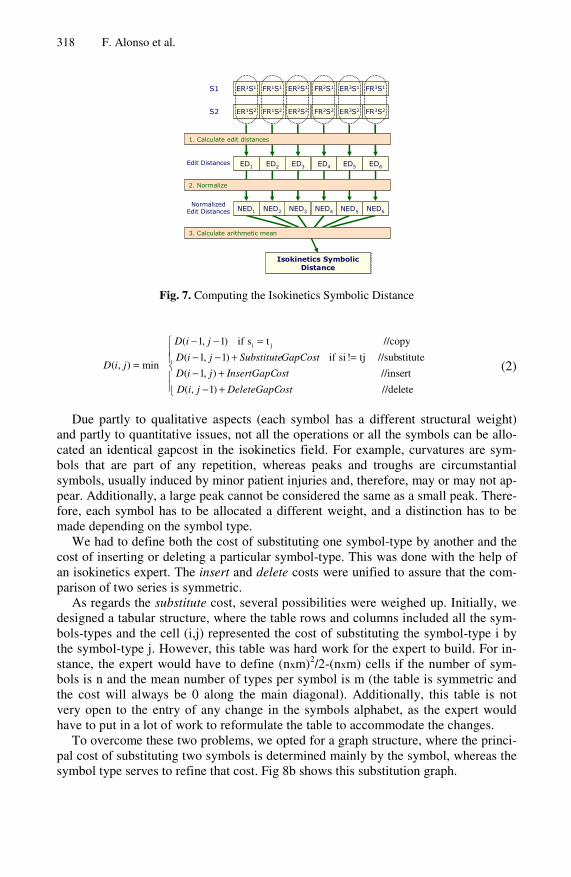
Fig. 7 shows the three steps required to calculate the ISD of two symbolic se-quences: calculate the ISD between each pair of subsequences, normalize these dis-tances and calculate the arithmetic mean to get the total distance.
The ISD between two series, S1, of length n, and S2, of length m, is calculated by building a matrix of mxn elements. This matrix includes the accumulated costs of the insert, delete or substitute operations, always calculating the best alignment between the two symbolic sequences for comparison. This prevents trapping in local minima. The value of each matrix element is calculated using equation (2): element (i,j) indi-cates the ISD between S1’ and S2’ (the subsequences —prefixes— of S1 and S2 end-ing in elements j and i, respectively); element (m,n) indicates the ISD between S1 and S2. This way, the ISD can be used to get the least costly edit command sequence (de-lete, insert and substitute) for transforming S1 into S2.
Fig. 7. Computing the Isokinetics Symbolic Distance
⎪⎪⎩
⎪⎪⎨
⎧
+−+−
=+−−=−−
=
//delete )1,(
//insert ),1(
stitute //subtj! si if)1,1(
//copy ts if)1,1(
min),(
ji
ostDeleteGapCjiD
ostInsertGapCjiD
GapCostSubstitutejiD
jiD
jiD
(2)
Due partly to qualitative aspects (each symbol has a different structural weight) and partly to quantitative issues, not all the operations or all the symbols can be allo-cated an identical gapcost in the isokinetics field. For example, curvatures are sym-bols that are part of any repetition, whereas peaks and troughs are circumstantial symbols, usually induced by minor patient injuries and, therefore, may or may not ap-pear. Additionally, a large peak cannot be considered the same as a small peak. There-fore, each symbol has to be allocated a different weight, and a distinction has to be made depending on the symbol type.
We had to define both the cost of substituting one symbol-type by another and the cost of inserting or deleting a particular symbol-type. This was done with the help of an isokinetics expert. The insert and delete costs were unified to assure that the com-parison of two series is symmetric.
As regards the substitute cost, several possibilities were weighed up. Initially, we designed a tabular structure, where the table rows and columns included all the sym-bols-types and the cell (i,j) represented the cost of substituting the symbol-type i by the symbol-type j. However, this table was hard work for the expert to build. For in-stance, the expert would have to define (nxm)2/2-(nxm) cells if the number of sym-bols is n and the mean number of types per symbol is m (the table is symmetric and the cost will always be 0 along the main diagonal). Additionally, this table is not very open to the entry of any change in the symbols alphabet, as the expert would have to put in a lot of work to reformulate the table to accommodate the changes.
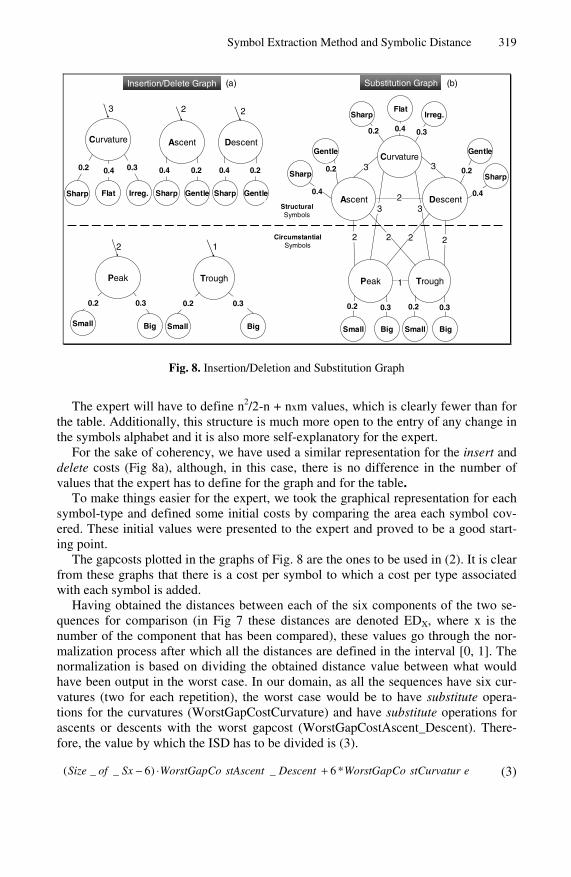
To overcome these two problems, we opted for a graph structure, where the princi-pal cost of substituting two symbols is determined mainly by the symbol, whereas the symbol type serves to refine that cost. Fig 8b shows this substitution graph.
Symbol Extraction Method and Symbolic Distance 319
Peak
Ascent DescentCurvature
Insertion/Delete Graph
Trough
1
223
2
Small Big Small Big
0.2 0.20.3 0.3
Sharp Gentle
0.4 0.2
Sharp Gentle
0.4 0.2
Sharp Flat
0.2 0.4
Irreg.
0.3
CircumstantialSymbols
StructuralSymbols
Peak Trough
Ascent Descent
Curvature
2
2
1
3 3
22
Small Big Small Big
3 3
0.2 0.20.3 0.3
Substitution Graph
Sharp
Gentle
0.4
0.2
Sharp Irreg.
0.2 0.3
Sharp
Gentle
0.4
0.2
Flat
0.4
2
(a) (b)
Fig. 8. Insertion/Deletion and Substitution Graph
The expert will have to define n2/2-n + nxm values, which is clearly fewer than for the table. Additionally, this structure is much more open to the entry of any change in the symbols alphabet and it is also more self-explanatory for the expert.
For the sake of coherency, we have used a similar representation for the insert and delete costs (Fig 8a), although, in this case, there is no difference in the number of values that the expert has to define for the graph and for the table.
To make things easier for the expert, we took the graphical representation for each symbol-type and defined some initial costs by comparing the area each symbol cov-ered. These initial values were presented to the expert and proved to be a good start-ing point.
The gapcosts plotted in the graphs of Fig. 8 are the ones to be used in (2). It is clear from these graphs that there is a cost per symbol to which a cost per type associated with each symbol is added.
Having obtained the distances between each of the six components of the two se-quences for comparison (in Fig 7 these distances are denoted EDX, where x is the number of the component that has been compared), these values go through the nor-malization process after which all the distances are defined in the interval [0, 1]. The normalization is based on dividing the obtained distance value between what would have been output in the worst case. In our domain, as all the sequences have six cur-vatures (two for each repetition), the worst case would be to have substitute opera-tions for the curvatures (WorstGapCostCurvature) and have substitute operations for ascents or descents with the worst gapcost (WorstGapCostAscent_Descent). There-fore, the value by which the ISD has to be divided is (3).
Once the normalized distances have been obtained for each component, their arithmetic mean is calculated. This process outputs the isokinetics symbolic distance between the two compared sequences.
6 Symbolic Visualization
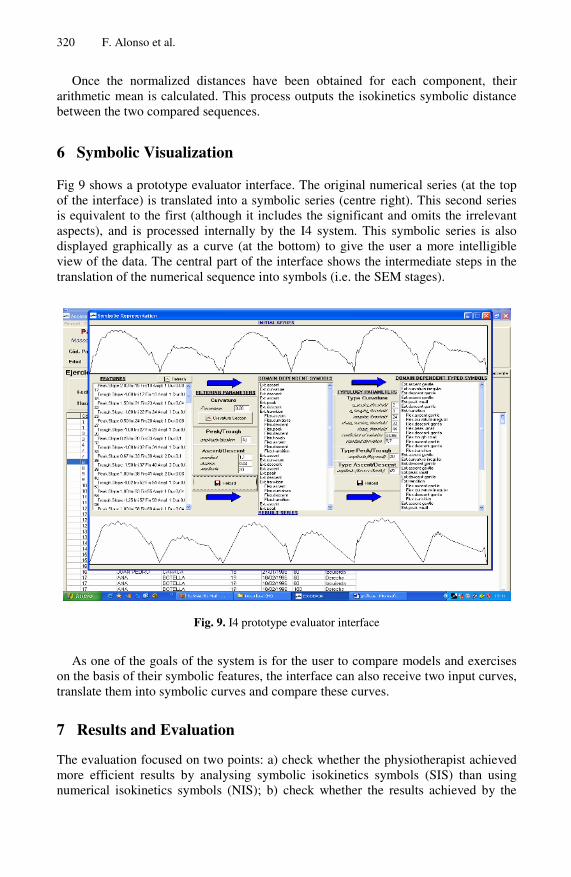
Fig 9 shows a prototype evaluator interface. The original numerical series (at the top of the interface) is translated into a symbolic series (centre right). This second series is equivalent to the first (although it includes the significant and omits the irrelevant aspects), and is processed internally by the I4 system. This symbolic series is also displayed graphically as a curve (at the bottom) to give the user a more intelligible view of the data. The central part of the interface shows the intermediate steps in the translation of the numerical sequence into symbols (i.e. the SEM stages).
Fig. 9. I4 prototype evaluator interface
As one of the goals of the system is for the user to compare models and exercises on the basis of their symbolic features, the interface can also receive two input curves, translate them into symbolic curves and compare these curves.
7 Results and Evaluation
The evaluation focused on two points: a) check whether the physiotherapist achieved more efficient results by analysing symbolic isokinetics symbols (SIS) than using numerical isokinetics symbols (NIS); b) check whether the results achieved by the
Symbol Extraction Method and Symbolic Distance 321
system comparing symbolic sequences using the symbolic distance were more sig-nificant than comparing their respective numerical sequences using the Fourier trans-form.
For point a) the expert and novice physicians who participated in I4 project devel-opment were given the same information: an isokinetics test. The test was repeated for 34 occurrences (20 with no injuries at all, 8 with common injuries and 6 with un-usual injuries). The results are shown in Table 2.
Table 2. Evaluation of injury detection
NIS SIS Expert Novice Expert Novice
20 uninjured 20 OK Failed 4 20 OK Failed 2 8 common injuries 8 OK 5 OK (3 mistakes) 8 OK 7 OK (1 mistake)
6 unusual injuries 2 mistakes and 1 don’t know
2 mistakes and 4 don’t knows
1 don’t know 2 mistakes and 4
don’t knows
We found that the symbolic sequence yielded better results than the numerical se-
quence for both the expert and the novice physicians, but the results were more sig-nificant in the latter case.
With respect to point b), the I4 system was fed a knee isokinetics test with 28 oc-currences, each performed by a different sportsperson: 20 had no injury, 5 had a common knee injury (torn ligament), and 3 had an unusual injury (osteochondritis). The system was also given 3 reference models: 1 without injuries and 2 with the above-mentioned injury types.
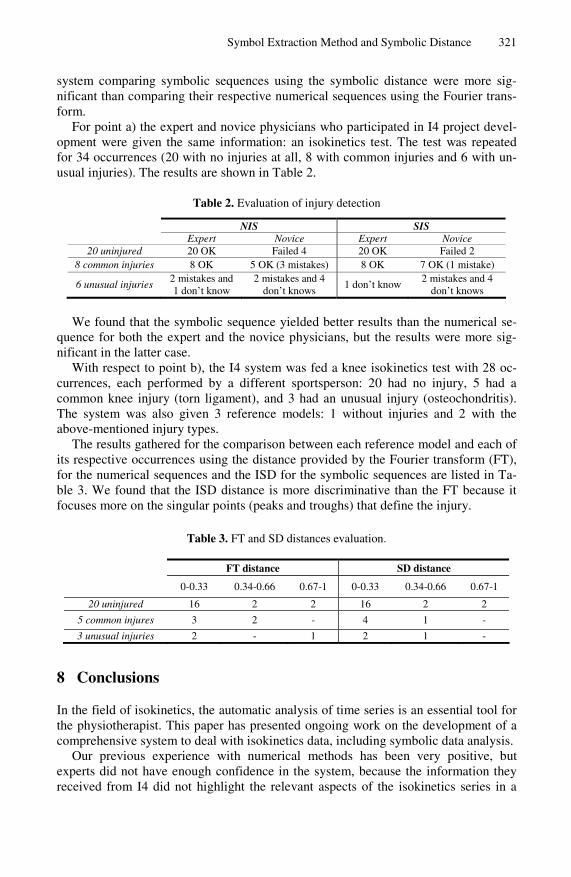
The results gathered for the comparison between each reference model and each of its respective occurrences using the distance provided by the Fourier transform (FT), for the numerical sequences and the ISD for the symbolic sequences are listed in Ta-ble 3. We found that the ISD distance is more discriminative than the FT because it focuses more on the singular points (peaks and troughs) that define the injury.
Table 3. FT and SD distances evaluation.
FT distance SD distance 0-0.33 0.34-0.66 0.67-1 0-0.33 0.34-0.66 0.67-1
20 uninjured 16 2 2 16 2 2
5 common injures 3 2 - 4 1 -
3 unusual injuries 2 - 1 2 1 -
8 Conclusions
In the field of isokinetics, the automatic analysis of time series is an essential tool for the physiotherapist. This paper has presented ongoing work on the development of a comprehensive system to deal with isokinetics data, including symbolic data analysis.
Our previous experience with numerical methods has been very positive, but experts did not have enough confidence in the system, because the information they received from I4 did not highlight the relevant aspects of the isokinetics series in a
322 F. Alonso et al.
language they found easy to understand. This is the reason that led us to introduce symbolic methods, which use the same language as our experts.
This paper presented SEM, which extracts symbolic information from numerical isokinetics data, using an alphabet defined by our experts. SEM contains a domain in-dependent module, which can be used in other domains. Additionally, we defined a symbolic distance, based on edit operations on an isokinetics symbolic sequence.
As the evaluation has shown, both the symbolic sequence generated by SEM and the comparison of isokinetics data using the ISD have proved helpful for sports physi-cians. Given those encouraging results, we are continuing our research in the field of symbolic data analysis to build new functionalities into I4 and add symbolic injury characterization and symbolic reference model creation to the numerical KDD sub-system.
References
1. Alonso F., Martínez, L., Montes, C., Pérez, A., Santamaría, A., Valente, J.P. (2004) Seman-tic Reference Model in Medical Time Series. International Symposium on Biological and Medical Data Analysis ISBMDA 2004: In Lecture Notes in Computer Science, no. 3337, pp. 344-355.
2. Needleman, S. B. & Wunsch, C. D. (1970) A general method applicable to the search for similarities in the amino acid sequences of two proteins. J. Mol. Biol., 48, 443-453.
3. Alonso F, Valente J P, Martínez L and Montes C. (2005) Discovering Patterns and Refer-ence Models in the Medical Domain of Isokinetics. In: J. M. Zurada, editor, New Genera-tions of Data Mining Applications, IEEE Press/Wiley.
4. Agrawal R, Faloutsos C, and Swam A N. (1993) Efficient Similarity Search In Sequence Databases. In D. Lomet, editor, Proceedings of the 4th International Conference of Founda-tions of Data Organization and Algorithms (FODO), pages 69-84, Chicago, Illinois, Springer Verlag.
5. Faloutsos C, Ranganathan M, Manolopoulos Y (1994) Fast subsequence matching in time series databases. In Proceedings of SIGMOD’94, Minneapolis, MN, pp 419-429.
6. Rafei D, Mendelzo A. (1997) Similarity-Based Queries for Time Series Data. In Proceed-ings of SIGMOD, Arizona
7. Han J, Dong G, Yin Y (1998) Efficient mining of partial periodic patterns in time series da-tabase. In Proceedings of the 4th international conference on knowledge discovery and data mining. AAAI Press, Menlo Park, CA, pp 214-218.
8. R. Agrawal, G. Psaila, E. L. Wimmers, and M. Zaït (1995) Querying shapes of histories. IBM Research Report RJ 9962 (87921), IBM Almaden Research Center, San Jose, California.