Page 1
116
Cite: Shvets A. V., Nickolaenko A. P., Koloskov A. V., Yampolsky Yu. M., Budanov O. V., Shvets A. A. Low-frequency (ELF–VLF) radio at-mospherics study at the Ukrainian Antarctic Akademik Vernadsky station. Ukrainian An tarctic Journal, 2019. № 1(18), 116—127.
UDC537.874+550.388.2
A. V. Shvets 1, *, A. P. Nickolaenko 1, A. V. Koloskov 2, 3,Yu. M. Yampolsky 2, O. V. Budanov 2, A. A. Shvets 1
1 A.Ya. Usikov Institute for Radiophysics and Electronics of National Academy of Sciences of Ukraine,
12 Akademik Proskura Str., Kharkiv, 61085, Ukraine2 Institute of Radio Astronomy of the National Academy of Sciences of Ukraine,
4 Mystetstv Str., Kharkiv, 61002, Ukraine3 State Institution National Antarctic Scientific Center, Ministry of Education and Science of Ukraine,
16 Taras Shevchenko Blvd., Kyiv, 01601, Ukraine
Corresponding author: [email protected]
LOW-FREQUENCY (ELF–VLF) RADIO ATMOSPHERICS STUDYAT THE UKRAINIAN ANTARCTIC AKADEMIK VERNADSKY STATION
ABSTRACT. This paper describes the results of the atmospherics measurements in the extremely low-frequency (ELF) and very
low-frequency (VLF) frequency ranges performed at the Akademik Vernadsky station (64.26W; 65.25S) during February–April
2019. The main objective of the study was the implementation of a single-site technique for monitoring the lower ionosphere
parameters and locating globally distributed powerful lightning discharges. Methods. The receiving and analyzing VLF complex
was used at the station to record two horizontal magnetic and vertical electric components of atmospherics in the frequency
range 750 Hz – 24 kHz. A single-site lightning location method is based on the analysis of tweek-atmospherics (tweeks).It was
implemented in the receiving system software. This allowed obtaining real-time information about lightning position, height
and electron density variations in the lower ionosphere.The records of VLF atmospherics were synchronized via GPS times-
tamps with records of ELF transients resulted from globally distributed powerful lightning discharges. Results of analysis of
tweeks recorded at the Akademik Vernadsky station indicates that lightning discharges are registered at distances from 2,000 km
to about 10,000 km within the azimuthal sector, covering almost the entire South American continent, southern Africa and the
Gulf of Guinea. Practically, no tweeks from the Pacific were recorded. This can be attributed to the non-reciprocity of attenua-
tion of radio waves propagating in the west-east and east-west directions. In addition to the fundamental mode, we observed also
the second and higher order modes of tweeks. This allowed estimating the lower boundary altitude and the electron density in
the lower ionosphere. We demonstrated the advantages of simultaneous recordings of VLF atmospherics and ELF transients.
Employing the vertical electric and two horizontal magnetic components measured by the VLF complex allowed for more ac-
curate and unambiguous determining the source azimuth and resolving polarity of the charge transfer in the parent lightning dis-
charges. Combining the ELF and VLF records, we can determine a distance to lightning and, then, parameters of the current
moment of the lightning discharge. Conclusions. The performed experimental studies has shown the prospect of further combined
ELF–VLF monitoring at the Akademik Vernadsky station, enabling detection of globally distributed powerful lightning discharges
and changes in the lower ionosphere related to various phenomena of space weather, atmospheric and of terrestrial origin.
Keywords: ELF transient, single-site technique, lightning location, ELF-VLF radio waves, Earth-ionosphere waveguide, tweek-
atmospheric, lower ionosphere.
ISSN 1727-7485. Український антарктичний журнал. 2019, № 1 (18)
INTRODUCTION
Natural radio emissions in the extremely low-frequ-
en cy (ELF) and very low-frequency (VLF) bands are
used for determining the coordinates, current and
the charge moment of their sources (lightning dis-
charges), as well as for probing the lower ionosphere
edge. At the same time, the different principles are
used at various frequencies for the location of light-
ning strokes. There are national and commercial sys-
tems for monitoring the local thunderstorm activity
operating at frequencies of tens of kilohertz, such as
Page 2
117ISSN 1727-7485. Український антарктичний журнал. 2019, № 1 (18)
Low-frequency (ELF–VLF) radio atmospherics study at the Akademik Vernadsky station
the National Lightning Detection Network (NLDN).
Such systems cover large areas, for example, the en-
tire territory of the United States, they use from a few
dozen to hundreds of synchronously operating observa-
tories and ensure the accuracy of the lightning loca-
tion of 1 – 2 km (Cummins et al., 1998, 2006, Orville
et al., 2001, 2002, Biagi et al., 2007). A specific fea-
ture of these networks is their locality, they usually
serve the territory of a particular country, and these
locations are usually provided on a commercial basis.
The Worldwide Lightning Location Network
(WWLLN) works at frequencies from units to a hun-
dred of kilohertz (http://wwlln.net/). It exploits si-
multaneous records of atmospherics by the global
network containing several dozen stations. At the
same time, global coverage is obtained with the light-
ning stroke location errors of about 10 km (Abarca et
al, 2010, Abreu et al., 2010, Hutchins et al., 2012).
The lightning location systems operating in the
bands of sonic and ultrasonic frequencies have to use
a significant number of observation points, and this
increases the cost of observations. When recording
the natural bursts of radio emission are in the fre-
quency range of the global electromagnetic (Schu-
mann) resonance covering the interval from 4 to 40
Hz, the position of super-powerful lightning dis-
charges might be monitored from a single observato-
ry. The relevant signal are regarded as Q-bursts or
ELF transients (Ogawa et al., 1967, Kemp and Jones,
1971, Kemp, 1971, Lazebny and Nickolaenko, 1976,
Boccippio et al., 1995, Füllekrug and Constable,
2000, Füllekrug et al., 2000, Sato and Fukunishi, 2003,
Ogawa and Komatsu, 2007, Nickolaenko et al., 2008).
However, the error in determining the coordinates of
super-powerful lightning strokes causing the Q-bursts
or ELF transient events is about 1000 km (Nicko la-
en ko and Hayakawa, 2002, 2014).
A special position among the above-mentioned
lightning location techniques is occupied by the so-
called “Kharkov technique” (Rafalsky et al., 1995a,
1995b). It exploits the signals of tweek-atmospheric
and therefore its application is associated with the
nocturnal propagation conditions. An advantage of
the Kharkov technique is that it simultaneously al-
lows evaluating the effective height of the lower iono-
sphere for both: the particular propagation path with
an error of a few hundred meters and the distance to-
ward the causative lightning discharge with an error
less than 100 km for distances up to 2000 km(Brundell,
et al., 2002).
In the present paper, we apply the advanced Khar-
kov technique (Shvets et al., 2014, 2017). The exper-
iments performed at Ukrainian Antarctic Akademik
Vernadsky station during February–April 2019 meas-
urement campaign allowed locating sources of tweek
atmospherics at distances of up to 10000 km with
concurrent estimating of temporal variations of the
effective height of the ionosphere during the night
(Shvets et al., 2019).
MATERIALS AND METHODS
Receiving and registering equipment
A receiving and registering equipment was used for
measurements of the vertical electric and two hori-
zontal magnetic field components in the VLF range.
The complex has been developed in the A.Ya. Usikov
Institute for Radiophysics and Electronics of Na-
tional Academy of Sciences of Ukraine (IRE NASU)
(Shvets et al., 2016). The required threshold sensitiv-
ity of the VLF receiver was calculated accounting for
characteristics of natural electromagnetic background
obtained in Antarctica (Chrissan and Fraser-Smith,
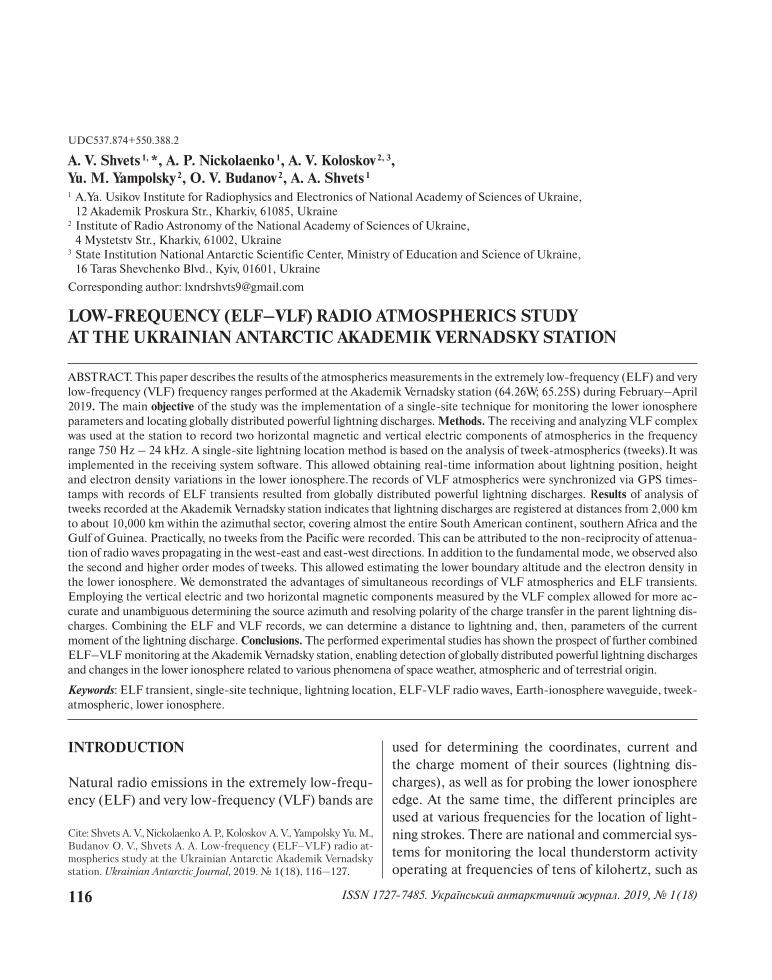
1996a, b). Two orthogonal equilateral triangular mag-
netic frames 3.6 m2 in the area with 64 turns of cop-
per wire of 0.51 mm in diameter were mounted on a
3 m high wooden mast to receive the magnetic field
components. As an electric antenna, an aluminum
rod was used of 0.66 m length, mounted through a
ceramic insulator to the housing of the antenna am-
plifier, which was mounted on top of the mast (Fig. 1).
The calculated spectral density of the device’s noise
in the magnetic channels was 0.85 fT · Hz–1/2, and
0.24 μV · Hz–1/2 for the electrical component.
The complex operates continuously. Signals outputs
of the receiver were digitized with 48 kHz sampling
frequency and stored in hourly binary files contain-
ing the 40 ms waveforms of two horizontal magnetic
and the vertical electric components of atmospher-
ics, which exceeded in amplitude a fixed threshold.
Page 3
118 ISSN 1727-7485. Ukrainian Antarctic Journal. 2019, № 1 (18)
A. V. Shvets, A. P. Nickolaenko, A. V. Koloskov, Yu. M. Yampolsky, O. V. Budanov, A. A. Shvets
The arrival times were fixed with the timestamps from
GPS receiver with the accuracy of the ADC’s sam-
pling period, about 20 microseconds. For this pur-
pose, the PPS were fed to the fourth channel of the
ADC and it was identified from the station’s time-
server through the local network.
Current spectra and waveforms of the input signals
and of the atmospherics together with the coordi-
nates of lightning discharges determined by tweeks
are displayed in real the time on the computer dis-
play. Operation of the VLF complex in the case of
short-term interruption of power supply from the
electrical network is provided by the use of the lap-
top’s battery. It provides power to the data acquisition
system and the entire receiving part of the complex
for up to a few hours. Further, in case of power fail-
ure, after the mains power is restored the computer’s
operating system and data acquisition program will
start automatically, minimizing operator involvement
in maintaining the complex.
Deducing the lower ionosphere parametersby tweek-atmospherics
A method for analyzing the tweeks (Shvets and Go-
rishnaya 2011; Shvets et al., 2017a, 2018) allows to
estimate the cut off frequencies and respective effec-
tive heights of the Earth-ionosphere waveguide in the
ELF-VLF range for the fundamental and the higher
order waveguide modes. It was shown in the works
(Shvets et al., 2014, 2017a, 2017b; Nickolaenko et
al., 2016, Gorishnaya, 2014) based on the analysis of
the experimental tweek records, that with an increase
in the mode number and, accordingly, the frequency
of the incident wave, the effective height of the
waveguide decreases. That is explained by a decrease
in the penetration depth of the low-frequency wave
into the ionosphere with increasing frequency.
We use an approximate theory developed by Rya-
bov (1994) and Sukhorukov (1992a, 1992b, 1996), in
which the features are considered of formation of the
tweek field at night conditions in the ionosphere near
the critical frequencies of the waveguide to interpret
the experimental results obtained in this work. The
following assumptions were used in the model of the
Earth-ionosphere waveguide to obtain analytical de-
pendences connecting the propagation parameters of
the ELF-VLF radio waves with the parameters of the
ionospheric plasma. The waveguide is assumed to be
infinite and flat with perfectly conducting Earth. The
following condition is satisfied for the nighttime lower
ionosphere at frequencies f ≤ 5 kHz : ω << ν << ωBe
,
where ω is the circular frequency of the incident
wave, ν is the collision frequency of electrons with
Fig. 1. The receiving and registering components: 1 – air-loop magnetic antennas; 2 – rod electric antenna; 3 – antenna ampli-
fiers; 4 – main amplifiers; 5 –analog-to-digital converter; 6 – USB power supply for antenna and main amplifiers (5 V –> ± 12 V
convertor); 7 – GPS receiver; 8 – personal computer
1 7
86
4
5
2
3
Page 4
119ISSN 1727-7485. Український антарктичний журнал. 2019, № 1 (18)
Low-frequency (ELF–VLF) radio atmospherics study at the Akademik Vernadsky station
neutral particles, 0Be
e
eBm
ω = is the electron gyrofre-
quency, B0
is the geomagnetic field induction. A
model was used in calculations of a uniform sharply
bounded ionosphere with a lower boundary found at
the height hE (Sukhorukov, 1992a; Ryabov, 1994).
The quasi-longitudinal approximation is applied in
propagation of low-frequency radio waves in the ion-
osphere, which is satisfied under the condition:
2tan2
Be
pe
Iω ωω
>> , where I is the inclination angle, ωpe
is the electron plasma frequency. The critical fre-
quencies of the quasi-transverse electric normal
waves (left-handed polarized), prevailing in the tweek
field (Yamashita, 1978), are expressed as follows (Su-
khorukov, 1992a; Ryabov, 1994):
112cm
E
cmfh mπ μ
⎛ ⎞= −⎜ ⎟
⎝ ⎠ , (1)
where c is the speed of light in vacuum; m is the mode
number; sin
pe
Be I
ωμ
ω ω= is the refraction index at fre-
quency 2 ,2m m
E
cmf fh
ω π= = .
We can obtain estimates of the height hE and elec-
tron concentration Ne at the height h
E from formula
(1) using the measured cut off frequencies of the 1st
and the 2nd order modes, fc1
and fc2
respectively, de-
termined from a tweek record:
21 1
1
1,2 2 1 2
cE c
fch f ff
⎛ ⎞= = −⎜ ⎟− ⎝ ⎠
(2)
( )
2 30 2 1
221 1
2 sin,pe e Be
e pec
M I fNe f f
ω ε ωω
π= =
−.
(3)
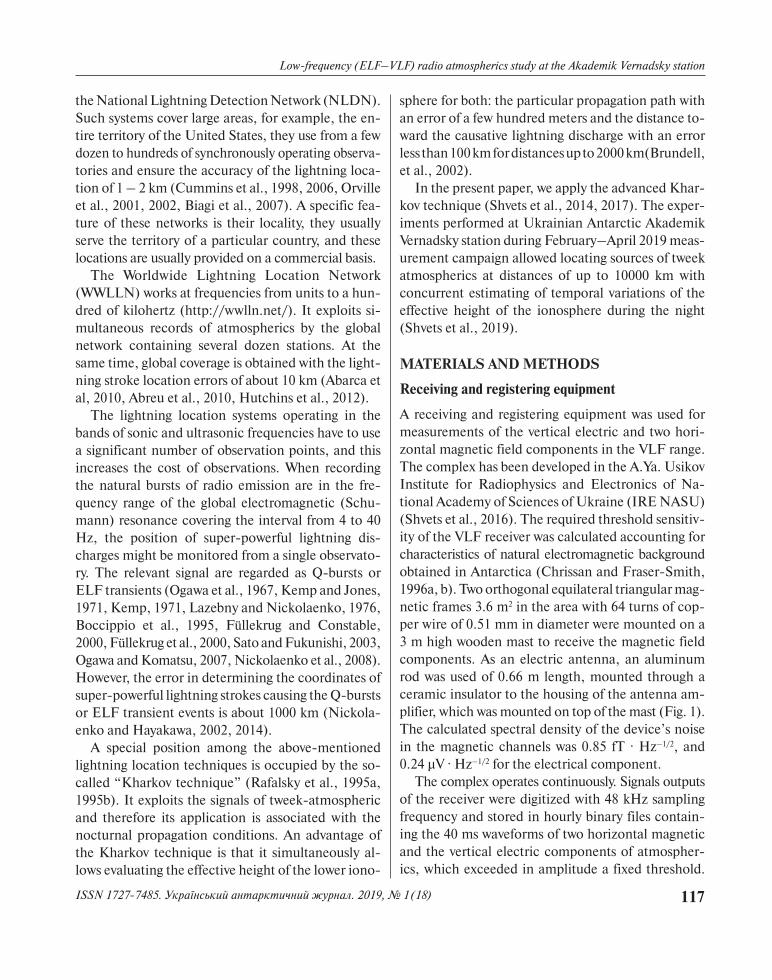
An example of the tweek’s two-mode spectrogram
of the longitudinal magnetic field component is
shown in Fig. 2. The first and second order harmo-
nics correspond to propagating normal waves of the
first and the second order in the waveguide. Black
dots depict the maxima in the spectrogram that were
determined by the automatic identification proce-
dure, and these are used in the solution of the inverse
problem: simultaneous finding the waveguide cut off
frequencies and the source distance.
The following cut off frequencies of the two wave-
guide modes were found fc1
= 1661 Hz, fc2
= 3355 Hz,
while the source – observer distance was ρ = 5325 km.
The source azimuth was 41° counted from the geo-
graphical North. The following parameters of the
ionosphere model were found: the lower ionosphe-
re is hE = 87.3 km and the electron density is N
e =
= 2740 cm–3, both were computed by using Eqs. (2)
and (3). We use in the computations the average over
the propagation path geomagnetic field inclination
I = –52° and the total geomagnetic field induction
B0 = 30000 nT.
The parameters sought correspond to the difference
between the cut off frequencies, this follows from Eqs.
(2) and (3). This significantly increases the require-
ments to the accuracy of frequency estimates. To regu-
larize the estimates of the output parameters, we use
the averaging over the ensemble of tweek records.
Variations in the ionosphere parameters were ob-
tained from the analysis of tweek atmospherics re-
corded during the night of March 28–29, 2019 at
Akademik Vernadsky station. As a whole, 12,592 at-
mospherics were recorded during this night, and
about 2,900 waveforms were identified as tweeks. The
Fig. 2. A spectrogram of the longitudinal magnetic com-
ponent of a tweek with the observed first and second order
harmonics
100
2
4
6
8
10
20 30
τ, ms
f, k
Hz
Page 5
120 ISSN 1727-7485. Ukrainian Antarctic Journal. 2019, № 1 (18)
A. V. Shvets, A. P. Nickolaenko, A. V. Koloskov, Yu. M. Yampolsky, O. V. Budanov, A. A. Shvets
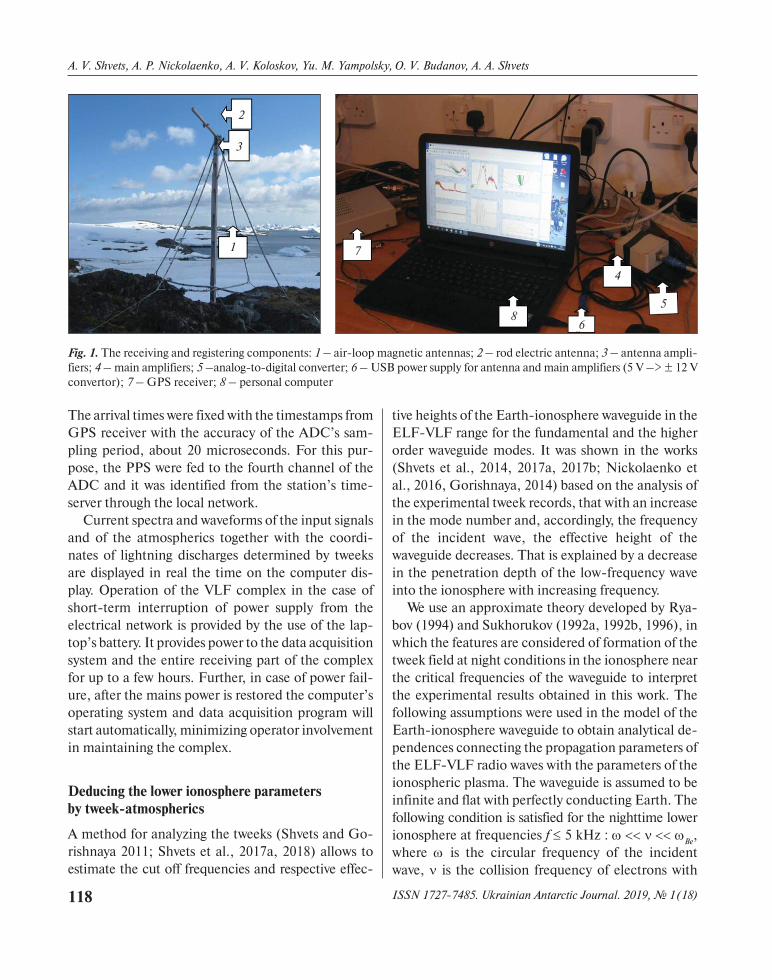
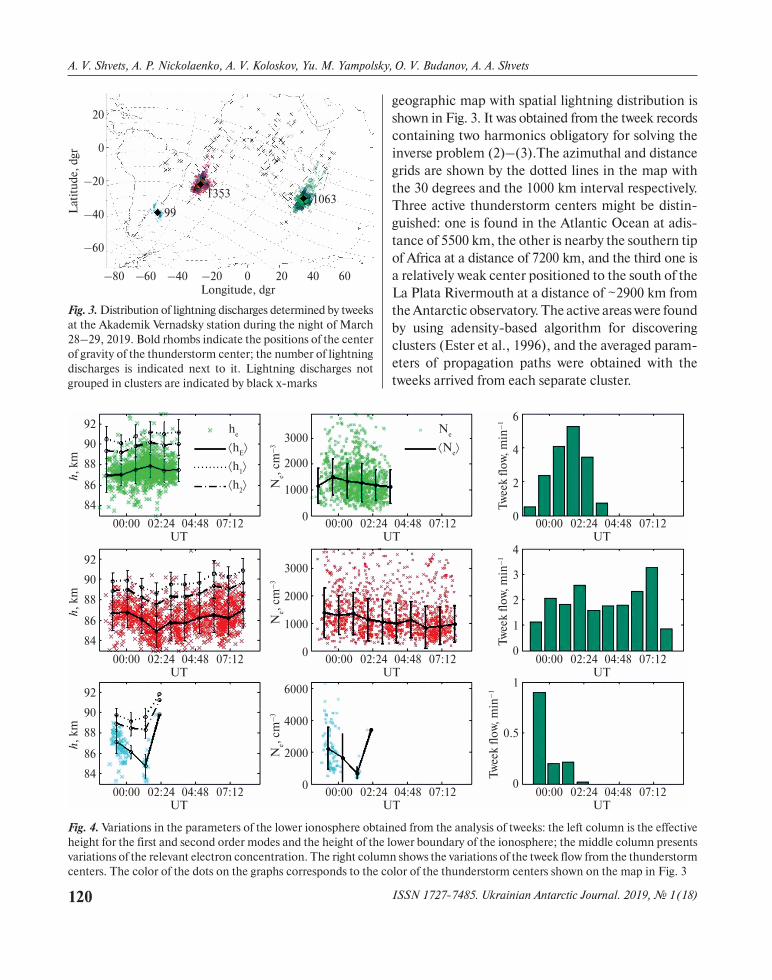
geographic map with spatial lightning distribution is
shown in Fig. 3. It was obtained from the tweek records
containing two harmonics obligatory for solving the
inverse problem (2)–(3).The azimuthal and distance
grids are shown by the dotted lines in the map with
the 30 degrees and the 1000 km interval respectively.
Three active thunderstorm centers might be distin-
guished: one is found in the Atlantic Ocean at adis-
tance of 5500 km, the other is nearby the southern tip
of Africa at a distance of 7200 km, and the third one is
a relatively weak center positioned to the south of the
La Plata Rivermouth at a distance of ~2900 km from
the Antarctic observatory. The active areas were found
by using adensity-based algorithm for discovering
clusters (Ester et al., 1996), and the averaged param-
eters of propagation paths were obtained with the
tweeks arrived from each separate cluster.
Fig. 3. Distribution of lightning discharges determined by tweeks
at the Akademik Vernadsky station during the night of March
28–29, 2019. Bold rhombs indicate the positions of the center
of gravity of the thunderstorm center; the number of lightning
discharges is indicated next to it. Lightning discharges not
grouped in clusters are indicated by black x-marks
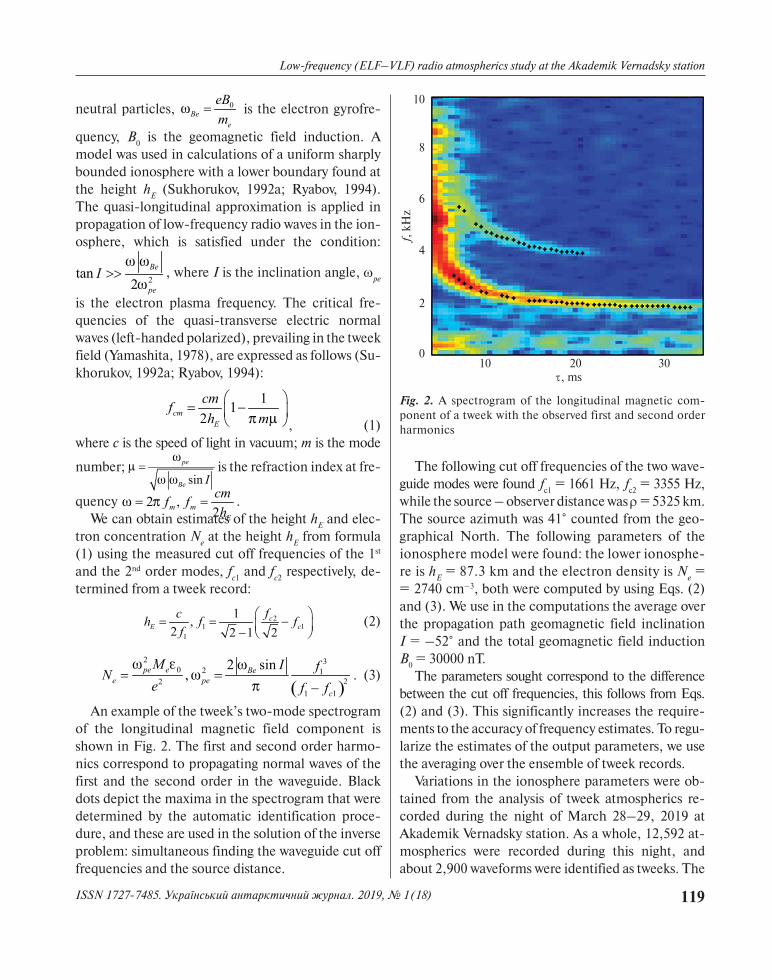
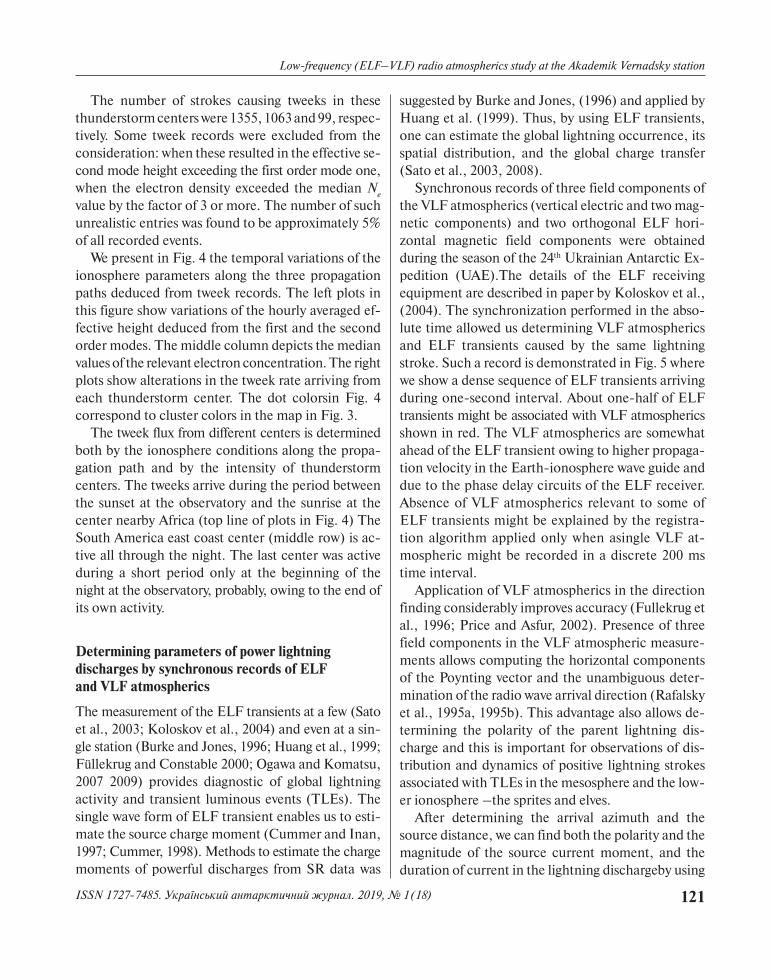
Fig. 4. Variations in the parameters of the lower ionosphere obtained from the analysis of tweeks: the left column is the effective
height for the first and second order modes and the height of the lower boundary of the ionosphere; the middle column presents
variations of the relevant electron concentration. The right column shows the variations of the tweek flow from the thunderstorm
centers. The color of the dots on the graphs corresponds to the color of the thunderstorm centers shown on the map in Fig. 3
92
90
88
86
84
92
90
88
86
84
92
90
88
86
84
6
4
2
0
4
3
2
1
0
1
0.5
0
3000
2000
1000
0
3000
2000
1000
0
6000
4000
2000
0
he
⟨hE⟩
⟨h1⟩
⟨h2⟩
Ne
⟨Ne⟩
h,
km
h,
km
h,
km
Ne,
cm
–3
Ne,
cm
–3
Ne,
cm
–3
Tw
eek
flo
w,
min
–1
Tw
eek
flo
w,
min
–1
Tw
eek
flo
w,
min
–1
00:00
00:00
00:00
00:00
00:00
00:00
00:00
00:00
00:00
02:24
02:24
02:24
02:24
02:24
02:24
02:24
02:24
02:24
04:48
04:48
04:48
04:48
04:48
04:48
04:48
04:48
04:48
UT
UT
UT
UT
UT
UT
UT
UT
UT
07:12
07:12
07:12
07:12
07:12
07:12
07:12
07:12
07:12
20
0
–20
–40
–60
–80 –60 –40 –20 0 20 40 60
La
titu
de,
dgr
Longitude, dgr
1353
99
1063
Page 6
121ISSN 1727-7485. Український антарктичний журнал. 2019, № 1 (18)
Low-frequency (ELF–VLF) radio atmospherics study at the Akademik Vernadsky station
The number of strokes causing tweeks in these
thunderstorm centers were 1355, 1063 and 99, respec-
ti vely. Some tweek records were excluded from the
consideration: when these resulted in the effective se-
cond mode height exceeding the first order mode one,
when the electron density exceeded the median Ne
value by the factor of 3 or more. The number of such
unrealistic entries was found to be approximately 5%
of all recorded events.
We present in Fig. 4 the temporal variations of the
ionosphere parameters along the three propagation
paths deduced from tweek records. The left plots in
this figure show variations of the hourly averaged ef-
fective height deduced from the first and the second
order modes. The middle column depicts the median
values of the relevant electron concentration. The right
plots show alterations in the tweek rate arriving from
each thunderstorm center. The dot colorsin Fig. 4
correspond to cluster colors in the map in Fig. 3.
The tweek flux from different centers is determined
both by the ionosphere conditions along the propa-
gation path and by the intensity of thunderstorm
centers. The tweeks arrive during the period between
the sunset at the observatory and the sunrise at the
center nearby Africa (top line of plots in Fig. 4) The
South America east coast center (middle row) is ac-
tive all through the night. The last center was active
during a short period only at the beginning of the
night at the observatory, probably, owing to the end of
its own activity.
Determining parameters of power lightningdischarges by synchronous records of ELFand VLF atmospherics
The measurement of the ELF transients at a few (Sato
et al., 2003; Koloskov et al., 2004) and even at a sin-
gle station (Burke and Jones, 1996; Huang et al., 1999;
Füllekrug and Constable 2000; Ogawa and Komatsu,
2007 2009) provides diagnostic of global lightning
activity and transient luminous events (TLEs). The
single wave form of ELF transient enables us to esti-
mate the source charge moment (Cummer and Inan,
1997; Cummer, 1998). Methods to estimate the charge
moments of powerful discharges from SR data was
suggested by Burke and Jones, (1996) and applied by
Huang et al. (1999). Thus, by using ELF transients,
one can estimate the global lightning occurrence, its
spatial distribution, and the global charge transfer
(Sato et al., 2003, 2008).
Synchronous records of three field components of
the VLF atmospherics (vertical electric and two mag-
netic components) and two orthogonal ELF hori-
zontal magnetic field components were obtained
during the season of the 24th Ukrainian Antarctic Ex-
pedition (UAE).The details of the ELF receiving
equipment are described in paper by Koloskov et al.,
(2004). The synchronization performed in the abso-
lute time allowed us determining VLF atmospherics
and ELF transients caused by the same lightning
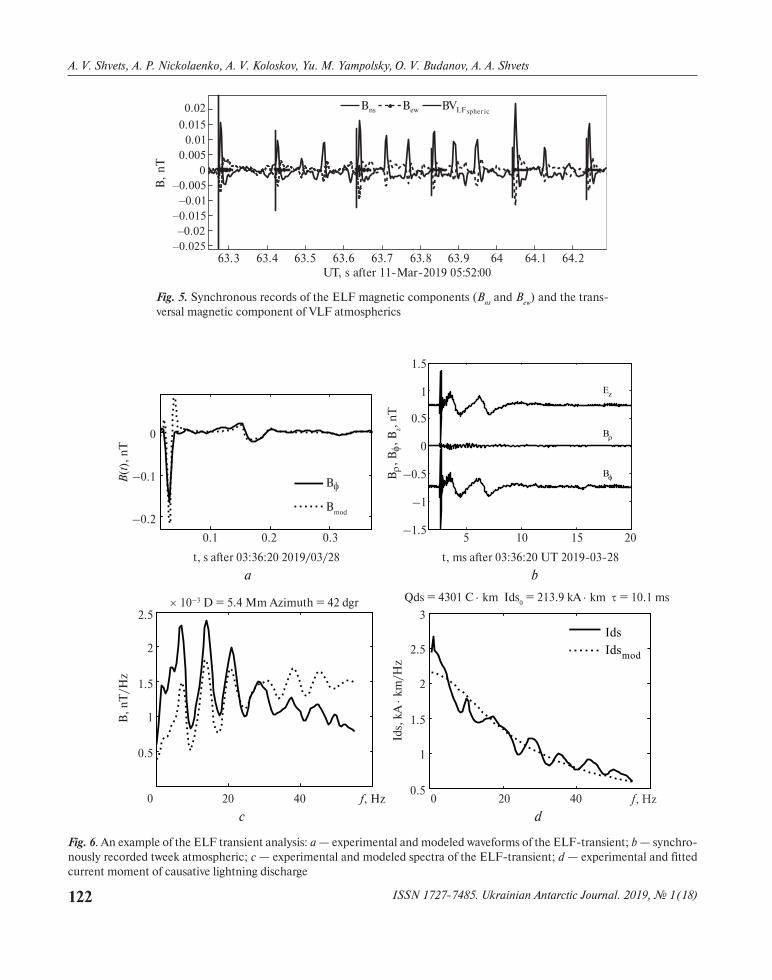
stroke. Such a record is demonstrated in Fig. 5 where
we show a dense sequence of ELF transients arriving
during one-second interval. About one-half of ELF
transients might be associated with VLF atmospherics
shown in red. The VLF atmospherics are somewhat
ahead of the ELF transient owing to higher propaga-
tion velocity in the Earth-ionosphere wave guide and
due to the phase delay circuits of the ELF receiver.
Absence of VLF atmospherics relevant to some of
ELF transients might be explained by the registra-
tion algorithm applied only when asingle VLF at-
mospheric might be recorded in a discrete 200 ms
time interval.
Application of VLF atmospherics in the direction
finding considerably improves accuracy (Fullekrug et
al., 1996; Price and Asfur, 2002). Presence of three
field components in the VLF atmospheric measure-
ments allows computing the horizontal components
of the Poynting vector and the unambiguous deter-
mination of the radio wave arrival direction (Rafalsky
et al., 1995a, 1995b). This advantage also allows de-
termining the polarity of the parent lightning dis-
charge and this is important for observations of dis-
tribution and dynamics of positive lightning strokes
associated with TLEs in the mesosphere and the low-
er ionosphere –the sprites and elves.
After determining the arrival azimuth and the
source distance, we can find both the polarity and the
magnitude of the source current moment, and the
duration of current in the lightning dischargeby using
Page 7
122 ISSN 1727-7485. Ukrainian Antarctic Journal. 2019, № 1 (18)
A. V. Shvets, A. P. Nickolaenko, A. V. Koloskov, Yu. M. Yampolsky, O. V. Budanov, A. A. Shvets
Fig. 5. Synchronous records of the ELF magnetic components (Bns
and Bew
) and the trans-
versal magnetic component of VLF atmospherics
IdsIdsmod
Bφ
Bρ
Ez
BφBmod
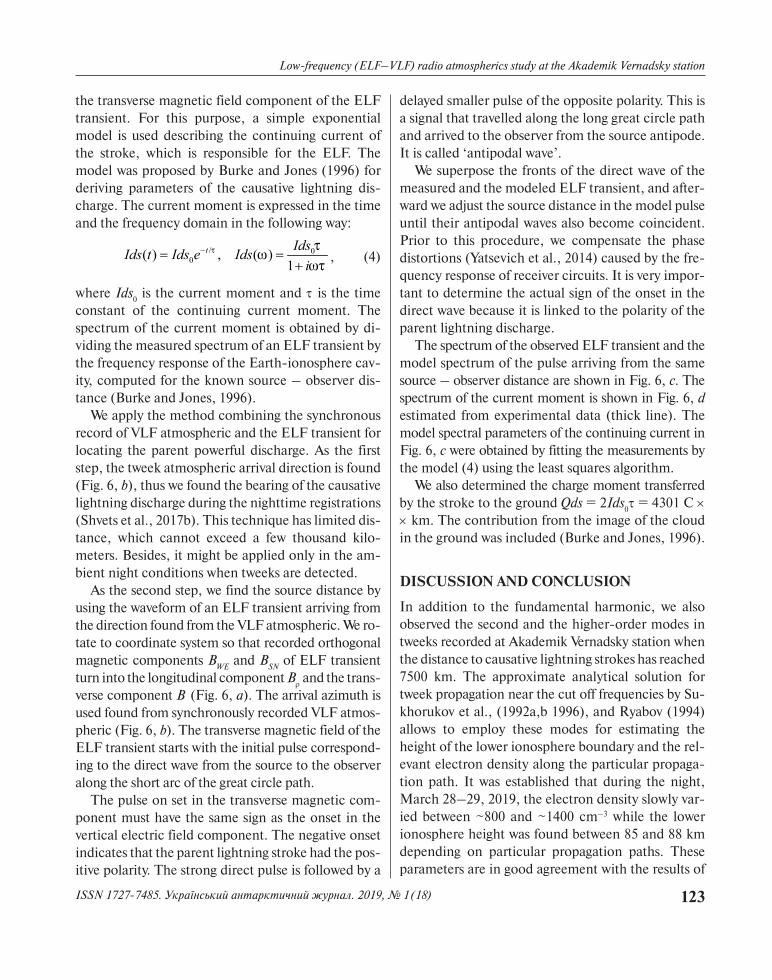
Fig. 6. An example of the ELF transient analysis: a — experimental and modeled waveforms of the ELF-transient; b — synchro-
nously recorded tweek atmospheric; c — experimental and modeled spectra of the ELF-transient; d — experimental and fitted
current moment of causative lightning discharge
a b
c d
f, Hz
0
–0.1
–0.2
2.5
2
1.5
1
0.5
0
3
2.5
2
1.5
1
0.5
B(t
), n
TB
, n
T/H
z
Bφ
Bmod
Bρ,
Bφ,
Bz,
nT
0.1
t, s after 03:36:20 2019/03/28
× 10–3 D = 5.4 Mm Azimuth = 42 dgr
t, ms after 03:36:20 UT 2019-03-28
Ids,
kA
⋅ k
m/H
z
Qds = 4301 C ⋅ km Ids0 = 213.9 kA ⋅ km τ = 10.1 ms
0.30.2 5 10 15 20
1.5
1
0.5
0
–0.5
–1
–1.5
20 20040 40f, Hz
Page 8
123ISSN 1727-7485. Український антарктичний журнал. 2019, № 1 (18)
Low-frequency (ELF–VLF) radio atmospherics study at the Akademik Vernadsky station
the transverse magnetic field component of the ELF
transient. For this purpose, a simple exponential
model is used describing the continuing current of
the stroke, which is responsible for the ELF. The
model was proposed by Burke and Jones (1996) for
deriving parameters of the causative lightning dis-
charge. The current moment is expressed in the time
and the frequency domain in the following way:
/ 00( ) , ( )
1t IdsIds t Ids e Ids
iτ τω
ωτ−= =
+, (4)
where Ids0 is the current moment and τ is the time
constant of the continuing current moment. The
spectrum of the current moment is obtained by di-
viding the measured spectrum of an ELF transient by
the frequency response of the Earth-ionosphere cav-
ity, computed for the known source – observer dis-
tance (Burke and Jones, 1996).
We apply the method combining the synchronous
record of VLF atmospheric and the ELF transient for
locating the parent powerful discharge. As the first
step, the tweek atmospheric arrival direction is found
(Fig. 6, b), thus we found the bearing of the causative
lightning discharge during the nighttime registrations
(Shvets et al., 2017b). This technique has limited dis-
tance, which cannot exceed a few thousand kilo-
meters. Besides, it might be applied only in the am-
bient night conditions when tweeks are detected.
As the second step, we find the source distance by
using the waveform of an ELF transient arriving from
the direction found from the VLF atmospheric. We ro-
tate to coordinate system so that recorded orthogonal
magnetic components BWE
and BSN
of ELF transient
turn into the longitudinal component Bρ and the trans-
verse component B (Fig. 6, a). The arrival azimuth is
used found from synchronously recorded VLF atmos-
pheric (Fig. 6, b). The transverse magnetic field of the
ELF transient starts with the initial pulse correspond-
ing to the direct wave from the source to the observer
along the short arc of the great circle path.
The pulse on set in the transverse magnetic com-
ponent must have the same sign as the onset in the
vertical electric field component. The negative onset
indicates that the parent lightning stroke had the pos-
itive polarity. The strong direct pulse is followed by a
delayed smaller pulse of the opposite polarity. This is
a signal that travelled along the long great circle path
and arrived to the observer from the source antipode.
It is called ‘antipodal wave’.
We superpose the fronts of the direct wave of the
measured and the modeled ELF transient, and after-
ward we adjust the source distance in the model pulse
until their antipodal waves also become coincident.
Prior to this procedure, we compensate the phase
distortions (Yatsevich et al., 2014) caused by the fre-
quency response of receiver circuits. It is very impor-
tant to determine the actual sign of the onset in the
direct wave because it is linked to the polarity of the
parent lightning discharge.
The spectrum of the observed ELF transient and the
model spectrum of the pulse arriving from the same
source – observer distance are shown in Fig. 6, c. The
spectrum of the current moment is shown in Fig. 6, d
estimated from experimental data (thick line). The
model spectral parameters of the continuing current in
Fig. 6, c were obtained by fitting the measurements by
the model (4) using the least squares algorithm.
We also determined the charge moment transferred
by the stroke to the ground Qds = 2Ids0τ = 4301 C ×
× km. The contribution from the image of the cloud
in the ground was included (Burke and Jones, 1996).
DISCUSSION AND CONCLUSION
In addition to the fundamental harmonic, we also
observed the second and the higher-order modes in
tweeks recorded at Akademik Vernadsky station when
the distance to causative lightning strokes has reached
7500 km. The approximate analytical solution for
tweek propagation near the cut off frequencies by Su-
khorukov et al., (1992a,b 1996), and Ryabov (1994)
allows to employ these modes for estimating the
height of the lower ionosphere boundary and the rel-
evant electron density along the particular propaga-
tion path. It was established that during the night,
March 28–29, 2019, the electron density slowly var-
ied between ~800 and ~1400 cm–3 while the lower
ionosphere height was found between 85 and 88 km
depending on particular propagation paths. These
parameters are in good agreement with the results of
Page 9
124 ISSN 1727-7485. Ukrainian Antarctic Journal. 2019, № 1 (18)
A. V. Shvets, A. P. Nickolaenko, A. V. Koloskov, Yu. M. Yampolsky, O. V. Budanov, A. A. Shvets
rocket measurements of the electron density profiles
(Friedrich et al., 2018), which demonstrated very steep
growth of electron concentration from 1 to ~1000 cm–3
in the altitude interval 80–90 km combined with
much slower variations at higher altitudes.
We demonstrated the advantages of synchronous
records of VLF atmospherics and ELF transients.
First, employing the vertical electric and two orthog-
onal magnetic components measured by the VLF
complex allows the accurate and unambiguous find-
ing of the source azimuth. This also allows establish-
ing the polarity of parent lightning strokes. Using
synchronous records of ELF transients and tweek at-
mospherics, we can determine the distance to the
lightning discharge and then, the parameters of the
current moment of this stroke. A novel technique was
also applied to determine the distance toward the
lightning discharge by matching the pulsed wave-
forms corresponding to the short and the long arcs of
the great circle path. The technique was tested on the
model ELF transient waveforms and afterward, it was
applied toward experimentally measured signals. In
this case, the source azimuth was established from
the VLF atmospheric while the source – observer
distance was found by using the ELF transient. This
last technique allowed obviating the limitations aris-
ing in analysis of ELF transients when employing the
distance found from the tweeks.
Analysis of tweeks recorded at UAS indicates that
lightning discharges were detected at distances from
2,000 km to about 10,000 km covering a wide area
that includes almost entire South American conti-
nent, southern Africa and the Gulf of Guinea. Prac-
tically, no tweeks were recorded from the Pacific.
This might be explained by the higher attenuation of
radio waves propagating from west to east direction
and, probably, to relatively low level of lightning ac-
tivity over the ocean at night. The total number of
tweeks registered by automated distinguishing system
ranged from about 1,000 to 10,000 during different
nights. This from 10 to 40% of the total number of
atmospherics arrived.
Our experimental study demonstrates the prospects
of combined ELF–VLF monitoring at the UAS, which
enables continuous nocturnal detection of the globally
distributed powerful lightning discharges and the
changes in the lower ionosphere related to various
processes of atmospheric and terrestrial origin and
the phenomena in the space weather.
Acknowledgements.The authors express their grati-
tude to the State Institution National Antarctic Sci-
entific Center, Ministry of Education and Science of
Ukraine (http://uac.gov.ua) for partly funding within
the research work (0119U003049, 0119U103575,
0119U103674), and for organizational and logistical
support of these studies at Akademik Vernadsky station.
The topic of this study corresponds to the main scien ti-
fic tasks of the departmental research works “Inversiya”
(0117U004040) and “Yatagan-3” (0116U000035).
REFERENCES
1. Abarca, S. F., Corbosiero, K. L., Galarneau, T. J. 2010.
An evaluation of the Worldwide Lightning Location Net-
work (WWLLN) using the National Lightning Detection
Network (NLDN) as ground truth. Journal of Geophysical
Research, 115(D18206). doi:10.1029/2009JD013411.
2. Abreu, D., Chandan, D., Holzworth, R. H., Strong, K.
2010. A performance assessment of the World Wide
Lightning Location Network (WWLLN) via comparison
with the Canadian Lightning Detection Network (CLDN).
Atmos. Measure. Techniques, 3(4), 1143–1153. doi:10.5194/
amt- 3-1143-2010.
3. Biagi, C. J., Cummins, K. L., Kehoe, K. E., Krider, E. P.
2007. National Lightning Detection Network (NLDN)
performance in southern Arizona, Texas, and Oklahoma
in 2003–2004. Journal of Geophysical Research, 112(D0
5208). doi:10.1029/2006JD007341.
4. Boccippio, D. J.,Williams, E.R., Heckman, S.J., Lyons,
W.A., Baker, I.T., Boldi, R. 1995. Sprites, ELF transients
and positive ground strokes. Science, 269, 1088 – 1091.
5. Brundell, J.B., Rodger, C.J., Dowden, R.L. 2002. Valida-
tion of single-station lightning location technique. Radio
Sci., 37 (4). doi:10.1029/2001RS002477.
6. Burke, C. P., Jones, D. L. 1996. On the polarity and con-
tinuing currents in unusually large lightning flashes de-
duced from ELF events. Journal of Atmospheric and Ter-
resfrial Physics, 58(5), 531—540.
7. Chrissan, D.A., Fraser-Smith, A.C. 1996a. Seasonal Var-
iations of Globally Measured ELF / VLF Radio Noise.
Technical Report D177-1. Stanford University Dept. of
Electrical Engineering, STAR Lab.
8. Chrissan, D.A., Fraser-Smith, A.C. 1996b. Seasonal Va-
ria tions of Globally Measured ELF / VLF Radio Noise.
Radio Science, 31(5), 1141—1152.
Page 10
125ISSN 1727-7485. Український антарктичний журнал. 2019, № 1 (18)
Low-frequency (ELF–VLF) radio atmospherics study at the Akademik Vernadsky station
9. Ester, M., Kriegel, H.-P., Sander, J., Xu, X. 1996. A den-
sity-based algorithm for discovering clusters in large spa-
tial databases with noise. Proceedings of 2nd International
Conference on Knowledge Discovery and Data Mining
(KDD-96). 226–231.
10. Cummer, S. A., Inan, U. S. 1997. Measurement of charge
transfer in sprite-producing lightning using ELF radio at-
mospherics. Geophysical Research Letters, 24, 1731–1734.
11. Cummer, S. A., Inan, U. S., Bell, T. F., Barrington-
Leigh, C. P. 1998. ELF Radiation Produced by Electrical
Currents in Sprites. Geophysical Research Letters, 25(8),
1281—1284.
12. Cummins, K. L., Murphy, M. J., Bardo, E. A., Hiscox,
W. L., Pyle, R. B., Pifer, A. E. 1998. A combined TOA/
MDF technology upgrade of the U.S. National Lightning
Detection Network. J. Geophys. Res., 103, 9035–9044.
13. Cummins, K. L., Cramer, J. A., Biagi, C. J., Krider, E. P.,
Jerauld, J., Uman, M. A., Rakov, V. A. 2006. The U. S.
National Lightning Detection Network: Post-upgrade
status. Second Conference on Meteorological Applications
of Lightning Data. Am. Meteorol. Soc., Atlanta, Ga., 29
Jan. to 2 Feb.
14. Friedrich, M., Pock, C., Torkar, K. 2018. FIRI-2018, an
updated empirical model of the lower ionosphere. Jour-
nal of Geophysical Research: Space Physics, 123, 6737–
6751. doi: https://doi.org/10.1029/2018JA025437.
15. Füllekrug, M., Reising, S.C., Lyons, W. A. 1996. On the
accuracy of arrival azimuth determination of sprite-asso-
ciated lightning flashes by Earth-ionosphere cavity reso-
nances. Geophys. Res. Lett., 23(25), 3691−3694.
16. Füllekrug, M., Constable, S. 2000. Global triangulation
of lightning discharges. Geophys. Res. Lett., 27, 333−336.
17. Füllekrug, M., Constable, S., Heinson, G., Sato, M.,
Takahashi, Y., Price, C., Williams, E. 2000. Global lightning
acquisition system installed. EOS Trans AGU 81(30):333.
18. Gorishnya Y. V. 2014. Electron density and lower iono-
sphere height estimations by results of analysis of multi-
modal tweek-atmospherics. Radiophysics and electronics,
19(1), 20—28. (In Russian).
19. Huang, E., Williams, E., Boldi, R., Heckman, S., Lyons, W.,
Taylor, M., Nelsonfi,T., Won, C. 1999. Criteria for sprites
and elves based on Schumann resonance observations.
Journal of Geophysical Research, 104(D14), 16,943—16,964.
20. Hutchins, M.L., Holzworth, R. H., Brundell, J. B., Ro-
dger, C. J. 2012. Relative detection efficiency of the World
Wide Lightning Location Network. Radio Science, 47
(RS6005). doi:10.1029/2012RS005049.
21. Kemp, D.T., Jones, D. Ll. 1971. A new technique for
analysis of transient ELF electromagnetic disturbances
within the Earth−ionosphere cavity. J. Atmos. Terr. Phys.,
33, 567−572.
22. Kemp, D.T. 1971. The global location of large lightning
discharges from single station observations of ELF distur-
bances in the Earth−ionosphere cavity. J. Atmos. Terr.
Phys., 33, 919−928.
23. Koloskov, A. V., Budanov, O. V., Bezrodny, V. G., Yam-
polski, Yu. M. 2004. Location of Superpowerful Light-
ning Flashes through Polarization Magnetic Measure-
ments in Schumann Resonance Waveband. Radio Physics
and Radio Astronomy, 9(4), 391—403.
24. Lazebny, B.V., Nickolaenko, A.P. 1976. Synchronous ob-
servations of the ELF bursts in the frequency range of
the Schumann resonances. Geomagnetism and Aerono-
mia, 16(1), 121—126, (in Russian).
25. Nickolaenko, A. P., Hayakawa, M., Ogawa, T., Komatsu,
M. 2008. Q-bursts: A comparison of experimental and
computed ELF waveforms. Radio Sci., 43(RS4014). doi:
10.1029/2008RS003838.
26. Nickolaenko, A.P., Hayakawa, M. 2002. Resonances in
the Earth-ionosphere cavity. Kluwer Academic Publish-
ers, Dordrecht-Boston-London.
27. Nickolaenko A., Hayakawa, M. 2014. Schumann Reso-
nance for Tyros (Essentials of Global Electromagnetic
Resonance in the Earth–Ionosphere Cavity). Springer Geo-
physics Series XI. Springer Tokyo Heidelberg New York
Dordrecht London. doi: 10.1007/978-4-431-54358-9.
28. Nickolaenko, A.P., Shvets, A.V., Hayakawa, M. 2016.
Extremely Low Frequency (ELF) Radio Wave Propaga-
tion: A review. International Journal of Electronics and Ap-
plied Research (IJEAR), 3(2), 1–91. http://eses.net.in/
online_journal.html.
29. Ogawa, T., Tanaka, Y., Fraser-Smith, A.C., Gendrin, R.
1967. Worldwide simultaneity of a Q−burst in the Schu-
mann resonance frequency range. J. Geomagn. Geoelectr.,
19, 377−384.
30. Ogawa, T, Komatsu, M. 2007. Analysis of Q-burst wave-
forms. Radio Sci., 42(RS2S18). doi:10.1029/2006RS003493.
31. Ogawa, T, Komatsu, M. 2009. Q-bursts from various dis-
tances on the Earth. Atmospheric Research, 538–545.
32. Orville, R. E., Huffines, G. R. 2001. Cloud-to-ground
lightning in the United States: NLDN results in the first
decade, 1989–98. Mon.Weather Rev., 129, 1179–1193.
33. Orville, R. E., Huffines, G. R., Burrows, W. R., Holle, R.
L., Cummins, K. L. 2002. The North-American Light-
ning Detection Network (NALDN)—First results: 1998–
2000. Mon. Weather Rev., 130, 2098–2109.
34. Price, C., Asfur, M., Lyons, W., Nelson, T. 2002. Im-
proved ELF/VLF method for globally geolocating sprite-
producing lightning. Geophys. Res. Lett., 29, 1031, doi:10.
1029/2001GL013519.
35. Rafalsky, V.A., Nickolaenko, A. P., Shvets, A. V., Haya-
kawa, M. 1995a. Location of lightning discharges from a
single station. J. Geoph. Res., 100(D10), 20,829–20,838.
36. Rafalsky, V. A., Shvets, A. V., Hayakawa, M. 1995b. One-
site distance-finding technique for locating lightning dis-
charges. J. Atmos. Terr. Phys., 57, 1255–1261.
Page 11
126 ISSN 1727-7485. Ukrainian Antarctic Journal. 2019, № 1 (18)
A. V. Shvets, A. P. Nickolaenko, A. V. Koloskov, Yu. M. Yampolsky, O. V. Budanov, A. A. Shvets
37. Ryabov, B. S. 1994. Tweek formation peculiarities. Geo-
magnetism And Aeronomy. English Translation, 34(1),
Ru ssian Edition: January–February 1994, 60–66.
38. Sato, M., Fukunishi, H. 2003. Global sprite occurrence
locations and rates derived from triangulation of transient
Schumann resonance events. Geophys. Res. Lett., 30(16),
1859. doi:10.1029/2003GL017291.
39. Sato, M., Takahashi, Y., Yoshida, A., Adachi, T. 2008.
Global distribution of intense lightning discharges and
their seasonal variations. Journal of Physics D: Applied
Physics, 41, 234011 (10pp). doi:10.1088/0022-3727/41/
23/234011.
40. Shvets, A. V., Gorishnyaya, Y. V. 2011. Lightning location
and estimation of the lower ionosphere effective height
using dispersion properties of tweek-atmospherics. Ra-
diophysics and Electronics, 16(4), 53–59, (In Russian).
41. Shvets, A. V., Serdiuk, T. M., Gorishnyaya, Y. V., Hobara,
Y., Hayakawa, M. 2014. Estimating the lower ionosphere
height and lightning location using multimode “tweek”-
atmospherics. JASTP, 108. 1 – 9.
42. Shvets, A.V., Krivonos, A.P., Serdiuk, T.N., Hayakawa,
M. 2017a. A Technique for Automatic Monitoring the
Lower Ionosphere and Lightning Location by Tweek-
Atmospherics. International Journal of Electronics and
Applied Research (IJEAR), 4(1), 37–51. http://eses.net.
in/online_journal.html.
43. Shvets, A.V., Krivonos, A.P., Ivanov, V.K. 2016. A com-
plex for multicomponent measurements of the ELF-VLF
electromagnetic fields. Radiophysics and electronics, 7(21),
4. 49–55. (In Russian).
44. Shvets, A.V., Serdiuk, T., Krivonos, A., Hayakawa, M.
2018. Automatic method for monitoring the lower iono-
sphere and lightning location by tweek-atmospherics.
Proc. of the 2018 International Symposium on Electromag-
netic Compatibility (EMC Europe 2018). Amsterdam, The
Netherlands, August 27—30, 2018, 789—794.
45. Shvets, O.V., Nickolaenko, O.P., Koloskov, O.V., Yam-
polski, Y.M., Budanov, O.V., Shvets, A.O. 2019. First re-
sults of observations of tweek atmospherics at Akademik
Vernadsky station. ІХ МАК 2019, Kyiv, Ukraine, 14—16
May, 2019. 176—178.
46. Shvets, A.V., Krivonos, A.P. 2017b. Preliminary results of
monitoring the lower ionosphere based on the analysis of
tweek-atmospherics. Radiophysics and electronics, 22(3),
14—22. (In Russian).
47. Sukhorukov, A. I., Shimakura, S., Hayakawa, M. 1992a.
Approximate solution for the VLF eigenvalues near cut-
off frequencies in the nocturnal inhomogeneous Earth-
ionosphere waveguide. Planet. Space Sci., 40(10), 1363—
1369.
48. Sukhorukov, A. I., Shimakura, S., Hayakawa, M. 1992b.
On The Additional Dispersion of a Whistler in the Earth-
Ionosphere Waveguide. Planet. Space Sci., 40(9), 1185—
1191.
49. Sukhorukov, A.I. 1996. ELF-VLF atmospheric waveforms
under night-time ionospheric conditions. Annales Geo-
physicae, 14, 33–41. doi:https://doi.org/10.1007/s00585-
996-0033-7.
50. Yamashita, M. 1978. Propagation of tweek atmospherics.
Journal of Atmospheric and Terrestrial Physics, 40. 151—156.
51. Yatsevich, E.I, Shvets, A. V., Nickolaenko, A.P. 2014.
Impact of the ELF Receiver on Characteristics of the
Observed Q-bursts. Radiophysics and Quantum Electron-
ics, 57(3), 176—186. doi: 10.1007/s11141-014-9502-0.
О. В. Швець1,*, О. П. Ніколаєнко1, О. В. Колосков2,3, Ю. М. Ямпольский2, О. В. Буданов2, А. О. Швець1
1 Інститут радіофізики та електроніки ім. О.Я. Усикова, Національна академія наук України,
вул. Академіка Проскури, 12, Харків, 61085, Україна 2 Радіоастрономічний інститут, Національна академія наук України,
вул. Мистецтв, 4, Харків, 61002, Україна3 Державна установа Національний антарктичний науковий центр МОН України,
бульв. Тараса Шевченка, 16, Київ, 01601, Україна
* Автор для кореспонденції: [email protected]
ДОСЛІДЖЕННЯ НИЗЬКОЧАСТОТНИХ ННЧ-ДНЧ РАДІОАТМОСФЕРИКІВ
НА УКРАЇНСЬКІЙ АНТАРКТИЧНІЙ СТАНЦІЇ «АКАДЕМІК ВЕРНАДСЬКИЙ»
РЕФЕРАТ. У даній статті описано результати вимірювань атмосфериків в діапазонах наднизькочастотних (ННЧ) і
дуже низькочастотних (ДНЧ), виконаних на Українській антарктичній станції (УАС) «Академік Вернадський» (64.26 W;
65.25 S) протягом лютого—квітня 2019 року. Основною метою дослідження була реалізація однопозиційного методу
для моніторингу параметрів нижньої іоносфери та локації потужних грозових розрядів, розподілених по всій планеті.
Методи. Приймально-аналізуючий ДНЧ-комплекс використовувався на станції для реєстрації двох горизонтальних
магнітних і вертикальної електричної компоненти атмосфериків в діапазоні частот 750 Гц — 24 кГц. Однопозиційний
метод локації блискавок заснований на аналізі твік-атмосфериків (твіків) і реалізований в програмному забезпеченні
Page 12
127ISSN 1727-7485. Український антарктичний журнал. 2019, № 1 (18)
Low-frequency (ELF–VLF) radio atmospherics study at the Akademik Vernadsky station
приймальної системи. Записи ДНЧ атмосфериків були синхронізовані з допомогою часових міток GPS-приймача із
записами перехідних ННЧ процесів, викликаних глобально розподіленими потужними грозовими розрядами. Ре-
зультати аналізу твіків, зареєстрованих на УАС «Академік Вернадський», вказують на те, що розряди блискавки реє-
струються на відстанях від 2000 км до, приблизно, 10 000 км в межах азимутального сектора, що охоплює майже весь
континент Південної Америки, південь Африки і Гвінейську затоку. Практично жодного твіка з Тихого океану не було
зафіксовано. Це можна пояснити обопільним ослабленням радіохвиль, що поширюються в напрямках захід—схід і
схід—захід. Окрім основного типу нормальних хвиль в твіках спостерігались нормальні хвилі другого і більш високих
порядків. Це дозволило оцінити висоту нижньої межі і щільність електронів в нижній іоносфері. Представлено пере-
ваги одночасного запису ДНЧ атмосфериків і перехідних ННЧ процесів. Використання вертикальної електричної і
двох горизонтальних магнітних компонент, виміряних комплексом ДНЧ, дозволило однозначно і більш точно визна-
чити азимут джерела і визначити знак заряду який переноситься при розряді блискавки. Поєднуючи записи ННЧ і
ДНЧ, ми можемо визначити дальність до блискавки, а потім параметри токового моменту грозового розряду. Виснов-ки. Проведені експериментальні дослідження показали перспективу подальшого комбінованого ННЧ-ДНЧ моніто-
рингу на УАС «Академік Вернадський», що дозволяє виявляти потужні грозові розряди і зміни в нижній іоносфері,
пов'язані з різними явищами космічної погоди, атмосферного і земного походження.
Ключові слова: перехідні ННЧ процеси, однопозиційний метод локації блискавок, радіохвилі ННЧ-ДНЧ, хвилевід
Земля-іоносфера, твік-атмосферик, нижня іоносфера.