WSRC-RP-95-911 LRAD Soil Surface Contamination Monitor Test and Demonstration at the Savannah River Site (U) by R. A. Sigg Westinghouse Savannah River Company Savannah River Site Aiken. South Carolina 29808 DISCLAIMER This report was prepared as an account of work sponsored by an agency of the United States Government. Neither the United States Government nor any agency thereof, nor any of their employees, makes any warranty, express or implied, or assumes any legal liability or responsi- bility for the accuracy, completeness, or usefulness of any information, apparatus, product, or process disclosed, or represents that its use would not infringe privately owned rights. Refer- ence herein to any specific commercial product, process, or service by trade name, trademark, manufacturer, or otherwise does not necessarily constitute or imply its endorsement, recom- mendation, or favoring by the United States Government or any agency thereof. The views and opinions of authors expressed herein do not necessarily state or reflect those of the United States Government or any agency thereof. DOE Contract No. DE-AC09-89SR18035 ~~ ~ ~~ This paper was prepared in connection with work done under the above contract number with the U. S. Department of Energy. By acceptance of this paper, the publisher and/or recipient acknowledges the U. S. Government's right to retain a nonexclusive, royalty-free license in and to any copyright covering this paper, along with the right to reproduce and to authorize others to reproduce all or part of the copyrighted paper.
Transcript
WSRC-RP-95-911
LRAD Soil Surface Contamination Monitor Test and Demonstration at the Savannah River Site (U)
by R. A. Sigg Westinghouse Savannah River Company Savannah River Site Aiken. South Carolina 29808
DISCLAIMER
This report was prepared as an account of work sponsored by an agency of the United States Government. Neither the United States Government nor any agency thereof, nor any of their employees, makes any warranty, express or implied, or assumes any legal liability or responsi- bility for the accuracy, completeness, or usefulness of any information, apparatus, product, or process disclosed, or represents that its use would not infringe privately owned rights. Refer- ence herein to any specific commercial product, process, or service by trade name, trademark, manufacturer, or otherwise does not necessarily constitute or imply its endorsement, recom- mendation, or favoring by the United States Government or any agency thereof. The views and opinions of authors expressed herein do not necessarily state or reflect those of the United States Government or any agency thereof.
DOE Contract No. DE-AC09-89SR18035 ~~ ~ ~~
This paper was prepared in connection with work done under the above contract number with the U. S. Department of Energy. By acceptance of this paper, the publisher and/or recipient acknowledges the U. S. Government's right to retain a nonexclusive, royalty-free license in and to any copyright covering this paper, along with the right to reproduce and to authorize others to reproduce all or part of the copyrighted paper.
DISCLAIMER
Portions of this document may be illegible in electronic image products. Images are produced from the best available original document.
DISCLAIMER
This report was prepared as an account of work sponsored by an agency of the United States Government. Neither the United States Government nor any agency thereof, nor any of their employees, makes any warranty, express or implied, or assumes any legal liability or responsibility for the accuracy, completeness, or usefulness of my information, apparatus, product, or process disclosed, or represents that its use would not iniiinge privately owned rights. Reference herein to any specific commercial product, process, or service by trade name, trademark, manufacturer, or otherwise does not necessarily constitute or imply its endorsement, recommendation, or favoring by the United States Government or any agency thereof. The views and opinions of authors expressed herein do not necessarily state or reflect those of the United States Government or any agency thereof.
This report has been reproduced directly from the best available copy.
Available to DOE and DOE contractors from the Office of Scientific and Technical Information, P.O. Box 62, Oak Ridge, TN 37831; prices available from (615) 576-8401.
Available to the public from the National Technical Infomiation Service, U.S. Department of Commerce,- 5285 Port Royal Road, Springfield, VA 22161.
WSRC-RP-95-911
LRAD Soil Surface Contamination Monitor Test and Demonstration at the Savannah River Site (U)
Map of the Savannah River Technology Center, The highlighted area is expanded in Figure 2 to show loactions monitored . . . . . . . . . . . . . . . . . . . . . . . 8
Locations Monitored by the LRAD Soil Surface Monitor at SRTC . . . . . . . . . 9
LRAD Soil Surface Contamination Monitor Test and Demonstration at the Savannah River Site (U)
R.A. Sigg and R.C. Hochel
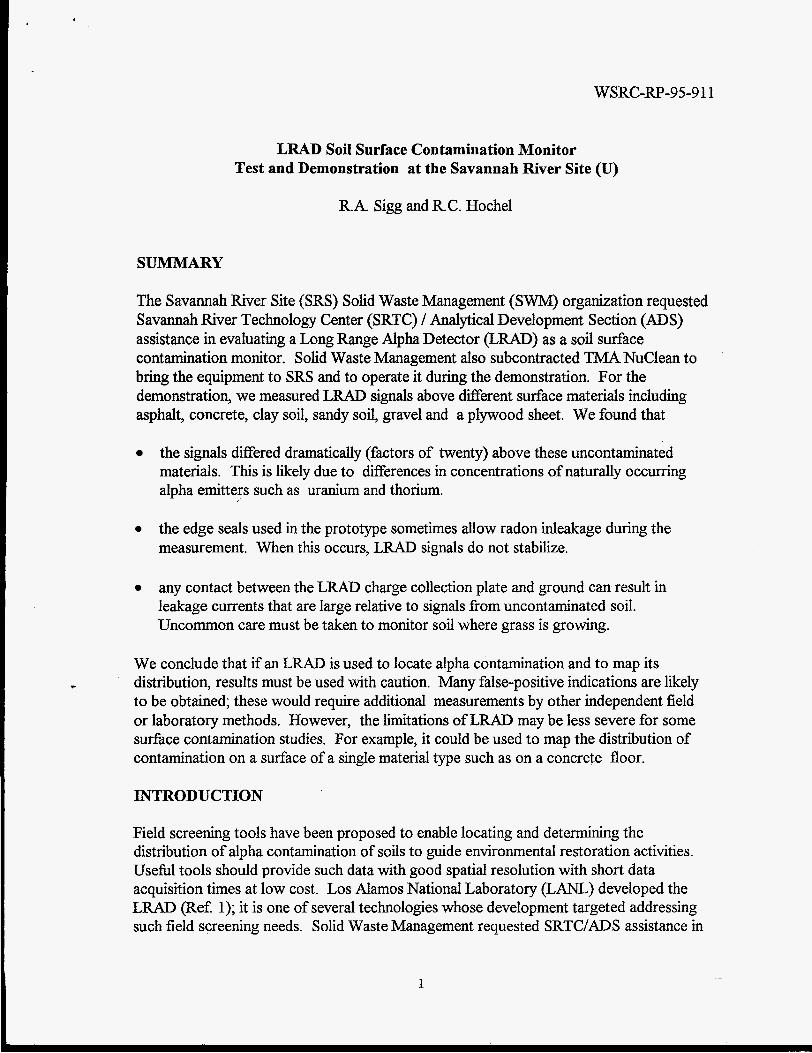
SUMMARY
The Savannah River Site (SRS) Solid Waste Management (SWM) organization requested Savannah River Technology Center (SRTC) / Analytical Development Section (ADS) assistance in evaluating a Long Range Alpha Detector &RAD) as a soil surface contamination monitor. Solid Waste Management also subcontracted TMA NuClean to bring the equipment to SRS and to operate it during the demonstration. For the demonstration, we measured LRAD signals above different surface materials including asphalt, concrete, clay soil, sandy soil, gravel and a plywood sheet. We found that
the signals differed dramatically (factors of twenty) above these uncontaminated materials. This is likely due to differences in concentrations of naturally occurring alpha emitters such as uranium and thorium.
0 the edge seals used in the prototype sometimes allow radon inleakage during the measurement. When this occurs, LRAD signals do not stabilize.
any contact between the LRAD charge collection plate and ground can result in leakage currents that are large relative to signals from uncontaminated soil. Uncommon care must be taken to monitor soil where grass is growing.
We conclude that if an LRAD is used to locate alpha contamination and to map its
to be obtained; these would require additional measurements by other independent field or laboratory methods. However, the limitations of LRAD may be less severe for some surface contamination studies. For example, it could be used to map the distribution of contamination on a surface of a single material type such as on a concrete floor.
c distribution, results must be used with caution. Many false-positive indications are likely
INTRODUCTION
Field screening tools have been proposed to enable locating and determining the distribution of alpha contamination of soils to guide environmental restoration activities. Useful tools should provide such data with good spatial resolution with short data acquisition times at low cost. Los Alamos National Laboratory (La) developed the LRAD (Ref 1); it is one of several technologies whose development targeted addressing such field screening needs. Solid Waste Management requested SRTC/ADS assistance in
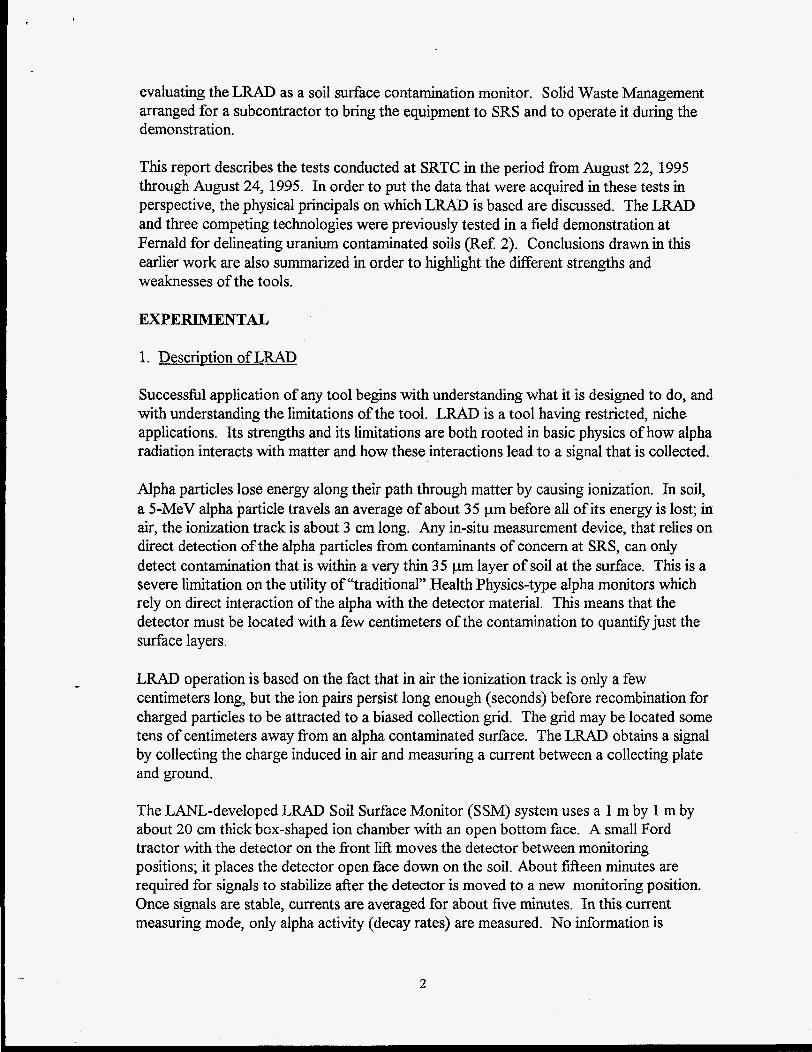
evaluating the LRAD as a soil surface contamination monitor. Solid Waste Management arranged for a subcontractor to bring the equipment to SRS and to operate it during the demonstration.
This report describes the tests conducted at SRTC in the period fi-om August 22, 1995 through August 24, 1995. In order to put the data that were acquired in these tests in perspective, the physical principals on which LRAD is based are discussed. The LRAD and three competing technologies were previously tested in a field demonstration at Fernald for delineating uranium contaminated soils (Ref 2). Conclusions drawn in this earlier work are also summarized in order to highlight the different strengths and weaknesses of the tools.
EXPERIMENTAL
1. Description of LRAD
Successful application of any tool begins with understanding what it is designed to do, and with understanding the limitations of the tool. LRAD is a tool having restricted, niche applications. Its strengths and its limitations are both rooted in basic physics of how alpha radiation interacts with matter and how these interactions lead to a signal that is collected.
Alpha particles lose energy along their path through matter by causing ionization. In soil, a 5-MeV alpha particle travels an average of about 35 pm before all of its energy is lost; in air, the ionization track is about 3 cm long. Any in-situ measurement device, that relies on direct detection of the alpha particles from contaminants of concern at SRS, can only detect contamination that is within a very thin 35 pm layer of soil at the surface. This is a severe limitation on the utility of "traditional" Health Physics-type alpha monitors which rely on direct interaction of the alpha with the detector material. This means that the detector must be located with a few centimeters of the contamination to quantify just the surface layers.
LRAD operation is based on the fact that in air the ionization track is only a few centimeters long, but the ion pairs persist long enough (seconds) before recombination for charged particles to be attracted to a biased collection grid. The grid may be located some tens of centimeters away fi-om an alpha contaminated surface. The LRAD obtains a signal by collecting the charge induced in air and measuring a current between a colIecting plate and ground.
The LANL-developed LRAD Soil Surface Monitor (SSM) system uses a 1 m by 1 m by about 20 cm thick bcx-shaped ion chamber with an open bottom face. A small Ford tractor with the detector on the front lift moves the detector between monitoring positions; it places the detector open face down on the soil. About fifteen minutes are required for signals to stabilize after the detector is moved to a new monitoring position. Once signals are stable, currents are averaged for about five minutes. In this current measuring mode, only alpha activity (decay rates) are measured. No information is
2
available to determine individual alpha particle energies; therefore, LRAD cannot identifjr radionuclides. For this reason, it cannot directly distinguish between alpha activity from naturally occurring uranium, thorium and man-made plutonium on the soil surface. Nor can it directly distinguish between surface alpha contamination and radon gas that emanates from the soil and mixes with air within the LRAD chamber.
The version of LRAD tested at SRS indirectly corrects for radon by incorporating a second compensating ion chamber that is exposed to air without direct exposure to the soil. Once air in the two ion chambers equilibrates, the difference between the signals is a measure of the soil alpha contamination level. The fifteen minutes that are needed for signals to stabilize after relocating LRAD is apparently the time typically needed for radon equilibration. To prevent movement of outside air that would disturb equilibration, a thick foam rubber pad provides an edge seal between the detector and the soil.
The LRAD charge collection plate is biased to +300 V relative to ground. Since low-level alpha activity causes very small currents between the LRAD charge collection plate and ground, any materials other than good insulators providing inadvertent contact between ground and the plate may cause high leakage currents. Such currents, were they not so unreasonably large relative to the currents typically observed, might be misinterpreted.
There are a number of competing technologies (Ref. 2) that afford reliable and less interference prone determinations of alpha contamination for field surveys. Several of these methods do not measure alpha particles directly; instead, they measure other more penetrating radiations (such as x-rays, gamma-rays, or beta particles emitted by a daughter radionuclide) that can be associated with the decay of the alpha-emitting radionuclide. While the sensitivities for some of the other methods are generally not as good as those offered by LRAD, they offer other advantages such as
- they are often more resilient - some are radionuclide specific to minimize false indications from interferences - they can probe below the surface.
c
2. Description of Tests at the Savannah River Technolorn Center
ADS identified several uncontaminated locations within the SRTC Technical Area for monitoring. We measured LRAD signals above different surface materials including asphalt, concrete, clay soil, sandy soil, gravel and a plywood sheet. These measurements were made in order to assess the variability in LRAD results due to differences in concentrations of naturally occurring radionuclides.
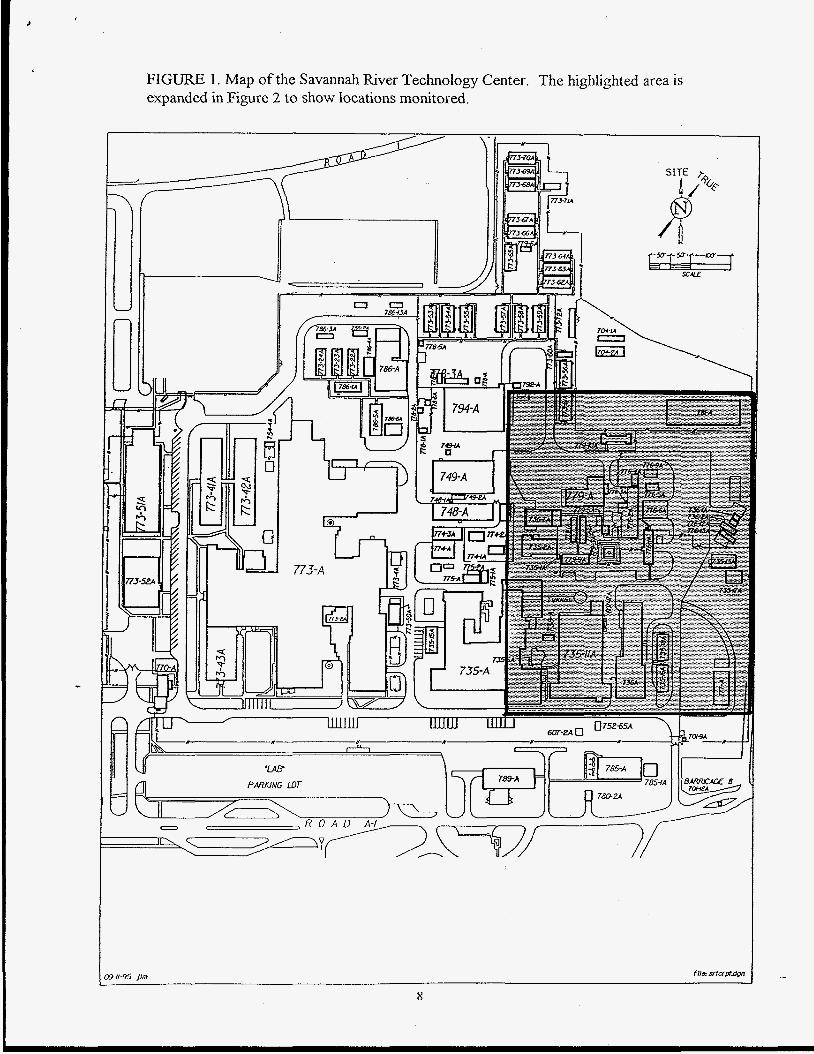
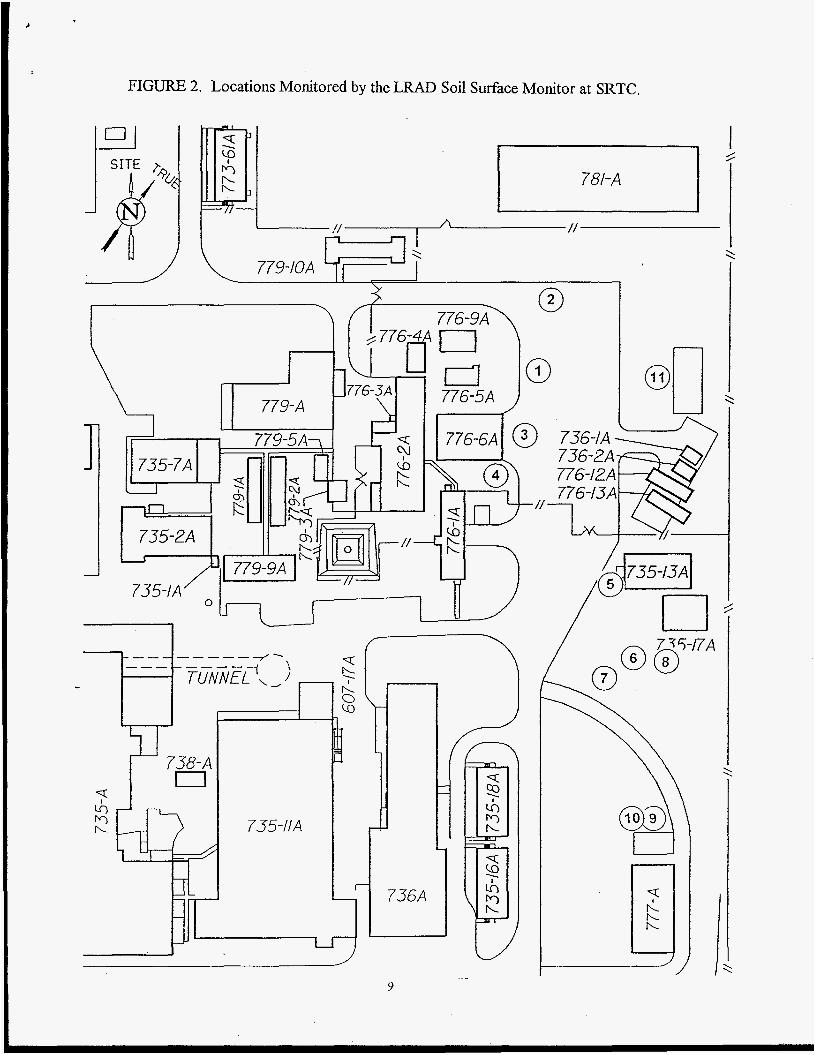
A map of the Savannah River Technology Center (Figure 1) includes a shaded region that is enlarged as Figure 2. Subcontractor personnel placed the LRAD at monitoring locations marked in Figure 2 and collected data shown in Table 1. Table 1 also describes each of the eleven monitoring locations and surface material on which the LRAD was placed. Additional measurements (Table 2) were made at two of these locations with
3
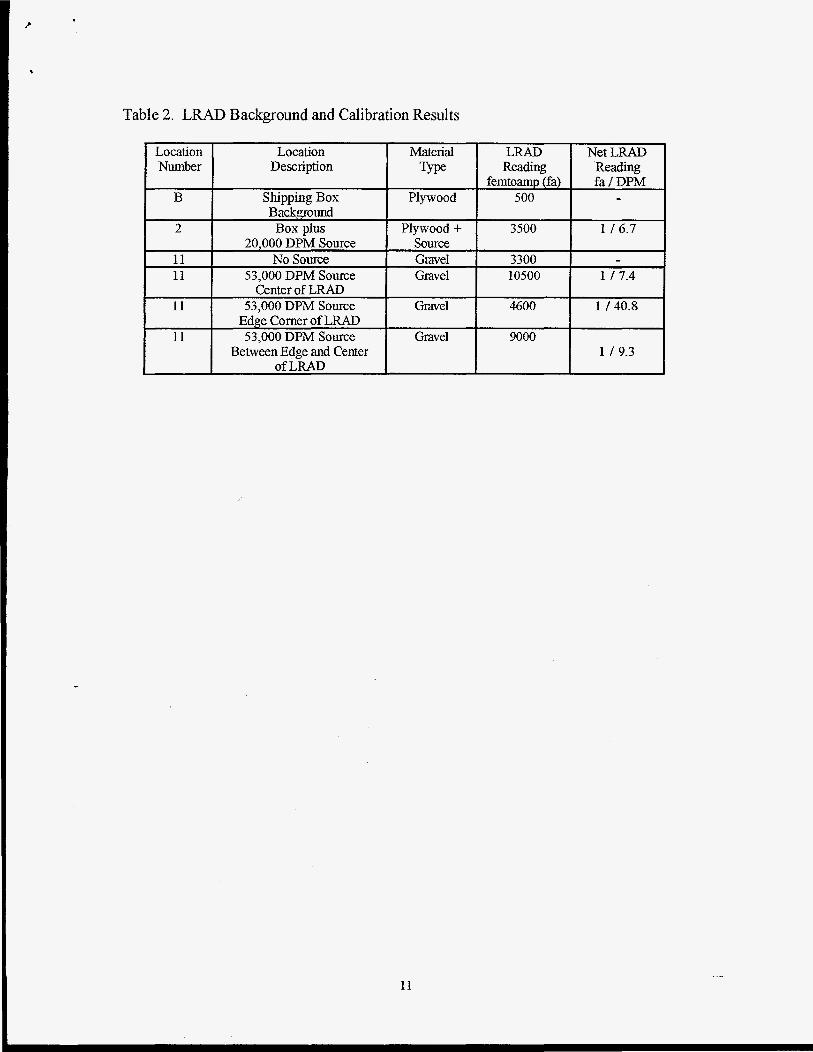
sources having known Pu-239 activity; the change in the signal caused by the sources allowed us to check previous calibrations by LANL. The sources were also used to test the uniformity of LRAD response at several source positions below the detector.
Since plywood is an organic material that is normally free of any significant quantities of naturally occurring alpha-emitting radionuclides, LRAD measurements on the plywood sheet are a measure of detector background from sources other than surface contamination. These might include background sources such as cosmic rays, gamma rays, or inexact radon compensation.
RESULTS AND DISCUSSION
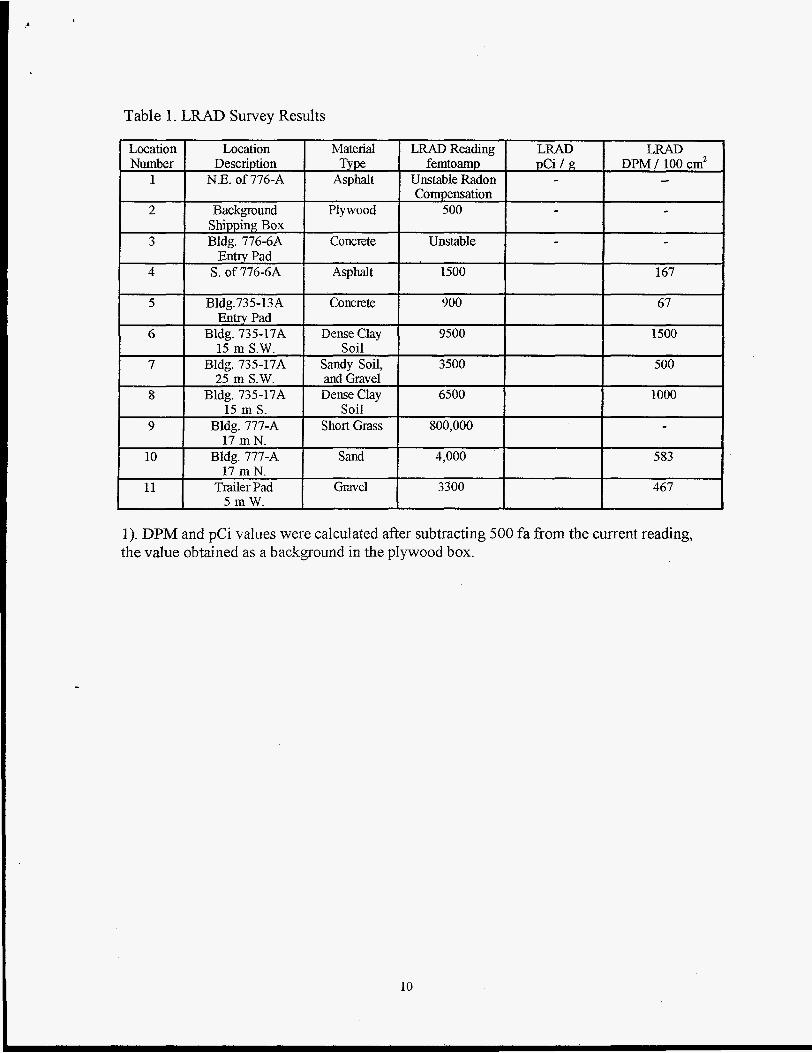
SRTC converted current readings observed in this demonstration to areal and mass concentration estimates by using LANL-provided detector response values. The last two columns of Table 1 show the areal and mass concentrations. SRTC checked the LANL value by measuring the LRAD response to a known Pu-239 alpha sources (Table 2); our results are similar to the 1 fa / 6 DPM reported by LANL (Ref. 1). Based on the surface area of the detector and assumptions involving soil densities and alpha pei-ietration ranges, LANL determined a response of 54 fa / (pCi/g).
Results in Table 1 show that other effects than repeatability are important in evaluating LRAD. Other effects include:
Material Type: Different materials contain different amounts of naturally occurring radionuclides. The readings obtained by placing LRAD on selected clean materials of different types change by about a factor of twenty. If LRAD were used to survey materials of such differing compositions, many false positive indications of contamination would result. These would require follow-up determinations by other field methods that are radionuclide specific, or they would require collecting samples for laboratory analysis.
This is a limitation that can be lived with if recognized. LRAD may be useful for surveying or mapping the distribution of activity on large surfaces of a single material type such as an asphalt roadway or a concrete floor.
Air Leaks: As discussed above, the LRAD corrects for radon by subtracting the current from it second ion chamber that is exposed to air only from the current from the chamber that is exposed to air and soil. After the LRAD is placed on the soil, the edge foam rubber seal is intended to prevent any subsequent introduction of outside air that would disturb equilibration between the chambers. Fifteen minutes are typically needed for signals to stabilize after relocating LRAD. Some measurements at SRTC showed that this seal is not always adequate; in some measurements - particularly those taken while a breeze was blowing - the LRAD did not stabilize. Evidence for such leaks below the foam rubber seal was seen in measurements made at locations #1 and #3. Even though LRAD was sitting on relative smooth asphalt and concrete
4
surfaces at these locations, the instabilities worsened whenever the wind gusts occurred. Current readings did not reach stable plateau values after more than fifteen minutes. In some early measurements in the plywood box, LRAD signals stabilized only when the detector was fixther protected fiom the wind by a plastic tarp. The LRAD tested appeared to be a well-used prototype that was not likely to have been design optimized for repeated use; the foam rubber seal did not appear to be in good condition. Even ifthe seal materials were in good condition, surfaces to be monitored would need to be smooth over the 1 m2 surface.
Leakage Currents: Any inadvertent contact between ground and the charge collection plate may allow leakage currents to flow that are large relative to the very small currents induced by low-level alpha activity. If such data were applied without understanding, it might be falsely interpreted as evidence for the presence of high levels of alpha activity.
Monitoring an area having short blades of grass is cited as an example of this effect. LRAD was positioned on relatively smooth ground with sparse, low cut grass at position 9. The very high and abnormal readings obtained at this location were apparently caused by a blade of grass contacting the charge collection plate. In the Fernald demonstration, LANL required that grass be cut flush with the soil surface, and the clippings were raked off.
Uniform Remonse: While time available for the SRTC demonstration did not allow taking a sufficient number of measurements for a detailed mapping of changes in sensitivity, we found that LRAD response varies across the exposed surface. Current readings were substantially lower for sources near the edges of the detector (Table Z), though they are probably fairly uniform across the major portion of the surface area. In the context of applying LRAD for relative mapping of contamination levels rather than for quantitative determinations, these variations in sensitivity should not be considered limiting.
Statistical Uncertainty: According to LANL (Ref. l), LRAD has the ability to map relative contamination levels though the absolute calibration may be in error. The statistical precision obtained in monitoring an area is +- 10 to 20 pCig. If LRAD is moved, then repositioned without delay on the same spot, precisions of +- 30 pCi/g are obtained. Repeatability is +- 100 pCUg for several measurements made throughout the day.
In tests conducted at Fernald over a ten day period (Ref l), LANL found statistical uncertainties were directly related to measurement time. Since the prototype required 15- min stabilization and 5-min measuring times, shortening the measuring time wouId worsen the uncertainties but would not significantly decrease the assay time. LANL learned that the major source of uncertainty is time of day and soil conditions. Moisture content of the soil can change dramatically under sun or rainstorm conditions; this has a strong influence on LRAD performance due to related changes in
5
! J
soil outgassing, radon levels, and alpha penetration length. LANL noted that variations in humidity levels from 50 to 98% during these measurements did not appear to adversely affect the LRAD.
The SRTC data show that unless the LRAD is applied with caution, the statistical uncertainties cited above are small contributors to the overall uncertainty. The user must pay greater attention to differences in surface materials, possible air leakage, and for soil monitoring possible contact with grass blades than to statistical precision.
CONCLUSIONS
In evaluating an LRAD Soil Surface Monitor, we found that
Signals differed dramatically (factors of twenty) above uncontaminated materials such as plywood, asphalt, concrete, gravel and soils. This is likely due to differences in concentrations of naturally occurring alpha emitters such as uranium and thorium.
When air leakage sometimes occurs around edge seals in the prototype, the very significant compensation signal for radon is not stable.
Any contact between the LRAD charge collection plate and ground can result in very large leakage currents. Extraordinary care must be taken to monitor soil where grass is growing.
In an Integrated Demonstration Program at Fernald (Ref. 2), four technologies were evaluated for mapping uranium concentrations in surface soils. These technologies were wide-area gamma-ray spectrometry, beta scintillation counting, laser-ablation-inductively coupled plasma-atomic emission spectroscopy, and long-range alpha detection. The authors found it difficult to compare data from multiple independent measurement methods. These difficulties were attributed to differences in the basic measurement physics being applied. Some of the methods can measure other more penetrating radiations (such as x-rays, gamma-rays, or beta particles emitted by a daughter radionuclide that can be associated with the decay of the alpha-emitting radionuclide) than alpha particles. While the sensitivities for some of the other methods are generalIy not as good as those offered by LRAD, they offer other advantages. Some are radionuclide specific to minimize false indications from interferences such as radon. The other methods are generally sensitive to contamination deeper than 35 micrometers in the soil. LRAD results correlated less well with laboratory analyses than any of the other methods.
SRTC observations support the Fernald study’s findings. We conclude that if an LRAD is used to locate alpha contamination and to map its distribution, results must be used with caution. Many false-positive indications are likely to be obtained; these wouid require additional measurements by other independent field or laboratory methods. However,
6
the limitations of LRAD may be less severe for some surface contamination studies. For example, it could be used to map the distribution of contamination on a surface of a single material type such as on a concrete floor.
REFERENCES
1. MacArthur, D.W., et aI, LRAD Alpha Soil Monitoring at Fernald, LA-UR-92-3032.
2. Tidwell, V.C., et al, Field Demonstration of Technologies for Delineating Uranium Contaminated Soils, ER’93 Environmental Remediation Conference, Augusta, GA, Oct. 24-28, 1993, Vol. 1, 147.
7
FIGURE 1. Map of the Savannah River Technology Center. The highlighted area is expanded in Figure 2 to show locations monitored.
8
c
FIGURE 2. Locations Monitored by the LRAD Soil Surface Monitor at SRTC.
E I 781-A
I // I A
I M I 3 \ 779-IOA I
- h 738-A
f
735-/1A
"r 11 736A
i' -I
9
Table 1. LRAD Survey Results
I 5 m W . I I I I I 1). DPM and pCi values were calculated after subtracting 500 fa from the current reading, the value obtained as a background in the plywood box.
10
Table 2. LRAD Background and Calibration Results
Between Edge and Center
11
WSRC-RP-95-9 1 1
LRAD Soil Surface Contamination Monitor Test and Demonstration at the Savannah River Site (U)
Distribution:
Solid Waste Management M.B. Hughes, 705-3C A. Gibbs, 724-21E M. Brennan, 705-3C S. Karnowski, 705-3C
Savannah River Technology Center A.L. Blancett, 773-A C.E. Coffey, 773-41A J.C. Griffin, 773-A P.F. Cloessner, 773-A C.W. Jenkins, 773-41A A.L. Boni, 773-A J.E. Halverson, 735-A