Bankinter Group Statutory report prepared pursuant to the Corporations Law and the Commercial Code. Consolidated financial statements prepared by the Board of Directors of Bankinter, S.A. on 14 March 2007.
Transcript
Bankinter Group
Statutory report prepared pursuant to the Corporations
Law and the Commercial Code. Consolidated financial
statements prepared by the Board of Directors of
Bankinter, S.A. on 14 March 2007.
LEGAL GRUPO ingles.qxd 13/6/07 08:44 Página 1
B
LEGAL GRUPO ingles.qxd 13/6/07 08:44 Página 2
Bankinter Group
LEGAL GRUPO ingles.qxd 13/6/07 08:44 Página 3
Consolidated balance sheets at 31 December 2006 and 2005
Consolidated income statements for the years ended 31 December 2006 and 2005
(1) Group description and activities
(2) Accounting standards and criteria applied
(3) Distribution of profit
(4) Deposit Guarantee Fund
(5) Accounting policies and measurement bases
(6) Cash and balances with central banks
(7) Financial assets and liabilities held for trading/Other financial assets at fair value through
profit or loss
(8) Available-for-sale financial assets
(9) Loans and receivables
(10) Held-to-maturity investments
(11) Hedging derivatives (assets and liabilities)
(12) Non-current assets held for sale
(13) Investments
(14) Tangible assets
(15) Intangible assets
(16) Tax assets and liabilities
(17) Prepayments and accrued income and Accrued expenses and deferred income
(18) Other assets and liabilities
(19) Financial liabilities at amortised cost
(20) Liabilities under insurance contracts
(21) Provisions
(22) Equity having the substance of a financial liability
(23) Own funds
(24) Valuation adjustments (equity)
(25) Contingent liabilities and commitments
(26) Transfers of financial assets
(27) Other memorandum items - Financial derivatives
(28) Personnel expenses
(29) Fee and commission income and expense
(30) Interest and similar income/Interest expense and similar charges
BBankinter Group 4
Contents
LEGAL GRUPO ingles.qxd 13/6/07 08:44 Página 4
(31) Gains/losses on financial assets and liabilities
(32) Net exchange differences
(33) Other general administrative expenses
(34) Other operating income and expenses
(35) Other gains/Other losses
(36) Transactions and balances with related parties
(37) Remuneration of and balances with the members of the Board of Directors
(38) Information on the environment
(39) Customer Care Service
(40) Branches, centres and financial agents
(41) Trust and investment services
(42) Fees paid to auditors
(43) Tax matters
(44) Assets and liabilities measured at other than fair value
(45) Risk management policies
(46) Segment reporting
(47) Events after the balance sheet date
(48) Explanation added for translation to English
Directors' report
AppendixesI. Consolidated statements of changes in equity (Consolidated statements of recognised
income and expense)
II. Consolidated cash flow statements
III. Segment reporting
IV. Transactions and balances with related parties
V. Balance sheets for the distribution of 2006 dividends
VI. Balance sheets and income statements of Bankinter, S.A.
at 31 December 2006 and 2005
5Bankinter Group
LEGAL GRUPO ingles.qxd 13/6/07 08:44 Página 5
B
Consolidated Balance Sheets at 31 December 2006 and 2005
Bankinter Group 6
Thousands of Euros 31/12/06 31/12/05 (*)
Assets
Cash and balances with central banks (Note 6) 539,178 435,916
Financial assets held for trading (Note 7)Debt instruments 2,503,479 4,327,317 Other equity instruments 108,664 39,811 Trading derivatives 148,059 267,274 Memorandum item: Loaned or advanced as collateral 1,981,715 4,002,508
2,760,202 4,634,402 Other financial assets at fair value through profit or loss (Note 7)Other equity instruments 24,596 23,884 Memorandum item: Loaned or advanced as collateral - -
24,596 23,884 Available-for-sale financial assets (Note 8)Debt instruments 4,251,163 3,473,735 Other equity instruments 240,399 307,846 Memorandum item: Loaned or advanced as collateral 3,804,929 3,210,431
4,491,562 3,781,581 Loans and receivables (Note 9)Loans and advances to credit institutions 5,387,117 4,205,236 Loans and advances to customers 31,653,807 26,139,388 Other financial assets 186,783 140,153 Memorandum item: Loaned or advanced as collateral - -
37,227,707 30,484,777 Held-to-maturity investments (Note 10) - 448,292 Memorandum item: Loaned or advanced as collateral - 448,292 Changes in the fair value of the hedged items in portfolio hedges of interest rate risk (10,217) (7,464) Hedging derivatives (Note 11) 90,065 86,028 Non-current assets held for sale (Note 12)Tangible assets 3,965 3,827 Other assets - -
106,539 79,396 Tangible assets (Note 14)Property, plant and equipment for own use 319,970 320,666 Investment property 5,300 5,421 Other assets leased out under an operating lease 18,362 76 Memorandum item: Acquired under a finance lease - -
Liabilities under insurance contracts (Note 20) 488,271 622,843
Provisions (Note 21)Provisions for pensions and similar obligations 1,390 10 Provisions for contingent liabilities and commitments 32,040 25,271 Other provisions 131,181 137,294
Contingent commitments (Note 25)Drawable by third parties 7,383,823 5,830,097 Other commitments 336,132 240,058
7,719,955 6,070,155
10,252,721 8,203,395
(*) The data at 31 December 2005 are presented for comparison purposes only.
The accompanying Notes 1 to 48 and Appendixes I to VI are an integral part of the consolidated balance sheet at 31 December 2006.
(
T
C3
LEGAL GRUPO ingles.qxd 13/6/07 08:44 Página 8
9Bankinter Group
Thousands of Euros 31/12/06 31/12/05 (*)
Interest and similar income (Note 30) 1,455,871 1,076,615 Interest expense and similar charges (Note 30) (998,591) (655,656) Return on equity having the substance of a financial liability (11,139) (7,255)Other 987,452 648,401 Income from equity instruments 16,354 9,308 Net interest income 473,634 430,267 Share of results of entities accounted for using the equity method 29,623 24,645
Fee and commission income (Note 29) 286,965 249,677 Fee and commission expense (Note 29) (69,846) (59,978) Insurance activity income 1,694 (75)Insurance and reinsurance premium income 32,960 45,612 Reinsurance premiums paid (6,392) (1,119)Claims paid and other insurance-related expenses (184,271) (185,730)Reinsurance income 2,216 1,242 Net provisions for insurance contract liabilities (135,737) (107,381)Finance income 101,944 102,149 Finance expense (80,500) (69,610)Gains on financial assets and liabilities (net) (Note 31) 49,776 30,684 Held for trading 1,903 3,367 Other financial instruments at fair value through profit or loss 2,767 5,223 Available-for-sale financial assets (27,273) 42,647 Loans and receivables - - Other 72,379 (20,553)Exchange differences (net) (Note 32) 47,756 36,634 Gross income 819,602 711,854 Sales and income from the provision of non-financial services - - Cost of sales - - Other operating income (Note 34) 24,003 18,763 Personnel expenses (Note 28) (227,336) (192,398)Other general administrative expenses (Note 33) (174,940) (160,703) Depreciation and amortisation (24,151) (21,031) Tangible assets (Note 14) (24,034) (21,031) Intangible assets (Note 15) (117) - Other operating expenses (Note 34) (5,532) (4,902) Net operating income 411,646 351,583 Impairment losses (net) 96,898 80,143 Available-for-sale financial assets 1 187 Loans and receivables (Note 9) 97,295 80,340 Held-to-maturity investments - - Non-current assets held for sale (399) (384)Investments 1 - Tangible assets - - Goodwill - - Other intangible assets - - Other assets - - Provisions (net) 5,892 7,035 Finance income from non-financial activities - - Finance expenses of non-financial activities - - Other gains (Note 35) 15,231 7,214 Gains on disposal of tangible assets 886 642 Gains on disposal of investments 20 15 Other 14,325 6,557 Other losses (Note 35) (7,751) (6,174) Losses on disposal of tangible assets 344 35 Losses on disposal of investments 666 124 Other 6,741 6,015 Profit before tax 316,336 265,445 Income tax (Note 43) (107,846) (77,743) Profit from ordinary activities 208,490 187,702 Profit/Loss from discontinued operations - - Consolidated profit for the year 208,490 187,702 Profit/Loss attributed to minority interests - - Profit attributed to the Group (Note 23) 208,490 187,702 Earnings per share (euros) 2.68 2.44Diluted earnings per share (euros) 2.58 2.34
(*) The data at 31 December 2005 are presented for comparison purposes only.
The accompanying Notes 1 to 48 and Appendixes I to VI are an integral part of the consolidated income statement for the year ended 31 December 2006.
Consolidated income statements of the Bankinter Group for the years ended31 December 2006 and 2005
LEGAL GRUPO ingles.qxd 13/6/07 08:44 Página 9
B
Explanatory notes to the consolidated financial statementsfor the year ended 31 December 2006(Amounts in thousands of euros)
(1) Group description and activities
Bankinter, S.A. (“the Bank” or “the Entity”) engages in banking activities and is subject to the rules
and regulations applicable to banks operating in Spain.
In addition to the operations carried on directly by it, the Bank is the head of a group of
subsidiaries that engage in various business activities and which compose, together with it, the
Bankinter Group (“the Group” or “the Bankinter Group”). Therefore, the Bank is obliged to prepare,
in addition to its own individual financial statements, the Group's consolidated financial
statements, which also include the interests in joint ventures and investments in associates.
The Bank’s assets accounted for 99% of the Group’s total assets at 31 December 2006 and 2005.
The Group's consolidated financial statements for 2005 were approved by the shareholders at the
Annual General Meeting of the Bank on 20 April 2006. The 2006 consolidated financial statements
of the Group and the 2006 financial statements of the Bank and substantially all the Group entities
have not yet been approved by their shareholders at the respective Annual General Meetings.
However, the Bank's Board of Directors considers that the aforementioned financial statements will
be approved without any changes.
Bankinter, S.A. was incorporated by public deed executed in Madrid on 4 June 1965 under the
name of Banco Intercontinental Español, S.A. and adopted its present name on 4 May 2004.
The Bank is registered with number 30 at the Special Registry of Banks and Bankers. Its employer
identification number is A-28157360 and it is a member of the Deposit Guarantee Fund with code
number 0128.
Its registered office is located at Paseo de la Castellana 29, 28046 Madrid (Spain). The subsidiaries
composing the Bankinter Group are listed in Note 13, “Investments”. The Group's consolidated
financial statements were prepared in accordance with the accounting policies set forth in the
“Accounting Policies and Measurement Bases” section.
The balance sheets of Bankinter, S.A. at 31 December 2006 and 2005 and the income statements
for the years then ended are presented in Appendix VI.
The securitisation special purpose vehicles Bankinter 12 Fondo de Titulización Hipotecaria,
Bankinter 13 Fondo de Titulización de Hipotecaria and Bankinter 2 Pyme Fondo de Titulización de
Activos were fully consolidated in 2006 for the first time.
Bankinter Internacional, B.V. was dissolved and Bankinter Netherlands B.V. and Prota, S.A. were
sold in 2006.
Bankinter Group 10
LEGAL GRUPO ingles.qxd 13/6/07 08:44 Página 10
(2) Accounting standards and criteria applied
a) Basis of presentation of the consolidated financial statements Under Regulation (EC) no. 1606/2002 of the European Parliament and of the Council of 19 July
2002, all companies governed by the law of an EU Member State and whose securities are admitted
to trading on a regulated market of any Member State must prepare their consolidated financial
statements for the years beginning on or after 1 January 2005 in conformity with the International
Financial Reporting Standards (IFRSs) previously adopted by the European Union.
In order to adapt the accounting system of Spanish credit institutions to the new standards, the
Bank of Spain issued Circular 4/2004, of 22 December, on Public and Financial Reporting Rules and
Formats.
The Group's consolidated financial statements for 2006 were prepared by the Bank's directors
(at the Board meeting on 14 March 2007) in accordance with International Financial Reporting
Standards as adopted by the European Union and taking into account Bank of Spain Circular
4/2004, using the basis of consolidation, accounting policies and measurement bases set forth in
Note 5 and, accordingly, they present fairly the Group's equity and financial position at 31
December 2006, and the consolidated results of its operations, the changes in consolidated equity
(statement of recognised income and expense) and the consolidated cash flows in 2006. These
consolidated financial statements were prepared from the individual accounting records of the
Bank and of each of the companies composing the Group, and include certain adjustments and
reclassifications required to unify the accounting policies and measurement bases applied by the
Group.
At the date of preparation of these consolidated financial statements various Standards and
Interpretations had been adopted by the European Union but had not yet come into force. The
directors consider that the entry into force of these Standards and Interpretations will not have a
material effect on the Group’s consolidated financial statements.
The notes to the consolidated financial statements contain supplementary information to that
presented in the consolidated balance sheet, consolidated income statement, consolidated
statement of changes in equity (statement of recognised income and expense) and consolidated
cash flow statement. The notes provide, in a clear, relevant, reliable and comparable manner,
narrative descriptions and breakdowns of these financial statements.
All accounting policies and measurement bases with a material effect on the consolidated financial
statements were applied in their preparation.
11Bankinter Group
s
LEGAL GRUPO ingles.qxd 13/6/07 08:44 Página 11
B
b) Accounting policies and measurement basesThe consolidated financial statements were prepared in accordance with the generally accepted
accounting policies and measurement bases described in Note 5, “Accounting Policies and
Measurement Bases”.
Unless stated otherwise, these consolidated financial statements are presented in thousands of
euros.
c) Use of judgment and estimatesThe information included in these consolidated financial statements is the responsibility of the
Bank’s directors. In this connection certain estimates were used, where appropriate, in order to
measure certain assets, liabilities, income, expenses and commitments. These estimates, which
were made by the Group's senior management and were ratified by its directors, relate basically
to the following:
• the impairment losses on certain assets
• the useful life of the tangible and intangible assets
• the fair value of certain unquoted assets
• the actuarial assumptions used in the calculation of the post-employment benefit liabilities and
obligations
• the calculation of the provisions made
Although these estimates were made on the basis of the best information available at 31 December
2006 about the items analysed, events that might take place in the future might make it necessary
to change these estimates (upwards or downwards) in coming years. Changes in accounting
estimates, if appropriate, will be applied prospectively, recognising the effects of the change in esti-
mates in the related consolidated income statement.
d) Basis of consolidation The Group was defined as provided for by current accounting standards and rules. Investees
include subsidiaries, jointly controlled entities and associates.
“Subsidiaries” are defined as entities which form a decision-making unit with the Parent, i.e.
entities over which the Parent has, directly or indirectly through other investee(s), the capacity to
exercise control. Control is, in general but not exclusively, presumed to exist when the Parent owns
directly or indirectly through other investees half or more of the voting power of the investee.
Control is the power to govern the financial and operating policies of an investee so as to obtain
benefits from its activities and may be exercised even if the aforementioned ownership interest is
not held.
Bankinter Group 12
LEGAL GRUPO ingles.qxd 13/6/07 08:44 Página 12
Note 13 contains significant information on the investments in subsidiaries at 31 December 2006
and 2005.
The financial statements of the subsidiaries were fully consolidated with those of the Bank.
Accordingly, all material balances and transactions between consolidated entities were eliminated
on consolidation. Also, the share of third parties of the Group's equity is presented under Minority
Interests in the consolidated balance sheet and the share of the profit for the year attributed to
minority interests is presented under Profit Attributed to Minority Interests in the consolidated
income statement.
The results of subsidiaries acquired by the Group during the year are included in the consolidated
income statement from the date of acquisition to year-end. Similarly, the results of subsidiaries
disposed of during the year are included in the consolidated income statement from the beginning
of the year to the date of disposal.
Jointly controlled entities are investees that are not subsidiaries and are jointly controlled by the
Group and by one or more unrelated entities not related to the Group or the joint ventures. A joint
venture is a contractual arrangement whereby two or more entities (“venturers”) undertake
operations or hold assets so that strategic financial and operating decisions affecting the joint
venture require the unanimous consent of the venturers, provided that these operations or assets
are not integrated in financial structures other than those of the venturers.
The financial statements of jointly controlled entities are accounted for using the equity method
and the exceptions provided for by current accounting standards and rules were applied.
Note 13 contains significant information on the interests in jointly controlled entities at 31
December 2006 and 2005.
Associates are entities over which the Group exercises significant influence. Significant influence is
generally, although not exclusively, deemed to be exercised when the Group holds -directly or
indirectly through other investees- 20% or more of the voting power of the investee.
In the consolidated financial statements, investments in associates are accounted for using the
equity method, i.e. at the Group's share of net assets of the investee, after taking into account the
dividends received therefrom and other equity eliminations. The profits and losses arising from
transactions with an associate are eliminated to the extent of the Group's interest in the associate.
If as a result of losses incurred by an associate its equity were negative, the investment should be
presented in the Group's consolidated balance sheet with a zero value, unless the Group is obliged
to give it financial support.
13Bankinter Group
r
-
LEGAL GRUPO ingles.qxd 13/6/07 08:44 Página 13
B
Note 13 contains significant information on the investments in associates at 31 December 2006
and 2005.
Note 13 contains information on the most significant acquisitions and disposals of subsidiaries,
jointly controlled entities and associates in 2006.
A business combination is the bringing together of two or more separate entities or economic units
into one single entity or group of entities.
Business combinations performed on or after 1 January 2004 whereby the Group obtains control
over an entity are recognised for accounting purposes as follows:
• The Group measures the cost of the business combination, defined as the fair value of the assets
given, the liabilities incurred and the equity instruments issued, if any, by the acquirer.
• The net fair values of the assets, liabilities and contingent liabilities of the acquiree, including
any intangible assets which might not have been recognised by the acquiree, are measured and
recognised in the consolidated balance sheet.
• Any negative difference between the net fair value of the assets, liabilities and contingent
liabilities of the acquiree and the business combination cost is recognised as discussed in Note 2-m;
any positive difference is recognised in “Other Gains” in the consolidated income statement.
e) Comparative informationThe information relating to 2005 contained in these notes to the consolidated financial statements
is presented with the information relating to 2006 for comparison purposes only and, accordingly,
it does not constitute the Group's statutory consolidated financial statements for 2005.
f) EquityThe publication of Law 13/1992, of 1 June, and of Bank of Spain Circular 5/1993 and subsequent
amendments thereto brought into force the regulations governing the minimum capital
requirements for credit institutions both at entity level and at consolidated group level.
At 31 December 2006, the Group's eligible capital exceeded the minimum requirements by
EUR 511,958 thousand (31 December 2005: EUR 481,090 thousand).
Bankinter Group 14
LEGAL GRUPO ingles.qxd 13/6/07 08:44 Página 14
(3) Distribution of profit for the year
The distribution of Bankinter, S.A.’s net profit for the year ended 31 December 2006 that the
directors will propose for approval by the shareholders at the Annual General Meeting is, and the
approved distribution of 2005 profit was, as follows:
The distribution of the net profit for the year ended 31 December 2006 of Bankinter, S.A.'s
subsidiaries that their respective directors will propose for approval by the shareholders at their
respective Annual General Meetings is as follows:
15Bankinter Group
;
Thousands of Euros 2006 2005
Distribution:
Voluntary reserves 64,482 66,809
Canary Islands investment reserve - 1,200
Interim dividend 102,056 92,728
Distributed profit 166,538 160,737
Profit for the year 166,538 160,737
Thousands of Euros Net Profit Provision for Dividend Reserves AllocationsIncome Tax
Bankinter Capital Riesgo, S.G.E.C.R., S.A. 663 230 - 359 74
Bankinter Seguros de Vida, S.A. de Seguros y Reaseguros 19,581 6,840 6,294 6,447 -
Aircraft, S.A. (384) (134) - - -
Bankinter Netherlands BV (18) - - - -
Bankinter Sociedad de Financiación, S.A. 1 - - - 1
Bankinter Emisiones, S.A. 28 10 - - 18
Bankinter Capital Riesgo I, Fondo Capital (665) (233) - - -
Helena Activos Líquidos, S.L. (6) - - - -
Arroyo Business Consulting Development, S.L. - - - - -
LEGAL GRUPO ingles.qxd 13/6/07 08:44 Página 16
(a) Going concernThe consolidated financial statements were prepared under the assumption that the Group entities
will continue as a going concern for the foreseeable future and hence the accounting policies were
not applied to determine the consolidated net asset value for the purpose of total or partial transfer
or the amount that would result from liquidation.
(b) Accrual basis of accountingExcept for cash flow information, these consolidated financial statements were prepared on the
basis of the actual flow of goods and services, regardless of when the related payment or collection
is made.
Income and expenses are recognised using the accrual basis of accounting rather than the cash
basis, except for interest on loans and receivables and other non-investment loans to borrowers
classified as impaired, which is credited to the income statement when it is collected.
Interest on asset and liability transactions with settlement terms exceeding twelve months is
accrued by the interest method and that on shorter-term transactions is accrued by either the
interest or the straight-line method.
In accordance with general banking practice, transactions are recognised on the date they are
performed, which may differ from the related value date on the basis of which interest income and
expense are calculated.
(c) Foreign currency transactions and balancesForeign currency balances and transactions were translated to euros using the following methods:
- Monetary assets and liabilities: at the average spot exchange rate ruling on the foreign currency
market at the reporting date.
- Non-monetary items measured at historical cost: at the exchange rates prevailing on the date of
acquisition.
- Non-monetary items measured at fair value: at the exchange rates on the date when the fair
value was determined.
- Income and expense items: at the exchange rates at the transaction date (average exchange rates
for the year were used for all the transactions performed during the year). Depreciation and
amortisation were translated to euros at the exchange rates applied to the related asset.
Exchange differences were recognised in the consolidated income statement, except for those
differences arising in non-monetary items measured at fair value whose adjustment to fair value
is recognised in equity.
17Bankinter Group
LEGAL GRUPO ingles.qxd 13/6/07 08:44 Página 17
B
(d) Recognition, measurement and classification of financial instrumentsFinancial assets and liabilities are recognised when the Group becomes a party to the contract in
accordance with the provisions thereof.
Financial assetsRegular way purchases or sales of financial assets, defined as those in which the parties' reciprocal
obligations must be discharged within a time frame established by regulation or convention in the
marketplace and that may not be settled net, such as stock market and spot currency purchase and
sale contracts, are recognised as an asset by the purchaser and derecognised by the seller on the
date from which the rewards, risks, rights and duties attaching to all owners are for the purchaser,
which, depending on the type of asset or type of market, may be the trade date or the settlement
or delivery date.
Debt instruments are recognised from the date on which a legal right to receive or a legal
obligation to pay cash arises. Derivatives are recognised from the trade date. The Group generally
derecognises financial instruments on the date from which the related rewards, risks, rights and
duties or control thereon are transferred to the purchaser.
Financial assets are classified in the consolidated balance sheet as follows:
i) Cash and balances with central banks: this category includes cash balances and balances with
the Bank of Spain and other central banks.
ii) Financial assets held for trading: this category includes financial assets acquired for the purpose
of selling them in the near term. They are part of a portfolio of identified financial instruments
that are managed together and for which there is evidence of a recent actual pattern of short-term
profit taking or they are derivative instruments that are not designated as hedging instruments.
The changes in the fair value of financial assets held for trading are recognised directly in the
income statement.
iii) Other financial assets at fair value through profit or loss: this category includes (1) hybrid
financial assets not held for trading that are measured entirely at fair value and (2) financial
assets not held for trading that are managed jointly with liabilities under insurance contracts
measured at fair value or with derivative financial instruments whose purpose and effect is to
significantly reduce exposure to variations in fair value, or that are managed jointly with financial
liabilities and derivatives for the purpose of significantly reducing overall exposure to interest rate
risk.
Bankinter Group 18
LEGAL GRUPO ingles.qxd 13/6/07 08:44 Página 18
iv) Available-for-sale financial assets: this category includes debt instruments not classified as held-
to-maturity investments, as other financial assets at fair value through profit or loss, as loans and
receivables or as financial assets held for trading and equity instruments issued by entities other
than subsidiaries, associates and jointly controlled entities, provided that such instruments have
not been classified as financial assets held for trading or as other financial assets at fair value
through profit or loss. The changes in the fair value of available-for-sale financial assets are
recognised directly in equity until the financial asset is derecognised.
v) Loans and receivables: this category includes financial assets that are not quoted in an active
market, that do not have to be measured at fair value and that have fixed or determinable cash
flows in which the Group will recover all of its investment, other than losses because of credit
deterioration. This category includes the investment arising from ordinary lending activities, such
as the cash amounts of loans drawn down and not yet repaid by customers, the deposits placed
with other institutions, whatever the legal instrument, unquoted debt securities and the debt
incurred by the purchasers of goods, or the users of services, constituting part of the Group's
business.
vi) Held-to-maturity investments: this category includes debt securities with fixed maturity and
fixed cash flows which the Group has decided to hold to maturity, basically because it has the
financial ability to do so or because it has related financing. The entity shall not classify as held-to-
maturity, or hold any financial asset in this category if during the current year or the two
preceding years it has sold or reclassified assets in this portfolio for more than an insignificant
amount relative to the total amount of the assets in this category.
vii) Changes in the fair value of hedged items in portfolio hedges of interest rate risk: this item
is the balancing entry for the amounts credited to the consolidated income statement in respect of
the measurement of the portfolios of financial instruments which are efficiently hedged against
interest rate risk through fair value hedging derivatives.
viii) Hedging derivatives: this category includes the financial derivatives acquired or issued by the
Group which qualify for hedge accounting.
ix) Investments: this item includes the equity instruments of jointly controlled entities and
associates.
19Bankinter Group
d
e
LEGAL GRUPO ingles.qxd 13/6/07 08:44 Página 19
B
In general, financial assets are initially recognised at acquisition cost and are subsequently
measured at each period-end as follows:
i) Financial assets are measured at fair value, except for loans and receivables, held-to-maturity
investments, equity instruments whose fair value cannot be determined in a sufficiently objective
manner, investments in subsidiaries, jointly controlled entities and associates and financial
derivatives that have such equity instruments as their underlying asset and are settled by delivery
of those instruments.
ii) The fair value of a financial asset on a given date is taken to be the amount for which it could
be exchanged by two knowledgeable, willing parties in an arm's length transaction. The best
evidence of fair value is the market price on an active, transparent and deep market.
If there is no market price for a given financial asset, its fair value is estimated on the basis of the
price established in recent transactions involving similar instruments and, in the absence thereof,
of sufficiently proven valuation techniques, taking into account the specific features of the financial
asset to be measured and, particularly, the various types of risk associated with it.
iii) The fair value of financial derivatives with a quoted price on an active market is deemed to be
their daily quoted price and if, for exceptional reasons, the quoted price at a given date cannot
be determined, these financial derivatives are measured using methods similar to those used to
measure derivatives not arranged in organised markets.
The fair value of OTC derivatives is taken to be the sum of the future cash flows arising from the
instrument, discounted to present value at the date of measurement using valuation techniques
commonly used by the financial markets.
iv) Loans and Receivables and Held-to-Maturity Investments are measured at amortised cost using
the effective interest method. Amortised cost is understood to be the acquisition cost of a financial
asset plus or minus, as appropriate, the principal repayments and the portion recognised in the
consolidated income statement by the effective interest method of the difference between the
initial cost and the maturity amount, less any impairment loss recognised directly as a reduction of
the amount of the asset or through an allowance account. In the case of loans and receivables
hedged in fair value hedges, the changes in the fair value of these assets related to the risk or
risks being hedged are recognised.
Bankinter Group 20
LEGAL GRUPO ingles.qxd 13/6/07 08:44 Página 20
The effective interest rate is the discount rate that exactly matches the initial amount of a financial
instrument to its estimated cash flows during its expected life based on the related contractual
conditions, such as early redemption options, but disregarding future credit losses. For fixed rate
financial instruments, the effective interest rate coincides with the contractual interest rate
established on the acquisition date plus, where applicable, the fees that, because of their nature,
can be equated with a rate of interest. In the case of floating rate financial instruments, the
effective interest rate coincides with the rate of return prevailing in all connections until the next
benchmark interest reset date.
v) Equity instruments of other entities whose fair value cannot be determined in a sufficiently
objective manner and financial derivatives that have those instruments as their underlying asset
and are settled by delivery of those instruments are measured at acquisition cost adjusted, where
appropriate, by any related impairment loss.
As a general rule, changes in the carrying amount of financial assets are recognised in the
consolidated income statement, distinguishing between those arising from the accrual of interest
and similar items -which are recognised under “Interest and Similar Income”- and those arising for
other reasons, which are recognised at their net amount under “Gains/Losses on Financial Assets
and Liabilities” in the consolidated income statement.
However, changes in the carrying amount of instruments included under “Available-for-Sale
Financial Assets” are recognised temporarily in equity under “Valuation Adjustments”, unless they
relate to exchange differences. The amounts included in “Valuation Adjustments” remain in equity
until the related assets are derecognised, whereupon they are charged to the consolidated income
statement.
In fair value hedges, the gains and losses arising on the financial assets designated as hedging
instruments and hedged items attributable to the type of risk being hedged are recognised
directly in the consolidated income statement.
In fair value portfolio hedges of interest rate risk, the gains or losses that arise on measuring the
hedging instruments are recognised directly in the consolidated income statement, whereas the
gains or losses due to changes in the fair value of the hedged amount -attributable to the hedged
risk- are recognised in the consolidated income statement with a balancing entry under “Changes
in the Fair Value of Hedged Items in Portfolio Hedges of Interest Rate Risk”.
21Bankinter Group
l
f
LEGAL GRUPO ingles.qxd 13/6/07 08:44 Página 21
B
Financial liabilitiesFinancial liabilities are classified in the consolidated balance sheet as follows:
i) Financial liabilities held for trading: this category includes the financial liabilities acquired for
the purpose of realising them in the near term. They form part of a portfolio of identified financial
instruments that are managed together and for which there is evidence of a recent pattern of
short-term profit taking, they are financial derivatives not designated as hedging instruments and
financial liabilities arising from the outright sale of financial assets purchased under reverse
repurchase agreements or borrowed.
ii) Financial liabilities at amortised cost: this category relates to financial liabilities not included in
any of the other balance sheet categories which arise from the ordinary deposit-taking activities
carried on by financial institutions, irrespective of their instrumentation and maturity.
iii) Hedging derivatives: this category includes the financial derivatives acquired or issued by the
Group which qualify for hedge accounting.
iv) Equity having the substance of a financial liability: amount of the financial instruments issued by
the Entity that, although equity for legal purposes, do not meet the requirements for classification as
equity. These instruments relate basically to issued shares that do not carry voting rights and whose
yield is established on the basis of a fixed or floating interest rate. These instruments are measured
as financial liabilities at amortised cost unless the Group has designated them as financial liabilities
at fair value provided that the required conditions are met.
Financial liabilities are measured at amortised cost, as defined for financial assets, except in the
following cases:
i) The financial liabilities included under “Financial Liabilities Held for Trading” are measured at
fair value, as defined for financial assets. Financial liabilities hedged in fair value hedges are
adjusted and changes in fair value with respect to the risk being hedged are recognised.
ii) Financial derivatives that have as their underlying asset equity instruments whose fair value
cannot be determined in a sufficiently objective manner and are settled by delivery of those
instruments, are measured at cost.
As a general rule, changes in the carrying amount of financial liabilities are recognised in the
consolidated income statement. A distinction is made between the changes resulting from the accrual
of interest and similar items -which are recognised under “Interest Expense and Similar Charges”- and
those arising for other reasons -which are recorded at their net amount under “Gains or Losses on
Financial Assets and Liabilities” in the consolidated income statement.
Bankinter Group 22
LEGAL GRUPO ingles.qxd 13/6/07 08:44 Página 22
The gains or losses arising on financial liabilities designated as hedged items or as hedging
instruments are recognised as stated for financial assets.
(e) Recognition of income and expensesAs a general rule, interest income, interest expenses and similar items are recognised on the basis
of their period of accrual using the effective interest method. Dividends received from other
companies are recognised as income when the right to receive them arises.
Fees and commissions paid or received for financial services, however denominated contractually,
are classified in the following categories, which determine their recognition in the consolidated
income statement:
i) Financial fees and commissions, which are those that are an integral part of the effective yield or
cost of a financial transaction and are recognised in the income statement over the expected life of
the financing as an adjustment to the effective yield or cost of the transaction. They include loan
origination and analysis fees, fees on credit overlimits and fees on deposit overdrafts.
ii) Non-financial fees and commissions, which are those arising from the provision of services and
may arise from the provision of a service over a period of time and from the rendering of a service
in a single act.
Fee and commission income and expenses are generally recognised in the consolidated income
statement as follows:
i) Those relating to financial assets and financial liabilities measured at fair value through profit or
loss are recognised when paid.
ii) Those arising from transactions or services that are provided over a period of time are
recognised over the life of these transactions or services.
iii) Those relating to a transaction or service performed in a single act are recognised when the
single act is carried out.
Non-finance income and expenses are recognised for accounting purposes on an accrual basis.
Deferred collections and payments (over periods longer than a year) are recognised for accounting
purposes at the amount resulting from discounting the expected cash flows at market rates.
23Bankinter Group
l
d
LEGAL GRUPO ingles.qxd 13/6/07 08:44 Página 23
B
(f) Impairment of financial assetsThe carrying amount of a financial asset is generally adjusted with a charge to the income
statement when there is objective evidence of an impairment loss, which occurs when:
i) In the case of debt instruments, i.e. loans and debt securities, after their initial recognition a
single event or the combined effect of several events causes a negative impact on their future cash
flows
ii) In the case of equity instruments, after their initial recognition a single event or the combined
effect of several events means that their carrying amount cannot be fully recovered.
As a general rule, the carrying amount of impaired financial instruments is adjusted with a charge
to the consolidated income statement for the period in which the impairment becomes evident,
and the reversal of previously recognised impairment losses, if any, is recognised in the
consolidated income statement for the period in which the impairment is reversed or reduced.
When the recovery of any recognised impairment is considered unlikely, the amount of the
impairment is derecognised, without prejudice to any actions that the Group may initiate to seek
collection of the amount receivable until their contractual rights are extinguished by expiry of the
statute-of-limitations period, forgiveness or any other cause.
The amount of an impairment loss incurred on a debt instrument measured at amortised cost is
equal to the difference between its carrying amount and the present value of its estimated future
cash flows. For quoted instruments, instead of the present value of future cash flows, market value
may be used provided that it is sufficiently reliable to consider it as representative of the amount
that might be recovered by the Group.
The estimated future cash flows of a debt instrument are all the principal and interest amounts
that the Group considers will flow to it over the life of the instrument. Its estimate takes into
account all relevant information available on the date when the financial statements are
authorised for issue about the likelihood of collecting the contractual cash flows in the future.
The future cash flows of a collateralised instrument are estimated by taking into account the flows
that would result from foreclosure less costs for obtaining and subsequently selling the collateral,
whether or not foreclosure is probable.
The discount rate used to calculate the present value of the estimated future cash flows is the
instrument's original effective interest rate, if its contractual rate is fixed, or the effective interest
rate at the reporting date determined under the contract, if it is floating.
Bankinter Group 24
LEGAL GRUPO ingles.qxd 13/6/07 08:44 Página 24
Debt instrument portfolios, contingent liabilities and contingent commitments, irrespective of the
holder, instrumentation or guarantee, are reviewed so as to determine the credit risk to which the
Group is exposed and to consider whether an impairment allowance is required. In the preparation
of the consolidated financial statements, the Group classified its transactions on the basis of the
inherent credit risk and assessed separately the insolvency risk attributable to customers and the
country risk to which the transactions are exposed.
The objective evidence of impairment is determined individually for all debt instruments that are
individually significant, and individually or collectively for the groups of debt instruments which
are not individually significant. When a specific instrument cannot be included in any group of
assets with similar credit risk characteristics, it is analysed solely on an individual basis to
determine whether it is impaired and, if so, to estimate the impairment loss.
Collective assessment of a group of financial assets to estimate impairment losses is carried out as
follows:
i) Debt instruments are included in groups with similar credit risk characteristics that are indicative
of the debtors' ability to pay all amounts due, both principal and interest, according to the
contractual terms. The credit risk characteristics to be taken into account for grouping assets are,
among others: instrument type, debtor's industry, geographical location, type of guarantee or
collateral, age of past-due amounts and any other factor relevant to the estimation of future cash
flows.
ii) The future cash flows from each group of debt instruments are estimated for instruments with
similar credit risk characteristics to those in the respective group, after making the necessary
adjustments to adapt the historical data to current market conditions.
iii) The impairment loss of each group is the difference between the carrying amount of all the
debt instruments in the group and the present value of the estimated future cash flows.
Debt instruments not measured at fair value through profit or loss, and contingent liabilities and
contingent commitments are classified, on the basis of insolvency risk attributable to the customer
or to the transaction, in one of the following categories: standard, substandard, doubtful due to
customer arrears, doubtful for reasons other than customer arrears and write-off. The specific
impairment allowances are estimated for debt instruments not classified as standard risk, taking
into account the age of past-due amounts, the guarantees provided and the economic situation of
the customer and, where appropriate, of the guarantors. This estimate is generally performed on the
basis of the default schedules.
25Bankinter Group
LEGAL GRUPO ingles.qxd 13/6/07 08:44 Página 25
B
In addition to the specific impairment allowances mentioned above, the Group recognised an
overall impairment allowance for inherent losses on debt instruments not measured at fair value
through profit or loss and on contingent liabilities classified as standard risk.
In this connection, the Bank of Spain determines the parameters, methods and amounts to be used
to cover the inherent impairment losses incurred in debt instruments and contingent liabilities
classified as standard risk.
The calculation method established in Annex IX of Bank of Spain Circular 4/2004 is divided into
two stages.
At the first stage, balances are classified into the six risk classes defined in the Circular, namely
negligible risk, low risk, medium-low risk, medium risk, medium-high risk and high risk.
The impaired charge is the sum of
a) the products of the change during the period in the balance of each risk class and the related
regulatory α parameter, plus
b) the sum of the products of the total balance of the transactions included in each risk class at the
end of the period and the related regulatory β parameter, less
c) the amount of the overall net impairment charges for the relevant specific allowances or
provisions made in the period.
The overall balance of this general allowance or provision must at all times be between 33% and
125% of the sum of the products obtained by multiplying the amount of each risk class by its
related α parameter. The balance at the Group at 31 December 2006 and 2005 related to the
maximum ratio.
Parameters α and β, for each risk class, are as follows:
Bankinter Group 26
α β
Negligible risk 0% 0%
Low risk 0.6% 0.11%
Medium-low risk 1.5% 0.44%
Medium risk 1.8% 0.65%
Medium-high risk 2.0% 1.10%
High risk 2.5% 1.64%
LEGAL GRUPO ingles.qxd 13/6/07 08:44 Página 26
The recognition of interest accrual under the contractual terms in the consolidated income
statement is suspended for debt instruments individually classified as impaired and for the
instruments for which impairment losses have been assessed collectively because they have
payments more than three months past due.
The amount of the impairment losses on debt instruments and equity instruments included under
“Available-for-Sale Financial Assets” is the positive difference between their acquisition cost, net of
any principal repayment or amortisation, and their fair value less any impairment loss previously
recognised in the consolidated income statement.
When there is objective evidence that the decline in fair value is due to impairment, the unrealised
losses recognised directly in consolidated equity under “Valuation Adjustments” are recognised
immediately in the consolidated income statement. If all or part of the impairment losses are
subsequently reversed, the reversed amount is recognised in the consolidated income statement for
the year in which the reversal occurred, in the case of debt instruments, and under “Valuation
Adjustments” in consolidated equity in the case of equity instruments.
The impairment loss on equity instruments measured at cost is the difference between the carrying
amount and the present value of the expected future cash flows discounted at the market rate of
return for similar securities. Impairment losses are recognised in the consolidated income
statement for the period in which they arise as a direct reduction of the cost of the financial asset.
These losses can only be reversed subsequently in the case of the sale of the related asset.
The impairment losses on investments in jointly controlled entities and associates are estimated by
comparing their recoverable amount with their carrying amount. Impairment losses are recognised
in the income statement for the period in which they occur; subsequent reversals are recognised in
the income statement for the period in which the impairment losses are reversed.
(g) Financial derivativesFinancial derivatives are instruments which, in addition to providing a profit or loss, may permit
the offset, under certain conditions, of all or a portion of the credit and/or market risks associated
with balances and transactions, using interest rates, certain indices, equity prices, cross-currency
exchange rates or other similar benchmarks as underlyings. The Group uses financial derivatives
traded on organised markets or traded bilaterally with the counterparty outside organised markets
(OTC derivatives) both for proprietary transactions and for transactions with the wholesale or retail
customer segment.
27Bankinter Group
d
LEGAL GRUPO ingles.qxd 13/6/07 08:44 Página 27
B
The Group takes positions in derivatives for the purpose of arranging hedges, actively managing
other financial assets and liabilities or benefiting from price changes. Financial derivatives that do
not qualify for hedge accounting are classified as trading derivatives.
Derivatives with an active market are measured at the quoted prices in such markets.
Derivatives with no market or with an inactive market are measured using the most consistent and
appropriate economic methods, maximising the use of observable data and other factors that
market participants would take into account, such as: a) recent transactions involving other
instruments that are substantially equal, b) discounting of cash flows and c) market option pricing
models. The valuation techniques are preferably those used by market participants and have been
demonstrated to provide the most realistic estimate of the instrument's price.
All financial derivatives are initially recognised at fair value. In the case of financial swaps the fair
value is assumed to be zero, unless the Group demonstrates otherwise using appropriate valuation
techniques. In this case, the initial recognition of fair value generates a profit or loss that must be
recognised in the income statement when all the variables of the model stem exclusively from
observable market data, giving rise to the so-called “day-one profits”. Based on a prudential
supervisory ruling issued by the Bank of Spain at the request of the Bank, the Board of Directors
decided to apply an alternative criteria consisting of the recognition of the aforementioned “day-
one profits” on a straight-line basis over the life of the swaps giving rise to them.
A derivative may be designated as a hedging instrument only if it meets the following criteria:
i) It qualifies in its entirety as a hedging instrument, even when only a percentage of its total
amount is such, except that in the case of options it is permitted to designate as the hedging
instrument the change in their intrinsic value, excluding changes in their time value, and in the
case of forward contracts it is permitted to designate as the hedging instrument the difference
between the spot and forward prices of the underlying asset.
ii) It is designated as a hedge for its total remaining term to maturity.
iii) If more than one risk is hedged, the different hedged risks can be clearly identified, each part
of the instrument can be designated as a hedge of specific hedged items and the effectiveness of
the various hedges can be demonstrated.
Bankinter Group 28
LEGAL GRUPO ingles.qxd 13/6/07 08:44 Página 28
The hedge effectiveness of hedging derivatives is duly documented through effectiveness analysis,
which is the tool that evidences that the differences arising from changes in market prices between
the hedged item and the hedging instrument remain at reasonable parameters over the term of the
transactions, in line with the estimates made at the trade date.
If this is not the case at any time, the associated transactions in the hedging group would be
treated as trading derivatives and would be duly reclassified in the balance sheet.
The hedges entered into by the Group are classified as fair value hedges:
� Micro-hedges or individual hedges (in which hedged items and hedging instruments are
specifically identified) hedge the exposure to changes in the fair value of the hedged item.
The profit or loss arising in measuring the hedging instruments and the hedged items is
recognised immediately in the consolidated income statement.
� Portfolio hedges (hedges of interest rate risk in a portfolio of financial instruments) hedge
the exposure to changes in the fair value of the hedged amount in response to changes in the
hedged interest rate. The profit or loss arising from measuring hedging instruments is
recognised immediately in the consolidated income statement. In the case of the hedged
amount, the profit or loss arising on measurement is recognised directly in the income
statement with a charge or credit, as appropriate, to the asset or liability item “Changes in the
Fair Value of Hedged Items in Portfolio Hedges of Interest Rate Risk” depending on whether the
hedged amount relates to financial assets or financial liabilities, respectively.
(h) Transfers and derecognition of financial instrumentsThe accounting treatment of transfers of financial instruments depends on the extent to which the
risks and rewards associated with the transferred financial instruments are transferred:
i) If the Group transfers substantially all the risks and rewards to third parties -unconditional sale,
sale under an agreement to repurchase at fair value at the repurchase date, sale of financial assets
with a purchased call option or written put option that is deeply out of the money, securitisation of
assets in which the transferor does not retain a subordinated debt or grant any credit
enhancement to new holders, etc.-, the transferred financial instrument is derecognised and any
right or obligation retained or created in the transfer is recognised simultaneously.
29Bankinter Group
d
LEGAL GRUPO ingles.qxd 13/6/07 08:44 Página 29
B
ii) If the Group retains substantially all the risks and rewards associated with the transferred
financial instrument -sale of financial assets under an agreement to repurchase them for a fixed
price or the sale price plus interest, a securities lending agreement in which the borrower
undertakes to return the same or similar assets, etc.-, the transferred financial instrument is not
derecognised and continues to be measured by the same criteria used before the transfer. However,
an associated financial liability is recognised for an amount equal to the consideration received.
This liability is subsequently measured at amortised cost. The income from the transferred
financial asset not derecognised and any expense incurred on the new financial liability are
recognised in the consolidated income statement.
iii) If the Group neither transfers nor retains substantially all the risks and rewards associated with
the transferred financial asset -sale of financial assets with a purchased call option or written put
option that is not deeply in or out of the money, securitisation of assets in which the transferor
retains a subordinated debt or other type of credit enhancement for a portion of the transferred
asset, etc.-, the following distinction must be made:
� If the Group does not retain control, the transferred financial instrument is derecognised and
any right or obligation retained or created in the transfer is recognised.
� If the Group retains control, it continues to recognise the transferred financial instrument in
the balance sheet for an amount equal to its exposure to changes in value and recognises a
financial liability associated with the transferred financial asset. The net carrying amount of
the transferred asset and of the associated liability is the amortised cost of the rights and
obligations retained, if the transferred asset is measured at amortised cost, or the fair value of
the rights and obligations retained, if the transferred asset is measured at fair value.
Accordingly, financial assets are only derecognised when the rights on the cash flows they
generate have expired or when substantially all the inherent risks and rewards have been
transferred to third parties. Similarly, financial liabilities are only derecognised when the
obligations they generate have expired or when they are acquired with the intention either to
cancel them or to re-place them.
(i) Tangible assetsTangible assets are presented at acquisition cost, revalued pursuant to certain legal provisions and
also as permitted in the transition to the new accounting standards, less the related accumulated
depreciation and any impairment losses.
The acquisition cost of foreclosed assets is the carrying amount of the financial assets settled
through foreclosure.
Bankinter Group 30
LEGAL GRUPO ingles.qxd 13/6/07 08:44 Página 30
Depreciation is calculated by the straight-line or the sum-of-the-years'-digits method by applying
the years of estimated useful life of the various items to the acquisition cost of the assets less their
residual value. The land on which the buildings and other structures stand has an indefinite life
and, therefore, is not depreciated. The tangible asset depreciation charge is recognised in the
consolidated income statement and is calculated on the basis of the years of estimated useful life,
which are basically the same as the minimum legal periods:
Depreciation Method
Buildings Straight-line over 50 years
Furniture, fixtures and other Straight-line over 6 to 12 years
Computer hardware Sum-of-the-years'-digits or shifts
The Group reviews the depreciation period and method of each tangible asset at least at the end of
the reporting period.
Upkeep and maintenance expenses that do not enhance the utilisation or lengthen the useful life
of the respective assets are charged to the consolidated income statement when and as they are
incurred.
At the reporting date the Group assesses whether there is any internal or external indication that
an asset may be impaired (i.e. its carrying amount exceeds its recoverable amount). If this is the
case, the Group reduces the carrying amount of the asset to its recoverable amount and adjusts
future depreciation charges in proportion to the revised carrying amount and to the new remaining
useful life (if the useful life has to be re-estimated). Similarly, if there is an indication of a recovery
in the value of a tangible asset, the Group recognises the reversal of the impairment loss
recognised in prior periods and adjusts the future depreciation charges accordingly. In no
circumstances may the reversal of an impairment loss on an asset raise its carrying amount above
that which it would have if no impairment losses had been recognised in prior years.
(j) Intangible assetsIntangible assets are identifiable non-monetary assets without physical substance. Intangible
assets are deemed to be identifiable when they are separable from other assets because they can
be sold, rented or otherwise disposed of individually, or when they arise from contractual or other
legal rights. An intangible asset is recognised when, in addition to meeting the above definition,
the Group considers it probable that economic benefits will flow from the asset and the cost of the
asset can be measured reliably.
31Bankinter Group
,
h
LEGAL GRUPO ingles.qxd 13/6/07 08:44 Página 31
B
Intangible assets are recognised initially at acquisition or production cost and are subsequently
measured at cost less any accumulated amortisation and any impairment losses.
The Group recognises any impairment loss on the carrying amount of these assets with a charge to
the consolidated income statement. The criteria used to recognise the impairment losses on these
assets and, where applicable, the reversal of impairment losses recognised in prior years are
similar to those used for tangible assets.
(k) LeasesLease contracts are presented in the consolidated financial statements on the basis of the economic
substance of the transaction regardless of its legal form and are classified from inception as
finance or operating leases.
i) A lease is classified as a finance lease when it transfers substantially all the risks and rewards
incidental to ownership of the asset forming the subject-matter of the contract.
When the Group acts as lessor of an asset, the sum of the present value of the lease payments
receivable from the lessee plus the guaranteed residual value -which is generally the exercise price
of the purchase option of the lessee at the end of the lease term- is recognised as lending to third
parties and is therefore included, based on the type of lessee, under “Loans and Receivables” in the
consolidated balance sheet.
When the Group acts as lessee, it presents the cost of the leased assets in the consolidated balance
sheet according to the nature of the asset forming the subject-matter of the contract and,
simultaneously, recognises a liability for the same amount (which is the lower of the fair value of
the leased asset and the sum of the present value of the lease payments to be made to the lessor
plus, if appropriate, the exercise price of the purchase option). The depreciation policy for these
assets is consistent with that for property, plant and equipment for own use.
The finance income and finance expense arising from these contracts is credited or debited,
respectively, to the consolidated income statement so as to achieve a constant rate of return over
the life of the lease contracts.
ii) Leases other than finance leases are classified as operating leases.
When the Group acts as lessor, it presents the acquisition cost of the leased assets under “Tangible
Assets”. The depreciation policy for these assets is consistent with that for similar tangible assets
for own use and income from operating leases is recognised on a straight-line basis in the
consolidated income statement.
Bankinter Group 32
LEGAL GRUPO ingles.qxd 13/6/07 08:44 Página 32
When the Group acts as lessee, the lease expenses, including any incentives granted by the lessor,
are recognised on a straight-line basis in the consolidated income statement.
(l) Non-current assets held for saleNon-current assets held for sale are assets whose carrying amount is expected to be recovered
mainly through sale and that are available for immediate sale and their sale is considered to be
highly probable.
Non-current assets held for sale are measured at the lower of fair value less costs to sell and their
carrying amount. These assets are not depreciated.
Impairment losses are recognised under “Impairment Losses - Non-Current Assets Held for Sale” in
the consolidated income statement. The reversals of impairment losses are recognised in the
consolidated income statement up to an amount equal to the impairment losses previously
recognised.
Foreclosed assets are measured at the lower of their fair value less costs to sell and their carrying
amount. Impairment losses, which are calculated individually for assets that remain on the balance
sheet for a period longer than initially envisaged for their sale, are recognised under “Impairment
Losses - Non-Current Assets Held for Sale” in the consolidated income statement.
(m) OffsettingAsset and liability balances arising from transactions which, contractually or as a result of a legally
enforceable right, envisage the possibility of offsetting and the Group intends to settle them on a
net basis, or to realise the asset and pay the liability simultaneously, are recognised in the
consolidated balance sheet at their net amount.
(n) Securities lent or pledged as collateralSecurities lending is defined as a transaction in which the borrower receives full title to securities
without making any payment except fees and commissions, with the commitment to return to the
lender others of the same class as those received.
Securities lending agreements in which the borrower undertakes to return the same or
substantially the same assets or other similar ones having the same fair value are deemed to be
transactions in which the lender retains substantially all the risks and rewards incidental to
ownership.
(o) Financial guaranteesFinancial guarantees are defined as contracts whereby the Group undertakes to make specific
payments for a third party if the latter does not do so, irrespective of the various legal forms they may
have, such as guarantees, irrevocable documentary credits issued or confirmed by the Group, etc.
33Bankinter Group
c
LEGAL GRUPO ingles.qxd 13/6/07 08:44 Página 33
B
Financial guarantees are recognised under “Accrued Expenses and Deferred Income” at their fair
value which, on initial recognition and in the absence of evidence to the contrary, is the present
value of the cash flows to be received, using an interest rate similar to that of the financial assets
granted by the entity with a similar term and risk. Simultaneously, the present value of the future
cash flows receivable using the aforementioned interest rate is recognised under “Other Financial
Assets”.
Subsequently, the value of contracts recognised under “Other Financial Assets” is discounted by
recording the differences in the consolidated income statement as interest income. The fair value
of guarantees recognised under “Accrued Expenses and Deferred Income” is allocated to the
consolidated income statement as income from commissions received, on a straight-line basis over
the expected life of the guarantee, or by another method provided that it more adequately
reflects the economic risks and rewards of the guarantee.
Financial guarantees are classified on the basis of the insolvency risk allocable to the customer or
to the transactions and, if appropriate, the need for provisions is assessed by application of criteria
similar to those indicated in Note 5-f) for debt instruments measured at amortised cost.
If a provision for financial guarantees is required, the unearned commissions recognised under
“Accrued Expenses and Deferred Income” on the liability side of the consolidated balance sheet are
reclassified to the appropriate provision.
(p) Personnel expenses
Post-employment benefitsPost-employment benefits are employee compensation that is payable after completion of
employment. All post-employment obligations, including those covered by internal or external
pension funds are classified as defined contribution plans or defined benefit plans based on the
terms and conditions of those obligations, taking into account all commitments made, whether
within or outside the terms formally agreed with employees.
The Group recognises the contribution to be made to insurance entities at the amount of the
insurance premiums paid under “Personnel Expenses” in the consolidated income statement.
Irrevocable post-employment commitments to senior management are recognised over the
estimated total period of service by senior management to the Entity.
Equity-instrument-based employee remunerationThe accrued portion of the market value of the implicit options at the grant date relating to
outstanding issues of convertible debentures for Group employees (Note 19-e) is recognised as a
personnel expense with a credit to “Other Equity Instruments” in consolidated equity until the
options expire or are cancelled early.
Bankinter Group 34
LEGAL GRUPO ingles.qxd 13/6/07 08:44 Página 34
As the Group carries out capital increases to cater for the conversion of debentures into shares over
the term of the convertible debenture issues, the item “Other Equity Instruments” is converted into
“Share Premium”.
In the event of non-compliance with the internal conditions established by the Group for the
conversion of debentures into shares, the accumulated amount recognised in equity in this
connection is reversed with a credit to the consolidated income statement.
The personnel expenses referred to in this section do not entail the receipt of any remuneration
or right by employees, since convertible debenture issues are financial transactions in which
employees can participate voluntarily, bear the risks of the transaction and forfeit the conversion
right if they leave the Group for any reason.
Multi-year incentive plansThe amount of the payments under the multi-year executive incentive plans is recognised under
“Personnel Expenses” on an accrual basis.
(q) Other provisions and contingenciesThe Group recognises provisions for the estimated amount required to meet present obligations
arising from past events whose nature is clearly specified but whose amount or settlement date is
uncertain and that the Group expects to settle through an outflow of resources embodying
economic benefits. These obligations may arise from:
� A legal or contractual requirement.
� An implicit or tacit obligation arising from valid expectations created by the Group to third
parties regarding the assumption of certain types of responsibilities. Such expectations are
created when the Group publicly accepts responsibilities, or derive from past practice or from
publicly known business policies.
� Virtual certainty as to the future course of regulation in particular respects, especially
proposed new legislation that the Group cannot avoid.
Contingent liabilities are possible obligations of the Group that arise from past events and whose
existence is conditional on the occurrence or non-occurrence of one or more future events beyond
the control of the Group. They include the present obligations of the Group when it is not probable
that an outflow of resources embodying economic benefits will be required to settle them or when,
in extremely rare cases, their amount cannot be measured with sufficient reliability.
35Bankinter Group
LEGAL GRUPO ingles.qxd 13/6/07 08:44 Página 35
B
Provisions and contingent liabilities are classified as probable when it is more likely than not that
they will occur; as possible when it is more likely than not that they will not occur; and as remote
when it is extremely rare that they should occur.
The Group's consolidated financial statements include all the material provisions with respect to
which it is considered that it is more likely than not that the obligation will have to be settled.
Contingent liabilities are not recognised in the consolidated financial statements, but rather
information thereon is disclosed unless the possibility of an outflow of resources embodying
economic benefits is remote.
Provisions are quantified on the basis of the best information available on the consequences of the
event giving rise to them and are estimated at each reporting date taking into account the
financial effect, if it is material. Provisions are used to cater for the specific obligations for which
they were originally recognised and are fully or partially reversed when such obligations cease to
exist.
At 31 December 2006 and 2005, certain litigation and claims were in process against the Group
arising from the ordinary course of its operations. The Group's legal advisers and the directors of
the Bank consider that the outcome of such litigation and claims will not have a material effect, in
addition to that included as a provision, on the consolidated financial statements.
(r) Insurance contractsIn accordance with standard accounting practice in the insurance sector, insurance entities credit to
the income statement the amounts of the premiums written and charge to income the cost of the
claims incurred on final settlement thereof. Also, insurance entities are required to accrue at year-
end the unearned premiums written credited to their income statements and the expected costs for
claims not charged to the income statement.
The most significant liabilities recorded by insurance entities in relation to direct insurance
contracts arranged by them relate to the following technical provisions: provisions for unearned
premiums, provisions for unexpired risks, provisions for claims outstanding, mathematical
provisions, provisions for life assurance policies where the investment risk is borne by the
policyholders and provisions for bonuses and rebates. The technical provisions to cater for claims
arising from direct insurance contracts are recognised in the accompanying consolidated balance
sheets under “Liabilities under Insurance Contracts”.
“Reinsurance Assets” includes the amounts that the entities are entitled to receive for reinsurance
contracts with third parties. They are calculated on the basis of the reinsurance contracts entered
into and by application of the same criteria as those used for direct insurance.
Bankinter Group 36
LEGAL GRUPO ingles.qxd 13/6/07 08:44 Página 36
The results of the Group's insurers relating to their insurance activity are recognised under
“Insurance Activity Income” in the consolidated income statement.
(s) Income taxIncome tax is treated as an expense and recognised under “Income Tax” in the consolidated income
statement, except when it results from a transaction recognised directly in equity, in which case
the income tax is also recognised in equity, or from a business combination, in which case the
deferred tax is recognised as one of its assets or liabilities.
The income tax expense is determined by the tax payable on the taxable profit for the year, after
taking account of any changes in that year due to temporary differences, tax credits and tax losses.
The taxable profit for the year may differ from the net profit reported in the consolidated income
statement because it excludes revenue and expense items which are taxable or deductible in
different years and also excludes non-deductible items.
Deferred tax assets and liabilities relate to the amounts expected to be payable or recoverable on
differences between the carrying amounts of assets and liabilities and their related tax bases, are
recognised using the balance sheet liability method and are measured by applying to the related
temporary difference or tax carryforward the tax rates at which the asset is expected to be realised
or the liability settled.
A deferred tax asset, such as prepaid tax, a tax credit carryforward and a tax loss carryforward, is
recognised whenever it is probable that the Group will obtain sufficient future taxable profit
against which the deferred tax asset can be utilised. It is considered probable that the Group will
obtain sufficient taxable profit in the future in the following cases, among others:
i) There are deferred tax liabilities settleable in the same year that the deferred tax asset is
realised, or in a subsequent year in which the existing tax loss or that resulting from the amount
carried forward can be offset.
ii) The tax losses result from identifiable causes which are unlikely to recur.
Notwithstanding the foregoing, a deferred tax asset that arises in accounting for investments in
jointly controlled entities or associates is only recognised if it is probable that it will be realised
in the foreseeable future and it is expected that sufficient future taxable profits will be available
against which the deferred tax asset can be utilised. Furthermore, a deferred tax asset is not
recognised if it arises from the initial recognition of an asset or liability other than a business
combination that at the time of recognition affects neither accounting profit nor taxable profit.
37Bankinter Group
o
r
LEGAL GRUPO ingles.qxd 13/6/07 08:44 Página 37
B
A deferred tax liability is always recognised except when goodwill is recognised or it arises in
accounting for investments in jointly controlled entities or associates where the Group is able to
control the timing of the reversal of the temporary difference and, in addition, it is probable that
the temporary difference will not reverse in the foreseeable future. Furthermore, a deferred tax
liability is not recognised if it arises from the initial recognition of an asset or liability other than a
business combination that at the time of recognition affects neither accounting profit nor taxable
profit.
The deferred tax assets and liabilities recognised are reassessed at year-end in order to ascertain
whether they still exist, and the appropriate adjustments are made.
(t) Off-balance-sheet customer fundsThe amount of funds entrusted by third parties for investment in investment companies,
investment funds, pension funds, insurance contracts and discretionary portfolio management
contracts is not recognised on the face of the Group's consolidated balance sheet. Note 41 contains
information on these funds at 31 December 2006.
The fees and commissions earned on this activity are recognised under “Fee and Commission
Income” in the consolidated income statement.
Bankinter Group 38
LEGAL GRUPO ingles.qxd 13/6/07 08:44 Página 38
Disclosures on the main balance sheet items
(6) Cash and balances with central banks
The breakdown of “Cash and Balances with Central Banks”, which includes cash balances and
balances with the Bank of Spain and other central banks, at 31 December 2006 and 2005 is as
follows:
Thousands of Euros 31/12/06 31/12/05
Cash 99,059 74,243
Bank of Spain 424,008 343,231
Other central banks 15,903 18,109
Valuation adjustments 208 333
Total 539,178 435,916
In euros 537,826 434,771
In foreign currencies 1,352 1,145
Total 539,178 435,916
“Valuation Adjustments” includes EUR 208 thousand relating to accrued interest at 31 December
2006 (31 December 2005: EUR 333 thousand).
(7) Financial assets and liabilities held for trading and Otherfinancial assets at fair value through profit or loss
The breakdown of “Financial Assets and Liabilities Held for Trading” and “Other Financial Assets at
Fair Value through Profit or Loss” in the consolidated balance sheets at 31 December 2006 and
2005 is as follows:
Assets (Thousands of Euros) 31/12/06 31/12/05
Debt instruments 2,503,479 4,327,317
Other equity instruments 133,260 63,695
Trading derivatives 148,059 267,274
2,784,798 4,658,286
In euros 2,765,723 4,657,609
In foreign currencies 19,075 677
Total 2,784,798 4,658,286
39Bankinter Group
LEGAL GRUPO ingles.qxd 13/6/07 08:44 Página 39
B
“Other Equity Instruments” relates to securities included in financial assets held for trading and
other financial assets at fair value through profit or loss. The balance of the latter at 31 December
2006 amounted to EUR 24,596 thousand (31 December 2005: EUR 23,884 thousand).
Liabilities (Thousands of Euros) 31/12/06 31/12/05
Short positions 2,462,625 3,107,171
Trading derivatives 101,503 250,115
Total 2,564,128 3,357,286
In euros 2,561,791 3,356,938
In foreign currencies 2,337 348
Total 2,564,128 3,357,286
The changes, by type of instrument, in “Financial Assets Held for Trading” and “Other Financial
Assets at Fair Value through Profit or Loss” in 2006 and 2005 were as follows:
The fair value of assets lent (repurchase agreements) included in these balance sheet items was
EUR 1,981,715 thousand at 31 December 2006 (31 December 2005: EUR 4,002,508 thousand).
Bankinter Group 40
Thousands of Euros Debt Instruments Other Equity Instruments Trading Derivatives Total
Balance at 31/12/04 1,932,751 8,247 70,414 2,011,412
(1) The hedge effectiveness should be assessed taking into account the accrued interest disclosed in Note 19 amounting to EUR 14,455 thousand at 31 December 2006 (31December 2005: EUR 19,117 thousand).
LEGAL GRUPO ingles.qxd 13/6/07 08:44 Página 56
1.- Hedge of government debt securities classified under “Available-for-SaleFinancial Assets” The hedged items are 3.15%, 4%, 4.75%, 5% and 5.4% Spanish government debt securities
amounting to EUR 1,500,000 thousand reported under “Available-for-Sale Financial Assets” on the
asset side of the consolidated balance sheet (Note 8). The risk hedged is the risk of changes in
the fair value of these securities as a result of changes in the risk-free interest rate. This hedge
converts a fixed-rate exposure into a floating-rate exposure. The amount hedged represents 100%
of the issue in each case.
2.- Hedge of subordinated debenturesThe hedged items are fixed 6.95%, 5.70%, 6% and 5% subordinated debentures issued by Bankinter
amounting to EUR 197,767 thousand reported under “Financial Liabilities at Amortised Cost” on the
liability side of the consolidated balance sheet (Note 19). The risk hedged is the change in the fair
value of these securities as a result of changes in the risk-free interest rate. This hedge converts a
fixed-rate exposure into a floating-rate exposure. The amount hedged represents 100% of the issue
in each case.
3.- Hedge of customer deposits The hedged items are fixed-rate deposits taken from customers amounting to EUR 19,670 thousand
reported under “Financial Liabilities at Amortised Cost” on the liability side of the consolidated
balance sheet (Note 19). The risk hedged is the change in the fair value of these deposits as a
result of changes in the risk-free interest rate. This hedge converts a fixed-rate exposure into
a floating-rate exposure. The amount hedged represents 98.90% of the deposits.
4.- Portfolio hedgeThe hedged item is the amount of the mortgage loans that the Group decides to hedge each month
on the basis of the scheduled maturities and repricing of the benchmark floating rates.
The risk hedged is the interest rate exposure of the aforementioned mortgage loans for each of the
repricing periods to be hedged to changes in the risk-free interest rate.
The risk-free interest rate of this hedge is deemed to be the benchmark floating rates of call money
swaps (CMS).
The instruments used to hedge the various mortgage loan amounts are CMS arranged monthly on
the basis of the decisions adopted in the interest rate risk management process.
The aforementioned micro-hedges and portfolio hedges of interest rate risk are highly effective.
The Group performs and documents the appropriate analyses in order to ascertain whether, at
57Bankinter Group
LEGAL GRUPO ingles.qxd 13/6/07 08:44 Página 57
B
inception of the hedge and during its life, the Group can expect, prospectively, that the changes in
fair value of the hedged item that are attributable to the risk hedged are nearly completely offset
by changes in the fair value of the hedging instrument and, retrospectively, that the actual results
of the hedge are within a range of 80% to 125% of the results of the hedged item.
With respect to portfolio hedges of interest rate risk, the Group also ascertains compliance with the
alternative treatment provided for by current accounting standards, consisting of assessing the
hedge effectiveness by comparing the amount of the net asset position in each of the time periods
with the hedged amount designated for each period. Based on this alternative, the hedge would
only be ineffective when, after review, the amount of the net asset position is lower than the
hedged amount.
(12) Non-current assets held for sale
“Non-Current Assets Held for Sale” consist of foreclosed assets. These assets are tangible assets
denominated in euros amounting to EUR 3,965 thousand at 31 December 2006 (31 December 2005:
EUR 3,827 thousand).
The detail of “Non-Current Assets Held for Sale” and of the changes therein is as follows:
Balance at 31/12/04 3,351
Additions 8,277
Valuation adjustments (491)
Retirements 7,310
Balance at 31/12/05 3,827
Additions 2,724
Valuation adjustments 454
Retirements 3,040
Balance at 31/12/06 3,965
The net proceeds on disposal of non-current assets held for sale recognised in 2006 (Note 35)
amounted to EUR 562 thousand (2005: EUR 300 thousand).
Bankinter Group 58
LEGAL GRUPO ingles.qxd 13/6/07 08:44 Página 58
59Bankinter Group
:
Foreclosed assets not earmarked for own use or as investment property must be disposed of in a
maximum period of one year from when they are available for immediate sale. Accordingly, a
foreclosed asset can remain on the balance sheet for a period longer than a year.
(13) Investments
The breakdown of “Investments” in the consolidated balance sheets at 31 December 2006 and 2005
is as follows:
The classification, by category and average retention period, of foreclosed assets included in non-
current assets held for sale is as follows:
Thousands of Euros 31/12/06 31/12/05
Associates 5,008 5,558
Jointly controlled entities 101,531 73,838
Total 106,539 79,396
In euros 106,539 79,396
Thousands of Euros Residential Assets Manufacturing Assets Agricultural Assets Total
The cost of development of computer applications and programmes included in “Intangible Assets”
was capitalised because the requirements for recognition were met.
No impairment losses on intangible assets were recognised or reversed in 2006 and 2005.
All the Group's intangible assets at 31 December 2006 and 2005 were denominated in euros.
(16) Tax assets and liabilities
The breakdown of “Tax Assets” and “Tax Liabilities” in the consolidated balance sheet is as follows:
Thousands of Euros Current Deferred
31/12/06 31/12/05 31/12/06 31/12/05
Tax assets 45,224 101,564 181,086 181,116
Corporation tax withholdings and prepayments 10,312 70,149 - -
Income tax 7,882 13,571 181,086 181,116
VAT 27,050 17,844 - -
Tax liabilities 66,668 26,602 71,831 101,730
Personal income tax withholdings 9,669 3,021 - -
Income tax 51,036 17,675 71,831 101,730
VAT 5,443 5,428 - -
Other 520 478 - -
The changes in deferred tax assets and liabilities in 2006 and 2005 were as follows:
Deferred Taxes
Assets Liabilities
Balance at 31/12/04 228,079 154,649
Additions 9,088 73
Retirements 56,051 52,992
Balance at 31/12/05 181,116 101,730
Additions 22,098 3,501
Retirements 22,128 33,400
Balance at 31/12/06 181,086 71,831
LEGAL GRUPO ingles.qxd 13/6/07 08:44 Página 68
The changes in deferred taxes in 2006 were as follows:
The detail of “Deferred Tax Assets” and “Deferred Tax Liabilities” is as follows:
Thousands of Euros
Deferred tax assets arising from: 2006 2005
General allowance 117,533 112,112
Provisions to pension funds 12,347 16,561
Other provisions 34,382 34,817
Other:
Early retirement fund 6,844 9,593
Software 2,613 6,651
Renting 453 499
Loan fees and commissions 6,914 -
Treasury shares - 883
181,086 181,116
Thousands of Euros
Deferred tax liabilities: 2006 2005
Revaluations 54,962 65,369
Other:
Available-for-sale financial assets 8,231 30,098
Other 8,638 6,263
71,831 101,730
69Bankinter Group
Thousands of Euros Balance at 31 Charge/Credit Foreign Currency Charge/Credit Adquisiciones Enajenaciones Saldo al 31 deDecember to Income Balance Translation to Asset and del ejercicio del ejercicio diciembre
2005 Differences and Liability Revaluation de 2006Other Items
The additions to deferred tax assets relate mainly to deferred taxes in connection with larger
provisions not deductible for tax purposes. The retirements relate to both the release of provisions
that were not tax deductible and the effect of the revaluation of these deferred tax assets arising
from the reduction in income tax rates as from 2007 (Note 43).
The retirements from deferred tax liabilities relate to both the changes in the results of the
available-for-sale portfolio and the effect of the revaluation of these deferred tax liabilities arising
from the reduction in income tax rates as from 2007 (Note 43).
(17) Prepayments and accrued income and Accrued expensesand deferred income
The breakdown of “Prepayments and Accrued Income” and “Accrued Expenses and Deferred
Income” in the consolidated balance sheets at 31 December 2006 and 2005 is as follows:
Thousands of Euros 31/12/06 31/12/05
Prepayments and accrued income
Prepayments 7,365 6,772
Other accruals 57,041 26,505
Total 64,406 33,277
In euros 62,954 32,081
In foreign currencies 1,452 1,196
Total 64,406 33,277
Thousands of Euros 31/12/06 31/12/05
Accrued expenses and deferred income
Accrued expenses 39,231 32,455
Other accruals 50,159 23,278
Total 89,390 55,733
In euros 89,390 55,733
Bankinter Group 70
LEGAL GRUPO ingles.qxd 13/6/07 08:44 Página 70
(18) Other assets and other liabilities
The breakdown of “Other Assets” and “Other Liabilities” in the consolidated balance sheets at 31
December 2006 and 2005 is as follows:
Thousands of Euros Assets Liabilities
31/12/06 31/12/05 31/12/06 31/12/05
Transactions in transit 182,367 162,337 38,798 23,700
Net pension plan assets 85 88 - -
Other 22,053 10,470 49,690 22,008
Total 204,505 172,895 88,488 45,708
In euros 204,459 172,873 88,486 45,708
In foreign currencies 46 22 2 -
Total 204,505 172,895 88,488 45,708
“Other Assets – Transactions in Transit” at 31 December 2006 includes mainly EUR 180,949
thousand (31 December 2005: EUR 131,888 thousand) relating to unsettled transactions with the
Bank of Spain.
(19) Financial liabilities at amortised cost
The breakdown of “Financial Liabilities at Amortised Cost” in the consolidated balance sheets at 31
December 2006 and 2005 is as follows:
Thousands of Euros 31/12/06 31/12/05
Deposits from central banks 24 580,141
Deposits from credit institutions 6,972,252 5,712,746
Money market operations through counterparties 10,000 10,000
Customer deposits 18,409,659 15,490,497
Marketable debt securities 14,273,921 11,986,462
Subordinated liabilities 594,162 382,021
Other financial liabilities 349,344 408,337
Total 40,609,362 34,570,204
In euros 39,494,989 33,741,574
In foreign currencies 1,114,373 828,630
Total 40,609,362 34,570,204
71Bankinter Group
LEGAL GRUPO ingles.qxd 13/6/07 08:44 Página 71
B
The changes, by type of instrument, in “Financial Liabilities at Amortised Cost” in 2006 and 2005
were as follows:
The breakdown of “Valuation Adjustments - Financial Liabilities at Amortised Cost” at 31 December
2006 and 2005 is as follows:
Thousands of Euros 31/12/06 31/12/05
Accrued interest 165,846 182,692
Deposits from central banks 24 141
Deposits from credit institutions 44,891 94,119
Customer deposits 47,679 40,862
Marketable debt securities 69,831 44,954
Subordinated liabilities 3,421 2,616
Micro-hedge transactions 32,499 50,751
Other 13,830 8,053
Total 212,175 241,496
Note 45, “Risk Management Policies”, contains details of the maturities and interest rate
adjustment periods of the items composing “Financial Liabilities at Amortised Cost”.
Note 44, “Assets and Liabilities Measured at Other than Fair Value”, furnishes a detail, by
instrument, of the fair value of the financial liabilities at amortised cost and describes the method
used to calculate it.
Bankinter Group 72
Thousands of Euros Deposits Deposits Money Market Customer Marketable Subordinated Other Totalfrom Central from Credit Operations Deposits Debt Liabilities Financial
Total 7,701,616 4,594,070 959,659 1,187,368 198,951 524,375 202,804 121,654 15,490,497
LEGAL GRUPO ingles.qxd 13/6/07 08:44 Página 75
B
At 31 December 2006, the outstanding balance of promissory note and Euro commercial paper
issues amounted to EUR 2,678,310 thousand and EUR 752,382 thousand, respectively (promissory
note issues outstanding amounted to EUR 3,615,602 thousand at 31 December 2005).
The detail of the note issues outstanding at 31 December 2006 and 2005 is as follows:
Thousands of Euros 31/12/06 31/12/05
CNMV Registration Date Outstanding Balance Outstanding Balance
21/03/03 - 161
18/03/04 - 1,742
21/12/04 732 2,644,687
01/12/05 1,326,828 969,012
21/11/06 1,350,750 -
Total 2,678,310 3,615,602
These issues are denominated in euros.
EUR 97,961 thousand of interest were paid on these promissory note issues in 2006 (Note 30)
(2005: EUR 67,548 thousand).
� Other securities associated with transferred financial assetsThe balance of this item relates to asset securitisation bonds and mortgage securitisation bonds
issued by the securitisation funds included in the Group's consolidated balance sheet.
Convertible securitiesOn 25 June 1998 the Annual General Meeting authorised the Board of Directors to issue, for the
Bank's employees, up to EUR 300,506 thousand (issued or outstanding) of bonds or debentures
convertible into shares of Bankinter, S.A., to be financed by Bankinter, S.A. at an interest rate of
12-month Mibor less a spread of 2.5%, with minimum total annual interest of 0.10%. By virtue
of this authorisation, five convertible debenture issues have been launched since that date.
The dates for conversion of Convertible Debenture Issue I for Group employees are 2 January 2001,
2002, 2003, 2004, 2005, 2006, 2007, 2008 and 2009. As mentioned in Note 23 “Own Funds”, in
January 2006 and 2005 certain of these debentures were converted into shares and, as a result,
share capital increased by EUR 513 thousand and EUR 794 thousand, respectively (341,681 and
529,363 shares, respectively), with a share premium of EUR 9,838 thousand and EUR 14,628
thousand, respectively. The exchange ratio was one share per debenture. The face value of each
debenture issued is EUR 24.77. At 31 December 2006 the outstanding balance of the convertible
Bankinter Group 76
LEGAL GRUPO ingles.qxd 13/6/07 08:44 Página 76
77Bankinter Group
debentures was EUR 31,854 thousand (31 December 2005: EUR 40,317 thousand). In 2000, 2001
and 2002 Convertible Debenture Issues II and III (both of which were redeemed early in those
years) and Convertible Debenture Issue IV were launched.
On 14 November 2002 the Board of Directors resolved to redeem early Convertible Debenture Issue
IV for employees, and to launch Convertible Debenture Issue V for employees at a conversion price
of EUR 25.04 per share. The subscribers to the Issue V debentures, the subscription period for
which commenced on 20 January 2003, were the holders of Issue IV convertible debentures at the
date of early redemption who continued to be Group employees at the issue date, with the
exceptions specified in the issue resolution. The exchange ratio of the convertible debentures is one
share per debenture. The debenture conversion dates are 5 April 2001, 2002, 2003, 2004, 2005,
2006, 2007, 2008, 2009 and 2010. In April 2006 and 2005 certain of these debentures were
converted into shares and, as a result, share capital increased by EUR 490 thousand and EUR 805
thousand, respectively (326,577 and 536,971 shares, respectively), with a share premium of EUR
9,231 thousand and EUR 14,761 thousand, respectively. At 31 December 2006, the outstanding
balance of Issue V was EUR 30,976 thousand (31 December 2005: EUR 40,917 thousand).
The Group reserves the right to redeem the issues early in full, in part or by repurchase. The detail
of the voluntary and mandatory conversions outstanding at 31 December 2006 and 2005 is as
follows:
Conversions Outstanding
Issue Date Year (%) Exchange Exchange Ratio Face Value of Debenture (Euros)
First
Voluntary 02/01 2006 and 2008 10% 1-1 24.77
Mandatory 02/01 2007 and 2009 20% 1-1 24.77
Fifth
Mandatory 05/04 2006 to 2010 12.50% 1-1 25.04
LEGAL GRUPO ingles.qxd 13/6/07 08:44 Página 77
The detail of the mandatory and voluntary conversions in 2006 and 2005 is as follows:
Euros Date Maximum Number of Market Price of Bankinter Exchange (%) Shares/Debentures Share (Euros)
2006
Mandatory
Issue I 02/01/06 20.00% 341,681 47.56
Issue V 05/04/06 12.50% 326,577 56.65
Voluntary
2005
Mandatory
Issue I 02/01/05 20.00% 529,363 39.20
Issue V 05/04/05 12.50% 536,971 39.43
Voluntary
The detail of the debentures convertible into shares of Bankinter, S.A. outstanding at 31 December
2006 and 2005 is as follows:
Thousands of Euros Outstanding Balance Interest Commencement Maturity
Issue Currency Face Value 31/12/06 31/12/05 Rate Date Date Listed
First Euro 98,542 31,854 38,995 Mibor – 2.5% 01/12/98 02/01/09 Yes
Other non-convertible securities and hybrid liabilitiesAt 31 December 2006 and 2005 other non-convertible securities and hybrid liabilities included the
outstanding balance of bond, debenture and promissory note issues launched by the Group.
BBankinter Group 78
LEGAL GRUPO ingles.qxd 13/6/07 08:44 Página 78
The detail of the bond and debenture issues outstanding at 31 December 2006 and 2005 is as
follows:
31/12/06
Thousands of Euros Outstanding Last
Issue Face Value Balance Interest Rate Listed Maturity Date
Casa Kishoo, S.A. 9,724,063 7,340,212 316,690 403,950 12.78 10.01
(b) Share premiumOn each conversion, share premium is increased by the sum of the difference between the
nominal value of convertible debentures converted and the nominal value of the shares issued plus
the value of the options that is included, with a charge to personnel expenses, under “Other Equity
Instruments”. In 2006 the share premium was increased by EUR 19,068 thousand (2005: EUR
29,389 thousand).
85Bankinter Group
LEGAL GRUPO ingles.qxd 13/6/07 08:44 Página 85
B
(c) ReservesThe detail of “Reserves” in the consolidated balance sheet is as follows:
Thousands of Euros 31/12/06 31/12/05
Legal reserve 44,503 34,077
Unrestricted reserve 468,678 399,120
Reserve for first-time application of IFRSs 135,741 135,741
Revaluation reserve 126,374 133,423
Reserve for treasury shares 121,718 121,836
Shares acquired 33,645 33,763
Shares accepted as security 88,073 88,073
Canary Islands investment reserve 28,363 27,163
Net gains on treasury shares 18,029 3,644
Reserves (losses) of entities accounted for using the equity method 35,792 15,196
Associates (1,371) 3,167
Jointly controlled entities 37,163 12,029
Total 979,199 870,200
Legal reserve10% of net profit for each year must be transferred to the legal reserve until the balance of this
reserve reaches at least 20% of share capital. The legal reserve cannot be distributed to
shareholders and can only be used to offset losses, provided that other reserves are not available
for this purpose. Also, under certain circumstances the legal reserve can be used to increase share
capital, provided that the remaining reserve balance does not fall below 10% of the increased
share capital amount.
Revaluation reservesThis item in the consolidated balance sheet is the result of the tangible asset revaluations made
pursuant to Royal Decree Law 7/1996 and the property revaluation performed on 1 January 2004,
as permitted by the accounting standards and rules then in force.
Voluntary reservesThe balance of the voluntary reserves is unrestricted.
Reserve for first-time application of IFRSsThis reserve includes the adjustments made in the opening consolidated balance sheet at 1
January 2004 due to the application of the new accounting standards in 2005.
Bankinter Group 86
LEGAL GRUPO ingles.qxd 13/6/07 08:44 Página 86
Reserves (losses) of entities accounted for using the equity methodThe detail of the reserves and losses at companies accounted for using the equity method is as
follows:
Thousands of Euros 31/12/06 31/12/05 Reserves Losses Reserves Losses
Línea Directa Aseguradora, S.A. 36,495 - 11,505 -
Grupo Industrial Catensa, S.A. - - - -
Techrules Escuela de Finanzas, S.A. 15 - - 13
Mercavalor, S.V., S.A. - 1,371 272 -
Prota, S.A. - - 2,895 -
Helena Activos Líquidos, S.L. 344 - 348 -
Eurobits Technologies, S.L. 309 - 189 -
Total 37,163 1,371 15,209 13
(d) Other equity instrumentsAt 31 December 2006 “Other Equity Instruments” included EUR 11,695 thousand (31 December
2005: EUR 12,384 thousand) relating to the accrued portion of the value of the implicit options in
outstanding issues of convertible debentures for employees, the balancing entry for which is under
“Personnel Expenses”.
(e) Treasury sharesAt 31 December 2006, the Group held 17,789 treasury shares of EUR 1.5 par value each (31
December 2005: 909,320 treasury shares).
In 2006 the Bankinter Group purchased 1,107,121 shares (2005: 603,375) and sold 1,998,652
shares (2005: 701,432) in the stock market. The net gains on these transactions are included under
“Reserves” in the consolidated balance sheet.
The changes in 2006 and 2005 in the number of treasury shares held by the Group were as follows:
Number of Shares
Balance at 31/12/04 1,007,377
Additions 603,375
Disposals 701,432
Balance at 31/12/05 909,320
Additions 1,107,121
Disposals 1,998,652
Balance at 31/12/06 17,789
87Bankinter Group
LEGAL GRUPO ingles.qxd 13/6/07 08:44 Página 87
B
The detail of treasury shares at 31 December 2006 and 2005 is as follows:
At 31 December 2006, 384,746 treasury shares with a total par value of EUR 577 thousand had
been accepted from customers as security for transactions (31 December 2005: 399,393 treasury
shares; EUR 599 thousand).
(f) Profit attributed to the GroupThe detail of the individual profit or loss of each of the Group companies in 2006 and 2005 is as
follows:
2006 2005
Bankinter, S.A. 166,538 160,737
Bankinter Consultoría, Asesoramiento y Atención Telefónica, S.A. 301 267
Bankinter Gestión de Seguros, S.A. de Correduría de Seguros 891 867
Bankinter International B.V. (174) 489
Bankinter Gestión de Activos, S.A., S.G.I.I.C. 22,845 19,529
Hispamarket, S.A. 25,595 2,193
Intergestora, Sociedad de Capital Riesgo, S.A., S.C.R. 182 (343)
Regular way financial asset purchase contracts 295,238 204,014
Securities subscribed but not paid 4,153 4,153
Other contingent commitments 27,400 31,891
Total 7,719,955 6,070,155
“Contingent Commitments - Drawable by Third Parties” includes the full amount of immediately
drawable committed credit facilities.
(26) Transfers of financial assets
The breakdown of the Group's financial asset transfers at 31 December 2006 and 2005 is as follows:
Thousands of Euros 31/12/06 31/12/05
Derecognised before 1 January 2004 2,762,205 3,269,150
Retained in full on the balance sheet 7,378,769 4,612,513
Total 10,140,974 7,881,663
91Bankinter Group
LEGAL GRUPO ingles.qxd 13/6/07 08:44 Página 91
B
The derecognised assets relate to loans securitised prior to 1 January 2004; the detail of these
loans and of the related special-purpose vehicles (SPVs) is as follows:
� In 2003 mortgage loans totalling EUR 1,350,000 thousand were transferred to “Bankinter 6,
Fondo de Titulización de Activos” and SME loans totalling EUR 250,000 thousand were transferred
to “Bankinter I FTPYME, Fondo de Titulización de Activos”. � In 2002 mortgage loans totalling EUR 1,025,000 thousand and EUR 710,000 thousand were
transferred to “Bankinter 4, Fondo de Titulización Hipotecaria” and “Bankinter 5, Fondo de
Titulización Hipotecaria”, respectively.� In 2001 mortgage loans totalling EUR 1,332,500 thousand were transferred to “Bankinter 3,
Fondo de Titulización Hipotecaria”.� In 1999 mortgage loans totalling EUR 600,000 thousand and EUR 320,000 thousand were
transferred to “Bankinter 1, Fondo de Titulización Hipotecaria” and “Bankinter 2, Fondo de
Titulización Hipotecaria”, respectively.
The assets retained in full on the Bank's balance sheet relate to loans securitised after 1 January
2004, as detailed below.
Three transactions were performed in 2006. The first securitisation involved the transfer of
mortgage loans totalling EUR 1,200,000 thousand to “Bankinter 12, Fondo de Titulización
Hipotecaria”. The securities issued by this SPV, of which EUR 13,100 thousand relate to series B,
EUR 11,900 thousand to series C, EUR 11,300 thousand to series D and EUR 11,300 thousand to
series E subordinated bonds, were placed in full on the institutional market.
The second securitisation involved the transfer of mortgage loans totalling EUR 1,570,000
thousand to “Bankinter 13, Fondo de Titulización de Activos”. The securities issued by this SPV,
of which EUR 22,400 thousand relate to series B, EUR 24,100 thousand to series C, EUR 20,500
thousand to series D and EUR 20,600 thousand to series E subordinated bonds, were placed in full
on the institutional market.
The third securitisation involved the transfer of loans granted to SMEs totalling EUR 800,000
thousand to “Bankinter 2 Pyme, Fondo de Titulización Activos”. The securities issued by this SPV,
of which EUR 16,200 thousand relate to class B, EUR 27,500 thousand to class C, EUR 10,700
thousand to class D and EUR 14,600 thousand to class E subordinated bonds, were placed in full on
the institutional market.
Three transactions were performed in 2005. The first of these securitisations involved the transfer
of loans totalling EUR 1,035,000 thousand to “Bankinter 9, Fondo de Titulización de Activos”. The
securities issued by this SPV, of which EUR 32,500 thousand are series B subordinated bonds and
EUR 14,100 thousand are series C subordinated bonds, were placed in full on the institutional
market.
Bankinter Group 92
LEGAL GRUPO ingles.qxd 13/6/07 08:44 Página 92
The second securitisation involved the transfer of loans totalling EUR 1,740,000 thousand to
“Bankinter 10, Fondo de Titulización de Activos”. The securities issued by this SPV, of which
EUR 20,700 thousand relate to series B, EUR 22,400 thousand to series C, EUR 19,100 thousand to
series D and EUR 22,400 thousand to series E subordinated bonds, were placed in full on the
institutional market.
The third securitisation involved the transfer of mortgage loans totalling EUR 900,000 thousand to
“Bankinter 11, Fondo de Titulización Hipotecaria”. The securities issued by this SPV, of which
EUR 15,600 thousand relate to class B, EUR 15,300 thousand to class C, EUR 9,800 thousand to
class D and EUR 12,500 thousand to class E subordinated bonds, were placed in full on the
institutional market.
The main features of the securitisations performed after 1 January 2004 are as follows:
93Bankinter Group
SPV Series Amount Interest Legal Maturity
Bankinter 7 Fondo de Titulización Hipotecaria Series A 471,800 3-m Eur + 0.21% 16/09/40
Series B 13,000 3-m Eur + 0.55%
Series C 5,200 3-m Eur + 1.20%
Total 490,000
Bankinter 8 Fondo de Titulización de Activos Series A 1,029,300 3-m Eur + 0.17% 15/12/40
Series B 21,400 3-m Eur + 0.48%
Series C 19,300 3-m Eur + 1.00%
Total 1,070,000
Bankinter 9 Fondo de Titulización de Activos Series A1 (P) 66,600 3-m Eur + 0.07% 16/07/42
Series A2 (P) 656,000 3-m Eur + 0.11%
Series B (P) 15,300 3-m Eur + 0.50%
Series C (P) 7,100 3-m Eur + 0.95%
Total (1) 745,000
Series A1 (T) 21,600 3-m Eur + 0.07% 16/07/42
Series A2 (T) 244,200 3-m Eur + 0.11%
Series B (T) 17,200 3-m Eur + 0.50%
Series C (T) 7,000 3-m Eur + 0.95%
Total (2) 290,000
Total (1+2) 1,035,000
LEGAL GRUPO ingles.qxd 13/6/07 08:44 Página 93
Bankinter Group B94
SPV Series Amount Interest Legal Maturity
Bankinter 10 Fondo de Titulización de Activos Series A1 80,000 3-m Eur + 0.08% 21/06/43
Series A2 1,575,400 3-m Eur + 0.16%
Series B 20,700 3-m Eur + 0.29%
Series C 22,400 3-m Eur + 0.70%
Series D 19,100 3-m Eur + 2.00%
Series E 22,400 3-m Eur + 3.90%
Total 1,740,000
Bankinter 11 Fondo de Titulización Hipotecaria Series A1 30,000 3-m Eur + 0.05% 21/08/48
Series A2 816,800 3-m Eur + 0.14%
Series B 15,600 3-m Eur + 0.30%
Series C 15,300 3-m Eur + 0.55%
Series D 9,800 3-m Eur + 2.25%
Series E 12,500 3-m Eur + 3.90%
Total 900,000
Bankinter 12 Fondo de Titulización Hipotecaria Series A1 50,000 3-m Eur + 0.04% 15/12/43
Series A2 1,102,400 3-m Eur + 0.12%
Series B 13,100 3-m Eur + 0.25%
Series C 11,900 3-m Eur + 0.35%
Series D 11,300 3-m Eur + 2.25%
Series E 11,300 3-m Eur + 3.90%
Total 1,200,000
Bankinter 13 Fondo de Titulización de Activos Series A1 85,000 3-m Eur + 0.06% 17/07/49
Series A2 1,397,400 3-m Eur + 0.15%
Series B 22,400 3-m Eur + 0.27%
Series C 24,100 3-m Eur + 0.48%
Series D 20,500 3-m Eur + 2.25%
Series E 20,600 3-m Eur + 3.90%
Total 1,570,000
Bankinter 2 PYME Fondo de Titulización de Activos Series A1 49,000 3-m Eur + 0.06% 16/05/46
Series A2 682,000 3-m Eur + 0.12%
Series B 16,200 3-m Eur + 0.22%
Series C 27,500 3-m Eur + 0.52%
Series D 10,700 3-m Eur + 2.10%
Series E 14,600 3-m Eur + 3.90%
Total 800,000
LEGAL GRUPO ingles.qxd 13/6/07 08:44 Página 94
The outstanding balances of the securitisations at 31 December 2006 and 2005 were as follows:
Thousands of Euros 31/12/06 31/12/05
Derecognised before 1 January 2004
Bankinter 1 Fondo de Titulización Hipotecaria 140,617 177,645
Bankinter 2 Fondo de Titulización Hipotecaria 103,292 125,243
Bankinter 3 Fondo de Titulización Hipotecaria 604,737 716,058
Bankinter 4 Fondo de Titulización Hipotecaria 573,302 670,809
Bankinter 5 Fondo de Titulización Hipotecaria 381,577 449,694
Bankinter 6 Fondo de Titulización Hipotecaria 882,080 1,017,722
Bankinter 1 FTPYME 76,600 111,979
Total 2,762,205 3,269,150
Retained in full on the balance sheet
Bankinter 7 Fondo de Titulización Hipotecaria 307,351 352,434
Bankinter 8 Fondo de Titulización de Activos 705,536 823,440
Bankinter 9 Fondo de Titulización de Activos 830,968 942,909
Bankinter 10 Fondo de Titulización de Activos 1,428,880 1,616,815
Bankinter 11 Fondo de Titulización Hipotecaria 794,014 876,915
Bankinter 12 Fondo de Titulización Hipotecaria 1,081,664 -
Bankinter 2 PYME Fondo de Titulización de Activos 703,892 -
Bankinter 13 Fondo de Titulización de Activos 1,526,464 -
Total 7,378,769 4,612,513
(27) Other memorandum items – Financial derivatives
The breakdown of other memorandum items at 31 December 2006 and 2005 is as follows:
Thousands of Euros 31/12/06 31/12/05
Financial derivatives (Notes 7 and 11)
Currency risk 2,555,355 1,625,517
Interest rate risk 40,978,569 38,039,948
Equity price risk 1,818,805 1,424,733
Other risks - 90
Total 45,352,729 41,090,288
95Bankinter Group
LEGAL GRUPO ingles.qxd 13/6/07 08:44 Página 95
B
(28) Personnel expenses
The detail of the amounts recognised under “Personnel Expenses” in the consolidated income
statements for 2006 and 2005 is as follows:
Thousands of Euros 2006 2005
Wages and bonuses paid to current employees 159,192 137,680
Social security contributions 35,916 31,301
Contributions to defined contribution pension plans 6,412 2,166
Termination benefits 18,062 1,134
Equity instrument-based remuneration 2,741 3,692
Other personnel expenses 5,014 16,425
Total 227,336 192,398
The detail of the Group's employees based on its pension commitments to them at 31 December
2006 and 2005 is as follows:
31/12/06 31/12/05
Current employees whose recognised service began prior to 8 March 1980 541 466
Former employees with vested pension rights 48 44
Early retirees 101 86
Other current employees 3,291 3,116
Total 3,981 3,712
Post-employment benefitsWith regard to pension obligations, under the current collective labour agreement the Bank has
undertaken to supplement the social security benefits accruing to employees hired prior to 8 March
1980 and, under agreements entered into on an individual basis, to certain other employee groups,
for retirement (defined benefit plans), and in other certain cases the Bank has undertaken to pay
an amount (defined contribution plans) the equivalent value of which at the date of retirement will
be the benefit payable to the employee at that date. Also, under the current collective labour
agreement the Bank has undertaken to supplement, if required, certain social security benefits for
permanent disability, death of spouse or death of parent.
Bankinter Group 96
LEGAL GRUPO ingles.qxd 13/6/07 08:44 Página 96
In order to cover the aforementioned pension obligations, the Bank arranged an insurance contract
with Winterthur Seguros y Reaseguros, S.A. which, with the unconditional guarantee of its parent,
Winterthur AG, guarantees the future coverage of all the supplementary pension payments until
2003. Also, the aforementioned benefits to former employees as from 2003 and to current
employees are covered through a coinsurance policy, under which the benefits are guaranteed 40%
by Winterthur Seguros y Reaseguros, acting as the lead coinsurer, and 30% each by Caser
Ahorrovida S.A de Seguros y Reaseguros and Allianz, Compañía de Seguros y Reaseguros S.A.
In 2006 the annual premiums recognised to cover retirement obligations amounted to EUR 6,430
thousand (2005: EUR 2,464 thousand).
In 2006 the net recovery of the provisions recognised for retirement amounted to EUR 5,642
thousand, affecting current employees substantially in full.
The premium paid to cover death and disability amounted to EUR 28 thousand in 2006 (2005:
EUR 45 thousand).
Current employeesThe basic actuarial assumptions used to calculate the commitments to current employees at 31
December 2006 and 2005 were as follows:
97Bankinter Group
h
,
l
31/12/06 31/12/05
Mortality: Probabilities established in GKM/-95 tables, 80%. Probabilities established in GKM/-95 tables, 80%.
Life expectancy
Male: Probability associated with the PERM-2000 P table. Probability associated with the PERM-2000 P table.
Female: Probability associated with the PERF- 2000 P table. Probability associated with the PERF- 2000 P table.
Disability: Probabilities established in Ministerial Order dated Probabilities established in Ministerial Order dated 24/01/197724/01/1977 on bank insurance, net of expenses. on bank insurance, net of expenses.
Discount rate: Euribor zero-coupon curve at 20/12/06. Zero-coupon curve of Spanish government debt (30/12/05).
CPI growth: 2% 2%
Salary increase rate: 3.50% for remuneration stipulated by the collective 3.50% for remuneration stipulated by the collective labour labour agreement and the average increase in the agreement and 5.25% for annual emoluments for employees period from 2003 to 2005 for employees not covered not covered by the agreement.by the agreement (giving a weighted averageincrease per salary of 4.77%).
Social security cost variations
Growth of contribution bases
Maximum contribution base: 2% 2%
Increase in maximum pension: 2% 2%
LEGAL GRUPO ingles.qxd 13/6/07 08:44 Página 97
B
The most significant data of the actuarial studies performed at 31 December 2006 and 2005 are as
follows:
Thousands of Euros 31/12/06 31/12/05
Value of the obligations 85,696 111,607
Fair value of the plan assets:
Allianz 25,642 34,109
Caser 25,642 34,109
Winthertur 34,189 45,478
With respect to defined contribution pension obligations, the value of the accrued liability for non-
vested pension benefits and of the liability for non-vested pension benefits and the amount
relating to insurance contracts that qualify for treatment as external funds is the same, i.e.
EUR 7,489 thousand.
The most noteworthy difference between the actuarial valuations at 31 December 2005 and 2006
was the reduction in the provisions relating to the retirement obligations due to the performance of
the financial markets in 2006. 30-year returns –the average financial term of the obligations
assumed– were 3.65% at 31 December 2005 and 4.10% at 31 December 2006; consequently, the
amounts assigned to cover pension obligations were reduced by EUR 12,211 thousand.
The future salary increase assumption was modified to determine pension obligations not included
in the collective labour agreement. This modification consisted of establishing the assumptions on
the basis of the average salary increases for 2003 to 2005, compared to the assumptions used
previously which ranged from 5.25% to 9%, depending on the employee’s individual situation.
This gave rise to a reduction in the coverage of pension obligations of EUR 6,677 thousand.
Bankinter Group 98
LEGAL GRUPO ingles.qxd 13/6/07 08:44 Página 98
Vested employee pension benefitsThe most significant data of the actuarial studies performed at 31 December 2006 and 2005 are as
follows:
The most noteworthy difference between the actuarial valuations at 31 December 2005 and 2006
was the reduction in the provisions relating to the retirement obligations due to the performance of
the financial markets in 2006. 14-year returns –the average financial term of the obligations
assumed– were 3.47% at 31 December 2005 and 4.18% at 31 December 2006; consequently, the
amounts relating to the coverage of pension obligations were reduced by EUR 511 thousand.
Early retirees. Post-employment and other long-term remunerationIn 2002 and 2003 the Bank implemented two early retirement programmes. The commitments to
the early retirees until the date of statutory retirement were covered through insurance policies
taken out with the insurance company Nationale-Nederlanden Vida. The obligations to early
retirees from the retirement date are covered through a single coinsurance policy arranged with
Winterthur (40%), Allianz (30%) and Caser (30%) to cover current personnel receiving vested
pensions as from 2003.
99Bankinter Group
f
31/12/06 31/12/05
Value of obligations 7,110 7,466
Fair value of plan assets 6,022 7,466
Actuarial assumptions
Tables used
Pensions deriving from initial premium GRM/F-80 GRM/F-80
Pensions deriving from subsequent contributions GRM/F-95 and PERMF/2000 GRM/F-95 and PERMF/2000
Discount rate Euribor zero-coupon curve at 20/12/06 Zero-coupon curve of Spanish government debt (30/12/05).
Salary increase rate Not applicable Not applicable
Pension revaluation rate 2% for benefits subject to revaluation 2% for benefits subject to revaluation
LEGAL GRUPO ingles.qxd 13/6/07 08:44 Página 99
Thousands of Euros 31.12.06 31.12.05
Early Statutory Early StatutoryRetirement Phase Retirement Phase Retirement Phase Retirement Phase
Other long-term employee benefits:
2002 early retirees 8,943 - 11,820 -
2003 early retirees 15,171 - 17,514 -
Post-employment benefits
2002 early retirees - 9,059 - 11,990
2003 early retirees - 6,254 - 6,038
Insurance contracts linked to pensions
Nationale Nederlanden Vida 24,014 - 29,334 -
Allianz, Compañía de Seguros y Reaseguros , S.A. - 4,603 - 5,409
Caser, S.A., de Seguros y Reaseguros sobre la Vida - 4,603 - 5,439
Winthertur Vida, S.A., de Seguros y Reaseguros sobre la Vida - 6,137 - 7,257
B
The basic actuarial assumptions used to calculate the commitments to early retirees at 31
December 2006 and 2005 were as follows:
For the statutory retirement phase of the early retirees, the accrued and unaccrued portions of the
obligations at 31 December 2006 and 2005 were calculated considering the same rates of return as
those mentioned above for obligations to current employees.
The most significant data of the actuarial studies performed at 31 December 2006 and 2005 are as
follows:
Bankinter Group 100
31/12/06 31/12/05
Life expectancy:
Male Probability associated with the PERM-2000 P table Probability associated with the PERM-2000 P table
Mujeres Probability associated with the PERF-2000 P table Probability associated with the PERF-2000 P table
Discount rate: Euribor zero-coupon curve at 20/12/06 Zero-coupon curve of Spanish government debt (30/12/05)
CPI growth:
Early retirement phase 2% for benefits subject to revaluation 2% for benefits subject to revaluation
Statutory retirement phase 2% 2%
Salary increase rate:
Statutory retirement phase 0% 0%
Social security cost variations
Early retirement phase:
Increase in maximum contribution base 2% 2%
Increase in maximum pension: 2% 2%
LEGAL GRUPO ingles.qxd 13/6/07 08:44 Página 100
101Bankinter Group
The most noteworthy difference between the actuarial valuations at 31 December 2005 and 2006
was the reduction in the provisions relating to the retirement obligations due to the performance of
the financial markets in 2006. 8-year returns –the average financial term of the obligations
assumed– were 3.25% at 31 December 2005 and 4.06% at 31 December 2006; consequently, the
amounts assigned to cover pension obligations were reduced by EUR 736 thousand.
Changes in pension obligations at 31/12/06 (as compared with 31/12/05) and the coverage thereof:
Valuation at 31/12/05: 166,435
Current employees 111,607
Early retirees (early retirement phase) 29,334
Early retirees (statutory retirement phase) 18,028
Former employees with vested pension rights 7,466
Changes in obligations in 2006: (34,203)
Accruals for 2006: 2,830
Interest on pension funds: 6,223
Reduction due to settlement of benefits or because obligations cease to exist: (17,521)
Actuarial gains and losses (variance and modification of assumptions) (25,735)
Valuation at 31/12/06: 132,232
Current employees 85,696
Early retirees (early retirement phase) 24,113
Early retirees (statutory retirement phase) 15,313
Former employees with vested pension rights 7,110
Coverage of obligations: 132,232
Insurance contracts linked to pensions 130,852
Other allowances 1,380
The detail of the average number of employees at the Group in 2006 and 2005 is as follows:
2006 2005
Senior managers 449 448
Executives 1,264 1,252
Other staff 2,140 2,012
Total 3,853 3,712
LEGAL GRUPO ingles.qxd 13/6/07 08:44 Página 101
B
(29) Fee and commission income and expense
The detail of “Fee and Commission Income” and “Fee and Commission Expense” in the consolidated
income statements is as follows:
Thousands of Euros 2006 2005
Fee and commission income
Guarantees and documentary credits 16,796 15,258
Foreign currency exchange and foreign bank notes 7,341 7,539
Collections and payments 69,352 68,415
Trade bills 16,737 14,548
Demand accounts 9,464 9,231
Credit and debit cards 33,546 36,999
Cheques 1,922 1,942
Payment orders 7,683 5,695
Securities services 51,228 31,414
Underwriting and placement 13,498 183
Trading 16,974 13,104
Administration and custody 20,071 18,127
Asset management 685 -
Marketing of non-banking financial products 97,576 85,152
Investment funds 78,377 69,074
Pension funds 12,547 10,340
Insurance 6,652 5,738
Other fees and commissions 44,672 41,899
Total fee and commission income 286,965 249,677
Fee and commission expense
Fees and commissions assigned to other entities and correspondents 17,672 16,120
Fees and commissions assigned to agents, virtual banking 52,174 43,858
Total fee and commission expense 69,846 59,978
Total net fee and commission income 217,119 189,699
Bankinter Group 102
LEGAL GRUPO ingles.qxd 13/6/07 08:44 Página 102
(30) Interest and similar income/Interest expense and similarcharges
The breakdown, by type of transaction, of “Interest and Similar Income” and “Interest Expense
and Similar Charges” in the consolidated income statements for the years ended 31 December 2006
and 2005 is as follows:
Thousands of Euros 2006 2005
Interest and similar income
Balances with the Bank of Spain 7,801 4,975
Loans and advances to credit institutions (Note 9) 133,975 57,626
Loans and advances to customers (Note 9) 1,075,464 741,373
Debt instruments 240,197 252,386
Doubtful assets 1,499 1,649
Rectifications of income as a result of hedging transactions (3,723) 18,550
Other interest 658 56
Total 1,455,871 1,076,615
“Loans and Advances to Customers” includes EUR 687,866 thousand in 2006 relating to secured
loans (2005: EUR 474,471 thousand). “Debt Instruments” includes EUR 235,535 thousand in 2006
relating to book-entry government debt securities (2005: EUR 248,536 thousand).
Thousands of Euros 31/12/06 31/12/05
Interest expense and similar charges
Deposits from the Bank of Spain (Note 19) 3,896 14,560
Deposits from credit institutions (Note 19) 256,117 196,893
Money market operations through counterparties (Note 19) 3,191 1,759
John de Zulueta Greenebaum 125,370.5 117,994 6.2520
Fabiola Arredondo de Vara 95,820.5 82,428 16.2477
Former directors(5)(6) - 40,762.54 -
Total 1,225,220 1,121,250 9.27 %
(In Euros)
(1) Additionally, the Board of Directors approved a special share option plan for 2006 for the CEO, with an investment of EUR 100,000.(2) Appointed as a director in March 2005.(3) Appointed as a director in September 2005.(4) Appointed as a director in May 2005.(5) Elías Masaveu Alonso del Campo ceased to discharge his duties as director due to his death in May 2005, having earned EUR 14,345.08 up to that date.(6) Alfonso Botín-Sanz de Sautuola was appointed as representative of Cartival, S.A. in April 2005. Prior to this appointment hewas director of Bankinter, S.A. and he earned EUR 26,417.46 in this capacity.
LEGAL GRUPO ingles.qxd 13/6/07 08:44 Página 108
The detail, by director, of the fixed remuneration received by the members of the Board of
Directors for attending Board and Board Committee meetings in 2006 and 2005 is as follows:
(4) Elías Masaveu Alonso del Campo ceased to discharge his duties as director due to his death in May 2005, having receivedfixed remuneration of EUR 9,181 up to that date.
(5) Alfonso Botín-Sanz de Sautuola was appointed as representative of Cartival, S.A. in April 2005. Prior to this appointment hewas director of Bankinter, S.A. and he received fixed remuneration of EUR 6,885.63 and attendance fees of EUR 14,385.63.
LEGAL GRUPO ingles.qxd 13/6/07 08:44 Página 109
B
The detail, by director, of the shares issued to directors for no consideration is as follows:
Bankinter Group 110
Director 2006 2005
Amounts Number of Amounts Number ofInvested Shares Issued Invested Shares Issued
Juan Arena de la Mora 48,220.6 872 41,313.93 951
Pedro Guerrero Guerrero 36,165.4 654 30,985.44 713
Jaime Echegoyen Enríquez de la Orden 36,165.4 654 30,985.44 713
Cartival, S.A. 24,110.3 436 20,656.96 475
Marcelino Botín-Sanz de Sautuola y Naveda(1) 24,110.3 436 18,083.87 340
Fernando Masaveu Herrero(2) 24,110.3 436 6,885.65 148
John de Zulueta Greenebaum 24,110.3 436 20,656.96 475
Fabiola Arredondo de Vara 24,110.3 436 20,656.96 475
Former directors(4)(5) - - 5,155.52 270
Total 289,323 5,232 229,809 5,336
(1) Appointed as a director in March 2005.
(2) Appointed as a director in September 2005.
(3) Appointed as a director in May 2005.
(4) Elías Masaveu Alonso del Campo ceased to discharge his duties as director due to his death in May 2005, having receivedEUR 2,582.12 in shares up to that date.
(5) Alfonso Botín-Sanz de Sautuola was appointed as representative of Cartival, S.A. in April 2005. Prior to this appointment hewas director of Bankinter, S.A. and he received EUR 2,582.12 in shares in this capacity.
LEGAL GRUPO ingles.qxd 13/6/07 08:44 Página 110
At 31 December 2006 there were four option plans on Bankinter, S.A. shares in force for the Bank's
directors.
The options granted under the first plan, “Plan 2003”, can only be exercised by the directors from
2 January 2006 to 2 January 2008. At 31 December 2006 the cumulative return on this plan was
135.67% (31 December 2005: 88.06%).
The options granted under the second plan, “Plan 2004”, can only be exercised by the directors
from 2 January 2007 to 2 January 2009. At 31 December 2006 the cumulative return on this plan
was 85.73% (31 December 2005: 48.21%).
The options granted under the third plan, “Plan 2005”, can only be exercised by the directors from
2 January 2008 to 2 January 2010. At 31 December 2006 the cumulative return on this plan was
57.59% (31 December 2005: 25.75%).
111Bankinter Group
The detail, by director, of the share options granted to directors is as follows:
Director 2006 (euros) 2005 (euros)
Amounts Invested (*) Amounts Invested (*)
Juan Arena de la Mora 48,220.6 41,313.93
Pedro Guerrero Guerrero 36,165.4 30,985.44
Jaime Echegoyen Enríquez de la Orden(1) 36,165.4 30,985.44
Cartival, S.A. 24,110.3 20,657.96
Marcelino Botín-Sanz de Sautula y Naveda(2) 24,110.3 18,083.87
Fernando Masaveu Herrero(3) 24,110.3 6,885.65
Ramchand Bhavnani Wadhumal(4) 24,110.3 13,771.31
José Ramón Arce Gómez 24,110.3 20,656.96
John de Zulueta Greenebaum 24,110.3 20,656.96
Fabiola Arredondo de Vara 24,110.3 20,656.96
Former directors - 5,155.52
Total 289,323 229,808
(1) The CEO was also granted share options as part of the aforementioned 2006 special share options plan.
(2) Appointed as a director in March 2005
(3) Appointed as a director in September 2005
(4) Appointed as a director in May 2005.
(*) The related number of shares is determined by the market prices of the share options.
LEGAL GRUPO ingles.qxd 13/6/07 08:44 Página 111
B
The options granted under the fourth plan, “Plan 2006”, can only be exercised by the directors from
2 January 2009 to 2 January 2011. At 31 December 2006 the cumulative return on this plan was
28.64%.
2. Loans and guaranteesAt 31 December 2006 the loans and credit facilities granted to directors totalled EUR 11,115
thousand (31 December 2005: EUR 5,629 thousand) and the guarantees provided for them by the
Bank amounted to EUR 69 thousand (31 December 2005: EUR 263 thousand). Additionally, the
executive directors were granted loans for the acquisition of convertible debentures relating to
Bankinter’s 1998 Convertible Debenture Issue I and to Bankinter’s January 2003 Convertible
Debenture Issue V, with a cumulative amount of EUR 11,566 thousand.
The average term of the loans and credit facilities was 12 years in 2006 (2005: approximately 11
years). The interest rates ranged from 3.41 % to 5.60% in 2006 (2005: 2.35% to 4.10%), excluding
the financing of convertible debentures, the interest rate on which is the same as that on the
debentures, and imputing the related compensation in kind).
The guarantees provided for the Bank's directors have an undefined average term and the
commissions thereon ranged from 0.50 % to 4.00% in 2006 (2005: 0.40% to 4.00%).
3. Summary of remuneration, loans and other directors’ benefits
3.1 Remuneration (thousands of euros)
Fixed remuneration 2,213(1)
Variable remuneration 651(2)
Attendance fees 388(3)
Bylaw-stipulated directors' emoluments 548(4)
Share options and/or other financial instruments 389(5)
Other 332
Total 4,521
(1) Fixed remuneration relating to executive directors in their capacity as executives.
(2) Variable remuneration relating to executive directors in their capacity as executives.
(3) Attendance fees at Board and Committee meetings (all directors).
(4) Consists of fixed remuneration plus shares issued for no consideration (all directors).
(5) Share option plans for directors (all directors; includes the special plan for the CEO).
Bankinter Group 112
LEGAL GRUPO ingles.qxd 13/6/07 08:44 Página 112
3.2. Total remuneration, by type of director (thousands of euros)
Type of Director By Company By Group
Executive directors 3,631 -
Non-executive nominee directors 377 -
Non-executive independent directors 513 -
Other non-executive directors 0 -
Total 4,521 -
3.3. Other benefits (in thousands of euros)
Advances -
Loans granted 11,115*
Pension funds and pension plans: contributions 962
Pension funds and pension plans: obligations assumed -
Life insurance premiums 2
Guarantees granted by the Company to directors 69
* Excluding the loans for the acquisition of convertible debentures detailed in Note 37.2.
4. Aggregate remuneration – executive directors and senior managementThe remuneration paid in 2006 to senior managers (a total of ten professionals, including
executive directors) totalled EUR 5,912 thousand, of which EUR 4,254 thousand related to fixed
remuneration and EUR 1,388 thousand related to variable remuneration (2005: EUR 5,815
thousand; eight professionals, including executive directors).
Also, the Group made contributions amounting to EUR 635.7 thousand to pension funds for senior
management, excluding those relating to executive directors, the contributions to which are
detailed in the table in Note 37.3.3.
5. Transactions with members of the Board of DirectorsPursuant to Law 26/2003, of 17 July, which amended Securities Market Law 24/1988, of 28 July,
and the Consolidated Companies Law, enacted by Legislative Royal Decree 1564/1989, of 22
December, the Bank is required to disclose the ownership interests held by the directors of
Bankinter, S.A. in its share capital.
Also, Article 127.ter of the Consolidated Companies Law stipulates that the directors must declare
any ownership interest held by them in the share capital of a company engaging in an activity that
is identical, similar or complementary to the activity carried on by the Bank and any positions
held, duties discharged or activities performed thereat.
113Bankinter Group
m
LEGAL GRUPO ingles.qxd 13/6/07 08:44 Página 113
B
Following is the detail at 31 December 2006 of the ownership interests declared by Bankinter’s
directors as required by Article 127.ter:
Director Entity % Capital
Jaime Echegoyen Enríquez de la Orden Banco Popular 0.00037%
BBVA 0.00003%
BSCH 0.00004%
Cartival, S.A. BSCH 0.0859%
Ramchand Bhavnani Wadhumal BSCH 0.00005%
For the purposes of Article 114.2 of the Securities Market Law, the Bank hereby states that it does
not have any information regarding transactions with directors (or with significant shareholders,
executives or related parties) that are unrelated to Bankinter, S.A.'s ordinary business or which
were not performed under normal market conditions.
6. Directors’ ownership interests in the share capitalThe breakdown of the ownership interests held by the members of the Board of Directors at 31
December 2006 and 2005 is as follows:
Bankinter Group 114
31/12/06(*) 31/12/05
Name Total Number Ownership Direct Indirect Total Number Ownership Direct Indirectof Shares Interest (%) of Shares Interest (%)
Juan Arena de la Mora 869,506 1.106 242,074 627,432 834,541 1.07 207,109 627,432
John de Zulueta Greenebaum 14,097 0.018 14,097 0 11,650 0.02 11,650 -
Fabiola Arredondo de Vara 8,096 0.010 8,096 0 7,649 0.01 7,649 -
Total directors 28,945,759 36.833 13,651,326 15,294,433 26,384,422 33.86 12,061,681 14,322,741
* The percentage of ownership was calculated taking into account the share capital at 31 December 2006, which amounted to EUR 117,877,566, represented by 78,585,044
shares.
(1) Appointed as a director in March 2005.
(2) Appointed as a director in September 2005.
(3) Appointed as a director in May 2005.
LEGAL GRUPO ingles.qxd 13/6/07 08:44 Página 114
7. Directors’ options on shares of the Bank (1)Following is the detail of the cumulative share options of the Company’s directors at the date of
preparation of these financial statements:
Director Number of Direct Number of % of Total Share Options Equivalent Shares Share Capital (1)
Juan Arena de la Mora(2) 108,992.27 108,992 0.1378%
Pedro Guerrero Guerrero 14,821.45 14,821 0.0187%
Jaime Echegoyen Enríquez de la Orden(2) 87,223.92 87,223 0.1103%
Cartival, S.A. 12,050.61 12,050 0.0152%
Marcelino Botín-Sanz de Sautuola y Navega 12,050.61 12,050 0.0152%
Fernando Masaveu Herrero 3,449.47 3,449 0.004%
Ramchand Bhavnani Wadhumal 4,668.62 4,668 0.0059%
José Ramón Arce Gómez 13,391.53 13,391 0.0169%
John de Zulueta Greenebaum 12,050.61 12,050 0.0152%
Fabiola Arredondo de Vara 12,050.61 12,050 0.0152%
(1) The share capital of Bankinter, S.A. was increased in January 2007 and currently amounts to EUR 118,573,567.50,
represented by 79,049,045 shares. The data presented in the foregoing table were calculated taking into account the share
capital data.
(2) Including the convertible debentures held by the executive directors at the date of preparation of these financial statements.
(38) Information on the environment
The Group's overall operations are governed by the laws on environmental protection
(“environmental laws”) and workers' safety and health (“occupational safety laws”). The Group
considers that it substantially complies with these laws and it has procedures in place to foster and
guarantee compliance therewith.
The Group has adopted the appropriate measures in relation to environmental protection and
improvement and the minimisation, where appropriate, of environmental impact, and complies
with current regulations in this respect. It was not considered necessary to record any provisions
for environmental contingencies and charges in 2006, since the Group did not have any
contingencies relating to environmental protection and improvement.
115Bankinter Group
LEGAL GRUPO ingles.qxd 13/6/07 08:44 Página 115
B
In accordance with the Environmental Policy published by it in 2004, in 2006 Bankinter continued
to develop an Environmental Management System to identify measure and control the
environmental impact of banking activities. An internal audit on this system was performed by the
firm SGS Tecnos. Encouragement was given to measures designed to improve the environment
including the integral management of waste and the rational use of resources; the eco-efficient
design of facilities; and the replacement of white paper by recycled paper for internal use.
As regards personnel training and awareness-raising, an on-line environmental training course
commenced in November for all Group personnel, 9% of whom had successfully completed the
course at 2006 year-end.
The Group's directors consider the environmental contingencies that might arise from its business
activities to be minimal and, in any case, adequately covered. They do not expect any additional
liabilities to arise in relation to these contingencies.
The Group did not incur any expenses or receive any grants in this connection.
(39) Customer Care Service
Article 17 of Ministry of Economy Order 734/2004 on Customer Care Departments and Services and
Customer Ombudsmen of Financial Institutions stipulates, inter alia, that financial institutions are
required to prepare a report on the activities performed by these services in the preceding year
and, also, to include a summary of this report in the notes to their financial statements.
The 2006 Activity Report prepared by the Customer Care Service shows that in 2006 the ratio of
complaints and claims per 10,000 transactions fell to 0.866 (from 0.94 in 2005). Also, the
percentage of complaints and claims responded to in less than 48 hours was 81.81% (2005:
83.95%).
There were 96,192 complaints and claims in 2006 (2005: 86,943), 85,371 of which were economic
claims (2005: 79,354). Of these, 87.74% were resolved in favour of the customer (2005: 87.51%).
Of the aforementioned complaints and claims, 120 were filed through the Bank of Spain (2005:
120), of which 78 were resolved (2005: 105), 42 of them in favour of the Bank (2005: 51).
The Group's External Consumer Ombudsman processed 509 complaints, of which 350 were resolved
in favour of the Group and 158 in favour of the customer, and one was declared to fall outside its
scope of competence.
Bankinter Group 116
LEGAL GRUPO ingles.qxd 13/6/07 08:44 Página 116
(40) Branches, centres and financial agents
The detail of Bankinter, S.A.'s branches, centres and financial agents at 31 December 2006 and
2005 is as follows:
31/12/06 31/12/05
Branches and centres
Branches 332 318
Commercial management centres
Corporate 50 45
SMEs 124 105
Private Banking 41 37
Virtual branches 527 498
Financial agents 1,003 1,007
Telephone and Internet bankingt branches 3 3
At 31 December 2006 Bankinter operated through a network of 1,003 agents (2005: 1,007 agents).
The Bank has granted these agents -either individuals or legal entities- powers of attorney to
habitually negotiate and formalise typical credit institution transactions with its customers, in the
name and on behalf of Bankinter. The average funds managed by this network totalled EUR 2,017
thousand at 31 December 2006 (31 December 2005: EUR 1,739 thousand) and the average loans
and credit facilities granted amounted to EUR 1,655 thousand (31 December 2005: EUR 1,406
thousand). The list of these agents has been filed with the Bank of Spain's Financial Institutions
Office.
(41) Trust and investment services
The detail of the fees and commissions recognised in 2006 and 2005 for the investment services
and supplementary activities performed by the Group is as follows:
Thousands of Euros 31/12/06 31/12/05
Asset management 685 363
Management agreements 4,769 7,069
Safe deposit box rental 546 478
Securities trading (Note 29) 16,974 13,104
of which:
On-line brokerage 9,786 7,711
Total 22,974 21,014
117Bankinter Group
LEGAL GRUPO ingles.qxd 13/6/07 08:44 Página 117
B
The amounts relating to the investment funds, investment companies, pension funds and customer
portfolios managed by the Group are summarised as follows:
Thousands of Euros 31/12/06 31/12/05
Investment funds and investment companies 8,920,220 8,692,687
Pension funds 1,068,630 880,331
Managed customer portfolios 1,400,841 1,298,447
Total 11,389,691 10,871,465
The securities of third parties deposited at the Group measured at market value totalled
EUR 28,526,524 thousand at 31 December 2006 (31 December 2005: EUR 27,057,138 thousand).
(42) Fees paid to auditors
Following is the detail of the professional service fees incurred by the auditors of the Bank’s
individual financial statements and the Group’s consolidated financial statements in 2006
and 2005:
Thousands of Euros Bankinter, S.A. Bankinter Group
31/12/06 31/12/05 31/12/06 31/12/05
Audit services 211 164 283 326
Other audit, consulting and advisory services 311 287 311 287
522 451 594 613
The figures shown for audit services in the foregoing table constitute the full amount of the fees for
the 2006 and 2005 audits, irrespective of the date on which they were invoiced.
(43) Tax matters
Taxable profit, determined in accordance with tax legislation, is subject to tax at a rate of 35%.
Certain tax credits can be deducted from the resulting tax charge.
The Group files consolidated income tax returns; however, this does not signify that the income tax
incurred by each of the consolidated entities is substantially different from that which would arise
if they filed individual tax returns.
Bankinter Group 118
LEGAL GRUPO ingles.qxd 13/6/07 08:44 Página 118
On 27 December 2000 the Group notified the Spanish Tax Agency's National Inspection Office that
it had opted to apply the consolidated tax system from the year 2001. The tax group number
assigned by this Office was 13/2001.
At 31 December 2006 the Bank’s subsidiaries composing the tax group were as follows:
� Aircraft, S.A.� Bankinter Consultoría, Asesoramiento y Atención Telefónica, S.A.� Bankinter Gestión de Activos, S.A., S.G.I.I.C. (formerly Gesbankinter, S.A., S.G.I.I.C.)� Hispamarket, S.A.� Intermobiliaria, S.A.� Bankinter Gestión de Seguros y Reaseguros, S.A.� Bankinter Seguros de Vida, S.A.� Intergestora, S.A. � Intergestora Nuevas Tecnologías, S.A. � Bankinter Capital Riesgo, S.G.E.C.R, S.A. � Bankinter Emisiones, S.A.� Bankinter Sociedad de Financiación, S.A.� Arroyo Business Consulting Development, S.L.
The reconciliation of the accounting profit to the consolidated taxable profit for 2006 and 2005 is
as follows:
Thousands of Euros 31/12/06 31/12/05
Accounting profit for the year before taxes 316,336 265,445
Permanent differences (30,569) (27,571)
Tax base for accounting purposes 285,767 237,874
Net temporary differences 16,785 27,329
Taxable profit 302,552 265,203
The positive temporary differences in 2006 amounted to EUR 87,869 thousand and included
mainly adjustments for non-tax deductible provisions.
The negative temporary differences amounted to EUR 71,084 thousand and included mainly the
reversals of adjustments for provisions and other non-tax deductible items in prior years.
119Bankinter Group
r
r
x
LEGAL GRUPO ingles.qxd 13/6/07 08:44 Página 119
B
The income tax expense for 2006 and 2005 was calculated as follows:
Thousands of Euros 2006 2005
Current tax expense 100,009 83,373
Tax relief and tax credits (6,713) (3,151)
Tax adjustments 86 (2,479)
Adjustment for first-time conversion (Appendix III) 14,464 -
Total 107,846 77,743
“Prior Years’ Tax Adjustments” in 2006 includes the income tax expense relating to tax adjustments
made to the Bank’s income tax calculation for 2005 that had not been envisaged at 31 December
2005.
“Adjustments for Revaluation of Deferred Taxes” includes the income tax expense incurred as a
result of the revaluation of the deferred tax assets and liabilities recognised by the Bank at the tax
rates that are expected to apply in the period when the asset is realised or the liability is settled
due to the reduction in the income tax rate from 35% to 32.5% in 2007 and 30% in 2008 and
subsequent years.
The breakdown of the income tax expense for the year by current and deferred income tax expense
is as follows:
Thousands of Euros 2006 2005
Current income tax expense 99,016 100,881
Deferred income tax expense 8,830 (23,138)
Income tax expense for the year 107,846 77,743
Bankinter Group 120
LEGAL GRUPO ingles.qxd 13/6/07 08:44 Página 120
The reconciliation of profit before tax to the income tax expense for the year is as follows:
Thousands of Euros 2006 2005
Profit before tax 316,336 265,445
Income tax expense at 35% 110,718 92,906
Detail of the reconciliation of the income tax expense at 35% and the income tax expense for the year including, inter alia: (2,872) (15,163)
Non-deductible expenses 1,756 1,859
Non-computable income (12,454) (11,088)
Tax credits
Other: (6,713) (3,151)
-Tax benefit relating to the reserve for investmentsin the Canary Islands (RIC) - (420)
-Prior years’ income tax adjustments 86 (1,453)
-Income tax payment – Dublin branch 108 119
-Adjustments for revaluation of deferred taxes 14,464 0
Other (119) (1,029)
Income tax expense for the year 107,846 77,743
Effective tax rate for the year 34.09% 29.29%
The income tax expense represents the sum of the current tax expense and the effect of the
changes in deferred tax assets and liabilities and tax credits.
The current income tax expense is calculated by aggregating the current tax arising from the
application of the tax rate to the taxable profit (or tax loss) for the period, after deducting the tax
credits allowable for tax purposes, and the change in deferred tax assets and liabilities and tax loss
and tax credit carryforwards.
Deferred tax assets and liabilities include temporary differences measured at the amount expected
to be payable or recoverable on differences between the carrying amounts of assets and liabilities
and their tax bases, and tax loss and tax credit carryforwards. These amounts are measured at the
tax rates that are expected to apply in the period when the asset is realised or the liability is
settled.
121Bankinter Group
e
LEGAL GRUPO ingles.qxd 13/6/07 08:44 Página 121
B
Deferred tax liabilities are recognised for all taxable temporary differences, except, in general,
when the temporary difference arises from the initial recognition of goodwill. Deferred tax assets
are recognised for temporary differences to the extent that it is considered probable that the
consolidated entities will have sufficient future taxable profits against which they can be utilised.
Other deferred tax assets (tax loss and tax credit carryforwards) are only recognised if it is
considered probable that the consolidated entities will have sufficient future taxable profits against
which they can be utilised.
The deferred tax assets and liabilities recognised are reassessed at each balance sheet date in
order to ascertain whether they still exist, and the appropriate adjustments are made on the basis
of the findings of the analyses performed.
Law 35/2006, of 28 November, on Personal Income Tax and partially amending the Corporation
Tax, Non-Resident Income Tax and Wealth Tax Laws, establishes, inter alia, a reduction over two
years in the standard tax rate for corporation tax, which until 31 December 2006 was 35%, the
detail being as follows:
Tax Periods Beginning On or After Tax Rate
1 January 2007 32.5%
1 January 2008 30%
Accordingly, in 2006 the Group re-estimated the deferred tax assets and liabilities and the tax
carryforwards recognised in the consolidated balance sheet on the basis of the year in which the
related reversal will foreseeably take place. The effect of this re-estimate was to reduce deferred
tax assets by EUR 23,550 thousand, which amount was recognised with a charge to the
consolidated income statement, and to reduce deferred tax liabilities by EUR 10,947 thousand, of
which EUR 9,086 thousand relating to the revaluation of deferred tax liabilities arising from the
revaluation of non-current assets were recognised with a credit to the consolidated income
statement, and EUR 1,861 thousand were taken to reserves.
As a result of the last general tax audit performed at the Bank for the main taxes applicable to it
for the years 1997 to 2000, tax assessments were signed on 13 February 2003.
The tax assessments issued to the Bank in connection with income tax (1997 to 2000) were signed
on a preliminary basis since, among other reasons, the settlement contested as a result of prior tax
audits at Bankinter Gestión de Activos, S.A., S.G.I.I.C. is not yet final. These assessments, which
were signed under protest, gave rise to the refund of EUR 38,172 thousand of income tax charge
relating to the difference between the EUR 46,893 thousand received (as described in the following
paragraph) and the other items adjusted.
Bankinter Group 122
LEGAL GRUPO ingles.qxd 13/6/07 08:44 Página 122
The tax charge refund of EUR 46,893 thousand received from the tax authorities related to the tax
paid by the Bank in prior years on the profit of Bankinter Gestión de Activos, S.A., S.G.I.I.C. under
the fiscal transparency system. The related late-payment interest was also received in this
connection.
As a precaution against the possibility of this refund not being final, the Bank recorded EUR 95,959
thousand under “Provisions - Other Provisions” on the liability side of the consolidated balance
sheet at 31 December 2006 for the amount of the refund plus the related interest. The amount
recorded also includes the penalty imposed upon Bankinter Gestión de Activos (EUR 23,447
thousand), against which an appeal has been filed, and the related late-payment interest.
A provision for these amounts was recognised by Bankinter, S.A., which has undertaken to pay
Bankinter Gestión de Activos, S.A., S.G.I.I.C. in the event that the latter is required to pay these
amounts.
In any case, the other tax liabilities which might arise from the claims filed against the
assessments signed under protest were adequately provided for at the end of 2006 and prior years.
On 17 October 2006, the Bank was notified that the tax authorities would initiate a general tax
audit of the following taxes and periods:
Periods
Income tax 2001 to 2003
VAT 09/02 to 12/03
Personal income tax withholdings and prepayments 09/02 to 12/03
Tax on income from movable capital – withholdings and prepayments 09/02 to 12/03
Tax on income from property leases – withholdings and prepayments 09/02 to 12/03
Withholdings of non-residents’ taxation 09/02 to 12/03
Annual return of transactions 2002 to 2003
Annual recapitulative statement of intra-community supplies and acquisitions of goods 2002 to 2003
Also on 17 October 2006, the Bankinter Tax Group (13/01), as tax payer, was notified that the tax
authorities would initiate a general tax audit for income tax for the years 2001 to 2003.
The possible interpretations which can be made of the tax regulations applicable to banking
transactions might give rise to certain contingent tax liabilities. The Bank considers that the
possibility of such contingent liabilities becoming actual liabilities is remote, and that in any event
the tax charge which might arise therefrom would not materially affect the financial statements.
123Bankinter Group
t
x
LEGAL GRUPO ingles.qxd 13/6/07 08:44 Página 123
B
The detail of the deferred tax assets and liabilities which the Group's directors expect will reverse
in future years is as follows:
Thousands of Euros
Deferred tax assets (Note 16) 181,086
Within ten years:
- Provisions: 33,026
- Early retirement fund 6,844
- Other: 11,337
More than ten years:
- Pension fund: 12,347
- General allowance: 117,532
Deferred tax liabilities (Note 16) 71,831
Within ten years: 16,869
More than ten years:
- Revaluation of property: 54,962
The tax benefits applied in calculating the Group's income tax charge for 2006 and 2005 were as
follows:
Thousands of Euros 31/12/06 31/12/05
Tax deductions
Reserve for investments in the Canary Islands - 1,200
Monetary depreciation 1 1
Exemption from international double taxation 51 -
245 1,201
Tax credits
For double taxation 7,592 2,143
For training expenses 169 196
For R&D&IT 722 430
For reinvestment of extraordinary gains 281 58
For donations 434 324
9,198 3,151
Bankinter Group 124
LEGAL GRUPO ingles.qxd 13/6/07 08:44 Página 124
The income on which the tax credit for the reinvestment of extraordinary gains was taken
amounted to EUR 1,404 thousand in 2006 (2005: EUR 292 thousand). In 2006 the Bank made
sufficient non-current asset and securities purchases to meet the reinvestment requirements
established in Article 42 of Legislative Royal Decree 4/2002, of 5 March, approving the Consolidated
Income Tax Law.
In 2005 the Group opted to apply the tax regime for foreign-securities holding companies regulated
in Chapter XIV of Title VII of Legislative Royal Decree 4/2002, of 5 March, approving the
Consolidated Income Tax Law, and on 21 April 2005 notified the Spanish State Tax Agency of its
decision to do so.
As required by Article 118.3 of the Consolidated Income Tax Law, it is hereby stated that in 2006
the Bank obtained tax-exempt income relating to gains of EUR 732 thousand and tax-exempt
income relating to dividends of EUR 271 thousand and it paid EUR 57 thousand of taxes abroad in
relation to these dividends.
(44) Assets and liabilities measured at other than fair value
Following is a comparison, for the salient items on the asset and liability sides of the consolidated
balance sheet, between the carrying amounts of the Group's assets and liabilities measured at other
than fair value and their related fair values estimated at each year-end:
Thousands of Euros 31/12/06 31/12/05
Assets Carrying Fair Carrying FairAmount Value Amount Value
Loans and advances to customers (Note 9) 31,653,807 31,728,860 26,139,388 26,397,720
The fair values presented in this Note were calculated by discounting the related estimated flows
of principal and interest, except in the cases of held-to-maturity investments and property
investments for which observable market prices are available.
The fair value of properties was calculated on the basis of the values certified by appraisal
companies, adjusted by the related price variation index in the case of appraisal reports that are
more than three years old.
(45) Risk management policies
Risk managementIn 2006 the following Risk Divisions of the Group were brought together to form the Risk
Directorate, which reports directly to the CEO:
� Credit risk� Market risk� Operational risk� Global risk management
Risk management is one of the Bankinter Group’s competitive advantages. Particular emphasis is
placed on identifying, measuring, managing, controlling and monitoring the main risks to which it
is exposed in carrying on its business activities: credit risk, market risk (both structural interest
rate risk and the risk inherent to Treasury and Capital Markets activities), liquidity risk and
operational risk, as well as other types of risk present in the business activities of financial
institutions, such as reputational risk, strategic risk, etc.
The Board of Directors, acting through the Audit and Regulatory Compliance Committee, the Audit
Division and the Risk Divisions, guides and supervises the accounting policies and internal control
systems and procedures in relation to all the risks involved in the Group’s activity and the
prevention of money laundering, as required by current legislation.
For this purpose, the Board of Directors approves and periodically reviews the main credit risks and
sets and updates the operating limits for market and liquidity risk.
At executive level there is a segregation of functions between the business units in which risk
arises and the units responsible for monitoring and controlling risk.
The Group continues to implement methodologies, systems and policies to enable it to measure
and manage risk and equity in accordance with the principles established in the New Capital
Accord (Basel II).
Bankinter Group 126
LEGAL GRUPO ingles.qxd 13/6/07 08:44 Página 126
Structural and market risk management policiesThe basic principles of risk management at the Bankinter Group are as follows:
� The ultimate objective is to contribute to the maximisation of return on capital and sustained
value creation.� Independence of the risk function.� Integral risk management. The Group identifies, measures, manages and controls all its
significant risks.� Importance of automatic acceptance systems, new risk scoring methodologies and use of
technology in its risk management systems.� Diversification of exposure to customers, industries, counterparties and markets.� Identification, assessment and control of risk in the launch of new products.� Significance of service quality in the risk function.
Set forth below is a description of the Group's policies and methods for the management,
measurement and control of structural risks (interest rate risk and liquidity risk) and the market
risk to which the Group's Treasury and Capital Markets and other operations are subject, followed
by a description of credit risk.
Structural and market risk management policiesThe purpose of the Bankinter Group’s structural and market risk management policy is to
neutralise the impact on the income statement of changes in interest rates, the main market
variables and the Entity’s balance sheet structure by adopting the most appropriate investment or
hedging strategies. It should be noted in this connection that the exchange risk exposure is not
material, since the foreign currency positions held by it are not significant.
The Board of Directors delegates to the Asset-Liability Committee (ALCO) the tasks of monitoring,
on an ongoing basis, the decisions concerning structural balance sheet risks (interest rate and
liquidity risk) and the stock market and exchange risk exposure of the Group's institutional
positions, and of establishing the Bank's financing policies. In addition, each year the Board
reviews, approves, and delegates to the ALCO the limits to be applied in managing the
aforementioned risks. The Treasury and Capital Markets Division implements the decisions
adopted by the ALCO relating to the Group's institutional positions.
Also, on a yearly basis the Board of Directors sets the operating limits applicable to the Treasury
and Capital Markets Division in the own-account transactions performed by it in the financial
markets to take advantage of any business opportunities that arise. In turn, the related delegated
limits are established in this Division and the information thereon is made available to the control
bodies on the internal databases kept for this purpose.
127Bankinter Group
d
LEGAL GRUPO ingles.qxd 13/6/07 08:44 Página 127
B
In order to carry out these functions, at any given time the Group uses the most appropriate
financial instruments, which include interest rate, exchange rate and equity derivatives. As a
general rule, the financial instruments traded must be sufficiently liquid and hedgeable.
The Market Risk Division, which forms part of the Risk Directorate, has the separate function of
measuring, monitoring and controlling the Group’s structural and market risks.
Structural risksFollowing is a description of the models used throughout the Group to manage, measure and
control structural interest rate and liquidity risks.
Structural interest rate riskStructural interest rate risk is defined as the Group's exposure –resulting from the varying maturity
and repricing dates of its balance sheet items– to fluctuations in market interest rates.
The Group actively manages this risk in order to safeguard its interest margin and its economic
value in the event of interest rate fluctuations.
In order to control its structural interest rate exposure, the Group has in place a limit structure that
is reviewed and approved each year by the Board of Directors, in keeping with the Group's policies
and strategies in this respect.
The Group employs a series of tools to control and monitor structural interest rate risk. The main
factors measured by the Group with a view to managing and controlling the interest rate risk
profile approved by the Board of Directors are as follows:
a) Interest rate gap (or map)The interest rate gap reflects the Group's interest rate risk exposure based on the maturity and/or
repricing structure of its on- and off-balance-sheet items. The map, which is obtained automatically
at least once a week, is the basic tool that affords the Bank a static view of the concentration of its
interest rate risk over the various time horizons, and it also serves as a basis for the analysis of the
potential impacts of interest rate fluctuations on the Group’s interest margin and equity.
The interest rate map is obtained by allocating the on- and off-balance-sheet positions and
balances, duly classified by nature, to the related time horizons. For this purpose, interest-rate-
sensitive items with known maturity or rate adjustment dates are classified in the map on the
basis of those dates, broken down into items tied to fixed and floating rates, respectively. Items
with no fixed maturity, irrespective of whether they are interest-rate-sensitive, are allocated using
certain historical-behaviour-based assumptions.
Bankinter Group 128
(
LEGAL GRUPO ingles.qxd 13/6/07 08:44 Página 128
Data at 31/12/06 in millions of euros Within 1 to 3 3 Months 1 to 2 2to 3 3 to 4 4 to 5 More than Total1 Month Months to 1 Year Years Years Years Years 5 Years
Total liabilities and equity 13,989 5,058 6,723 9,660 14,745 50,176
TOTAL LIQUIDITY GAP (8,493) (815) 1,423 2,500 10,914 5,529
Data at 31/12/05 in millions of euros Within 1 to 3 3 Months 1 to 5 More than Total1 Month Months to 1 Year Years 5 Years
Total assets 5,697 1,548 7,085 9,723 23,292 47,345
Total liabilities and equity 13,216 2,811 5,721 7,734 12,755 42,238
TOTAL LIQUIDITY GAP (7,519) (1,263) 1,363 1,990 10,537 5,107
LEGAL GRUPO ingles.qxd 13/6/07 08:44 Página 133
B
Market Risk“Value-at-Risk” (VaR) methodology is the main tool used to measure the market risk exposure of
the positions inherent to the Treasury and Capital Markets activity and that of the Group's Asset
and Liability Committee positions, together with the related limits. VaR is considered both in global
terms and separately for each significant risk factor. The VaR limits set are supplemented by other
measures such as stress-test, sensitivity, equivalent position and concentration analyses.
The methodology used to measure the principal market risk indicators is as follows.
Value-at-Risk (VaR)VaR is defined as the maximum expected loss on a specific portfolio of financial instruments -under
normal market conditions, with a given confidence level and for a specific time horizon- resulting
from changes in market prices and variables.
VaR is the main indicator used on a daily basis by the Bankinter to measure, in a global,
integrated manner, its exposure to interest rate, equity and exchange risk.
At present, VaR is calculated by the parametric model, which is based on statistical assumptions
of normality in the distribution of market price changes. The calculation is performed with a
confidence level of 95% and a one-day time horizon; the volatility and correlation matrixes used
are obtained from historical series of the market data considered in the model, which are
representative of the risk factors of the positions being measured.
The estimated VaR exposure for the main risk factors in 2006, in both equity and the income
statement, was less than 1% in all cases. The VaR exposure in the income statement was estimated
considering the Group's trading operations as a whole, whereas the VaR exposure in equity was
projected taking into account the fixed-income and equity portfolios classified as available for sale
and the related hedges.
Stress TestingStress testing is an analysis performed to supplement the VaR values obtained. Stress tests quantify
the maximum potential loss in the value of a portfolio by simulating various extreme scenarios for the
risk factors to which the portfolio is exposed.
Each year the Board of Directors approves an extreme scenario based on significant fluctuations in
interest rates, stock market prices, exchange rates and volatility; it also sets a series of limits for each
type of risk in the event that these changes occur.
In addition to the aforementioned extreme scenario, estimates are performed using other scenarios
that replicate historical market crisis situations.
Bankinter Group 134
LEGAL GRUPO ingles.qxd 13/6/07 08:44 Página 134
Credit Risk
Organisation of the credit risk functionAs the highest ranking body in credit risk matters, the Board of Directors establishes the Bankinter
Group’s risk policy set forth in the Risk Policy Framework Agreement. It is also the body
responsible for approving transactions that exceed the scope of the powers delegated to
subordinate bodies and for establishing the extent of the powers granted to the Loan Committee,
which is second in the functional hierarchy regarding risk. The Board is periodically informed of
changes in loans and receivables and in the detail thereof, by sector, large exposures and
guarantees and terms, and of any other matters affecting credit risk quality, as well as all matters
for which it is responsible under current legislation.
The Loan Committee, which is presided over by the CEO, assigns powers to the Credit Risk
Committee and to the various regional loan committees, and approves the risks that fall within the
scope of its powers.
The Loan Committee is informed by the Credit Risk Division of the changes in loans and
receivables, higher risk sectors, the exposure to the main risk groups, and of any changes in credit
quality, the non-performing loans ratio and substandard risk.
The Credit Risk Division forms part of the Risk Directorate, which reports directly to the CEO,
thereby guaranteeing the Division’s independence and, in turn, facilitating its adherence to the
Bank’s strategy.
The Credit Risk Division comprises five areas: Individual and Developer Risk, Corporate Banking
Risk, SME Risk, Control and Recoveries and Risk Approval Systems.
The principal function of these Areas, which correspond to the Bank’s customer segments, is to
design their respective risk policies and transmit them to the various networks and channels. Each
area is responsible for defining the treatment of the risk relating to new products and for the
various processes relating to the approval and handling of transactions.
The function of the Control and Recoveries Area is to steer and manage the loan control,
monitoring and collection processes; this is achieved by introducing and promoting automatic
systems which render loan management more efficient and by ensuring that sufficient controls are
in place to guarantee the quality of the loan portfolio. This Area’s responsibilities include
controlling the quality of the data entered into the automatic approval systems and the
arrangement of credit transactions.
135Bankinter Group
l
r
d
LEGAL GRUPO ingles.qxd 13/6/07 08:44 Página 135
B
The Risk Approval Systems Area is responsible for promoting and implementing appropriate
methods and systems for the processing and management of customer risk in order to pursue the
risk strategy defined by the Entity. Its main functions are the maintenance and development of
the current risk management and approval systems; basically, the definition and coordination with
Information Systems of the new Unified Risk System, which will encompass all the current risk
systems.
Delegation of powersThe Board of Directors sets the limits of the powers granted to the Loan Committee.
The Loan Committee sets the limits of the powers delegated to the Credit Risk Committee and the
various regional loan committees, which are ultimately limited by type of loan and maturity.
The regional loan committees can, within the limits defined in the Responsibilities Circular,
delegate powers to the various centres that report to it.
Decisions relating to risk are taken collectively and in a decentralised way through the various
Loan Committees.
Basic principles of the credit risk policyFrom the risk management standpoint, the principal lines of action were as follows:
1. Maintaining credit quality.
2. Maximising the use of the automatic approval system (SIGRID).
3. Using ratings as a determining variable in risk approval.
4. The training provided.
CreditworthinessBased on the strategy established for the year, which is intended to increase the weight of the
credit risk to legal entities in the balance sheet, SME is the segment with the highest growth,
followed by Corporate Banking.
The excellent credit quality and the volume of the related provisions continue to represent a
competitive advantage for Bankinter. The rigor of risk management, based on personnel and
information technology, enables Bankinter to maintain high levels of risk growth, especially in the
SME segment, in which the automatic approval systems are a basic tool in the risk process. The
Bank continues to maintain excellent credit quality, as reflected in the non-performing loan ratio,
which continues to be significantly better than that of its competitors.
Bankinter Group 136
LEGAL GRUPO ingles.qxd 13/6/07 08:44 Página 136
The Group's credit risk exposure to customers amounted to EUR 37,448 million at 31 December
2006, representing a year-on-year increase of 17.2%. 93% of credit risk relates to direct lending to
customers and 7% to off-balance sheet exposures. The business segment that reported the highest
relative growth was SMEs (up 34.8%), followed by Corporate Banking (up 17.2%) and Individuals
(up 13.5%). As a result, the relative weight of lending to companies (SMEs and Corporate Banking)
with respect to the loan portfolio as a whole rose by 2 percentage points to 34.7%.
Bankinter’s non-performing loan ratio increased slightly from 0.23% in December 2005 to 0.25% at
2006 year-end due to the strong growth in lending to the SME and Consumer Banking segments in
the last two years. At the same time, the ratio of the recorded allowance to non-performing loans
at the Bank was very comfortable (570%, as compared with 607% in 2005).
IndividualsIn 2006 the Group maintained and reinforced its mortgage loan policy, focussing on customers with
the best socioeconomic profiles. The Bank has an internal statistical model which enables it to
estimate the expected returns from customers on the cross-selling of other products. Individual
mortgage risk as a percentage of the Bank’s credit risk fell by more than two percentage points in
2006 to 56.3% (2005 year end: 58.9%).
Also, the Group maintained a policy of prudence with respect to the coverage of the appraisal value
of homes. Consequently, the coverage of new mortgage loans was maintained, and the ratio of the
amount of the loan to the appraisal value of the property averaged 63.8% in 2006. The number of
mortgage loans where the amount of the loan exceeded 80% of the appraisal value of the property
fell significantly over the last three years, from 22% in August 2003 to a stable 8% at present.
The proportion of income allocated to new mortgages in 2006 was 35.4% (2005: 31.6%) due to the
rises in interest rates and house prices.
Corporate BankingThe growth strategy was maintained, and the risk exposure to customers increased by 17.2% in
2006 (2005: 18.7%).
Despite the significant increase in credit risk, the balance of non-performing loans continued to be
contained, and the ratio of non-performing loans fell from 0.22% in 2005 to 0.20% at 2006 year-
end.
137Bankinter Group
h
LEGAL GRUPO ingles.qxd 13/6/07 08:44 Página 137
B
The matrix by terms and amounts shows that almost 75% of non-performing loans are on loans at
less than one year and that the risk on loans at more than three years, which increased from 18%
to 21%, is very diversified in terms of amounts, since no more than 6.72% is held in loans
exceeding EUR 6 million.
SMEs2006 was a year of consolidation in the SME segment. The business expansion commenced in 2004
and 2005 has produced results, and growth rates in credit risk reached 34.83% in 2006.
16 centres specialising in SMEs were opened in 2006 bringing the total number of centres to 122;
consequently, the number of active customers increased by 20% and the volume of proposals
increased by 16% with respect to 2005.
Credit risk exposure to mortgage loans continues to represent a very significant proportion of total
SME risk (45%), of which 37% are secured by homes and 3% are pledged.
Internal risk scoring modelsIn 2006 Bankinter continued to develop the internal credit risk scoring models in accordance with
the Basel II framework. The effort made in previous years to build the required infrastructure
(systems, processes and databases) allowed it to be included in the advanced model validation
process initiated by the Bank of Spain.
With respect to individuals, loan, credit overdraft and minor financing models were constructed
which, together with the housing mortgages model and the four legal entity models, account for
90% of the total credit risk exposure to customers.
Bankinter Group 138
Credit Risk exposure by internal category (%)
Home mortgages forprivate individuals
Unsecured creditsand loans
Credit cards
Other legal entities
Project finance
Big companies
Medium-sizedcompanies
Small companies
Large transactions
Other transactions
Exposure at 31 December 2006 calculated on the basis of the credit conversion factors (CCF) existing at 30 June.
LEGAL GRUPO ingles.qxd 13/6/07 08:44 Página 138
The internal rating models provide, for each category, a score of the risk assumed by the Bank vis-
à-vis each customer or transaction. Each of these ratings is associated with a certain probability of
default (past due by more than 90 days) and, accordingly, the higher the rating, the lower the
probability of default. The probabilities of default (PDs) showed in the figures were obtained by
applying statistical techniques to historical data for 16 years. Accordingly, the results obtained
include all the data of the economic cycle, including the worst situations arising between 1990 and
2005. Consequently, the expected loss and capital requirements were calculated by applying the
principle of utmost prudence.
Bankinter has historical default databases which enable it to calculate the severity (average
recovery rate of past-due positions) and the exposure at default for each category.
Probability of default, severity and exposure are the three factors required to calculate the expected
loss or probable loss of each transaction. The loss associated with a transaction is calculated by the
probability of each transaction defaulting within one year (probability of default) multiplied by
the exposure at default of the transaction (exposure) and by the percentage loss in case of default
(severity).
The expected loss is a key factor in the estimate of the risk premium that should be passed on to
the transaction price as an additional cost of the activity.
As in the case of the probabilities of default, the data used to calculate exposure and severity were
obtained by applying statistical techniques to historical data from 1990. In this case, the volatility
ratios were also applied, thereby ensuring the principle of utmost prudence in the preparation of
expected loss data.
Bankinter’s estimates of probability of default, severity and exposure and, therefore, of expected
loss, illustrate the excellent quality of its portfolios; for example, 80.9% of the mortgage portfolio
has a rating of 5 or more, and the expected loss on this portfolio as a whole is 0.04% of risk
exposure.
139Bankinter Group
4
LEGAL GRUPO ingles.qxd 13/6/07 08:44 Página 139
Bankinter Group B140
15
10
5
0
5.00
4.00
3.00
2.00
1.00
0.00
30
25
20
15
10
5
0
0.25
0.20
0.15
0.10
0.05
0.00
1 2 3 4 5 6 7 8 9
Distribution of home mortgages by rating (%)
Rating
Risk
Risk ExpectedLoss
Risk ExpectedLoss
Expected loss A rating of 9 indicates maximum credit quality and 1 indicates the worst
A rating of 9 indicates maximum credit quality and 1 indicates the worst
A rating of 9 indicates maximum credit quality and 1 indicates the worst
Risk Expected loss
1 2 3 4 5 6 7 8 9
Distribution of the portfolio of unsecured credits and loans to privateindividuals by rating (%)
Rating
25
20
15
10
5
0
0.80
0.60
0.40
0.20
0.00
1 2 3 4 5 6 7 8 9
Distribution of the portfolio of other transactions with private individuals byrating (%)
Rating
Risk Expected loss
Risk ExpectedLoss
LEGAL GRUPO ingles.qxd 13/6/07 08:44 Página 140
141Bankinter Group
t
t
t
30
25
20
15
10
5
0
25
20
15
10
5
0
5.00
4.00
3.00
2.00
1.00
0.00
1 2 3 4 5 6 7 8 9
Distribution of the small companies portfolio by rating (%)
Rating
10,00
8,00
6,00
4,00
2,00
0,00
40
30
20
10
5
0
0.25
0.20
0.15
0.10
0.05
0.00
1 2 3 4 5 6 7 8 9
Distribution of the medium-sized companies portfolio by rating (%)
Rating
1 2 3 4 5 6 7 8 9
Distribution of the big companies portfolio by rating (%)
Rating
Risk Expected loss
Risk Expected loss
Risk Expected loss
Risk ExpectedLoss
Risk ExpectedLoss
Risk ExpectedLoss
A rating of 9 indicates maximum credit quality and 1 indicates the worst
A rating of 9 indicates maximum credit quality and 1 indicates the worst
A rating of 9 indicates maximum credit quality and 1 indicates the worst
LEGAL GRUPO ingles.qxd 13/6/07 08:44 Página 141
B
(46) Segment reporting
The business segments reflect the Bank's structure, taking into account the nature of the products
and services offered and the customer groups targeted. These business segments can be described
as follows:
� Individual Banking relates to the products and services offered to household economies.� SME Banking provides a specialist service for small and medium-sized enterprises.� Private Banking is a business line specialising in integral asset and investment advisory and
management services.� Corporate Banking offers the specialist service required by large enterprises and the public
sector.� Personal Finance is the business division that caters for the segment of customers with financial
assets in excess of EUR 1.8 million.� Foreign Customers aims to provide specialist services for the growing number of European
nationals who acquire a house in Spain as their temporary or permanent residence.
The reporting structure (Appendix III) is designed as if each business segment were an
autonomous business and had its own separate equity. The net interest income and ordinary
income of the segments are calculated by applying transfer prices (in line with current market
rates) to their respective assets and liabilities. The income from equity instruments is allocated
among the business lines on the basis of their share therein.
Administrative expenses, which include both direct and indirect costs, are distributed among the
segments on the basis of the internal use of the related services.
The average assets distributed among the various business segments include financial assets held
for trading, the securities portfolio and loans and advances to credit institutions and customers.
The average liabilities and equity distributed among the various business segments include
marketable debt securities, deposits from credit institutions and customer deposits.
Ordinary income (financial income) includes interest income, fees and commissions received for
the various products and services provided, and gains on financial assets and liabilities.
Conversely, financial expense includes interest expense, fees and commissions paid, losses on
financial assets and liabilities and general administrative expenses.
Bankinter Group 142
LEGAL GRUPO ingles.qxd 13/6/07 08:44 Página 142
Costs incurred in the acquisition of assets include the total cost incurred in the year to acquire
segment assets that are expected to be used for more than one year.
The segment information is detailed in Appendix III hereto, which is an integral part of this Note to
the consolidated financial statements.
(47) Events after the balance sheet dateAs a result of the obligatory exchange in January 2006 of Convertible Debenture Issue I (launched
in December 1998), share capital increased by 464,001 shares, representing an increase of EUR 696
thousand. Share premium increased by EUR 10,797 thousand relating to the difference between
the face amount of the debentures exchanged and the par value of the shares issued.
(48) Explanation added for translation to EnglishThese consolidated financial statements are presented on the basis of IFRSs as adopted by the
European Union. Certain accounting practices applied by the Group that conform with IFRSs may
not conform with other generally accepted accounting principles.
143Bankinter Group
LEGAL GRUPO ingles.qxd 13/6/07 08:44 Página 143
B
Directors' Report
Introduction
The Bankinter Group maintained a positive quarter-by-quarter earnings trend throughout 2006,
with pre-tax profit amounting to EUR 316.34 million, up 19.17% on 2005.
Net profit amounted to EUR 208.49 million, which represents an increase of 11.08% with respect to
2005 year-end. If the extraordinary impact of the income tax reform is disregarded, net profit
would have reached EUR 222.57 million, up 18.6% on 2005.
The tax reform, which consists of a reduction of income tax to 32.5% in 2007 and 30.0% in 2008,
required a downward accounting adjustment in December of the tax assets recognised in the
balance sheet arising mainly from general allowances. This industry-wide accounting effect will be
offset by lower taxation in future years and, therefore, by higher profit after tax in the coming
years. The impact of this revaluation was to reduce profit by EUR 14.08 million in the income
statement. The effect of the revaluation of deferred taxes was to reduce the Group’s equity by EUR
5.86 million.
Balance sheet and earnings
The Bankinter Group’s balance sheet at 31 December 2006 showed growth in all its aggregates.
Accordingly, total assets grew by 12.97% to EUR 46,076 million at 2006 year-end; on- and off-
balance-sheet customer funds amounted to EUR 44,183 million, up 14.63%; and pension funds
grew even more substantially (21.39%). The Bank’s loans and receivables increased by 21.10% to
EUR 31,654 million.
The income statement reflects solid growth in the main business margins: net interest income rose
by 10.08% with respect to 2005, gross income by 15.14% and net operating income by 17.08%.
With respect to the Group’s business ratios, ROE was similar to 2005 (14.94%), ROA stood at 0.48%
and the efficiency ratio fell from 49.60% at December 2005 to 49.08% in 2006, mainly because the
rate of growth started to slow.
Bankinter Group 144
LEGAL GRUPO ingles.qxd 13/6/07 08:44 Página 144
Business strategy
Within the customer business, all segments reported significant growth, especially the segments
on which the Bank has been focusing recently and in which the largest investments have been
made, which illustrates the soundness of these investments and the good management thereof.
Accordingly, profit after tax in the SME segment increased by 49.49% with respect to 2005, a
particularly significant figure if we take into account the investments made to open new branches
specialising in this type of customer (124 branches at 2006 year-end, up from 105 in 2005).
Significant growth in profit after tax was also reported in the higher net worth customer segments,
such as Personal Finance and Private Banking, with increases in net profit of 28.40% and 29.62%,
respectively.
Also, the strong pace of customer attraction witnessed in recent years continued in 2006: 172,000
customers were attracted at December 2006, an increase of 16.6% on the year-ago period. At 2006
year-end, the Bank had 674,000 active customers, 13.6% more than in 2005.
Similarly, there was a notable increase in the number of the Bank’s employees, which totalled
3,981 at year-end, up 7.25% on the year-ago period.
Following what has become a trend at the Entity, the aforementioned growth is supported by its
fundamental values, on the basis of which the Bank has created its new corporate image focusing
on differentiation, which was presented in December. The purpose of this change and improvement
initiative is to strengthen Bankinter’s position as a significant and attractive brand, in line with its
business strategy, and to reflect the Bank’s true identity, thus adapting perception to reality. These
fundamental values include most notably intelligence, integrity, agility, originality and, especially,
permanent innovation.
Additionally, service quality continued to represent Bankinter’s most important competitive
advantage. At December 2006 the Bank’s Net Satisfaction Index (ISN) was 6.35 points above the
market average and the abandonment rate was 6.9, the lowest in the Spanish banking industry.
2006 year-end witnessed the good performance of fees and commissions, with net growth of 14.5%,
most notably the fees and commissions relating to securities services (up 63.1%), and the strength
of net gains on financial assets and liabilities, which increased by 44.9% to EUR 97.53 million.
145Bankinter Group
LEGAL GRUPO ingles.qxd 13/6/07 08:44 Página 145
B
Particular mention should also be made of the contribution to the Bankinter Group’s accounts by
the insurance business. Bankinter Seguros de Vida and Bankinter Gestión de Seguros contributed
EUR 27.66 million and EUR 29.39 million, respectively, to profit before tax.
Doubtful risk amounted to EUR 93.24 million, equivalent to 0.25% of the computable risk assets of
the Bank, which is a benchmark in the Spanish banking industry. Similarly, the non-performing
loans ratio reached 569.91%. Total loan loss allowances increased by 21.51% on 2005. In short,
Bankinter continues to maintain excellent solvency levels due to in-house risk analysis, automatic
acceptance and management systems, portfolio diversification, conservative loan loss provisions
and scant exposure to country-risk.
Earnings per share stood at EUR 2.68, up 9.84% on the year-ago period. Also, the Bankinter share
price rose from EUR 46.87 at 31 December 2005 to EUR 59.60 at 2006 year-end, which represents
an increase of 27.16%.
Minimum capital
Article 25 of Royal Decree 1343/1992, of 6 November, implementing Law 13/1992, of 1 June,
stipulates that the capital of consolidated groups of credit institutions must not be less than 8% of
their total risk assets, positions and memorandum items, weighted using the coefficients
established by Bank of Spain Circular 5/1993, of 26 March, as amended by Bank of Spain Circular
3/2005, of 30 July.
At 31 December 2006 and 2005, the Group's capital met the requirements laid down by current
legislation.
As established by the Basel Committee on Banking Supervision, the capital of financial institutions
to be taken into account when determining whether minimum capital requirements are being met
(“computable capital”) is classified into three main categories:
� Core capital (Tier I), which relates to share capital/endowment fund, equity reserves, minority
interests and other similar items.� Supplementary capital (Tier II), which relates basically to the effect of measuring available-for-
sale assets and to non-current subordinated debt.� Other capital (Tier III), which relates basically to the subordinated liabilities not included in Tier II.
Bankinter Group 146
LEGAL GRUPO ingles.qxd 13/6/07 08:44 Página 146
At 31 December 2006 and 2005, the Group’s “computable capital”, as defined by the Basel
Committee on Banking Supervision, was as follows:
Thousands of Euros 31/12/06 31/12/05 Change %
Capital and reserves 1,534,882 1,395,041 139,841 10.02%
a) New capital regulations (BIS II)One of Bankinter's targets continues to be the specifications and developments required for the
implementation of the new capital regulations laid down by the Basel-based Bank for International
Settlements (BIS II). The Bank is focusing its work on the application of in-house credit risk models
that enable the use of capital to be adapted to the credit risk actually incurred by the Bank, thus
ensuring enhanced risk management. Also, the operational risk management parameters that will
enable Bankinter to comply with the requirements regarding policies, management processes and
quantification of losses are being defined and developed.
b) New Bankinter brandIn December, Bankinter presented its new corporate image focusing on differentiation.
147Bankinter Group
.
LEGAL GRUPO ingles.qxd 13/6/07 08:44 Página 147
B
The purpose of this change and improvement initiative is to strengthen Bankinter’s position as a
significant and attractive brand, in line with its business strategy, and to reflect the Entity’s true
identity, thus adapting perception to reality.
The brand values should be: intelligence, a bank that thinks and makes its customers think, and
understands their needs; integrity (honesty and transparency in the way of saying and doing
things); agility, the extent of Bankinter’s ability to resolve problems before they arise in a quick
and efficient way; originality; and, especially, permanent innovation, the distinguishing feature
that forms the focus for all Bankinter’s projects and has led the Bank to stay one step ahead of the
game and opt for solutions which have improved the financial services product offering in Spain
and, in short, its customers’ quality of life.
The new Bankinter brand –which retains orange as the corporate colour, the colour that has
identified the Bank throughout its 40-plus years of life– not only defines a new visual identity but
also a new way of saying and doing things. In this connection, the new brand will affect all facets
of the visual identification of the Entity, and will bring together the names and sub-brands of the
Bank’s various business lines and networks under a single conceptual umbrella.
c) Awards and recognitionThe “Actualidad Económica” magazine –in its traditional annual ranking of the best annual
reports– rated the quality of Bankinter’s latest annual report as “Outstanding” and gave it a
commendable third place in a long list of 124 Spanish companies. The magazine, which based its
analysis on the cooperation of PwC experts, gave Bankinter’s annual report 93 points out of 100.
Points were given to major subject areas, and Bankinter received the maximum score for
“Corporate Social Responsibility” and “Market Information”.
Bankinter was awarded the second prize for the Best Social Project through the Employees’ Portal
in the 4th Annual Awards for Best Employees’ Portal organised by the Observatory for Internal
Communication and Corporate Identity in which Instituto Empresa, Capital Humano and Infopress
take part. The jury considered the global nature of Bankinter’s Project and its availability to all
employees through the Intranet, and mentioned such aspects as: the AA accessibility certification
of our websites, the training courses on accessibility, the internal volunteers’ websites and the
various areas devoted to social integration programmes.
Bankinter Group 148
LEGAL GRUPO ingles.qxd 13/6/07 08:44 Página 148
d) Social action and Fundación de la InnovaciónOn 3 December 2006, the International Day of Disabled Persons, Bankinter presented a new audio
financial information service specially conceived for partially sighted customers as a further
example of Bankinter’s activities in building a “bank for all” as a part of its “Accessible Bankinter”
project.
This innovative project known as “Audio Bank Statement” provides customers who request it with a
CD with comprehensive audio information on all their accounts with the Bank. The information is
produced on a monthly basis and consists of a voice transcription of the balances of the customer’s
accounts at month-end, together with a breakdown of the movements during that period.
The 7th Future Trends Forum (FTF), the main project of Bankinter’s Fundación de la Innovación,
took place in the fourth quarter of 2006. The objective of this forum is to analyse the most
innovative trends and to influence companies’ attitudes towards technological innovation, thus
stimulating new business opportunities. This year’s subject, “Innovation and Competitiveness”, was
useful in making a diagnosis of Spain’s current position in those fields and obtaining initial
recommendations for the country. In addition, the Foundation published the conclusions of the 6th
Forum, which was devoted to Energy.
After the balance sheet date, no events occurred with an impact on the accompanying consolidated
financial statements that were not included therein; at 31 December 2006, the Group had not
carried out any significant research and development activities. The treasury shares held by
Bankinter are disclosed in Note 22 to the consolidated financial statements.
149Bankinter Group
LEGAL GRUPO ingles.qxd 13/6/07 08:44 Página 149
BBankinter Group 150
LEGAL GRUPO ingles.qxd 13/6/07 08:44 Página 150
151Bankinter Group
Appendixes
LEGAL GRUPO ingles.qxd 13/6/07 08:44 Página 151
B
Appendix IConsolidated statements of changes in equity(Consolidated statements of recognised income and expensefor the Years Ended 31 December 2006 and 2005)(Thousands of Euros)
Bankinter Group 152
31/12/06 31/12/05(*)
1. Net income recognised directly in equity (38,306) 1,171
Loans Debt Other Trading Other Hedging Investments Insurance Doubtful ImpairmentInstruments Equity Derivatives Financial Derivatives Contracts Assets Losses
Instruments Assets Linked to Pensions
Group entities 56,416 935,292 - 1,722 - - - - - -
Jointly controlled entities - - - - - - - - - -
Associates - - - - - - - - - -
Other related entities 35,283 - - 11,280 - - - - - -
Related individuals 35,497 - - 48 - - - - - -
Assets 2006
Deposits Marketable Trading Short Subordinated Other Hedging Provisions Equity Having ShareDebt Derivatives Positions Liabilities Financial Derivatives the Substance Capital
Securities Liabilities Derivatives of a Financial (e)Liability
Interest Expense Fee and Insurance Losses on Cost of Personnel Other Other Finance Other and Similar Commission Activity Financial Sales expenses General Operating Expenses of Losses
Charges Expense Expenses Assets and Administrativ Expenses Non-FinancialLiabilities e Expenses Activities
Interest and Fee and Income Share of Insurance Losses on Sales and Other Finance OtherSimilar Commission from Results of Activity Financial Income from Operating Income from GainsIncome Income Equity Entities Income Assets and the Provision Income Non-Financial
Instruments Accounted for Liabilities of Non-Financial ActivitiesEquity Method Services
Appendix IVTransactions and Balances with Related Parties - 2006(Thousands of Euros)
LEGAL GRUPO ingles.qxd 13/6/07 08:44 Página 159
Bankinter Group B160
Loans Debt Other Trading Other Hedging Investments Insurance Doubtful ImpairmentInstruments Equity Derivatives Financial Derivatives Contracts Assets Losses
Instruments Assets Linked to Pensions
Group entities 56,186 702,931 - 1,148 - - - - - -
Jointly controlled entities - - - - - - - - - -
Associates - - - - - - - - - -
Other related entities 20,140 - - 7,100 - - - - - -
Related individuals 35,944 - - 48 - - - - - -
Assets 2005
Deposits Marketable Trading Short Subordinate Other Hedging Provisions Equity Having ShareDebt Derivatives Positions Liabilities Financial Derivatives the Substance Capital
Securities Liabilities of a Financial (e)Liability
Interest Fee and Insurance Losses on Cost of Personnel Other Other Finance OtherExpense Commission Activity Financial Sales Expenses General Operating Expenses of Losses
and Similar Expense Expenses Assets and Administrativ Expenses Non-Financial Charges Liabilities e Expenses Activities
Interest Fee and Income Share of Results Insurance Losses on Sales and Other Finance Other and Commission from of Entities Activity Financial Income from Operating Income from Gains
Similar Income Equity Accounted for Income Assets and the Prov. of Income Non-Financial Income Ins. Using the Liabilities Non-Financial Activities
Appendix VBalance sheets for the distribution of 2006 dividends(Thousands of Euros)
Thousands of Euros 31/05/06 31/08/06 30/11/06ASSETS1. CASH AND BALANCES WITH CENTRAL BANKS 212,981 380,289 508,2912. FINANCIAL LIABILITIES HELD FOR TRADING 3,520,855 3,384,066 3,583,6632.1. Loans and advances to credit institutions - - -2.2. Money market operations through counterparties - - -2.3. Loans and advances to customers - - -2.4. Debt instruments 3,065,320 3,119,936 3,191,6112.5. Other equity instruments 334,641 154,281 267,3232.6. Trading derivatives 120,894 109,849 124,729Memorandum item: Loaned or advanced as collateral 2,694,629 2,772,449 2,850,5823. OTHER FINANCIAL ASSETS AT FAIR VALUE THROUGH PROFIT OR LOSS 20,446 15,619 17,1803.1. Loans and advances to credit institutions - - -3.2. Money market operations through counterparties - - -3.3. Loans and advances to customers - - -3.4. Debt instruments - - -3.5. Other equity instruments 20,446 15,619 17,180Memorandum item: Loaned or advanced as collateral - - -4. AVAILABLE-FOR-SALE FINANCIAL ASSETS 4,811,698 3,792,169 5,203,3314.1. Debt instruments 4,755,958 3,743,568 5,136,5164.2. Other equity instruments 55,740 48,601 66,815Memorandum item: Loaned or advanced as collateral 3,734,234 3,734,566 4,997,7505. LOANS AND RECEIVABLES 32,777,367 34,658,310 36,755,7725.1. Loans and advances to credit institutions 3,973,589 4,584,984 5,424,0095.2. Money market operations through counterparties - - -5.3. Loans and advances to customers 28,556,631 29,754,359 31,044,7125.4. Debt instruments - - -5.5. Other financial assets 247,147 318,967 287,051Memorandum item: Loaned or advanced as collateral - - -6. HELD-TO-MATURITY INVESTMENTS - - -Memorandum item: Loaned or advanced as collateral - - -9. CHANGES IN THE FAIR VALUE OF HEDGED ITEMS IN PORTFOLIO HEDGES OF INTEREST RATE RISK (5,334) (7,330) (7,377)10. HEDGING DERIVATIVES 75,453 78,096 80,77311. NON-CURRENT ASSETS HELD FOR SALE 4,288 4,731 4,34511.1. Loans and advances to credit institutions - - -11.2. Loans and advances to customers - - -11.3. Debt instruments - - -11.4. Equity instruments - - -11.5. Tangible assets 4,288 4,731 4,34511.6. Other assets - - -12. INVESTMENTS 137,065 136,361 135,55912.1. Associates 656 656 65612.2. Jointly controlled entities 36,225 36,225 36,22512.3. Group entities 100,184 99,480 98,67813. INSURANCE CONTRACTS LINKED TO PENSIONS - - -15. TANGIBLE ASSETS 312,882 326,168 328,45515.1. For own use 310,050 309,728 309,99015.2. Investment property - - -15.3. Other assets leased out under an operating lease 2,832 16,440 18,46515.4 Assigned to welfare projects - - -Memorandum item: Acquired under a finance lease - - -16. INTANGIBLE ASSETS 178 1,136 2,38616.1. Goodwill - - -16.2. Other intangible assets 178 1,136 2,38617. TAX ASSETS 229,949 234,307 235,47917.1. Current 55,947 51,463 47,26417.2. Deferred 174,002 182,844 188,21518. PREPAYMENTS AND ACCRUED INCOME 39,696 44,448 57,99819. OTHER ASSETS 6,338 13,460 6,869
TOTAL ASSETS 42,143,862 43,061,830 46,912,724
LEGAL GRUPO ingles.qxd 13/6/07 08:44 Página 161
Bankinter Group B162
Thousands of Euros 31/05/06 31/08/06 30/11/06LIABILITIES AND EQUITYLIABILITIES1. FINANCIAL LIABILITIES HELD FOR TRADING 2,769,370 2,877,797 2,845,5411.1. Deposits from credit institutions - - -1.2. Money market operations through counterparties - - -1.3. Customer deposits - - -1.4. Marketable debt securities - - -1.5. Trading derivatives 117,544 109,434 129,0481.6. Short positions 2,651,826 2,768,363 2,716,4932. OTHER FINANCIAL LIABILITIES AT FAIR VALUE THROUGH PROFIT OR LOSS - - -2.1. Deposits from credit institutions - - -2.2. Customer deposits - - -2.3. Marketable debt securities - - -3. FINANCIAL LIABILITIES AT FAIR VALUE THROUGH EQUITY - - -3.1. Deposits from credit institutions - - -3.2. Customer deposits - - -3.3. Marketable debt securities - - -4. FINANCIAL LIABILITIES AT AMORTISED COST 37,670,358 38,378,683 42,162,3014.1. Deposits from central banks 200,024 24 244.2. Deposits from credit institutions 5,958,087 5,548,464 7,365,9884.3. Money market operations through counterparties 234,999 10,000 10,0004.4. Customer deposits 22,518,484 22,950,167 26,004,8304.5. Marketable debt securities 7,543,677 8,543,998 7,392,2304.6. Subordinated liabilities 792,315 894,242 899,1344.7. Other financial liabilities 422,772 431,788 490,09510. CHANGES IN THE FAIR VALUE OF HEDGED ITEMS IN PORTFOLIOHEDGES OF INTEREST RATE RISK - - -11. HEDGING DERIVATIVES 4,532 4,849 8,69912. LIABILITIES ASSOCIATED WITH NON-CURRENT ASSETS HELD FOR SALE - - -12.1. Customer deposits - - -12.2. Other liabilities - - -14. PROVISIONS 154,714 157,733 159,85314.1. Provisions for pensions and similar obligations - - -14.2. Provisions for taxes - - -14.3. Provisions for contingent liabilities and commitments 25,174 29,171 30,58414.4. Other provisions 129,540 128,562 129,26915. TAX LIABILITIES 108,778 124,833 119,64215.1. Current 34,319 34,396 26,17515.2. Deferred 74,459 90,437 93,46716. ACCRUED EXPENSES AND DEFERRED INCOME 67,738 85,821 102,48717. OTHER LIABILITIES 135,472 163,897 251,83017.1. Welfare fund - - -17.2. Other 135,472 163,897 251,83018. EQUITY HAVING THE SUBSTANCE OF A FINANCIAL LIABILITY - - -18.CAPITAL CON NATURALEZA DE PASIVO FINANCIERO - - -
TOTAL TOTAL LIABILITIES 40,910,962 41,793,613 45,650,353
LEGAL GRUPO ingles.qxd 13/6/07 08:44 Página 162
163Bankinter Group
Thousands of Euros 31/05/06 31/08/06 30/11/06EQUITY2. VALUATION ADJUSTMENTS 17,385 47,676 51,3572.1. Available-for-sale financial assets: 16,980 47,201 50,3372.2. Financial liabilities at fair value through equity - - -2.3. Cash flow hedges - - -2.4. Hedges of net investments in foreign operations - - -2.5. Exchange differences 405 475 1,0202.6. Non-current assets held for sale - - -3. OWN FUNDS 1,215,515 1,220,541 1,211,0143.1. Capital or endowment fund 117,878 117,878 117,8783.1.1. Issued 117,878 117,878 117,8783.1.2. Unpaid and uncalled (-) - - -3.2. Share premium 319,676 319,676 319,6763.3. Reserves 808,301 810,848 812,3523.3.1. Accumulated reserves (losses) 808,301 810,848 812,3523.3.2. Retained earnings - - -3.4. Other equity instruments 10,096 10,782 11,4673.4.1. Equity component of compound financial instruments 10,096 10,782 11,4673.4.2. Other - - -3.5. Less: Treasury shares (40,436) (14,450) (1,044)3.6. Non-voting equity units and associated funds (savings banks) - - -3.6.1. Non-voting equity units - - -3.6.2 Reserves of non-voting equity unit holders - - -3.6.3. Stabilisation fund - - -3.7. Profit/loss for the year - - -3.8. Less: dividends and remuneration - (24,193) (49,315)
TOTAL EQUITY 1,232,900 1,268,217 1,262,371TOTAL EQUITY AND LIABILITIES 42,143,862 43,061,830 46,912,724
MEMORANDUM ITEMS1. CONTINGENT LIABILITIES 2,588,832 2,699,919 2,867,9511.1. Financial guarantees 2,525,682 2,631,246 2,824,2131.2. Assets earmarked for third-party obligations - - -1.3. Other contingent liabilities 63,150 68,673 43,7382. CONTINGENT COMMITMENTS 7,126,238 7,548,265 7,929,3252.1. Drawable by third parties 6,530,185 6,959,222 7,231,6382.2. Other commitments 596,053 589,043 697,687
LEGAL GRUPO ingles.qxd 13/6/07 08:44 Página 163
Bankinter Group B164
Appendix VIBalance sheets and income statements of Bankinter, S.A.at 31 December 2006 and 2005(Thousands of Euros)
Assets 31/12/06 31/12/05Cash and balances with central banks (Note 6) 539,178 435,916Financial assets held for trading (Note 7)Loans and advances to credit institutions - - Money market operations through counterparties - - Loans and advances to customers - - Debt instruments 2,503,479 4,327,317Other equity instruments 108,664 39,811Trading derivatives 138,139 264,249 Memorandum item: Loaned or advanced as collateral 1,981,715 4,002,508
2.750.282 4.631.377 Other financial assets at fair value through profit or loss (Note 7)Loans and advances to credit institutions - - Money market operations through counterparties - - Loans and advances to customers - - Debt instruments - - Other equity instruments 24,596 23,884 Memorandum item: Loaned or advanced as collateral - -
24,596 23,884 Available-for-sale financial assets (Note 8)Debt instruments 5,041,823 4,027,322 Other equity instruments 70,190 34,088 Memorandum item: Loaned or advanced as collateral 5,136,809 3,910,342
5,112,013 4,061,410 Loans and receivables (Note 9)Loans and advances to credit institutions 5,386,892 3,896,304 Money market operations through counterparties - - Loans and advances to customers 31,694,029 26,198,502 Debt instruments - - Other financial assets 186,783 140,153 Memorandum item: Loaned or advanced as collateral - -
37,267,704 30,234,959 Held-to-maturity investments (Note 10) - 448,292 Memorandum item: Loaned or advanced as collateral 448,292 448,292
- 448,292 Changes in the fair value of hedged items in portfolio hedges of interest rate risk (Note 11) (10,217) (7,464)Hedging derivatives (Note 11) 90,065 86,028 Non-current assets held for sale (Note 12)Loans and advances to credit institutions - - Loans and advances to customers - - Debt instruments - - Equity instruments - - Tangible assets 3,965 3,827 Other assets - -
135,328 136,007 Insurance contracts linked to pensions - - Tangible assets (Note 14)For own use 310,283 309,258 Investment property - - Other assets leased out under an operating lease 18,362 76 Memorandum item: Acquired under a finance lease - -
219,757 273,779 Prepayments and accrued income (Note 17) 50,112 19,473Other assets (Note 18) 200,940 167,682 TOTAL ASSETS 46,715,535 40,824,729
LEGAL GRUPO ingles.qxd 13/6/07 08:44 Página 164
165Bankinter Group
Liabilities 31/12/06 31/12/05Financial assets held for trading (Note 7)Deposits from credit institutions - - Money market operations through counterparties - - Customer deposits - - Marketable debt securities - - Trading derivatives 103,223 246,469 Short positions 2,462,625 3,107,171
2,565,848 3,353,640 Other financial liabilities at fair value through profit or loss:Deposits from credit institutions - - Customer deposits - - Marketable debt securities - -
- - Financial liabilities at fair value through equityDeposits from credit institutions - - Customer deposits - - Marketable debt securities - -
- - Financial liabilities at amortised cost (Note 19)Deposits from central banks 24 580,141 Deposits from credit institutions 6,969,068 5,715,502 Money market operations through counterparties 10,000 10,000 Customer deposits 26,301,310 20,508,201 Marketable debt securities 7,782,034 7,825,858 Subordinated liabilities 937,327 725,186 Other financial liabilities 349,042 408,337
42,348,805 35,773,225 Changes in the fair value of hedged items in portfolio hedges of interest rate risk - - Hedging derivatives (Note 11) 907 47,892 Liabilities associated with non-current assets held for saleCustomer deposits - - Other liabilities - -
- - Provisions (Note 20)Provisions for pensions and similar obligations - - Provisions for taxes - - Provisions for contingent liabilities and commitments 32,655 25,271 Other provisions 130,452 133,025
100,590 101,857 Accrued expenses and deferred income (Note 17) 89,847 68,302 Other liabilities (Note 18)Other 71,067 43,885 Equity having the substance of a financial liability - -
TOTAL LIABILITIES 45,340,171 39,547,097
LEGAL GRUPO ingles.qxd 13/6/07 08:44 Página 165
Bankinter Group B166
Equity 31/12/2006 31/12/2005Valuation adjustments (Note 21)Available-for-sale financial assets: 15,834 52,999 Financial liabilities at fair value through equity - - Cash flow hedges - - Hedges of net investments in foreign operations - - Exchange differences 1,255 108 Non-current assets held for sale - -
Own funds (Note 22) 17,089 53,107 Capital or endowment fundIssued 117,878 116,875Unpaid and uncalled (-) - -
818,756 736,097 Other equity instrumentsEquity component of compound financial instruments 11,695 12,384 Other - -
11,695 12,384 Less: Treasury shares (1,048) (33,763) Profit for the year 166,538 160,737 Less: Dividends and remuneration (75,220) (68,413)
1,375,364 1,277,632 TOTAL EQUITY AND LIABILITIES 46,715,535 40,824,729
Memorandum items:Contingent liabilities (Note 23)Financial guarantees 3,880,674 2,476,207 Assets earmarked for third-party obligations - - Other contingent liabilities 50,180 55,121
3,930,854 2,531,328 Compromisos contingentes (Nota 23)Drawable by third parties 7,385,309 5,830,097 Other commitments 326,791 240,058
7,712,100 6,070,155 11.642.954 8,601,483
LEGAL GRUPO ingles.qxd 13/6/07 08:44 Página 166
167Bankinter Group
Profit and loss accounts 31/12/06 31/12/05Interest and similar income (Note 28) 1,467,992 1,105,616 Interest expense and similar charges (Note 28) 1,022,433 713,935 Return on equity having the substance of a financial liability - - Other 1,022,433 713,935 Income from equity instruments 64,550 33,801 Investments in associates 2,265 397 Investments in jointly controlled entities - - Investments in Group entities 46,337 25,645 Other equity instruments 15,948 7,759
Net interest income 510,109 425,482
Fee and commission income (Note 27) 232,260 201,183 Fee and commission expense (Note 27) 69,168 59,119 Gains/Losses on financial assets and liabilities (net) (Note 29) 6,721 45,747 Held for trading (26,666) 15,490 Other financial instruments at fair value through profit or loss 2,767 5,223 Available-for-sale financial assets (41,761) 46,548 Loans and receivables - - Other 72,381 (21,514)Exchange differences (net) (Note 30) 47,846 36,435
Gross income 727,768 649,728
Other operating income (Note 32) 32,070 18,761 Personnel expenses (Note 26) 218,115 184,117 Other general administrative expenses (Note 31) 176,655 162,823 Depreciation and amortisation 22,790 19,797 Tangible assets 22,673 19,669 Intangible assets 117 128 Other operating expenses (Note 32) 5,532 4,901
Net operating income 336,746 296,851
Impairment losses (net) 97,509 77,438 Available-for-sale financial assets - - Loans and receivables 97,295 79,778 Held-to-maturity investments - - Non-current assets held for sale (399) (384)Investments 613 (1,956)Tangible assets - - Goodwill - - Other intangible assets - - Other assets - - Provisions (net) 9,614 6,505 Other gains (Note 33) 20,637 18,742 Gains on disposal of tangible assets 886 565 Gains on disposal of investments 5,122 4,371 Other items 14,629 13,806 Other losses (Note 33) 5,706 5,227 Losses on disposal of tangible assets 83 35 Losses on disposal of investments - 36 Other items 5,623 5,156
Profit before tax (Note 41) 244,554 226,423
Income tax (Note 41) (78,016) (65,686)
Profit from ordinary activities 166,538 160,737
Profit/Loss from discontinued operations - -
Profit for the year 166,538 160,737
LEGAL GRUPO ingles.qxd 13/6/07 08:44 Página 167
Bankinter Group 168
LEGAL GRUPO ingles.qxd 15/6/07 10:04 Página 168
LEGAL GRUPO ingles.qxd 13/6/07 08:45 Página 169
This document is a translation of a duly approved Spanish-language
document, and is provided for informational purposes only. In the event of
any discrepancy between the text of this translation and the text of the
original Spanish-language document which this traslation is intended to
reflect, the text of the original Spanish-language document shall pevail.
The 2006 Bankinter Annual Report is available on CD-Rom; to obtain a copy please contact
Bankinter’s External Communications Department or request it by e-mail at: [email protected].
The list of Bankinter’s Branches and Agents is provided in a separate leaflet accompanying this Annual Report.
Published by:Bankinter’s External Communication Department
Front cover and graphic design by: Saffron
Development, execution and graphic production by: Gosban
902 431 766
www.gosban.com
LEGAL GRUPO ingles.qxd 13/6/07 08:45 Página 170
LEGAL GRUPO ingles.qxd 13/6/07 08:45 Página 171
Bankinter S.A.Paseo de la Castellana, 2928046 MadridT. +34 913 397 500F. +34 913 398 323Telex. 42760 BANKI ESwift: BKBK ES MM


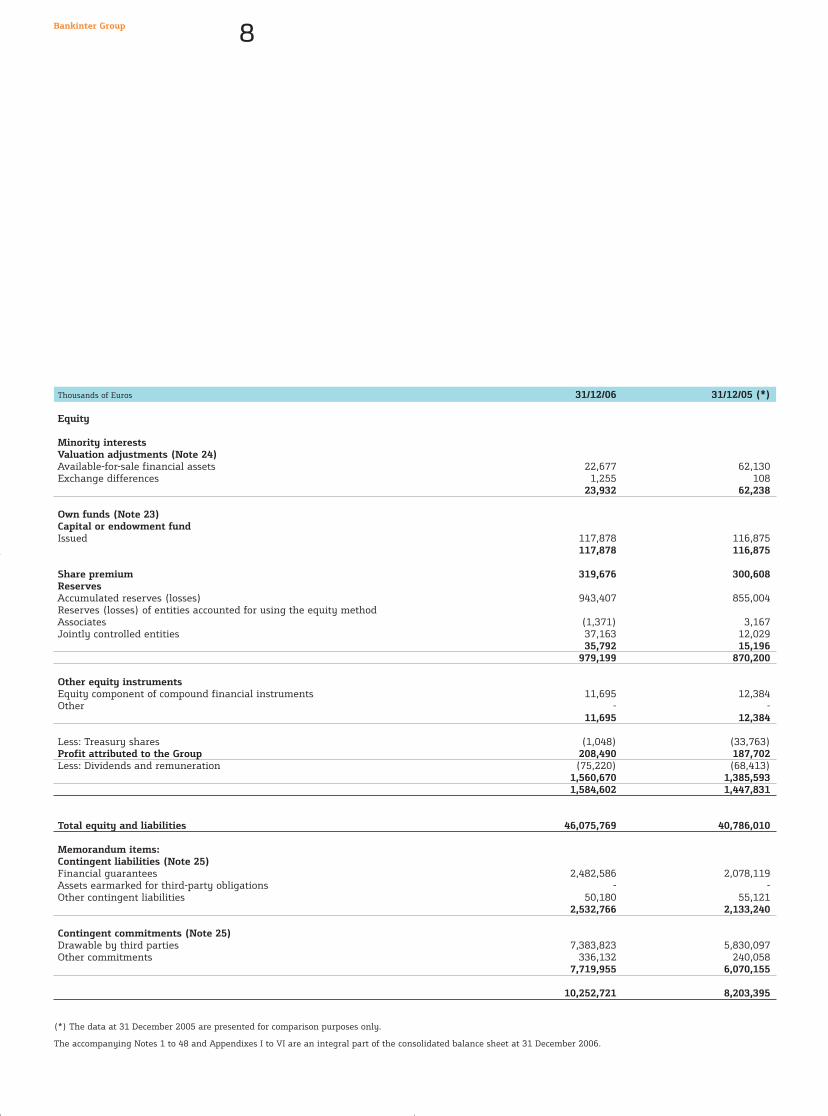


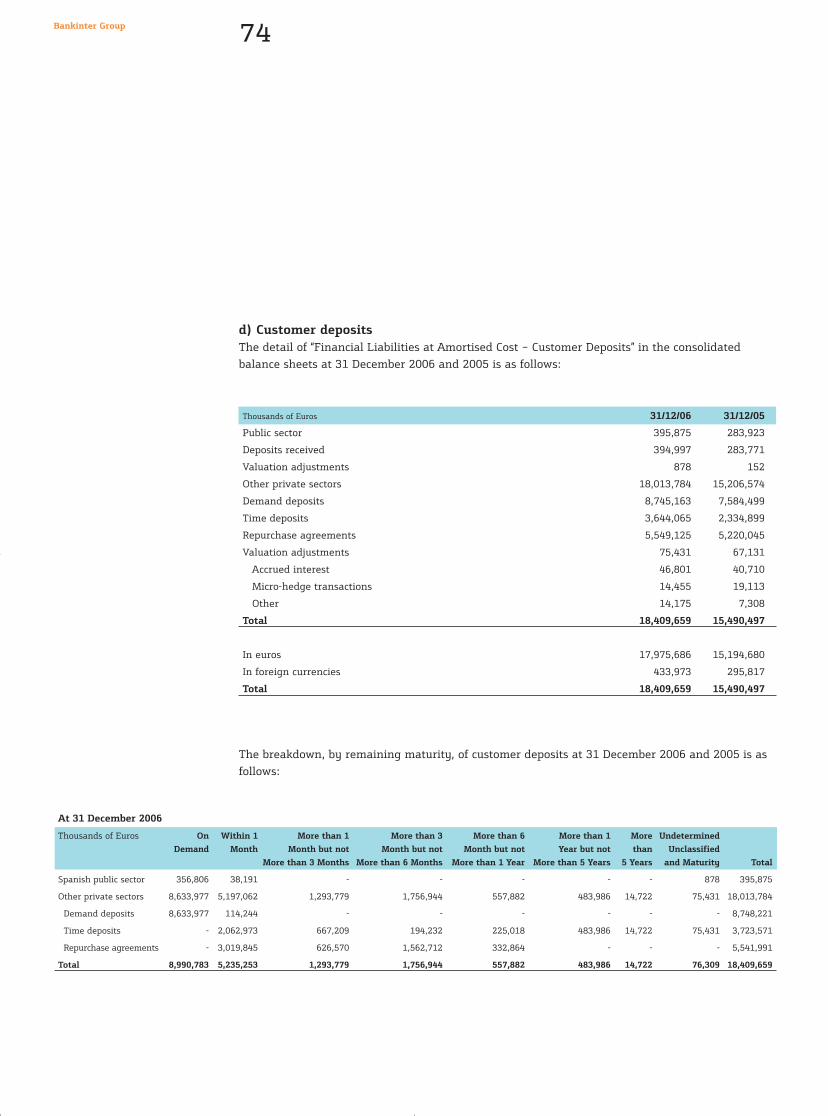


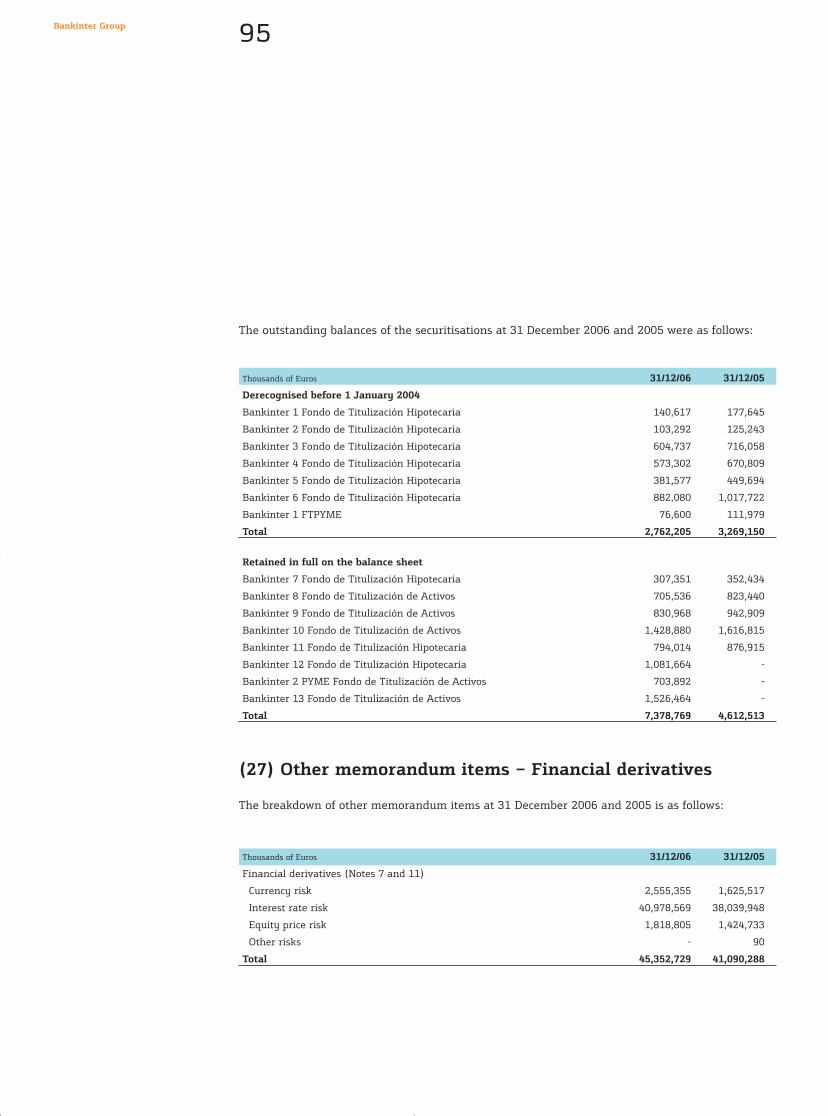


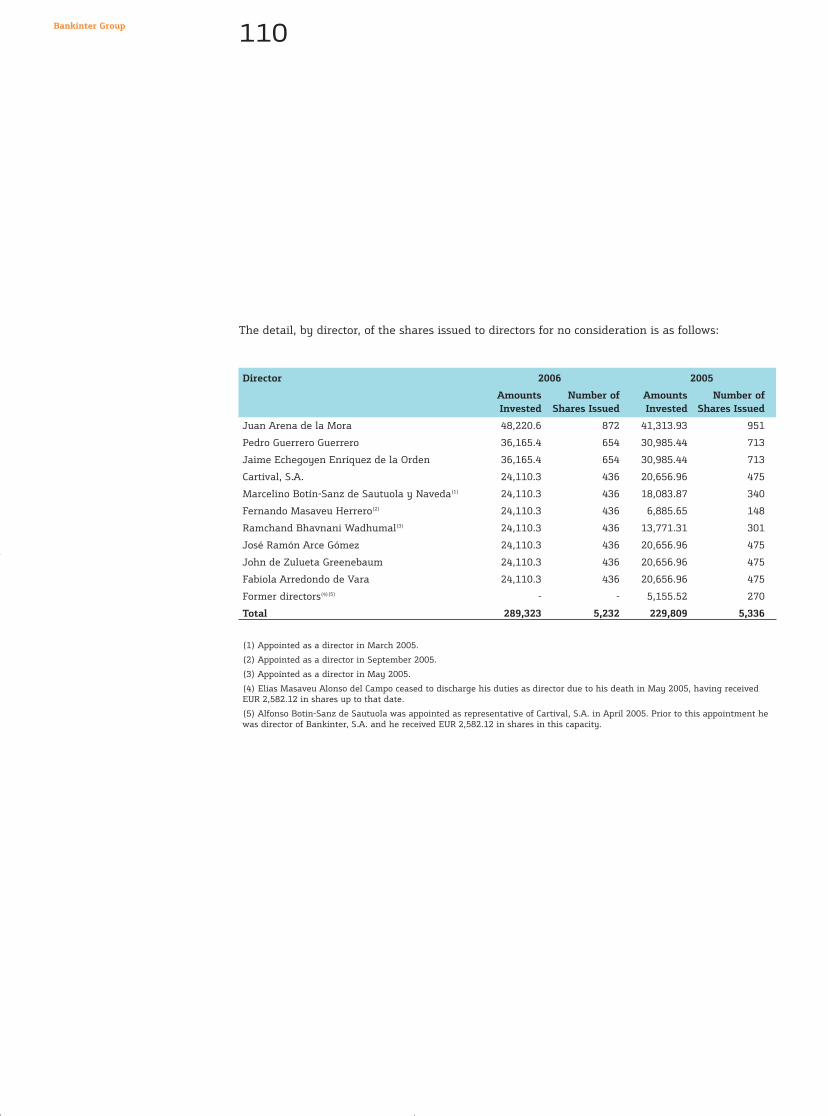


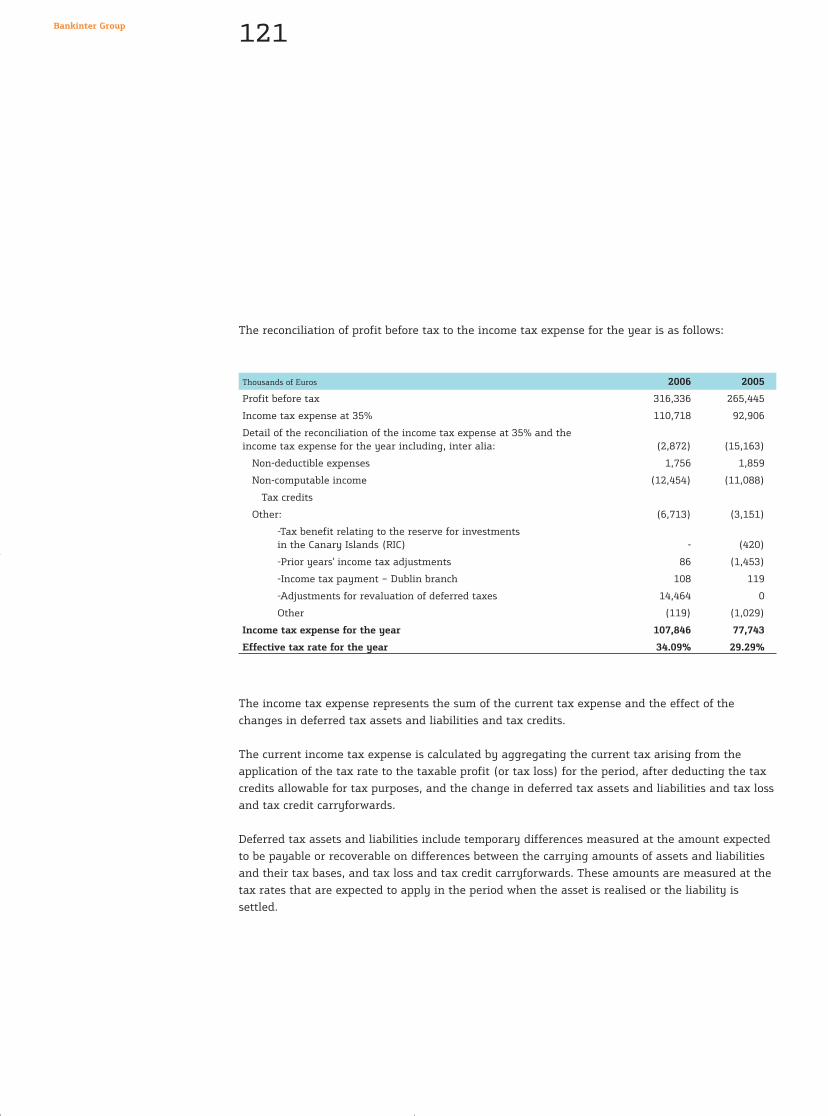


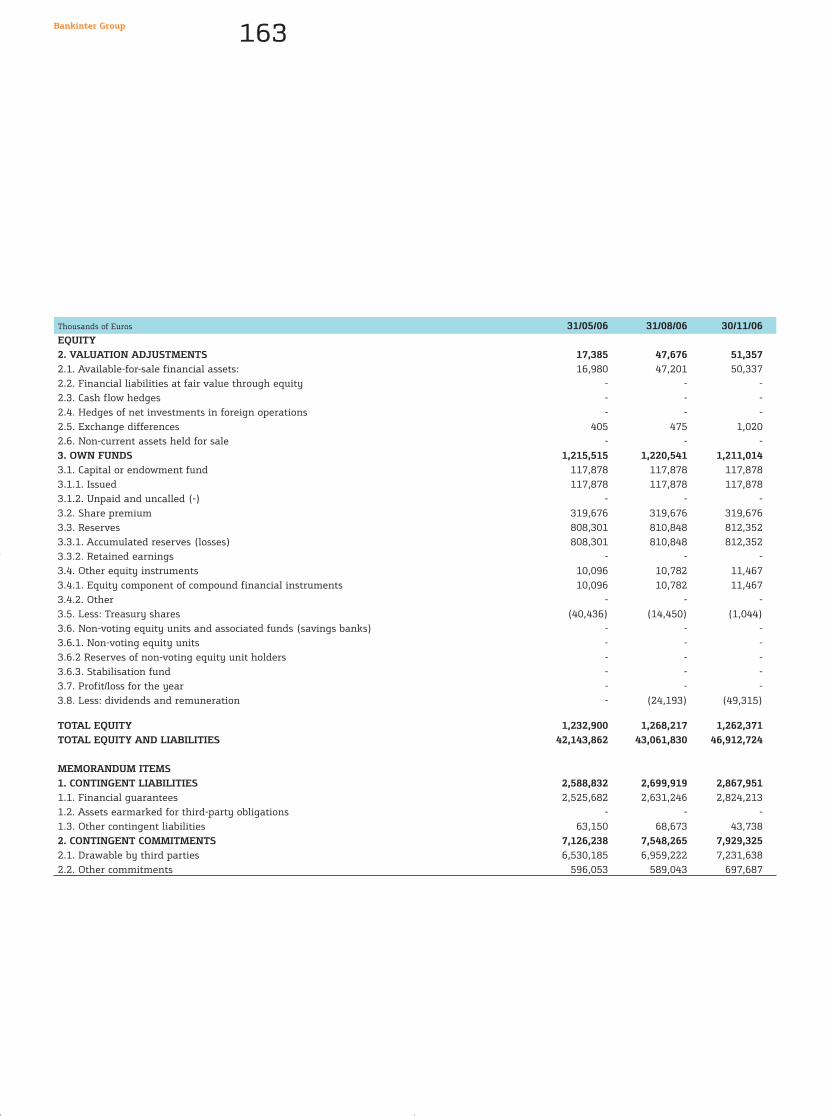
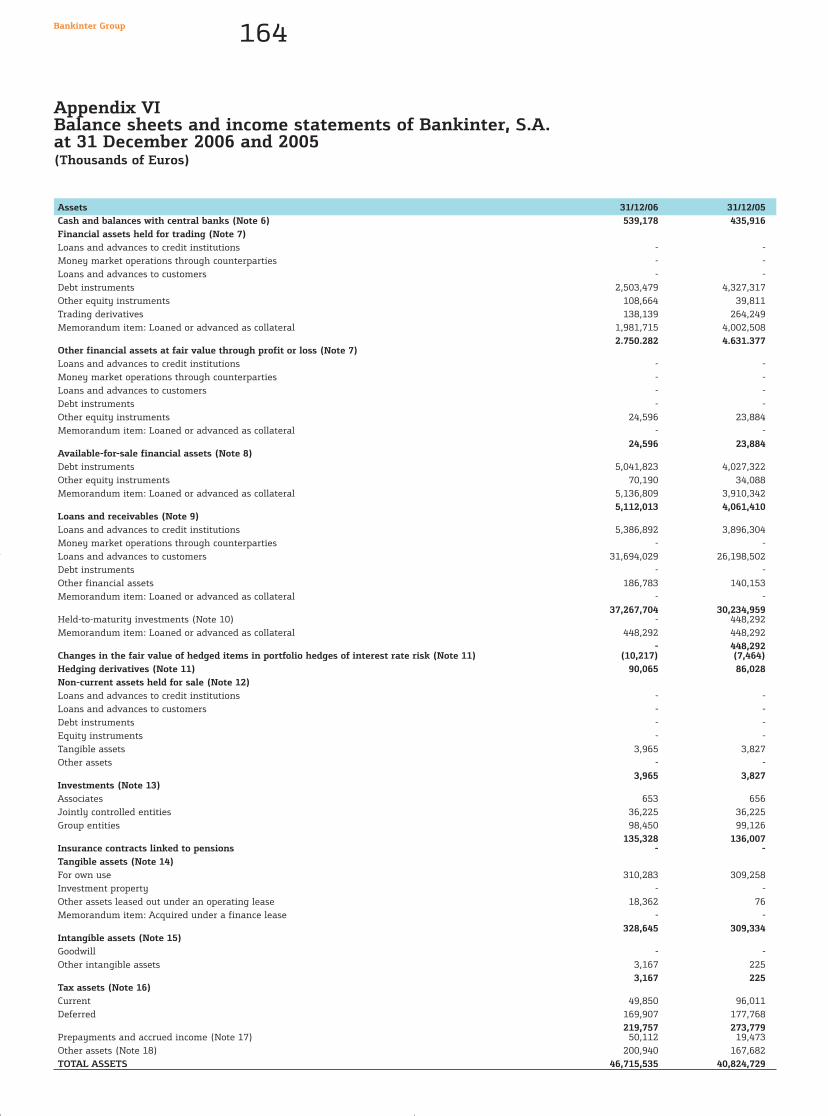

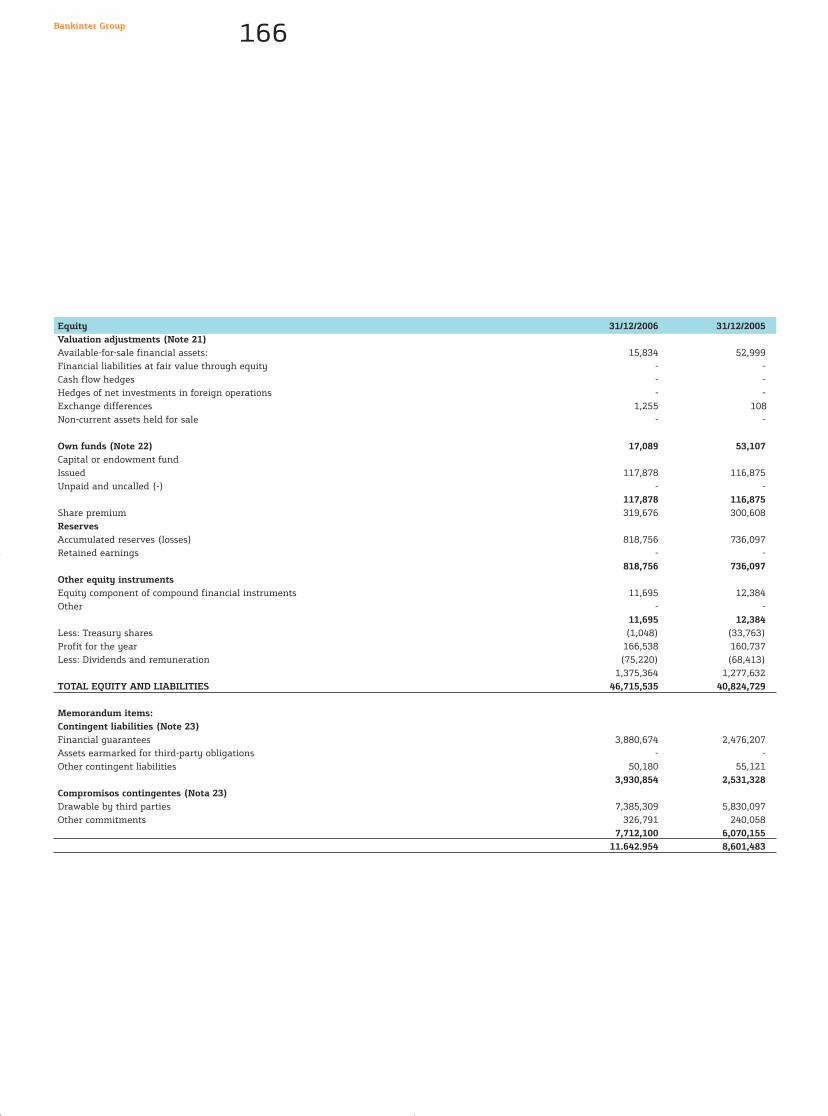

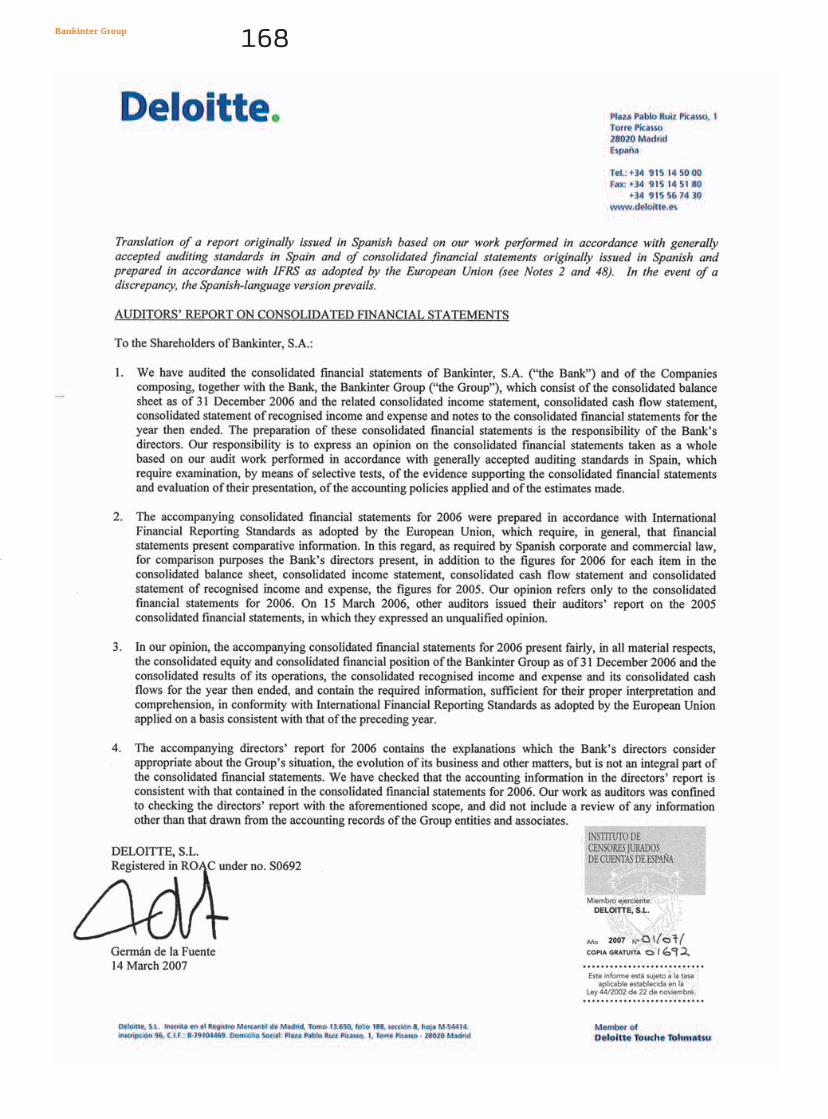


![c BKT < Tc BKT arXiv:1706.08304v1 [cond-mat.quant-gas] 26 ... · BKT. In the limit of large thick-ness Z, the quasi-2D BKT transition temperature ap-proaches that of the 3D BEC transition,](https://static.documents.pub/doc/80x56/5f6751beb4ea8e547468f9c0/c-bkt-tc-bkt-arxiv170608304v1-cond-matquant-gas-26-bkt-in-the-limit.jpg)


![Fairer but Not Fair Enough On the Equitability of ... · 3.1 Bayesian Knowledge Tracing (BKT) The BKT model is the most commonly used model for knowledge tracing [4, 13, 14]. BKT](https://static.documents.pub/doc/80x56/5f67529505909476d76ae2f6/fairer-but-not-fair-enough-on-the-equitability-of-31-bayesian-knowledge-tracing.jpg)
