Page 1 MBA Renewables, Investment and Financing Module Group Work, Investor Presentation Group 4 Carsten Jung Riikka Lauhkonen-Seitz Mario Maras Ovaise Mohammed Murtuza Adriana Stefanac 17 September 2013
Transcript
Page 1
MBA Renewables, Investment and Financing Module Group Work, Investor Presentation Group 4 Carsten Jung Riikka Lauhkonen-Seitz Mario Maras Ovaise Mohammed Murtuza Adriana Stefanac
17 September 2013
Page 2
Agenda
1. Introduction 2. Project Description and Status 3. Technology 4. Cost and Revenue Assumptions 5. Proposed Financing Structure and Returns 6. Risk Assessment 7. Project Attractiveness
Page 3
Introduction 1 Introduction
Page 4
Introduction Country and Sector Context
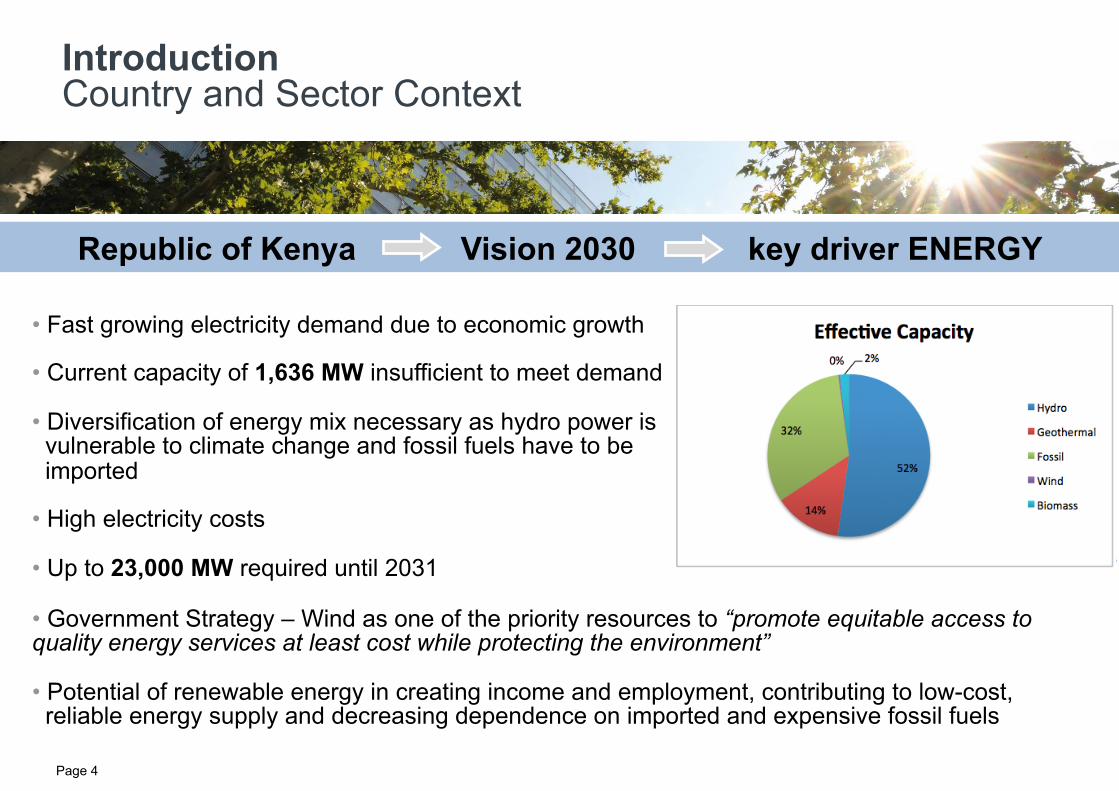
Republic of Kenya Vision 2030 key driver ENERGY
• Fast growing electricity demand due to economic growth • Current capacity of 1,636 MW insufficient to meet demand • Diversification of energy mix necessary as hydro power is vulnerable to climate change and fossil fuels have to be imported • High electricity costs
• Up to 23,000 MW required until 2031
• Government Strategy – Wind as one of the priority resources to “promote equitable access to quality energy services at least cost while protecting the environment”
• Potential of renewable energy in creating income and employment, contributing to low-cost, reliable energy supply and decreasing dependence on imported and expensive fossil fuels
Page 5
Introduction 2 Project Description and Status
Page 6
Project Description General Project Information
Project name Kipeto Wind Energy Project
Location Kipeto, Kenya
Type of turbine GE 1.6-100
Turbine capacity 1.62 MW
Number of turbines 63
Total installed capacity 102.06 MW
Net Output 476,613 MWh/year
Net capacity factor 53%
Feed-in-Tariff 0.12 USD/kWh
Commercial operation date August 2014
Expected operational project lifetime 20 years
CO2 emission reductions ~295,000tCO2/year
Total Investment 297,870,744 USD Project area (70km2, 1850m – 2035m AMSL), position of wind turbines, map of Kenya
Page 7
Project Status
Project Parties Agreements Project company Kipeto Energy Ltd Registered as SPV Project owner(s) • Craftskills Wind Energy International Ltd
• General Electric Joint Development Agreement signed
Turbine supplier General Electric Turbine supply contract signed EPC Contractor General Electric EPC contract signed Technical Service Provider General Electric 20 year O&M contract signed
Landowner Local community members 20 year land lease agreement Long-term off-taker KPLC Kenya Power and Lighting Company 20 year PPA (take-or-pay) signed Grid operator KPLC Kenya Power and Lighting Company Grid connection agreement in place Relevant Authorities • Ministry of Energy and Petroleum
• Energy Regulatory Commission • Kenya Civil Aviation Authority • Kajiado County • UNFCCC • National Environment Management Authority (NEMA)
Technology Key technology details of turbine, other facilities at project site
Other facilities § 34 km underground cable
trench system § Substation incl. step up
transformers (remote control via SCADA)
§ 20 km 220kV transmission line
§ Main and back-up metering system (remote access via GSM)
§ 324 m2 x 2 m concrete bases § Substation control building § 32 km access roads
GE 1.6-100 Manufacturer GE Energy
Rotor diameter 100 m
Area swept 7,854 m2
Number of blades 3
Length of blades 48.7 m
Hub height 80 m
Cut-in wind speed 3.5 m/s
Cut-off wind speed 25 m/s
Rotor speed range 9.75 to 16.18 rpm
Nominal output 1,620 kW
Operational data 50 Hz
Lifetime 20 years
Page 10
Technical Parameter Turbine technology GE Energy 1.6-100 GE Energy 1.6-100 Number of turbines 63 63 Turbine capacity 1.62 MW 1.62 Nominal plant capacity 102.06 MW 102.06 MW Nominal electricity production 894,046 MWh/year 894,046 MWh/year
Electricity generation and Capacity Factor Probability P50 P90 Gross capacity factor 61% 51% Gross electricity production 545,368MWh/year 452,655 MWh/year Topographic factor 101.90% 101.90% Array efficiency 96.00% 96.00% Electrical efficiency 96.00% 96.00% Availability 96.10% 96.10% Substation availability 99.00% 99.00% Icing and blade degradation 99.00% 99.00% Power curve 99.00% 99.00% Hysteresis 99.80% 99.80% Grid curtailment 100.00% 100.00% Net electricity production 476,613MWh/year 395,589MWh/year Net capacity factor 53% 44%
Technology Electricity Generation and Capacity Factor
Project area
Page 11
Introduction 4 Cost and Revenue Assumptions
Page 12
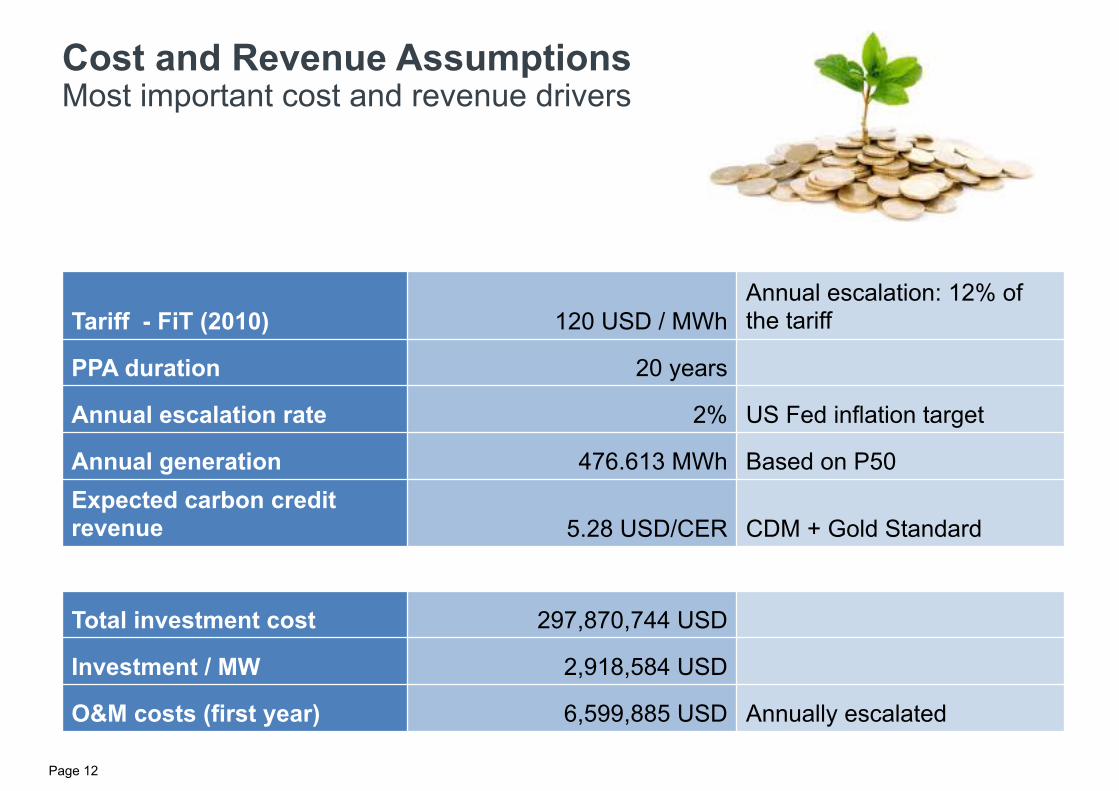
Cost and Revenue Assumptions Most important cost and revenue drivers
Tariff - FiT (2010) 120 USD / MWh Annual escalation: 12% of the tariff
PPA duration 20 years
Annual escalation rate 2% US Fed inflation target
Annual generation 476.613 MWh Based on P50 Expected carbon credit revenue 5.28 USD/CER CDM + Gold Standard
Cost and Revenue Assumptions Profit and losses – Taxes and depreciation
• 100% investment deduction allowance in the first year of operation • Losses to be carried forward • 30% Corporate tax rate • 20 year depreciation on hard costs, 5 year depreciation on soft costs
Page 15
Introduction 5 Proposed Financing Structure and Returns
Page 16
Proposed Financing Structure Your opportunity to SHARE(s) Growth
Selling price $ $70,362,678
Selling price $ Exclusive of
CERs $67,020,917
Taschner Green Climate
Investments Equity IRR
> 21.27 %
• Debt financing assumptions: • Interest rate: 8% annually • Term: 13 inclusive of 1 year grace period • USD based loan
70%
12%
18%
Proposed Financing Structure
Debt
CraOskills
Taschner Green Climate Investments
Page 17
Proposed Financing Structure Cash flows
Page 18
Proposed Financing Structure Project returns and debt service cover ratio
• Equity returns: Taschner Green Climate Investments
Page 19
Proposed Financing Structure Taschner Green Climate Investments returns
• Equity return – Taschner Green Climate Investments
Equity IRR 21.27 %
Equity IRR incl. carbon credit 21.40 %
• Sensitivity analysis – Equity IRR
• Net present value and M – Equity IRR
Page 20
Introduction 6 Risk Assessment
Page 21
Regulatory risk
Risk level: low § Increasing demand à markets secured
§ PPA signed à long-term offtaker secured - A World Bank credit guarantee (MIGA) issued in case of default of Kenya Power
§ Local politics favorable à government support secured
Risk level: low § Supportive local legislation, e.g. Energy Act 2006
§ Feed-in-Tariffs Policy on Wind, Biomass and Small-Hydro Resource Generated Electricity, 2008, 2010, 2012
§ “Kenya Vision 2030”
Market risk
Page 22
Political risk Risk level: medium
§ Kenya WTO member
§ Ease of doing business: Report by World Bank and IFC, Kenya ranked 109 out of 182 countries - Lack of infrastructure - Lack of human capacity - Corruption - Government inefficiencies - Security constraints
à Mitigated by involving a well-linked local project development company and international consultancies during the project development phase
Risk level: low § Currency fluctuations à not relevant as FiT being paid in USD, similar to loan currency and most O&M costs
§ Inflation in Kenya highly volatile à not very important as revenue being paid in USD § Tariff partially applicable to annual escalation
Exchange rate and inflation risk
Page 23
Resource risk Risk level: low-to-medium § Wind measured with 3 meteorological masts à always some risk à Experienced project development company Galetech Energy Services consulted for wind measurement and turbine layout (Irish based internationally focused renewable energy consultancy, other reference projects in Africa) – wind measured for 2 years and 20 year historic correlation applied for yield assessment
Risk level: low § Application of known, state-of-the-art turbine technology
§ Experienced turbine manufacturer (GE)
§ Turbine type selection based on onsite wind analysis
Technological risk
Page 24
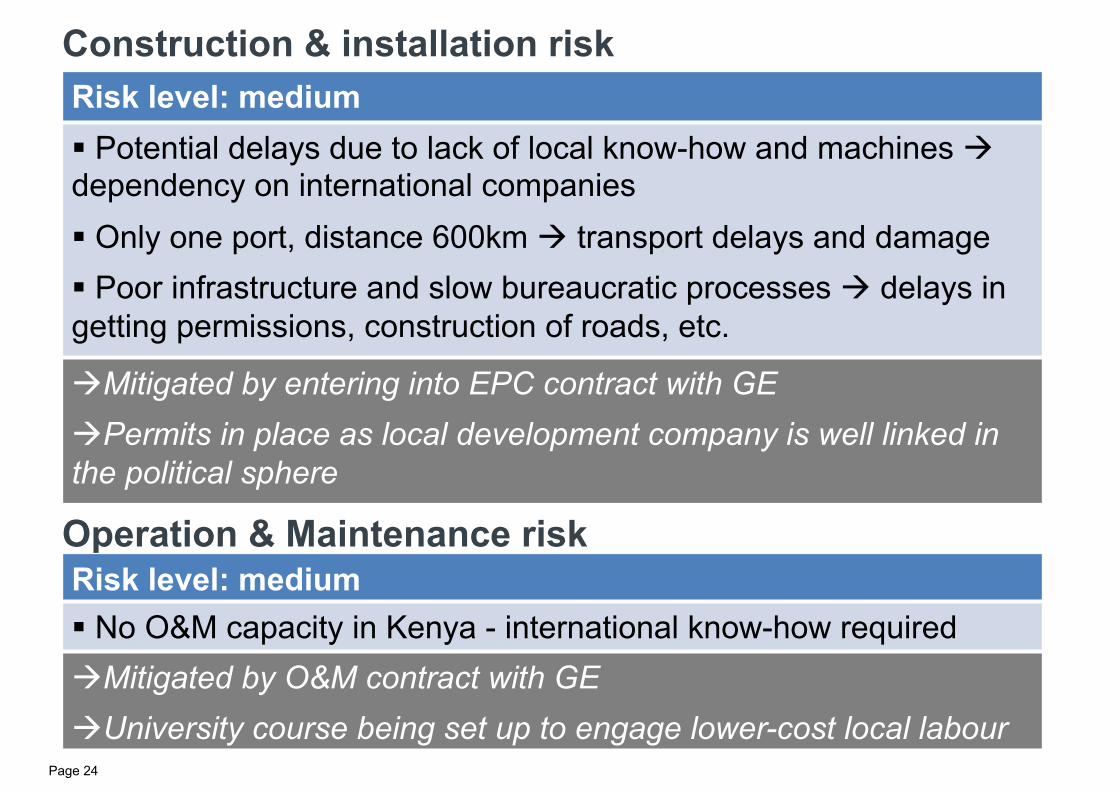
Construction & installation risk Risk level: medium
§ Potential delays due to lack of local know-how and machines à dependency on international companies § Only one port, distance 600km à transport delays and damage § Poor infrastructure and slow bureaucratic processes à delays in getting permissions, construction of roads, etc.
à Mitigated by entering into EPC contract with GE à Permits in place as local development company is well linked in the political sphere
Operation & Maintenance risk Risk level: medium § No O&M capacity in Kenya - international know-how required à Mitigated by O&M contract with GE à University course being set up to engage lower-cost local labour
Page 25
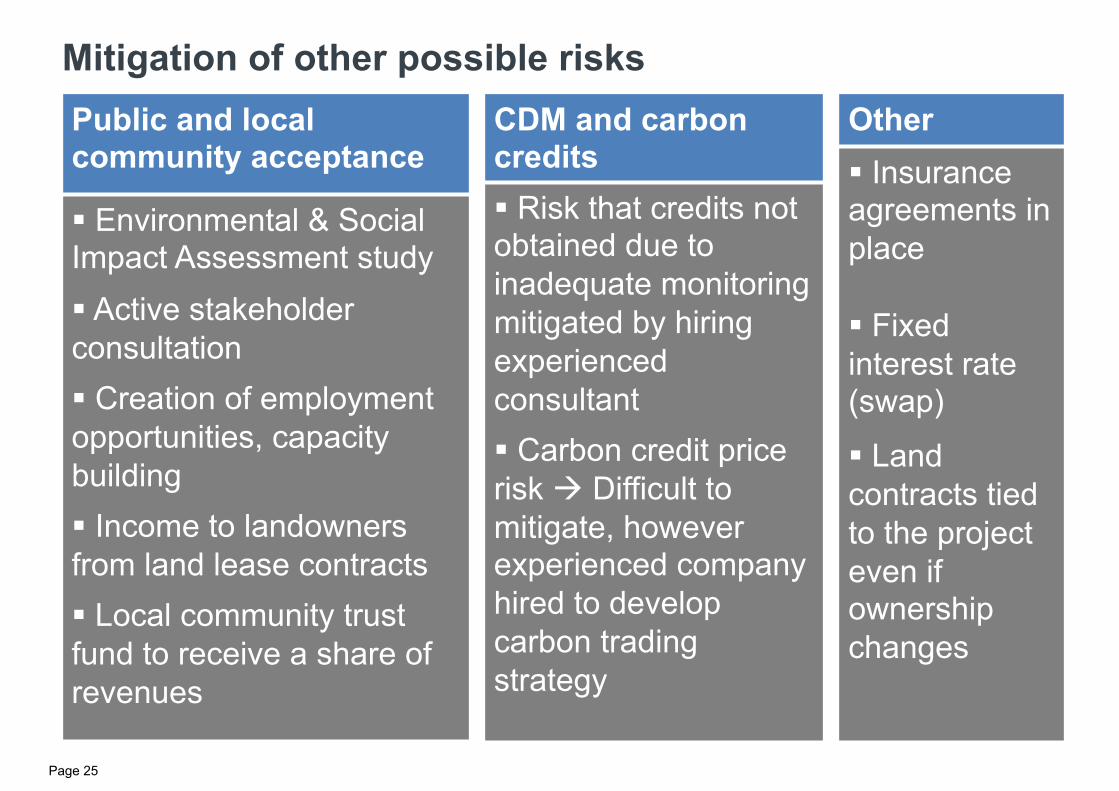
Mitigation of other possible risks Public and local community acceptance
§ Environmental & Social Impact Assessment study § Active stakeholder consultation § Creation of employment opportunities, capacity building § Income to landowners from land lease contracts § Local community trust fund to receive a share of revenues
CDM and carbon credits § Risk that credits not obtained due to inadequate monitoring mitigated by hiring experienced consultant § Carbon credit price risk à Difficult to mitigate, however experienced company hired to develop carbon trading strategy
Other § Insurance agreements in place § Fixed interest rate (swap)
§ Land contracts tied to the project even if ownership changes
Page 26
Introduction 7 Project Attractiveness
Page 27
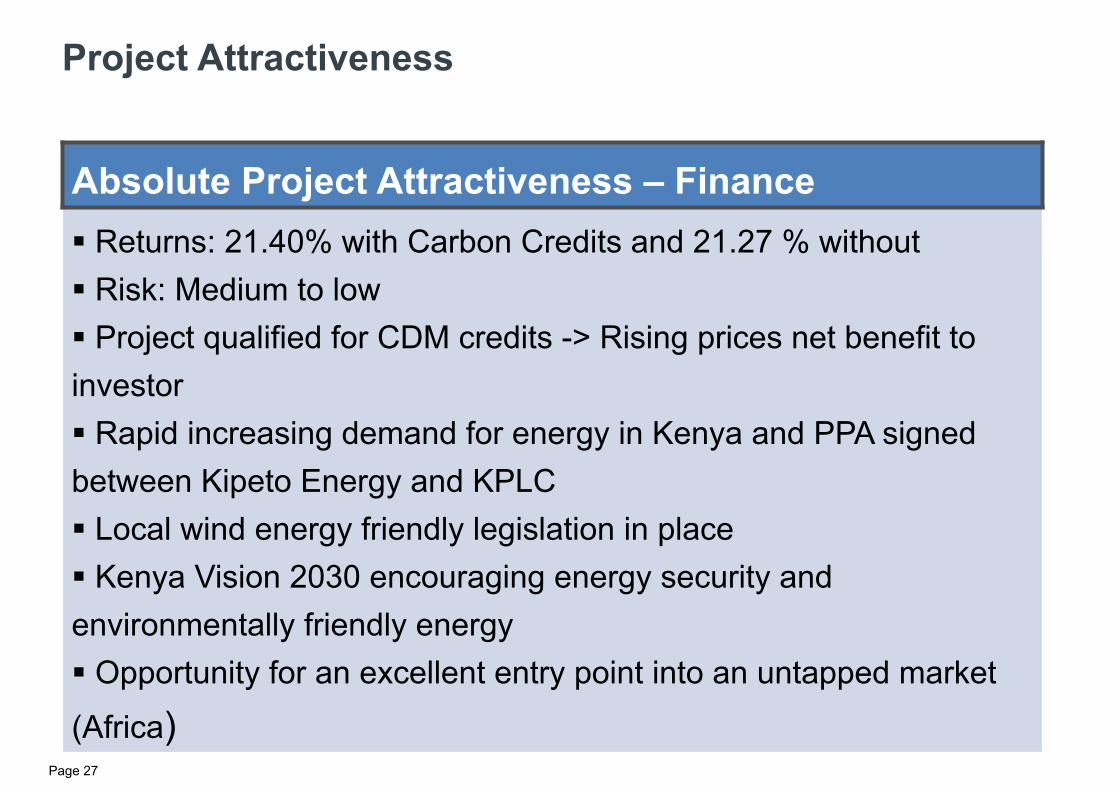
Absolute Project Attractiveness – Finance § Returns: 21.40% with Carbon Credits and 21.27 % without § Risk: Medium to low § Project qualified for CDM credits -> Rising prices net benefit to investor § Rapid increasing demand for energy in Kenya and PPA signed between Kipeto Energy and KPLC § Local wind energy friendly legislation in place § Kenya Vision 2030 encouraging energy security and environmentally friendly energy § Opportunity for an excellent entry point into an untapped market
(Africa)
Project Attractiveness
Page 28
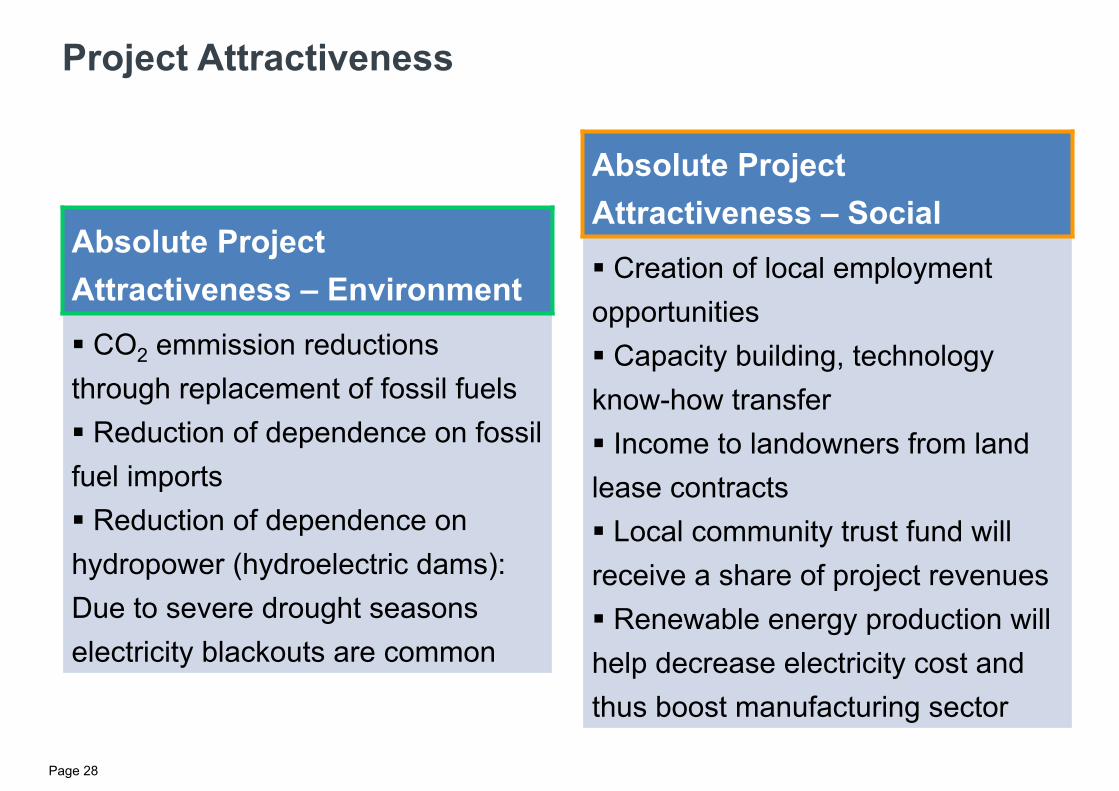
Absolute Project Attractiveness – Environment § CO2 emmission reductions through replacement of fossil fuels § Reduction of dependence on fossil fuel imports § Reduction of dependence on hydropower (hydroelectric dams): Due to severe drought seasons electricity blackouts are common
Project Attractiveness
Absolute Project Attractiveness – Social § Creation of local employment opportunities § Capacity building, technology know-how transfer § Income to landowners from land lease contracts § Local community trust fund will receive a share of project revenues § Renewable energy production will help decrease electricity cost and thus boost manufacturing sector
Page 29
Project Attractiveness
Page 30
Project Attractiveness
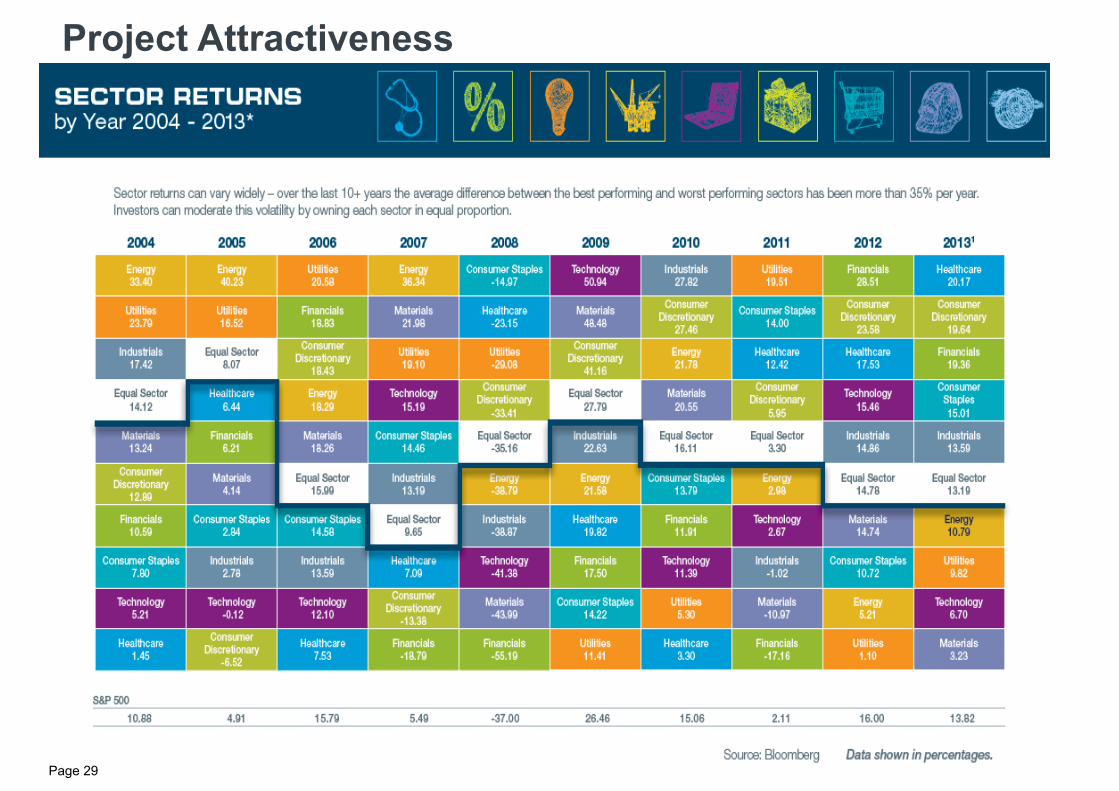
Relative Project Attractiveness § Investments in the finance market such as stocks can provide a relative high rate of return except that they are high risk (purchased BB stocks for $55.00 in 2009 and down to $10.00 a share) § Money in the bank will provide a safe investment option but low rate of return (3-5% maximum)
This investment is a low risk investment with a relative high rate of return and significant positive impacts on sustainable
development in Kenya
When can we sign the contract ?
Page 31
References Taschner, A. (2012). Risk and risk management in project finance. MBA Renewables Learning Material. Institute for Distance
Learning of the Beuth University of Applied Sciences Berlin. Tiedemann, A. (2012). Project Financing for Wind Energy. MBA Renewables Learning Material. Institute for Distance Learning of
the Beuth University of Applied Sciences Berlin. UNFCCC/CCNUCC (2012). Kipeto Wind Energy Project. Project Design Document Form for CDM Project Activities (F-CDM-PDD).
Retrieved on 29 August 2013 from http://cdm.unfccc.int/Projects/DB/JCI1355475722.72/view Ministry of Energy (2010). Feed-in-Tarrifs Policy on Wind, Biomass, Small-Hydro, Geothermal, Biogas and Solar Resource
Generated Electricity. Retrieved on 29 August 2013 from http://kerea.org/wp-content/uploads/2012/12/Feed-in-Tariff-Policy-2010.pdf
Ministry of Energy (2004). Sessional Paper No. 4 on Energy. Retrieved on 29 August 2013 from
http://www.renewableenergy.go.ke/downloads/policy-docs/sessional_paper_4_on_energy_2004.pdf Republic of Kenya (2011). Scaling-up Renewable Energy Program (SREP) – Investment Plan for Kenya. Retrieved on 29 August
2013 from http://www.climateinvestmentfunds.org/cif/sites/climateinvestmentfunds.org/files/Kenya%20IP_0.pdf GE Power and Water. Renewable Energy (2011). Introducing GE’s 1.6-100. Retrieved on 29 August 2013 from
Burnham, M and Gronewold, N (2010). Droughts Turn Out the Lights in Hydro-Dependent African Nation. New York Times, May
10, 2010. Retrieved on 2 September 2013 from http://www.nytimes.com/gwire/2010/05/10/10greenwire-droughts-turn-out-the-lights-in-hydro-dependen-40458.html?pagewanted=all
World Bank and IFC (2012). Doing business in a more transparent world. 200 p. Retrieved on 9 September 2013 from
References Greentechmedia (2013). “A Record Year for World Wind Power in 2012”. Retrieved on 9 September from http://www.greentechmedia.com/articles/read/A-Record-Year-for-World-Wind-Power-in-2012 STRATCO (2013). Determining Wind Speed. Stratco (Australia) Pty Limited. Retrieved on 29 August from http://stratco.com.au/
pdf/Brochures/other/Wind_Speed_Design_Guide.pdf IEEE PES Wind Plant Collector System Design Working Group (2009). Wind Power Plant Substation and Collector System
Redundancy, Reliability and Economics. University of Tennessee. Retrieved on 29 August from http://power.eecs.utk.edu/pubs/Fangxing_li_ieeepes2009_5.pdf
Kenya Power (2012). Annual Report and Financial Statements. Retrieved on 29 August from
Republic of Kenya, Ministry of Energy (2011). Updated Least Cost Power Development Plan. Retrieved on 29 August 2013 from http://www.renewableenergy.go.ke/downloads/studies/LCPDP-2011-2030-Study.pdf
http://www.bssa.org.uk/faq.php?id=26. Retrieved on 07 September 2013.
http://www.windenergie-im-binnenland.de/powercurve.html. Retrieved on 07 September 2013.
http://www.wind-energy-market.com/en/wind-turbines/big-plants/details/details/bp/ge-16-100/. Retrieved on 07 September 2013. http://www.sectorspdr.com/shared/pdf/spdr-periodic-table-web.pdf. Retrieved on 11 September 2013.
http://www.ge-energy.com/wind. Retrieved on 29 August 2013.