GEOPHYSICAL RESEARCH LETTERS, VOL. 15, NO. 1, PAGES 611-680, JULY 1988 , MAGNETOTELLURlC OBSERVATIONS ALONG THE LITHOPROBE SOUTHEASTERN CANADIAN CORDILLERAN TRANSECT AIM G. Jones 1 , Ron D. Kurtzt, Doug W. Oldenburg 2 , David E. Boerner 1 and Rob Ellis 2 Abstract. As part of the LITHOPROBE Southern Cordilleran Transect investigations, twenty-seven wide- band rnagnetotelluric (MT) responses were obtained along 150 km of the reflection seismic lines. The MT profile be- gins to the east on the Rocky Mountain Trench above au- tochthonous North American basement, traverses across the Purcell anticlinorium, the Kootenay Arc, the Nelson batholith, and ends on the east side of the Valhalla gneiss complex. Sites near Kootenay Lake respond to a major near- surface conductivity anomaly that is probably due to ei- ther graphitic schists or to an extension of the silver- bearing mineralization found further north. The short period «1 s) data from above the Nelson batholith in- dicate its thickness extent, whereas the long period (>1 s) data are highly complex and exhibit 3D regional fea- tures. Inversions of the data from the two sites on the Valhalla complex yield ID models with interfaces in elec- trical conductivity at depths that agree with an increase in the number of reflectors at 1=:::19 km, "the base of layered reflections" at 1=:::122 km, and the Moho at 1=:::135 km. EOCENE e':id aYENITE "ALIOe!N! ·U. CRET ACEOUS D ORTHOONl!ln MIO·CRETACEoul t ::: J GRANITE Introduction This letter presents the initial interpretation of a mag- netotelluric (MT) survey conducted across the eastern portion of the southern Canadian Cordillera. The survey is part of the multi disciplinary LITHOPROBE transect from the Rocky Mountain foreland thrust and fold belt to the compressional and extensional structures of the crys- talline interior of the orogen. Figure 1 illustrates the MT site locations, with the seismic lines and the gen- eralised geology from Cook et al. 1988), and shows that our profile goes om the Rocky Mountain Trench in the Rocky Mountain Belt to the east, to the Valhalla gneiss complex in the Omineca Crystalline Belt to the west. A cartoon sketch of the major seismic reflection results, based on Cook et al. (1988), is illustrated in Fig. 2, to- gether with the MT station locations. To the east, strat- ified rocks of the thrust and fold belt are detached from underlying autochthonous crystalline basement along a regional decollement at mid-crustal depths (10-25 km). These structures are interpreted to be truncated beneath JURA'SlC "; ?;"J ORANITE PRE "'O- JURA'"C MID-PROTEROZOtC TlA""N! o 20km LI __ ---J 1 o LOWER PALEOZOIC [lTIIJ U. PROTERO%OIC D Up,!" lII[] lOWER Fig. 1 Geology map of Southeastern British Columbia showing the locations of the LITHOPROBE seismic lines and the MT sites. Major Geological Features: VC: Valhalla Gneiss Complex; NB: Nelson Batholith; KA: Kootenay Arc; PA: Purcell Anticlinorium; RMT; Rocky Mountain Trench. Major faults: VSZ; Valkyr shear zone; SLF: Slocan Lake Fault; HLF: Hall Lake Fault; SMF: Saint Mary's Fault. Of major significance to our understanding of the cur- rent composition and state of the lower continental crust is that although for the Valhalla complex there are few reflections below 1=:::122 km the MT responses indicate that the zone is conducting. This is the only location known to the authors where the lower crust is seismically trans- parent but electrically conductive. 1 Geological Survey of Canada, Ontario 2 Department of Geophysics and Astronomy, University of British Columbia, Canada Copyright 1988 by the American Geophysical Union. Paper number 8L7327. 0094-8276/88/008L-7327$03.00 611 the Kootenay Arc by a major crustal-scale Eocene normal fault, the Slocan Lake fault (Parrish 1984), which delin- eates the eastern boundary of the Valhalla gneiss complex at this position. This fault may also define the eastern edge of the Canadian Cordilleran Regional conductor (see Gough 1986 and references therein). At the south-eastern end of seismic line 5, the upper crust is seismically trans- parent to about 4.0 s. Beneath this is a complex zone of reflections down to 1=:::1 8 s (1=:::122 km depth). Few reflections appear to exist in the depth range 22-35 km (8-12 s) and yet there are interpreted weak Moho reflections at 1=:::135 km at the western extremity of the line. Magnetotelluric Data and Preliminary Interpretation During late Summer 1987, remote reference MT mea- surements were made at the twenty-seven locations illus- trated in Fig. 1. In general, the data quality is very high
Transcript
GEOPHYSICAL RESEARCH LETTERS, VOL. 15, NO. 1, PAGES 611-680, JULY 1988
, MAGNETOTELLURlC OBSERVATIONS ALONG THE LITHOPROBE SOUTHEASTERN CANADIAN CORDILLERAN TRANSECT
AIM G. Jones1 , Ron D. Kurtzt, Doug W. Oldenburg2 , David E. Boerner1 and Rob Ellis2
Abstract. As part of the LITHOPROBE Southern Cordilleran Transect investigations, twenty-seven wideband rnagnetotelluric (MT) responses were obtained along 150 km of the reflection seismic lines. The MT profile begins to the east on the Rocky Mountain Trench above autochthonous North American basement, traverses across the Purcell anticlinorium, the Kootenay Arc, the Nelson batholith, and ends on the east side of the Valhalla gneiss complex.
Sites near Kootenay Lake respond to a major nearsurface conductivity anomaly that is probably due to either graphitic schists or to an extension of the silverbearing mineralization found further north. The short period «1 s) data from above the Nelson batholith indicate its thickness extent, whereas the long period (>1 s) data are highly complex and exhibit 3D regional features. Inversions of the data from the two sites on the Valhalla complex yield ID models with interfaces in electrical conductivity at depths that agree with an increase in the number of reflectors at 1=:::19 km, "the base of layered reflections" at 1=:::122 km, and the Moho at 1=:::135 km.
EOCENE
e':id aYENITE
"ALIOe!N! ·U.CRET ACEOUS
D ORTHOONl!ln
MIO·CRETACEoul
t ::: J GRANITE
Introduction
This letter presents the initial interpretation of a magnetotelluric (MT) survey conducted across the eastern portion of the southern Canadian Cordillera. The survey is part of the multi disciplinary LITHOPROBE transect from the Rocky Mountain foreland thrust and fold belt to the compressional and extensional structures of the crystalline interior of the orogen. Figure 1 illustrates the MT site locations, to~ther with the seismic lines and the generalised geology from Cook et al. 1988), and shows that our profile goes om the Rocky Mountain Trench in the Rocky Mountain Belt to the east, to the Valhalla gneiss complex in the Omineca Crystalline Belt to the west.
A cartoon sketch of the major seismic reflection results, based on Cook et al. (1988), is illustrated in Fig. 2, together with the MT station locations. To the east, stratified rocks of the thrust and fold belt are detached from underlying autochthonous crystalline basement along a regional decollement at mid-crustal depths (10-25 km). These structures are interpreted to be truncated beneath
JURA'SlC
";?;"J ORANITE PRE "'O- JURA'"C
~~"ETA'EDI"ENT MID-PROTEROZOtC
f :~;:,:··· l 'U.pI!CT TlA""N!
o 20km LI __ ---J1 o LOWER PALEOZOIC [lTIIJ U.PROTERO%OIC D Up,!" lII[] lOWER
Fig. 1 Geology map of Southeastern British Columbia showing the locations of the LITHOPROBE seismic lines and the MT sites. Major Geological Features: VC: Valhalla Gneiss Complex; NB: Nelson Batholith; KA: Kootenay Arc; PA: Purcell Anticlinorium; RMT; Rocky Mountain Trench. Major faults: VSZ; Valkyr shear zone; SLF: Slocan Lake Fault; HLF: Hall Lake Fault; SMF: Saint Mary's Fault.
Of major significance to our understanding of the current composition and state of the lower continental crust is that although for the Valhalla complex there are few reflections below 1=:::122 km the MT responses indicate that the zone is conducting. This is the only location known to the authors where the lower crust is seismically transparent but electrically conductive.
1 Geological Survey of Canada, Ontario 2 Department of Geophysics and Astronomy, University
of British Columbia, Canada
Copyright 1988 by the American Geophysical Union.
Paper number 8L7327. 0094-8276/88/008L-7327$03.00
611
the Kootenay Arc by a major crustal-scale Eocene normal fault, the Slocan Lake fault (Parrish 1984), which delineates the eastern boundary of the Valhalla gneiss complex at this position. This fault may also define the eastern edge of the Canadian Cordilleran Regional conductor (see Gough 1986 and references therein). At the south-eastern end of seismic line 5, the upper crust is seismically transparent to about 4.0 s. Beneath this is a complex zone of reflections down to 1=:::1 8 s (1=:::122 km depth). Few reflections appear to exist in the depth range 22-35 km (8-12 s) and yet there are interpreted weak Moho reflections at 1=:::135 km at the western extremity of the line.
Magnetotelluric Data and Preliminary Interpretation
During late Summer 1987, remote reference MT measurements were made at the twenty-seven locations illustrated in Fig. 1. In general, the data quality is very high
Fig. 2 Cartoon sketch of the major seismic results reported in Cook et al. (1987, 1988). The locations of the MT sites are indicated along the top. (For acronyms see caption to Fig. 1)
with standard errors <1 % over virtually the whole period range of 0.0026 - 1820 s.
In this initial interpretation we wish to minimize 2D and 3D effects in order to determine the major structures responsible for our observations. Therefore we concentrate on those electromagnetic induction parameters unaffected by static shift (Jones 1988) and which also are responsive to the gross structural information. These are the phases of the determinant of the MT impedance tensor (Berdichevski and Dmitriev 1976; Rane;anayaki 1984) and the geomagnetic depth sounding (G DS) transfer functions ("Parkinson arrows").
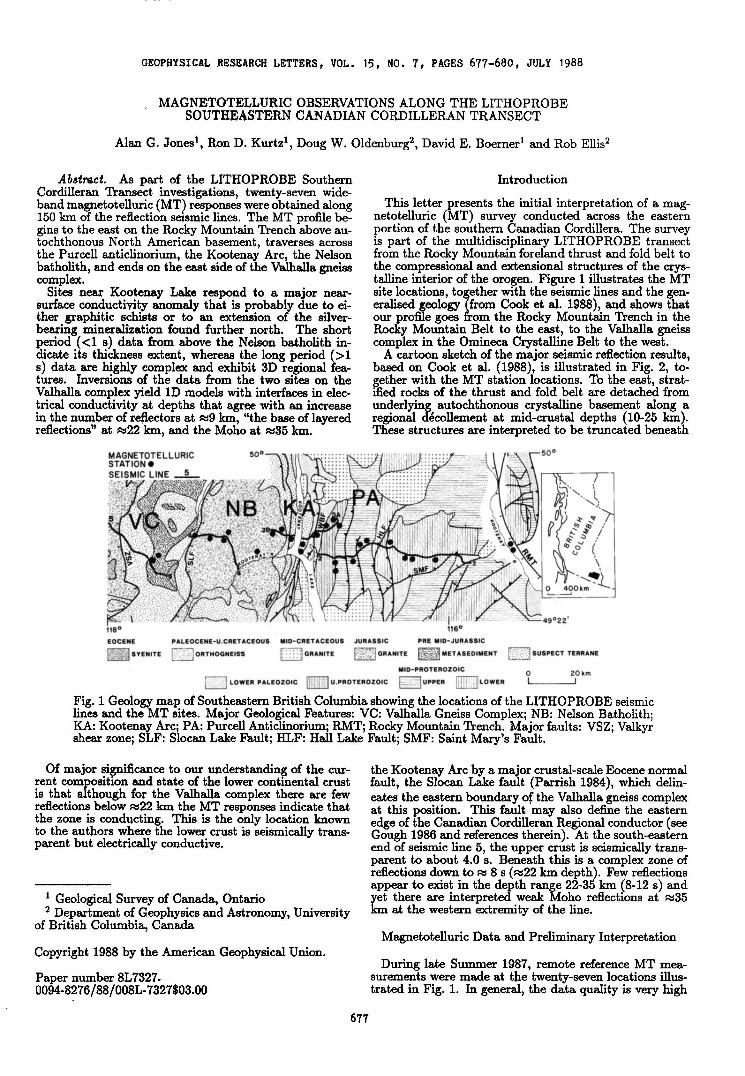
Figure 3 illustrates the determinant phase pseudosection for periods up to 1000 s. Blues indicate phases below 45° , signifying a transition from conductive to more resistive structure with depth, whereas reds indicate phases above 45° (a resistive to conductive transition with increasing depth). The major feature in this figure is the dramatic change in the character of the lower crust to the east and west sides of Kootenay Lake, as expressed by the difference in the long period (>1 s) determinant phases. Two other features are the change in character of the upper crust at short periods <1 s west of the Slocan Lake Fault, and at the location of Kootenay Lake.
Of major importance is that the long period (>10 s) phase response for the east-west telluric field, i.e., 4>,." for all sites situated on the Nelson batholith goes outSIde the -180° - -90° quadrant; this phase behaviour is typified by the response illustrated in Fig. 4. Although such phase behaviour has often been observed at individual sites, and is usually attributed to local near-surface distortions, it is uncommon for such strong 3D behaviour to be observed over a lare;e region; in this case the full extent of the batholith (50 km width). We attribute this behaviour to three-dimensionalityon a regional scale. However, to date numerical simulations of 3D structures have been unable to obtain phases outside the 0° - 90° (or -180° - -90° for 4>"z) range, and accordingly these data require novel interpretation which is beyond the scope of this initial paper.
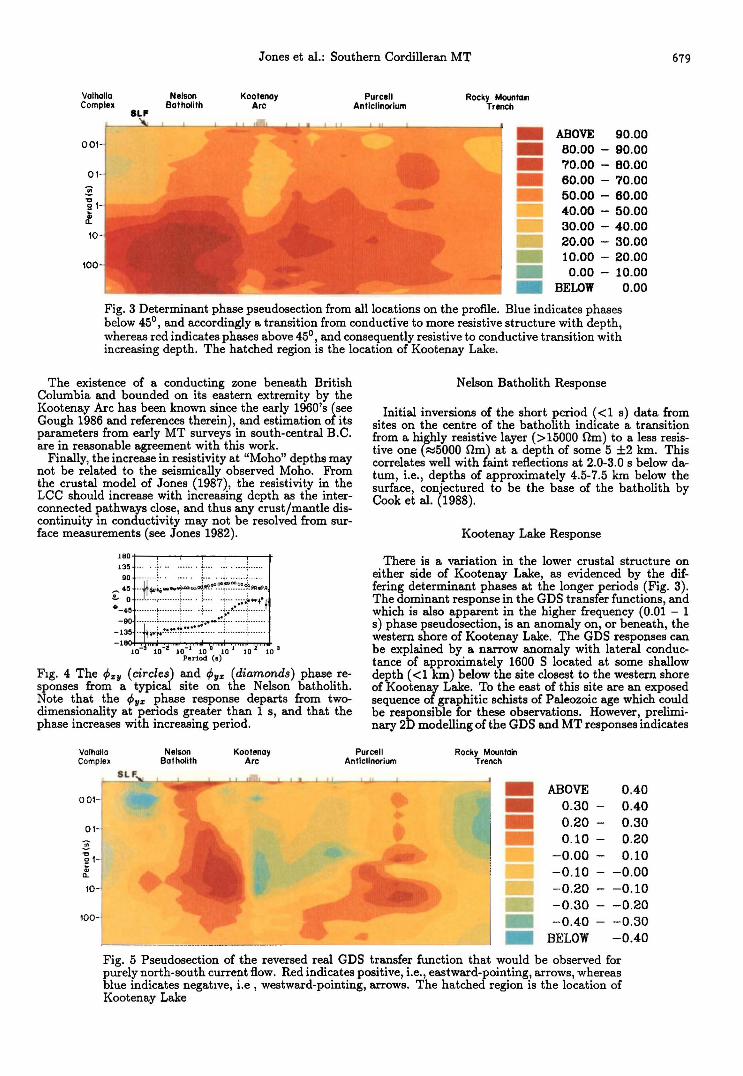
Illustrated in Fig. 5 is the real geomagnetic transfer function ("Parkinson arrow") pseudosection for an induced current flowing north-south. Red indicates positive, or east-pointing, arrows, whereas blue indicates negative, or west-pointing, arrows. These transfer functions have been reversed so that they generally point towards regions of enhanced conductivity (Jones 1986). They are dominated by a major anomaly beneath Kootenay Lake which maximally responds at R::!1 s.
Valhalla Gneiss Complex Response
The orthogonal MT responses from both sites on the Valhalla gneiss complex at the western end of the profile are similar and reasonably 1D to about 1 s period, and appear to be little affected by static shift. The determinant MT response from one of these sites is illustrated in Fig.
6, together with the best-fitting 1D layered-earth (Fischer and Le Quang 1981) and least-structure (Constable et al. 1987) models. Interpretation of the determinant average has met with considerable success in several recent analyses, e.g., Ranganayaki (1984), Sule and Hutton (1986), Hutton et al. (1987). The data illustrated in Fig. 6, with the exception of the single longest period, are consistent with the response from a 1D model according to the criteria of Parker (1980) and Weidelt (1986). The parameters of the layered-earth response are all well resolved, with the exception of the half-space resistivity, with standard errors of the interfaces being 410 ±60 m, 9 ±0.5 km, 19 ±1 km, and 29 ±3 km as determined from a singular value decomposition analysis (see, e.g., Jones 1982). Independent inversions of the two orthogonal responses (Pzy and Pyz) give two 1D models with the same structural shape as the determinant model of Fig. 6 with crustal interfaces within 20% of those given above. The 1D least-structure model, i.e., least gradient in log conductivity with log depth, exhibits "plateaus" such that below 1 km depth the model is very close to the layered earth model. This leads us to believe that the MT response is not due to a gradual variation in resistivity with depth, but that the resistivitydepth function has discrete "steps", i.e., narrow zones of large gradient in resistivity. Comparing the layered-earth model with the seismic reflection information for that location, we find the following correlations:-1. On the seismic data of Cook et al. (1988) beneath these
two stations there is a mid-crustal zone which is characterized by numerous reflectors. At the depth of the top of this reflecting zone, 9 km, there is an order of magnitude decrease in resistivity from some thousands of !lm to some hundreds of !lm.
2. The "base of layered reflections" in Cook et al.'s data occurs at a depth of R::!22 km, which compares well with a further decrease in resistivity to some tens of !lm.
3. The Moho is believed to be at R::!35 km, which correlates reasonably well with a moderate increase in resistivity.
Of major importance is the indication that beneath the Valhalla complex the lower crust is electrically conducting but seismically transparent. At many locations it has been shown that the lower continental crust (LCC) is both electrically conductive and seismically reflective (see the review by Jones 1987), and various suggestions have been made to account for this; the most prevalent being fluids in interconnected pathways. However, to our knowledge this is the only location to date where the LCC is conductive but transparent. The Eskdalemuir anomaly in the Southern Uplands of Scotland (see Jones 1987 and references therein) is the only other structure that is also conductive/transparent, but this is in the upper crust. Obviously, descriptions of the structure and composition of the LCC must be able to explain this dichotomy. The Cordillera is known to be anomalous in its seismic reflectivity; Klemperer (1987) excluded results from reflection studies in the Cordillera in his derivation of a relationship between continental heat flow and seismic reflectivity of the lower crust.
Fig. 3 Determinant phase pseudosection from all locations on the profile. Blue indicates phases below 45°, and accordingly a transition from conductive to more resistive structure with depth, whereas red indicates phases above 45°, and consequently resistive to conductive transition with increasing depth. The hatched region is the location of Kootenay Lake.
The existence of a conducting zone beneath British Columbia and bounded on its eastern extremity by the Kootenay Arc has been known since the early 1960's (see Gough 1986 and references therein), and estimation of its parameters from early MT surveys in south-central B.C. are in reasonable agreement with this work.
Finally, the increase in resistivity at "Moho" depths may not be related to the seismically observed Moho. From the crustal model of Jones (1987), the resistivity in the LCC should increase with increasing depth as the interconnected pathways close, and thus any crust/mantle discontinuity in conductivity may not be resolved from surface measurements (see Jones 1982).
Flg. 4 The t/>:Z:1I (circles) and t/>1I:Z: (diamonds) phase responses from a typical site on the Nelson batholith. Note that the t/>,,:z: phase response departs from twodimensionality at periods greater than 1 s, and that the phase increases with increasing period.
Valhallo
Nelson Batholith Response
Initial inversions of the short period «1 s) data from sites on the centre of the batholith indicate a transition from a highly resistive layer (>15000 {lm) to a less resistive one (~5000 {lm) at a depth of some 5 ±2 km. This correlates well with faint reSections at 2.0-3.0 s below datum, i.e., depths of approximately 4.5-7.5 km below the surface, conjectured to be the base of the batholith by Cook et al. (1988).
Kootenay Lake Response
There is a variation in the lower crustal structure on either side of Kootenay Lake, as evidenced by the differing determinant phases at the longer periods (Fig. 3). The dominant response in the GDS transfer functions, and which is also apparent in the higher frequency (0.01 - 1 s) phase pseudosection, is an anomaly on, or beneath, the western shore of Kootenay Lake. The GDS responses can be explained by a narrow anomaly with lateral conductance of approximately 1600 S located at some shallow depth «1 km) below the site closest to the western shore of Kootenar Lake. To the east of this site are an exposed sequence 0 graphitic schists of Paleozoic age which could be responsible for these observations. However, preliminary 2D modelling of the GDS and MT responses indicates
Fig. 5 Pseudosection of the reversed real GDS transfer function that would be observed for purely north-south current Sow. Red indicates positive, i.e., eastward-pointing, arrows, whereas blue indicates negatlve, i.e , westward-pointing, arrows. The hatched region is the location of Kootenay Lake
680 Jones et al.: Southern Cordilleran MT
~::~ 10'
10'
Fig. 6 MT responses observed at one of the most westerly sites located on the Valhalla gneiss complex, and two 1D models that explain the observations.
that the anomaly is below the surface rather than outcropping. An alternative explanation may be the alongstrike Badshot formation lead-zinc-silver disseminated deposits exposed further to the north on the eastern shore of Kootenay Lake in the Bluebell Mine at Riondel.
Purcell Anticlinorium Response
The data from the sites situated on the Purcell Anticlinorium are complex and their interpretation is beyond this letter. However, the determinant phase pseudosection indicates the existence of a conducting zone, with a vertical conductance less than that of the zone beneath the Valhalla complex, underlying the Purcell region at midcrustal depths. Inverting the determinant averages from sites that are reasonably alike yields a conducting zone beginning at :::=15 km. Although this depth must be corroborated by analysis of the static shift effects on these responses, we are confident from the phase data that the final model will include a conducting zone beginning in the mid-crust. It is interesting to note that this conductive zone appears to correlate with a prominent band of reflectors at 15-18 km, called "Near Basement Reflectors" by Cook et al. (1988), which are interpreted as directly overlying North American Basement.
Conclusions
We have illustrated that information from the LITHOPROBE MT data collocated with the seismic survey in southeastern British Columbia is adding important additional constraints to interpretation of the conditions and state of the crust in this region where autochthonous North America is juxtaposed against allochthonous exotic terranes. Certainly, our understanding of the causes of seismic reflectivity and of hi~h electrical conductivity must now permit a transparent/conductive LCC.
Acknowledgements. The high quality of the data collected is directly attributable to the excellent work undertaken for us by the PHOENIX Geophysics Ltd. (Toronto) crew of Bob Anderson, Gerry Graham and George EIliot. The authors wish to acknowledge Drs. J. Gupta, L.I<. Law, B. Milkereit and R. Parrish for their comments on an earlier version of this manuscript, and the two referees for their comments on the submitted version. Steve Constable, Bob Parker and Gaston Fischer are thanked for providing their computer codes.
Geological Survey of Canada Contribution 47987. LITHOPROBE publication no. 51.
References
Berdichevsky, M.N. and V.1. Dmitriev, Distortionofmagnetic and electric fields by near-surface lateral inhomogeneities, Acta Geodaet., Geophys. et Montanist. Acad. Sci. Hung., 11, 447-483,1976.
Cook, F.A. et al., LITHOPROBE seismic reflection structure of the southeastern Canadian Cordillera: initial results, Tectonics, 7, 157-180, 1988.
Constable, S.C. et al., Occam's inversion: a practical algorithm for generating smooth models from electromagnetic sounding data, Geophysics, 52, 289-300, 1987.
Fischer, G. and B.V. Le Quang, Topography and minimization of the standard deviation in onedimensional magnetotelluric modelling, Geophys. J.R. Astron. Soc., 67, 279-292, 1981.
Gough, DJ., Mantle upflow tectonics and the Canadian Cordillera, J. Geophys. Res., 91, 1909-1919, 1986.
Hutton, V.R.S. et al., Magnetotelluric soundings in the Canadian Rocky Mountains, Geophys. J.R. Astron. Soc., 90, 245-263, 1987.
Jones, A.G., On the electrical crust-mantle structure in Fennoscandia: no Moho and the asthenosphere revealed?, Geophys. J.R. Astron. Soc., 68, 371-388, 1982.
Jones, A.G., MT and reflection: an essential combination, Geophys. J.R. Astron. Soc., 89, 7-18, 1987.
Jones, A.G., Static shift of magnetotelluric data and its removal in a sedimentary basin environment, Geophysics, in press, 1988.
Klemperer, S., A relation between continental heat flow and the seismic reflectivity of the lower crust, J. Geophys., 61, 1-11, 1987.
Parker, R.L., The inverse problem of electromagnetic induction: existence and construction of solutions based on incomplete data, J. Geophys. Res., 85, 4421-4425,1980.
Parrish, R., Slocan Lake fault: a low angle fault zone bounding the Valhalla gneiss complex, Nelson map area, southern British Columbia, Geol. Surv. Canada, Paper 84-1A, 323-330, 1984.
Ranganayaki, R.P., An interpretive analysis of magnetotelluric data, Geophysics, 49, 1730-1748, 1984.
Sule, P.O. and Hutton, V.R.S., A broad-band magnetotelluric study in southeastern Scotland. Data acquisition, analysis and one-dimensional modelling, Ann. Geophysicae, 4, B, 145-156, 1986.
Weidelt, P., Discrete frequency inequalities for magnetotelluric impedances of one-dimensional conductors, J. Geophys., 59, 171-176, 1986.