Making Communities More Flood Resilient: The Role of Cost Benefit Analysis and Other Decision-Support Tools in Disaster Risk Reduction Zurich Flood Resilience Alliance September 9, 2014 Mechler, Reinhard (IIASA); Czajkowski, Jeffrey (Wharton); Kunreuther, Howard (Wharton); Michel-Kerjan, Erwann (Wharton); Botzen, Wouter (VU; Wharton); Keating, Adriana (IIASA); McQuistan, Colin (Practical Action); Cooper, Nathan (International Federation of the Red Cross -- IFRC); O’Donnell, Ian (IFRC)
Transcript
Making Communities More Flood Resilient: The Role of Cost Benefit Analysis and Other
Decision-Support Tools in Disaster Risk Reduction
Zurich Flood Resilience Alliance
September 9, 2014
Mechler, Reinhard (IIASA); Czajkowski, Jeffrey (Wharton); Kunreuther, Howard (Wharton); Michel-Kerjan, Erwann (Wharton); Botzen, Wouter (VU; Wharton); Keating, Adriana (IIASA); McQuistan, Colin (Practical Action); Cooper, Nathan (International Federation of the Red Cross -- IFRC); O’Donnell, Ian (IFRC)
i
Table of Contents
TABLE OF CONTENTS i LIST OF FIGURES III LIST OF TABLES IV EXECUTIVE SUMMARY 1 MAKING THE CASE FOR PRE-EVENT DISASTER RISK REDUCTION 1 APPLYING A DECISION-SUPPORT TOOLBOX TO THE WORK OF THE ZURICH FLOOD RESILIENCE ALLIANCE 9
1 POINT OF DEPARTURE: DECISION-MAKING TOOLS FOR FLOOD DISASTER RISK REDUCTION 11
2 DECISION TOOLS FOR FLOOD DRR: OVERVIEW 13
3 USING COST-BENEFIT ANALYSIS TO MAKE THE ECONOMIC CASE FOR FLOOD DISASTER RISK REDUCTION – OVERVIEW AND EVIDENCE 16
3.1 WHAT IS COST-BENEFIT ANALYSIS? 16 BOX 1: VARIOUS MEASURES OF ECONOMIC EFFICIENCY IN CBA 16 3.2 GENERAL SUMMARY OF FLOOD DRR CBA EVIDENCE 18 A COST-BENEFIT ANALYSIS OF PRACTICAL ACTION’S LIVELIHOOD CENTRED DISASTER RISK REDUCTION PROJECT IN NEPAL 21 3.3 SUMMARY OF EVIDENCE 22 BOX 2: THE U.S. MULTI-HAZARD MITIGATION COUNCIL (MMC) STUDY (2005) 25
4 OPPORTUNITIES AND CHALLENGES OF IMPLEMENTING A RISK-BASED CBA FOR FLOOD RESILIENCE 26
4.1.2 A RISK-BASED CBA METHODOLOGY FOR FLOOD DISASTER RISK REDUCTION 27
4.1.3 RISK ANALYSIS 27
BOX 3: ELEMENTS OF RISK ANALYSIS WITHIN A RESILIENCY FRAMEWORK 29
4.1.4 ASSESSING THE BENEFITS OF DRR 31
4.1.5 CALCULATION OF ECONOMIC EFFICIENCY 32 4.2 KEY CHALLENGES IN IMPLEMENTING A RISK-BASED CBA 32 4.2.1 PROPERLY ACCOUNTING FOR ISSUES AND ELEMENTS OF MEASURING RISK 32 BOX 4: APPLYING A RISK-BASED CBA METHODOLOGY WHEN DEALING WITH LIMITED HAZARD 34 4.2.2 VALUING INDIRECT AND INTANGIBLE (NON-MONETARY) LOSSES 34 4.2.3 ASSESSING PORTFOLIOS OF SYSTEMIC INTERVENTIONS VS. SINGLE INTERVENTIONS 36 4.2.4 ACCOUNTING FOR UNCERTAINTY 36 BOX 5: ADDRESSING KEY CHALLENGES THROUGH BASELINE AND COMMUNITY BASED RISK ASSESSMENTS - VULNERABILITY AND
CAPACITY ASSESSMENT (VCA) AND PARTICIPATORY CAPACITY AND VULNERABILITY ASSESSMENT (PCVA) 38 4.3 REVIEW OF THE ECONOMIC EVIDENCE FOR DRR FROM CBA IN LIGHT OF THE KEY CHALLENGES 39 4.3.1 COVERAGE OF KEY DRR RELATED CHALLENGES 40 4.4 OPPORTUNITIES AND CHALLENGES INHERENT TO CBA MORE BROADLY 42 BOX 6: FROM VULNERABILITY TO RESILIENCE (V2R) 44
ii
5 HIGHLIGHTING AND TACKLING THE CHALLENGES: ILLUSTRATIVE FLOOD RISK REDUCTION CBA CASE STUDIES 45
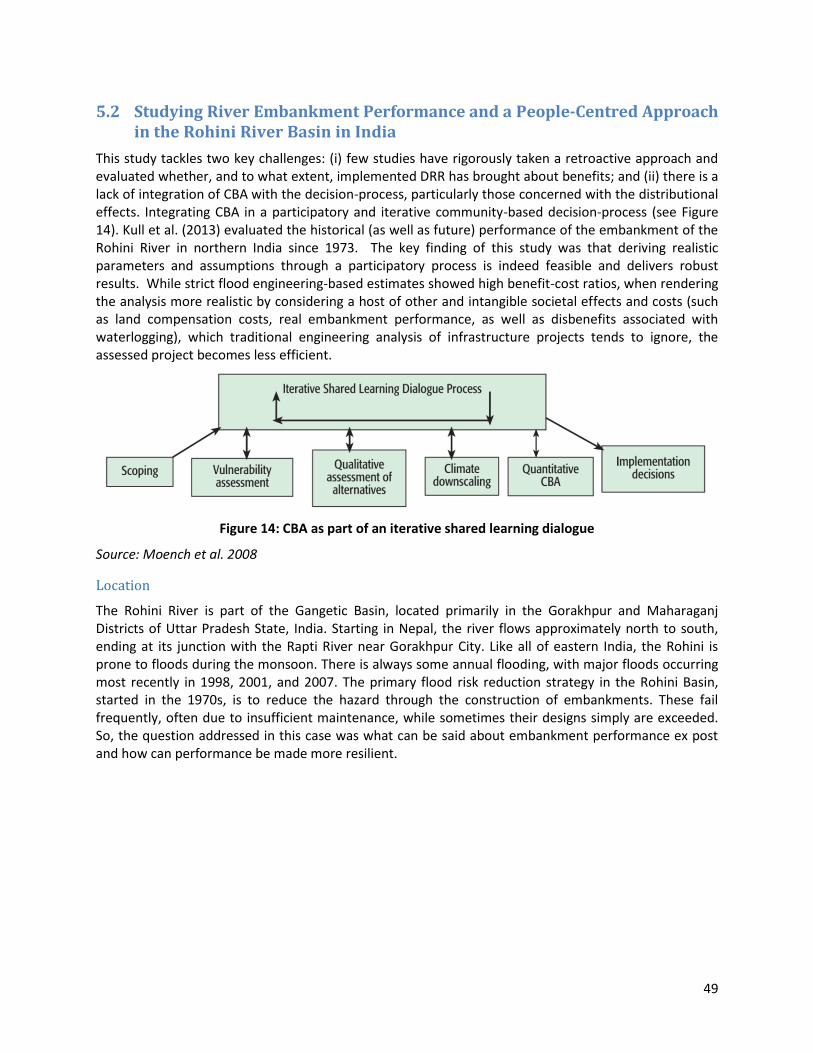
5.1 EVALUATING FLOOD RESILIENCE STRATEGIES FOR COASTAL MEGA-CITIES: ILLUSTRATION WITH NEW YORK CITY 45 5.2 STUDYING RIVER EMBANKMENT PERFORMANCE AND A PEOPLE-CENTRED APPROACH IN THE ROHINI RIVER BASIN 49
6 ACTUAL USAGE OF CBA FOR DECISION MAKING 53 BOX 7: INTUITIVE AND DELIBERATIVE THINKING AS INPUTS TO RISK REDUCTION 54
Figure 14: CBA as part of an iterative shared learning dialogue ................................................................ 49
Figure 15: Location of the Rohini River ....................................................................................................... 50
Figure 16: Evaluation of the performance of embankments along the Rohini River basin in India ........... 52
Figure 17: Using MCA to score achievement of buildings codes options against key criteria ................... 62
Figure 18: Risk reduction strategies in Ho Chi Minh City, and their robustness to increases in river levels and rainfall intensity. .................................................................................................................................. 64
Figure 19: Entry points for using decision-support tools for building flood resilience ............................... 68
iv
List of Tables
Table 1: Applicability of different decision-support tools for assessing flood risk reduction ...................... 9
Table 2: Applicability of different decision-support tools for assessing flood risk reduction .................... 13
Table 3: Resource and time commitment according to CBA goals ............................................................. 17
Table 4: CBA results of the three countries’ DRR programmes .................................................................. 19
Table 5: Summary results of the MMC (2005) study .................................................................................. 25
Table 6: Events, losses, and probabilities ................................................................................................... 30
Table 7: Categories and characteristics of disaster impacts ....................................................................... 35
Table 8: Studies on the CBA of flood risk reduction including coverage of key criteria ........................ 39-40
Table 9: Key benefits and potential for quantification in the Rohini case study ........................................ 51
Table 10: Cost effectiveness analysis of vector control micro-project in Antigua and Barbuda (FIU) ....... 58
Making the case for pre-event disaster risk reduction
Given the series of large-scale flood disasters that have occurred in recent years, there is a growing recognition among community leaders, businesses, insurers, governments and international donors of the need to invest in risk reduction measures before such events happen. Due to the costs of risk reduction measures, these actions need to be justified and as a result there is an increasing need to utilize decision-support tools, which can help to make the case for action to reduce disaster risks and build flood resilience when faced with limited resources.
Across stakeholders, the specific objectives from the use of decision-support tools include (i) demonstrating the efficiency of the action ex-ante (before the flood); (ii) aiding in the selection of a particular intervention in enhancing community flood resilience from a suite of possible options; (iii) helping communities make the right choice when faced with limited investments; (iv) demonstrating the benefits of donor funding of community flood resilience projects; and (v) monitoring the successes and weaknesses of past interventions to generate lessons learned for future work.
Typically, discussion on decision-support for disaster risk reduction (DRR) in floods (as well as for other hazards) has focused on cost-benefit analysis (CBA), however there are a number of other tools available to support decision-making. These include cost-effectiveness analysis (CEA), multi-criteria analysis (MCA) and robust-decision-making approaches (RDMA), which have been applied to similar problems, and can also be used to aid decision-making regarding flooding.
This white paper provides an overview of the opportunities and challenges of applying these different tools, and guides the reader to select among them. Selection depends on the desired objective, circumstances, data available, timeframe to perform analyses, level of detail, and other considerations. We first focus on the CBA decision-tool, as this has been the mainstay of research and implementation. We then go beyond CBA to consider the other techniques for prioritising DRR investments. While our analysis is specific to flood DRR actions, the conclusion are also applicable to other hazards.
The key findings arising from this white paper with relevance to research, policy and implementation of flood DRR decision-support tools, are:
1) Following a comprehensive review of the quantitative CBA flood DRR evidence, we find that flood DRR investments largely pay off, with an average of five dollars saved for every dollar spent through avoided and reduced losses;
2) Using CBA for flood risk reduction assessment should properly account for low-frequency, high-impact flood events, and also tackle key challenges such as intangible impacts;
3) Decision-making can be improved by using various decision support tools tailored to the desired outcomes and contexts.
This white paper is the foundation upon which the Zurich flood resilience alliance work on integration of a decision toolbox will proceed ‘on the ground,’ with established community-based risk assessment tools, in particular Vulnerability Capacity Assessments (VCA) or Participatory Capacity and Vulnerability Assessments (PCVA). Based on these findings we propose a way forward over the next several years on informing risk-based decision making as part of the alliance program.
2
Finding 1: CBA studies show that for every dollar spent on selected flood risk reduction measures, an
average of five dollars is saved through avoided and reduced losses
CBA, which is based on the economic efficiency criteria of maximizing benefits net of costs over time, has been the primary analytical approach used to provide quantitative information regarding the prioritisation of risk reduction solutions. Applying CBA from a risk-based perspective involves four main steps as shown in Figure 1: (1) estimating the amount of flood losses expected in the future under the status quo (without risk reduction); (2) identifying possible risk reduction measures and their associated costs; (3) estimating how much of the future flood losses would be reduced with such measures in place (that is, estimation of benefits); (4) calculating the economic efficiency of the measures. The measures are said to be economically efficient if benefits exceed costs.
Figure 1: Risk-based methodology for assessing the efficiency of disaster risk reduction
3
Based on a literature review that summarizes only those published studies from academia and practice for project evaluations and appraisals and which rigorously estimated disaster risk probabilistically, we summarize found (or identified) evidence for flood DRR. The studies demonstrate that investing in flood DRR can pay in many contexts and for many flood risk reduction interventions. This holds true for project appraisals that seek to understand whether an investment should be done, as well as project evaluations, that aim to identify whether the project indeed produced positive benefits over its lifetime. As shown in Figure 2, the majority of studies reported higher benefit-cost ratios, i.e., benefits exceeding costs, while showing variations around best estimates (lines around the dots).
Figure 2: Summary of key studies on the economic efficiency of investments in flood risk reduction
Note: The horizontal axis is fixed at 1, where benefits just equal costs, every point above the line thus indicates that projects exhibit larger benefits than costs.
Taking a simple average across all studies reviewed leads to a benefit-cost ratio for flood hazard close to 5; this means that for every one dollar spent on flood risk reduction, an average of five dollars is saved through avoided and reduced losses. Many of the highest economic returns exist for behavioural DRR strategies such as information and education, preparedness, forecasts and warning systems, and emergency response. Similarly, restoration of floodplains and flood proofing also demonstrate high economic returns. While there are instances where flood risk reduction measures analysed have not had benefits greater than costs, the available evidence reviewed suggests that it is most often possible to find an economically efficient risk reduction measure that can improve the protection of a given community against flood. Although the existing economic evidence for flood DRR appears strong, knowledge gaps and challenges remain.
4
Finding 2: A flood risk reduction assessment needs to properly account for high-impact, low-frequency
flood events, and also tackle key challenges such as intangible impacts
From Finding 1, we see that there are often significant economic outcomes in conducting a CBA of flood DRR interventions to assist in either their ex-ante implementation or to justify their investment ex-post. The analysis highlights that CBA can be a useful if a number of key challenges for conducting such a rigorous CBA are considered including: properly incorporating disaster risk arising from low-frequency, high-impact events; valuing indirect and intangible losses and distribution of both costs and benefits to different stakeholders in a community; including multiple hazards; assessing portfolios of systemic interventions vs. single interventions; and accounting for uncertainty and change over time.
Provide proper account of disaster risk
There has been a push towards undertaking CBA analysis from a probabilistic perspective, which involves gauging the uncertainty of flood event occurrences (and magnitudes) and their associated annual probabilities. For example, consider a 20-year return period event with annual probability of 5 percent, or a 100-year return period event with an annual probability of 1 percent. Implementing a rigorous probabilistic (i.e., risk-based) analysis is of considerable importance for two main reasons: (1) flood risk is inherently probabilistic (this means that looking only at one flood event does not capture the entire set of possible flood events the community might soon face and their respective return periods) and (2) flood risk reduction options are efficient for certain levels of risk but not necessarily for all (e.g., a certain option may reduce risk up to 50-year return periods, while risk financing (insurance) may best cover higher level risk (such as beyond 100 years)). Thus, a risk-based analysis is critical for determining the level of risk and whether DRR – instead of risk financing for example – is the appropriate course of action. As a standard tool, exceedance probability (EP) curves, exhibiting the probability that losses will be greater than a given level, are a key outcome of this risk-based methodology with the area under the curve representing the total expected annual damages. EP curves are utilized not only to understand the magnitude of future expected losses without DRR in place, but importantly, by how much these future losses can be expected to be reduced through the DRR intervention, for example for a flood impacted home with and without elevation. Graphically, the flood DRR shifts the EP curve to the left and therefore reduces the expected loss as depicted in Figure 3. Benefits from a particular flood resilience measure may affect different parts of an EP curve (low-end, mid-range or right-hand tail), as illustrated. In the selection of a particular intervention to enhance community flood resilience from a suite of possible options, this layering of risk is a significant factor to be considered.
5
possible EP curve
with mitigation measure
right - hand tail mid - range
Loss, L (in Dollars)
Exceed
an
ce p
ro
ba
bil
ity,
p
low - end
original EP curve
Figure 3: Exceedance probability (EP) curve showing potential benefits of disaster risk reduction. Note: The EP curve represents the probability that losses will be a given amount, and flood risk reduction
intervention shifts the EP curve to the left and therefore reduces the expected loss.
Even in developed countries, availability of good data is not guaranteed. In low-income countries, data availability and quality becomes a key challenge for comprehensively assessing disaster risk and the benefits of DRR. Gaps and uncertainties are related to the following issues and elements of measuring risk:
Hazard probability: In many settings, it can be difficult to obtain scientific information on how often a hazard such as a flood can be expected (frequency), and how large it might be (magnitude). Estimates can often be based on only a limited number of data points.
Assessing vulnerability: Vulnerability curves often do not exist and this information has to be generated, which is often fraught with complications.
Assessing exposure: The dynamics of population increase, urban expansion and increase of welfare should be accounted for. Fundamental changes in infrastructure, population and vulnerabilities over time mean that damage estimates from long past events are not relevant in today’s context.
In addition to issues with conducting baseline risk analysis, key gaps of particular importance in the flood resilience space have to do with proceeding from direct and tangible risk assessment to accounting for indirect and intangible effects. Furthermore, assessing portfolios of risk reduction and systemic intervention constitute frontiers of analysis.
Considering indirect effects and intangibles
In an ideal world, a comprehensive CBA should include all relevant social, economic and ecological impacts while at the same time distinguishing between reductions of the direct impacts from the shock itself such as loss of life and damages to (infra)structure, as well as indirect losses including increased morbidity due to lack of sanitation facilities, unemployment and reduced income due to business interruption, etc. Probabilistic risk assessment has focussed on direct, tangible impacts, less so on the
6
indirect and intangible effects, which are very important as demonstrated by the White Paper on Resilience. Especially in the developing world, where reportedly over 95% of deaths from natural hazards occur, how to address mortality and morbidity risks is a key consideration. The common approach to quantifying fatality is value of statistical life (VSL) estimates, typically based on projections of lost future earnings. However VSL estimates do not avoid value judgments and thus introduce substantial controversy. The same holds true for softer environmental and social values, such as existence values for environmental goods as well as cohesion of a social group or community.
Assessing portfolios of options and systemic interventions
While assessments of the economic efficiency of DRR may focus on hazard and risk-specific interventions, it may likely be the case that the best DRR interventions are comprised of a portfolio of interventions. What is more, these options may be integrated in broader developmental contexts, and depend on investments in systemic interventions in sectors such as education, health or infrastructure, which may bring about large DRR related benefits by building resilience.
Two case studies were recently carried out by the research team in different economic and geographic
contexts. These two examples illustrate the significant opportunities a risk-based CBA offers, while at
the same time tackling some of these key challenges.
Example 1: A comprehensive and spatially-detailed flood risk cost-benefit analysis on a metropolis:
Case study of the City of New York1
After Hurricane Sandy in 2012, which led to losses of nearly $80 billion, different flood risk reduction
strategies have been proposed for New York City by scientists, engineers, NGOs and policy makers.
Some structural measures (e.g. flood barriers) are effective in lowering the probability of the flood
hazard and protecting large parts of the city, but come at a very high initial investment cost (those
could cost as much as $20 billion to build, not accounting for annual maintenance cost over the life of
the structure). ‘Softer’ measures, such as introducing more stringent building codes, support current
initiatives to reduce exposure and vulnerability, and entail lower investment costs, but these changes
will not keep flood waters from entering the city. This case study, undertaken by Wharton and
focusing on storm surge flood hazard only, combines several strengths: (1) it is done for a large area
(the entire New York/New Jersey coastal area); (2) it covers residential, commercial, and industrial
assets as well as public infrastructure; (3) it builds on the most advanced technics of storm surge
simulation, which itself builds on the more recent modelling from hurricane science; it also builds on
the most recent flood vulnerability analyses (i.e., how asset are damaged by a flood); (4) it compares
several comprehensive, feasible flood protection options that have been discussed with the local
decision makers (i.e., the Mayor’s office); (5) it accounts for both direct and indirect losses; (6) since
CBA results are sensitive to the selected discount rate and uncertainties inherent to modelling, the
study provides transparent sensitivity analysis (i.e., varying parameters) and compare the results; and
(7) after all the CBAs were done under current climate conditions, the entire analysis was done again
1 Aerts, Botzen, Emanuel, Lin, de Moel and Michel-Kerjan (2014). Evaluating Flood Resilience Strategies for Coastal Megacities. Science, 344: 473-475.
7
for 2040 and 2080 climate and urban development scenarios since investment in flood protection can
last for several decades and must then account for future conditions The CBA results suggest that
flood risk reduction strategies for coastal cities should be flexible enough to allow for a change in
policy when more detailed and reliable information becomes available on, for example, rising sea
levels.
Example 2: A CBA analysis linked to participatory decision-making for flood-exposed farming
households: Case of Uttar Pradesh in Northern India.2
This study tackled two key challenges: estimating a broad array of direct and indirect, and tangible
and intangible impacts and measures; and a lack of integration of CBA within the decision-making
process. The study involved integrating CBA in a participatory and iterative community-based
decision-process evaluating the historical as well as future performance of Investments made to build
the embankment of the Rohini River in northern India. The study showed that deriving realistic and
relevant impact information has to be supported by a participatory process involving communities
that have been affected by floods and other hazards. It also demonstrated the value of taking such a
broad-based approach to improve the robustness of results. While strict flood engineering-based
estimates of direct, structural losses showed high benefit-cost ratios, when the stresses on the
community’s values were included in the analysis, the project became less efficient, and eventually
even inefficient (costs higher than benefits). The assessment took into account a host of tangible and
intangible effects on society, and related costs (such as land compensation costs, chance of
embankment failure, as well as disbenefits associated with waterlogging), which traditional
engineering analysis of infrastructure projects tends to ignore. This has important implications when
considering revisions to the design and implementation of the project so that any further investments
provide solid and comprehensive benefits to those to be protected by this flood protection project.
Overall then, it is possible to overcome some of the challenges associated with CBA by applying latest insights from science and application. The studies we reviewed mostly looked at risk probabilistically, -yet often relied on incomplete distributions of flood return periods or may only look at the annual average losses, the average across all possible flood events, which is not representative of high-level disasters, such as the 100 year event. Often, studies looked at portfolios of options rather than individual solutions. Indirect effects were also sometimes included. The consideration of intangibles remains a challenge for CBA, and systemic intervention methods are not yet really included, but this is the most difficult to tackle.
2 Kull, D., Mechler, R. Hochrainer-Stigler, S. (2013). Probabilistic Cost-Benefit Analysis of Disaster Risk Management in a Development Context. Disasters 37(3): 374-400.
8
Figure 4: Uptake of best practice of CBA for risk-based DRR studies
Finding 3: Decision-making can be improved by using various decision support tools tailored to the desired outcomes and contexts
Ultimately, economic efficiency underlying CBA is only one decision-making criterion of relevance for prioritizing DRR flood risk reduction investments. Decisions on investment to increase flood risk resilience are likely to be made based on a number of criteria, some of which are more or less transparent.
Criteria such as risk-effectiveness, robustness, equity and distributional concerns, and acceptability have been found to be key for deciding on implementing DRR projects. There are other decision support techniques such as cost-effectiveness analysis (CEA), multi-criteria analysis (MCA) and robust decision-making approaches (RDMA) that can be used to measure achievement of these criteria. These tools can be used to make a more comprehensive case for DRR. As a challenge, they do not lead to easily communicable metrics for presenting the results, such as benefit-cost ratios.
These decision-support tools are applicable for different objectives can be used to inform various types of decisions in many different contexts, including: Project appraisal; Evaluation; Informational/Advocacy study; and Iterative decision-making. Table 1 summarizes the key advantages, challenges and applicability of CBA, CEA, MCA and robust approaches. The table illustrates that no one tool is perfect for every situation. Each has its strengths and weaknesses and is suited to different decision-making contexts. We provide exemplary illustrations of the opportunities of each technique.
9
Applying a decision-support toolbox to the work of the Zurich flood resilience alliance
CBA and the other tools presented in this white paper are not simply for the selection or ex-post evaluation of flood DRR interventions. They all represent systematic decision-making processes used to identify and agree on the most important benefit and cost aspects amongst risk managers and key stakeholders. Specifically, part of the usefulness of these tools is the process of defining values, objectives, costs and benefits as part of a wider assessment and decision-making process that includes stakeholder participation; detailed participatory analysis of the factors contributing to flood risk and vulnerability; quantitative and qualitative methods for evaluating the impacts of flood disasters; and transparent and inclusive processes for qualitative and quantitative data collection and analysis. From a resilience-perspective, the utility of decision-support tools is strongly related to their use within a decision-making process. For example, in selecting the communities to work in it is imperative that a transparent, impartial, and consistent process be in place in order to minimize unwanted external influences in the community selection process.
Table 1: Applicability of different decision-support tools for assessing flood risk reduction
Tool Opportunities Challenges Typical Application
CBA Rigorous framework based on comparing costs with benefits
Need to monetize all benefits, difficulty in representing intangible impacts, such as value of life
Well-specified hard-resilience projects with economic benefits (e.g., flood risk prevention)
CEA Ambition level fixed, and only costs to be compared. Intangible benefits, particularly loss of life, do not need to be monetized
Ambition level needs to be fixed and agreed upon
Well-specified interventions with important intangible impacts, which should not be exceeded (loss of life, etc.)
MCA Consideration of multiple objectives and plural values
Subjective judgments required, which hinder replication
Multiple and systemic interventions involving plural values (e.g. investing in infrastructure and education)
Robust approaches
Address uncertainty and robustness
Technical and computing skills required
Projects with large uncertainties and long timeframes (context of climate change where flood return periods may become more uncertain)
Work of the Zurich flood resilience alliance will analyse how decision-making techniques discussed here integrate into existing community participatory approaches, such as the International Federation of the Red Cross (IFRC)’s Vulnerability Capacity Assessments (VCA), or Practical Action’s Participatory Capacity and Vulnerability Assessment (PCVA), in order to ensure the application of their systematic decision-making capabilities (best practice use of the tool for community based work). These participatory processes are completed in conjunction with the collection of secondary information to provide a
10
baseline of communities risk to different hazards and opportunities to build on communities’ existing capacities to reduce risks and strengthen resilience.
In particular, linking to VCA/PCVA provides a good entry point for collecting baseline information and monitoring data on risk and resilience, as well as for gleaning community views on potential costs and benefits. Furthermore, the impact-driven and quantitative thinking needed for decision-making can be leveraged through VCA/PCVA to enable communities to gain additional perspective on their own vulnerability and risk, especially around current and future risk, and to develop innovative approaches to community- based DRR and resilience. Existing CBA evidence on the returns to the various flood DRR interventions could be useful in this regard to potentially highlight underinvested areas. Further, once the VCA/PCVA process has started in the selected communities, CBAs can potentially provide two useful roles: (1) to assist in the decision-making process on which DRR strategies to employ based upon the economic efficiency criterion, or (2) to provide insight into the intangible benefits of the various DRR interventions to assist in prioritizing them for a further quantitative analysis. Then, from an ex-post perspective, CBA is useful in monitoring just how effective the various DRR interventions have been given their implementation. Further understanding, developing, applying and testing the role in community case study contexts of a decision toolbox comprised of the different tools (not just CBA) along this entire flood DRR implementation spectrum will be the focus of future work of the flood resilience alliance.
Figure 5 gives examples of how CBA and other tools might be built into Zurich flood resilience alliance decision-support processes, beginning from site/community selection and extending to monitoring and evaluation of the implemented flood DRR interventions. Importantly, this work will also directly connect with complementary work being done by all the partners of the Zurich flood resilience alliance on operationalizing community flood resilience (see also White Paper on Resilience).
Figure 5: Entry points for using decision-support tools for building flood resilience
11
1 Point of Departure: Decision-making Tools for Flood Disaster Risk Reduction
Disaster risk reduction (DRR) practitioners and analysts emphasize the need for prioritising pre-disaster actions in lieu of the predominant focus on post-disaster provision of relief and reconstruction assistance. Yet, there is a significant bias towards reliance on ex-post response rather than ex-ante risk reduction. Despite wide acceptance that disasters can be mitigated by risk reduction actions, very little money is actually spent reducing risk before an event strikes (Benson and Twigg 2004; Hoff et al. 2003; Kellett and Caravani 2013; see also alliance white paper on resilience: Keating et al. 2014)
One explanation for the bias towards ex-post aid is the limited information regarding the comprehensive quantitative and qualitative benefits and costs of DRR. Even information on the cost of the DRR project, which can be perceived to be trivial to obtain, is in reality a significant challenge.
Efficiency considerations of DRR are of growing importance for many decision makers in the private and public sectors (including insurers, governments, international financial institutions, donors, NGOs). Increased scrutiny of DRR investments is leading to a growing demand for information about the relative economic efficiency (i.e., benefits greater than the costs) of DRR options. Given that DRR tends to have a limited budget, there is a clear need to direct investments towards risk reduction strategies that have high economic returns.
Decision-making Tools for DRR
A number of decision support techniques can be applied to the challenge of assessing the quantitative and qualitative costs and benefits. These tools include cost-benefit analysis (CBA), cost-effectiveness analysis (CEA), multi-criteria analysis (MCA), and robust decision-making approaches (RDMA) among others. While all of these techniques have their pros and cons, and have been widely implemented to salient issues pertaining to sustainability, CBA has been the dominant tool in use in OECD countries to prioritize physical flood risk prevention.
CBA can provide quantitative information regarding the prioritisation of various risk reduction strategies based on the notion of economic efficiency. It has been used for investment purposes in many infrastructure projects around the world. However, while CBA has been applied to the assessment of DRR, this is mostly done to justify an investment project that has already been approved (World Bank 2010). Furthermore, it is typically conducted short of best-practices, with an important issue being the lack of taking a proper risk-based approach given the probabilistic nature of the disaster data. Despite its ex-post investment justification use, there has been relatively little public reflection regarding CBA’s capacities for evaluating investment in disaster risk reduction measures.
Aside from CBA, there has also been very little reflection and use of other decision-tools (one exception is Benson and Twigg 2004). As argued by the alliance’s white paper on community resilience, a holistic understanding of disaster risk reduction – including the notion of resilience – is a useful entry point for furthering the discourse. Building disaster resilience requires a shift in emphasis from infrastructure-based options that lend themselves easily to cost and benefit considerations, to a strong focus on using preparedness and systemic interventions. A resilience approach will likely require more quantitative information which is not readily available. Furthermore, it emphasizes other criteria beyond cost-efficiency as of key importance. Given this, other tools such as cost-effectiveness analysis, multi-criteria analysis and robust decision-making approaches deserve more attention. The various tools available to support decision-making on DRR investments beyond CBA are based on evaluative criteria beyond
12
economic efficiency. There is need for more discussion regarding the use of these other decision-support techniques for DRR, partially to address some of CBA’s limitations.
The contribution of the Zurich Flood Resilience Alliance
Work over the next several years on decision-making under risk as part of the Zurich flood resilience alliance program will address decision-making for policy makers, analysts and implementers and further develop and apply methodologies in order to quantify the relative costs and benefits of flood protection measures, implementable at the appropriate level. These developed methodologies in turn will help inform the action partners, potential donors, governments, as well as individuals and businesses at risk, on the costs and benefits of investing in flood risk reduction with an emphasis on pre-event investment.
Our vision is that the methodology will embrace different decision-support tools (such as CBA, cost-efficiency analysis, and robust decision-making approaches) to effectively and robustly inform the various decision-making contexts and actors on how to evaluate flood risk reduction projects. We will also discuss the appropriate contexts for each tool, how robust specific measures are, the technical capacity and data that needs to be developed to apply such a methodology, etc.
Importantly, this work will also directly connect with complementary work being done by all the partners of the Zurich flood resilience alliance on operationalizing community flood resilience. Assessments for examining options to reduce, prepare for, and finance disaster risk, may be used as heuristic decision support tools to aid practitioners and policymakers to comprehensively categorise, organise, assess and present information on the various costs and benefits of specified DRR strategies. Input on the economic efficiency of interventions coupled with information on values and preferences is crucial. Decision-making processes on flood DRR will benefit from an organisation’s iterative decision-making, instead of directly leading to the prioritisation of any one intervention.
To lay the basis for the work, this report presents the existing evidence regarding the benefits of pre-event disaster risk reduction to enhance resilience and explores the methodological underpinnings including key omissions and challenges. The report starts with a focus on CBA decision-tool, as this has been the mainstay of research and implementation; specifically, we review the pros and cons as well as the evidence of applying CBA for DRR, and suggest how risk can be better brought into this tool.
We then consider other key techniques for prioritising DRR investments, such as CEA, MCA and RDMA, for which we provide salient examples. We end with suggestions for applying the decision-tools to on-going alliance work including case studies.
This white paper is organized as follows: Section 2 provides an overview of the four main decision support tools for flood DRR; Section 3 reviews and summarizes the CBA-specific evidence for implementation of flood risk reduction measures; Section 4 presents opportunities and key challenges for applying a risk-based CBA technique to flood DRR. Section 5 is a detailed discussion of how the key challenges are tackled in practice, and how CBA informs decision-making (Section 6). More detail on the other decision-making tools for prioritizing investments into DRR are the subject of Section 7, before we provide concluding remarks and options for moving forward.
13
2 Decision Tools for Flood DRR: Overview
Among the variety of tools for project appraisal and evaluation which are receiving interest in the climate adaptation field are (1) cost-benefit analysis (CBA), (2) cost-effectiveness analysis (CEA), (3) multi-criteria analysis (MCA) and (4) robust decision-making approaches RDMA (see Mechler 2012).
Table 2 summarizes the key advantages, challenges and applicability of CBA, CEA, MCA and robust approaches. The table and discussion below illustrate that no one tool is perfect for every situation. Each tool has its strengths and weaknesses and is suited to different decision-making contexts.
Table 2: Applicability of different decision-support tools for assessing flood risk reduction
Tool Opportunities Challenges Typical Application
CBA Rigorous framework based on comparing costs with benefits
Need to monetize all benefits, difficulty in representing intangible impacts, such as value of life
Well-specified hard-resilience projects with economic benefits (e.g., flood risk prevention)
CEA Ambition level fixed, and only costs to be compared. Intangible benefits, particularly loss of life, do not need to be monetized
Ambition level needs to be fixed and agreed upon
Well-specified interventions with important intangible impacts, which should not be exceeded (loss of life, etc.)
MCA Consideration of multiple objectives and plural values
Subjective judgments required, which hinder replication
Multiple and systemic interventions involving plural values (e.g. investing in infrastructure and education)
Robust approaches
Address uncertainty and robustness
Technical and computing skills required
Projects with large uncertainties and long timeframes (context of climate change where flood return periods may become more uncertain)
Building on internal rate of return (profit) reasoning used in the corporate sector to compare the private benefits and costs of an investment, CBA has been used by governments as a major decision support tool to organize and calculate the societal costs and benefits, inherent trade-offs and economic efficiency of public policy, programme or project (Brent 1998).
Cost-effectiveness analysis (CEA) is a special case of CBA used to identify least-cost options to meet a certain, pre-defined target or policy objective. It may also be used when the benefits of alternative options are assumed to be similar enough that only costs need to be calculated. Therefore, a CEA is
14
designed to identify the least cost project, where project costs themselves are typically the main cost category. CEA does not require the quantification of benefits because they are assumed to be fixed or decided upon beforehand as a target (such as reducing disaster fatalities and losses to a certain level or maintaining a particular environmental flow). Thus, an advantage of CEA is that there is no need to monetize benefits of DRR, which are often hampered by uncertainty, such as reduced flood risk and health impacts of floods.
Another decision-support approach is multi-criteria analysis (MCA). The distinguishing feature of MCAs is that their objective is to provide a structured way of comparing costs and benefits which are expressed in different terms. This is in contrast to CBA and CEA where the first step is to monetize all costs and benefits so they may be compared. While a CBA might monetize lives and environmental values in order that they may be compared “apples to apples,” an MCA provides a structured way of weighing options with all costs and benefits in their original units, be they quantitative or qualitative judgements. In this way, an MCA may be referred to as a ‘qualitative CBA’ – it attempts to optimize benefits over costs (as in CBA), but without the requirement that all costs and benefits be quantified.
A broad theory of decision processes relating to robustness, or robust decision-making approaches (RDMA), have been receiving increasing emphasis recently, particularly in the context of climate change adaptation. This set of approaches comprises quantitative as well as qualitative methodologies. They draw focus away from optimal decisions (such as supported with CBA) and aim to identify options with minimum regret, that is, minimal losses in benefits in a chosen strategy where some parameters have been uncertain.
When are the different tools applicable, and what are the decisions they can support? Figure 6 suggests a structured method for identifying a suitable decision-support technique:
If there is a clear and single objective, such as maximizing economic efficiency, impacts are measurable and benefits are indicated in monetary terms, CBA is a useful tool to consider.
If benefits are framed only qualitatively, then CEA can be of good value. If other objectives, such as equity, legitimacy and acceptability enhance economic considerations,
MCA approaches are to be considered with stakeholders or, if the impacts are not properly indicated in quantitative terms, with expert panels.
If a project has long time frames and high uncertainty, then robust methods could be explored.
15
Figure 6: Decision tree for identifying a suitable decision-support technique
Source: Modified from UN Framework Convention on Climate Change, Assessing the Costs and Benefits of Adaptation Option, 2011.
This decision tree is a starting point for introducing conventional wisdom on the applicability of CBA, CEA and MCA. However it captures only the traditional decision tools, neglecting the importance of deep uncertainty and the applicability of robust decision making approaches. Furthermore, it does not consider the importance of how well the approach fits with the cultural context of a community (acceptability) and how community-based interventions involving diverse stakeholders are decided (process).
Yes to all No
Yes No
Yes No
16
3 Using Cost-Benefit Analysis to Make the Economic Case for Flood Disaster Risk Reduction – Overview and Evidence
3.1 What is Cost-Benefit Analysis?
CBA is a framework that supports transparent, coherent, and systematic decision-making based upon a common monetized yardstick that can be used to evaluate various risk reduction strategies (Czajkowski, Kunreuther and Michel-Kerjan 2012; Mechler and Islam 2013).
In a CBA, all costs and benefits accruing over time are monetized and aggregated so that they can be compared using the common economic efficiency criterion. In general, if the stream of discounted benefits exceeds the stream of discounted costs (i.e., positive net present value economic benefits) a proposal is considered ’economically efficient’ (see Box 1). When comparing options (including the ‘do-nothing’ option), the option with the highest net present value is considered optimal. In this way, CBA is similar to rate-of-return assessment methods undertaken by firms to assess whether or not an investment is profitable. However, unlike private investment decisions, CBA is often used to estimate the overall profit (benefit) to society, and thus whether or not social welfare is maximized in regard to the policy. One of CBA’s main strengths is its explicit and rigorous accounting of benefits and costs within a common metric – money.
Box 1: Various Measures of Economic Efficiency in CBA • Net present value (NPV): costs and benefits arising over time are discounted through a fixed discount rate and the difference taken, which is the net discounted benefit in a given year. The sum of the net discounted benefits is the NPV. If the NPV is positive (benefits exceed costs), then a project is considered desirable. • The benefit-cost ratio is a variant of the NPV. The total discounted benefits are divided by the total discounted costs. By definition, a benefit-cost ratio of 1 means that the expected discounted benefit of implementing the mitigation equals its cost. Any measure where a benefit-cost ratio is greater (less) than 1 is considered to be cost-effective (not cost effective) and should (should not) be implemented as the benefits exceed (do not exceed) costs and a project thus adds (does not add) value to society. • Economic Rate of Return (ERR): Whereas the former two criteria use a fixed discount rate, this criterion calculates the interest rate internally, which is considered the return of the given project. A project is rated desirable if this ERR surpasses an average return on public capital determined beforehand.
Resource and time commitments, as well as expertise required differ significantly for these different purposes and applications. The scope of the costs and benefits considered often depends on who the CBA users are, for instance if the end user is a development bank or a municipality, between small-scale and large-scale investments, the planning of physical infrastructure or capacity building measures. At a very early stage, it is critical to achieve consensus among the involved parties on the scope and breadth of the CBA to be undertaken. It is also important to know who is undertaking the CBA analysis. The head of development of a city, for instance, will have a different view than an engineering firm. CBA has also different levels of resource and time commitment depending on how in-depth the analysis is to be (see Table 3).
17
Table 3: Resource and time commitment according to CBA goals
Goal Purpose Resource and time commitment
Project appraisal Detailed evaluation of accepting, modifying or rejecting a project, often by singling out the most efficient measure among alternatives
+++
Evaluation Ex-post evaluation of a project after completion ++
Informational study Provide a broad overview of costs and benefits +
Source: Mechler (2005)
Here we provide in the context of flood DRR the four main steps for conducting CBA from a risk-based perspective (see Grossi and Kunreuther 2005; Mechler 2005).
1. Risk analysis: The flood risk under the status quo (without risk reduction) has to be estimated. This entails estimating and combining hazard(s), exposure and vulnerability to estimate risk.
2. Identification of risk reduction measures and associated costs: Potential flood risk reduction projects and alternatives can be identified and the costs, both up front and ongoing, measured.
3. Analysis of risk reduction: As disaster risk is a downside risk, benefits are the risks avoided. The core benefits generated by investments in disaster risk reduction are reductions in future impacts and losses, such as reduced average annual losses.
4. Calculation of economic efficiency: Economic efficiency is assessed by comparing benefits and costs using different metrics, for instance the number of years the risk reduction measure or the asset at risk will exist (which in turn requires decisions on the discount rate used to make values comparable over time).
18
Figure 7: Risk-based methodology for conducting CBA of disaster risk reduction
Source: Mechler (2005)
We provide more details on these four steps in Section 4. In addition to determining the best option using economic efficiency as the criterion, one also must consider CBA through a societal lens by considering how losses are distributed, as they relate to the impact of the different alternatives on the affected parties.
3.2 General Summary of Flood DRR CBA Evidence
CBA has been widely used for many purposes and applications (see, e.g., Dasgupta and Pearce 1978; World Bank 2010; Michel-Kerjan et al. 2012; Mechler 2012; Czajkowski, Kunreuther and Michel-Kerjan 2013). In the United States, CBA of flood control projects was mandated by Congress under the 1936 Flood Control Act and has been used for evaluation of risk reduction projects since the 1950s. It has, in effect, been standard practice for more than half a century for organizations such as the U.S. Federal Emergency Management Agency (FEMA) and the U.S. Army Corps of Engineers. To many U.S. (government) decision makers, economic efficiency has been a very important aspect when devising disaster-related policies. It may even be said that in the United States, cost-benefit considerations have “at times dominated the policy debate on natural hazards,” although it remains unclear to what extent decisions have been rigorously based on this tool (Burby 1991). The UK government’s Department for Environment, Food and Rural Affairs (DEFRA) and the World Bank also generally advocate the use of CBA for projects and policies including those related to disaster risk reduction (see, e.g., Ministry of Agriculture 2001; Penning-Rowsell et al. 1992). Lately, the development cooperation context has moved to the forefront due to interest by international financial institutions, donors and NGOs to gauge the economic efficiency of their interventions.
19
As NGOs are picking up on decision-support and conducted analysis, two descriptive examples of CBA application in the DRR realm as applied by the Zurich flood resilience alliance partners, International Federation of the Red Cross (IFRC) and Practical Action (PA) may be illustrative of applications performed and experiences gained. In both cases, the DRR activities were found to be mostly economically efficient, evaluated from an ex-post perspective, although these analyses did not apply the four step risk-based procedure we outline in Section 3.1.
IFRC Experience
To better understand the economic efficiency of community-based DRR, as well as the use of CBA for community-based DRR in the Red Cross Red Crescent context, the IFRC and some of its member National Societies implemented three case studies between 2008 and 2010 on three separate DRR programmes in Nepal, the Philippine and Sudan.
Table 4 lists the results of the case-study CBAs in those countries, reported as the benefit–cost ratio. The analysis periods were selected based on actual programme start dates, foreseen project life spans and data limitations. The resulting benefit–cost ratios ranged from less than 1 to more than 25. Most results were substantially above 1.0, meaning that the community-based DRR programme and activities can be considered economically efficient.
Table 4: CBA results of the three countries’ DRR programmes
Source: IFRC/RC 2010
20
All three case studies produced lessons and recommendations for the use of CBA in community-based DRR programs.
A primary recommendation is that extensive, in-depth CBA should not be applied across-the-board to all Red Cross Red Crescent community-based DRR programming. An attempt to do so would be neither realistic nor useful given the cost and time commitments required. Rather, community-based DRR programmes should be selected for extensive CBA studies based on their implementation timeframes, data availability, the scope of the programme, the relevance and applicability of CBA to support decision making, and the opportunity to develop reference CBA values for common types of DRR interventions. At the same time more qualitative, easier-to-implement approaches to comparing intervention options could likely be implemented across-the-board by the Red Cross Red Crescent drawing on the alternative methodologies described in other parts of this paper.
For the Red Cross Red Crescent it is also essential to capture distributional aspects of interventions. CBA generally treats the beneficiaries of a project as a homogenous group, whether it is a single community, all communities in a region, or an entire country. It therefore tends not to account for differences in the distribution of costs and benefits. If within a targeted community certain people benefit or perceive to benefit less than others, CBA does not capture this quantitatively. For the Red Cross, which is focused on serving the most vulnerable, any CBA must be complemented by methodologies that consider how costs and benefits are distributed.
CBA for community-based DRR is additionally challenging in that the main benefit of community-based DRR is a reduction of disaster losses, which can be very difficult to measure and which often accrue over long-term periods further complicating the issue of distribution of costs and benefits mentioned above. Often baseline data on losses does not exist, or due to changing disaster patterns driven by such processes as climate change, past experiences cannot be considered relevant for current and future conditions. Better information and rigorous, but easy-to-use models for calculating potential disaster losses are needed.
21
A Cost-Benefit Analysis of Practical Action’s Livelihood- Centred Disaster Risk Reduction Project in Nepal
Practical Action undertook a retrospective study to gather evidence on the cost-effectiveness of the Livelihoods Centred Disaster Risk Reduction (LCDRR) approach adopted for a flood vulnerable community development project in Nepal. The objectives of the project were to improve the socio-economic status of communities vulnerable to natural disasters, and to enhance the capacity of stakeholders at different levels to adopt a livelihood-centred approach to disaster risk reduction, by integrating what is known about natural hazards into their livelihood strategies.
The study applied the analytic framework of social cost-benefit analysis (SCBA), which provides a quantitative monetary estimate of
the overall net welfare benefits attributable to the project activities as well as an estimate of the economic benefit-cost ratio of the overall project (Willenbockel 2011).
The overall benefit-cost ratio ranged from 1.13 to 1.45, while under moderately optimistic assumptions the estimated benefit cost ratio rises to 2.04. These figures were based on a very cautious and conservative evidence-based evaluation of the project benefits and excluded a range of potential ancillary gains for which the project documentation provides anecdotal evidence. Such unaccounted additional benefits include the reduction of losses from landslides, environmental improvements associated with tree plantations and other measures aimed at the reduction of slash and burn agriculture, as well as the health impact and social benefits associated with the improvements in food security and diversification of diets.
However, none of the estimates take into account that the frequency of extreme weather events in the form of both droughts and floods is expected to increase due to climate change, and that correspondingly the benefits of investments in irrigation and flood protection infrastructure are likely to increase. Given the current state of climate science, projections of the impact of climate change on precipitation patterns, flood and drought risks at local scales remain highly uncertain. In the presence of this uncertainty a focus on ‘no-regret’ measures that foster the resilience of communities under any future climate is advised. The LCDRR approach with its emphasis on community-level activities which increase livelihood opportunities and reduce vulnerability appears very appropriate in this respect.
These findings indicate that the livelihood-centred approach to disaster risk reduction adopted in this project resulted in a significant net contribution to the economic welfare of the target communities and delivered value for money.
22
3.3 Summary of Evidence
In order to provide a more comprehensive overview of the CBA applications with regard to flood DRR, we summarize the evidence found for 27 studies in terms of key results. Overall, these evaluations demonstrate that investing in DRR can pay in many contexts and for many interventions and hazards. The large majority of studies reported exhibited benefit-cost ratios larger than 1, positive net present values and high economic rates of returns. However, a few studies also calculated that some interventions did not provide positive net values (Kull et al. 2008; Hochrainer-Stigler et al. 2010; Venton et al. 2010; ECA 2009; ERN-AL 2010).
Our review differentiates between ex-ante appraisal and ex-post evaluations. While it is very difficult to generalize, it may be said that a global average of the benefit-cost ratios across interventions, regions and hazards may be around 4 with some important outliers. This statement is based on the review of all available estimates in the literature, as well as the MMC (2005) study.
Taking a simple average across all studies reviewed3 would lead to a benefit-cost ratio of 3.7, with average ranges for earthquake and wind hazards close to 3, flood hazard close to 5, and drought (one study only) around 2. Except for flood risk, the estimates rely on very few observations. Overall, they are rather similar to the MMC study results with risk reduction benefit-cost ratios for flood risk reduction broadly similar, with lower values for wind, and with higher estimates for seismic hazards.
3 In total, of the studies reviewed, 27 estimates were considered based on whether B/C ratios were calculated and a risk-based approach was pursued. Two studies, MMC (2005) and Hochrainer-Stigler et al. (2010), offered a range of estimates.
23
Figure 8: Results for flood risk reduction in terms of benefit-cost ratios – Evaluations and Appraisals
Note: Results displayed here show best estimates (or averages) (dots) and ranges of benefit-cost ratios (lines). The horizontal axis is fixed at 1, where benefits equal costs. Every point above the line thus indicates that the projects exhibit larger benefits than costs.
Source: Updated based on Mechler (2012)
Based on a similar dataset and review, Hawley et al. (2012) summarize a number of flood DRR CBAs and classify results by the type of risk reduction strategy undertaken as well as where in the watershed the mitigation was implemented. The specific flood DRR strategies summarized fall into one of three main categories: (1) Structural and Non-structural – levees, dams, diversions and channel improvements, flood gates, restoration of floodplain, detention basins; (2) Exposure and Property Modification – zoning and land-use planning, voluntary purchase, building codes and regulation, house elevation, other flood-proofing; and (3) Behavioural – information and education, preparedness, forecasts and warning systems, emergency response.
Watershed locations also fall into one of three main geographic classifications: (1) Deltaic – point at which the river reaches the sea; (2) Central – areas defined by a gradual slope of the terrain where the transporting capacity of the river has slowed significantly and leading to deposition; and (3) Upper – areas where the gradient is high and increased velocity leads to quicker flow streams and high erosion rates.
Their analysis of existing economic returns from flood DRR (where benefit-cost ratios were determined) illustrate that many of the highest economic returns exist for behavioural DRR strategies as well as restoration of floodplains and flood proofing. Figure 9 provides a summary of their findings by Hawley et al. 2012.
24
Figure 9: Benefit-cost ratios by strategy type
Source: Hawley et al. 2012
Although there is evidence that exposure reduction and behavioural response modification DRR strategies have some of the highest benefit-cost ratios, these are typically the least utilized strategies in general and by watershed locations. Comparing results across studies with very different methodological designs is difficult, so it is useful to also compare the findings of the MMC (2005) study, which took a consistent approach across all the hazards and cases analysed in the U.S. context (see Box 2). This large and comprehensive study was mandated by the U.S. Senate to gauge the returns on the benefits of federal hazard mitigation grants. In retrospective analysis, investments in more than 5,400 disaster risk reduction programs in the United States, including the retrofit of buildings against seismic, windstorm and flood risk, amounting overall to US$3.5 billion, were estimated to have led to a discounted net present value of societal benefits of US$14 billion overall. Thus, on average, every dollar spent by the U.S. Federal Emergency Management Agency (FEMA) on risk reduction can be attributed with having provided the country about $4 in future benefits (MMC 2005; see Box 2).
When considering these broad summary estimates, there are a number of caveats to keep in mind. The evidence base compiled here using estimates of benefit-cost ratios is limited at a relatively small number of studies with most evidence reported for flood risk. Variation is considerable. A few studies, of which some do not use ranges for representing results, exhibit very high values of up to 17, and estimated ranges stretch from nearly 0 to 50 for the benefit-cost ratio. Concerning applicability, while these numbers may have some appeal for policymakers suggesting DRR can indeed pay back, this does not mean that it automatically does. Whether DRR leads to positive and large returns depends, on
25
project design, context and choices regarding DRR interventions. In fact, a few evaluation studies show that some projects may not have been economically efficient or barely so. As well, methodological depth and choices vary significantly across studies, with some studies going into more detail than others. We now proceed to discussing these choices by way of the best-practice criteria and challenges identified before.
Box 2: The U.S. Multi-hazard Mitigation Council (MMC) Study (2005) Mandated by the U.S. Senate to better understand the benefits of risk reduction investments, the Federal Emergency Management Agency (FEMA) commissioned the Multihazard Mitigation Council (MMC) of the National Institute of Building Sciences (NIBS) to perform a study on the costs and benefits of DRR using CBA.
Carried out by an interdisciplinary team of more than 30 experts, the study comprised two elements: (i) a benefit-cost analysis of FEMA post disaster grants given to affected communities to build future resilience, and (ii) quantitative and qualitative research on the impacts of the grants in sample communities. The benefit-cost analysis of the future savings from FEMA mitigation grants, $3.5 billion which were given to states and communities over the years 1993 to 2003, examined a sample of 357 of 5,479 grants. The MMC review based its benefit estimates of the reduced impacts across seismic risk, windstorm (hurricane and tornado) and flood risk on the comprehensive HAZUS risk model. The review estimated a substantial number of impacts as follows:
Reduced direct property damage (e.g., buildings, contents, bridges, pipelines);
Reduced direct business interruption loss (e.g., damaged industrial, commercial, and retail facilities);
Reduced indirect business interruption loss (e.g., ordinary economic ripple effects);
Reduced other nonmarket damage (e.g., historic sites);
Reduced societal losses (casualties, homelessness); and
Reduced need for emergency response (e.g., ambulance service, fire protection). An estimate for the sample of 357 grants was scaled up leading to a total discounted present value of $14 billion in terms of societal benefits, which overall would mean a benefit-cost ratio of about 4. There is important variation across hazard, interventions and locations. Importantly, work funded by these grants was divided into projects building hard resilience (hazard-proofing or relocating buildings, lifelines and infrastructures, improving drainage systems and land conditions), as well as process-based activities leading to stimulating soft resilience by means of hazards, vulnerability, and risk assessments, planning, raising awareness and strengthening institutions. The study also estimated the present value of potential annual savings of FEMA to the U.S. Treasury alone due to an annual budget investment on these grants of $265 million to amount to $967 million, which leads to an average benefit-cost ratio of fiscal benefits only of 3.7. In general, flood risk exhibited highest returns, as flooding is more frequent than wind and earthquake risk. Results were crosschecked and indicated in terms of ranges. A very few of the grants for earthquake and wind risk did not produce positive net returns (or benefit-cost ratios larger than 1), while some interventions such as for wind risk produced very large effects –benefit-cost ratios in the range of 50 (See Table 5).
Table 5: Summary results of the MMC (2005) study
Hazard Average Benefit-cost Ratio
Average Benefit-cost Ratio Project
Average Benefit-cost Ratio Process
Range of estimates overall
Earthquake 1.5 1.4 2.5 0-4.0
Wind 3.9 4.7 1.7 0.05-50
Flood 5.0 5.1 1.3 1.3-7.6
Average 4.0
Source: MMC 2005
26
4 Opportunities and Challenges of Implementing a Risk-based CBA for Flood Resilience
There are significant economic opportunities involved in conducting a CBA of flood DRR interventions to assist in either their ex-ante implementation or to justify their investment ex-post. However, there are also challenges in using CBA for a valid economic assessment of flood DRR from a risk-based perspective. Here we proceed to lay out key issues in a rigorous risk-based CBA application. With the proper prioritization, some of challenges associated with flood DRR CBA –such as the complexities involved in estimating risk and the benefits of risk reduction measures - can be overcome; guidance manuals and reports lay out methodologies, which can be applied (Penning-Rowsell et al. 1992; Benson and Twigg 2004; Mechler 2005; Czajkowski, Kunreuther and Michel-Kerjan 2012).
4.1 Implementing a Risk-Based CBA Methodology
4.1.1 Probabilistic Risk
Disaster risk is probabilistic in nature; DRR options are efficient for certain levels of risk but not necessarily for all. Thus a risk based analysis is critical for determining the level of risk and whether DRR, rather than risk financing for example, is the appropriate course of action.
While many events (sickness, stock market fluctuations, business default) are probabilistic, they often can be fairly well approximated by average values (means or the expectation) based on utilizing normal distributions, except in cases where the tails of the distributions are fat. For example, the large financial crises of the previous decades have brought with them recognition that there is need to consider the tails (extremes). Clearly, for disaster risk this is very important, as disasters by nature are ’non-normal’ events because of their low-probability, high-impact character.
Analysing risk and the benefits of reducing risk in a risk-based/probabilistic framework, as opposed to an expected-losses framework, makes an important difference. Costs, which can be divided into investment and maintenance costs are deterministic, that is, they arise for sure and often early on in the process. Benefits, created due to the savings in terms of avoided direct and indirect losses, on the other hand are probabilistic and arise only in case of disaster events occurring. This is to say, that in most of the cases (years) where there are (fortunately) no disasters, no benefits arise from risk reduction projects. Thus, the viability of such a project is tied very closely to the expectation of the occurrence of disasters.4 As a consequence, for disasters that occur relatively rarely (e.g., extreme floods), benefits are smaller because they are averaged over many years, and it may be more difficult to secure investment funds than for more frequent events. If the probabilistic nature of the risks and benefits is not taken into account, benefits can be overestimated, which seems to occur frequently.
DRR options relate to risk as well, and are differentially efficient for certain so called ‘layers of risk.’ In general, for the low- to medium-loss risk layers aggregating events that happen relatively frequently, prevention is likely more economically efficient than insurance in reducing burdens. The reason is that
4 This would not be the case for DRR projects that generate benefits regardless of whether a disaster occurs, for example, the use of bio-dykes to protect from floods. They deliver improved flood resilience and provide resources such as fuel wood and bamboo or rattan fencing materials regardless of whether a flood occurs.
27
the costs of prevention often increase disproportionately with the severity of the consequences. Moreover, individuals and governments are generally better able to finance lower-consequence events from their own means, for instance, savings or calamity reserve funds, and often with the help of international assistance. The opposite is generally the case for costly risk-financing instruments, including insurance. Catastrophe insurance premiums fluctuate widely and are often substantially higher than the pure risk premium (average expected loss), mainly because the insurer’s cost of capital is reflected in the premium. For this reason, it may be advisable to use those risk-financing instruments mainly for lower probability hazards. Finally, most individuals and governments find it too costly to reduce risk or insure against very extreme risks occurring less frequently than, say, every 500 years, and for such infrequent risk, often little risk reduction planning occurs (Kunreuther and Michel-Kerjan 2011).
4.1.2 A Risk-Based CBA Methodology for Flood Disaster Risk Reduction
From a risk-based perspective, the economic efficiency of risk reduction measures for reducing losses from a disaster can be estimated by first constructing exceedance probability (EP) curves (see below for more details) -- the probability that losses will be greater than a given level -- for an impacted entity such as a home with and without the flood risk reduction measure in place. Benefits are quantified through reductions in the losses after measures have been applied and discounted over the relevant time horizon. Cost estimates of each risk reduction measure are derived from various sources, such as engineers or construction companies. Combining these estimates, economic efficiency outcomes can be computed. The most attractive flood risk reduction measure from an economic standpoint is the one with the highest benefit-cost ratio assuming there are no budget constraints with respect to the cost of the investment. Using an economic efficiency metric captures the concept of the complex interactions of three main components that affect the final decision: (i) vulnerability of the exposed structure, (ii) the hazard level of the area, and (iii) the cost of the measure discussed. Here we provide more details on the four steps of a risk-based approach we outline in Section 3.1: (1) risk analysis; (2) identification of risk reduction measures and associated costs; (3) analysis of risk reduction; and (4) the calculation of economic efficiency.
4.1.3 Risk Analysis
The standard approach for the step 1 risk analysis component of the risk-based methodology is to estimate natural disaster risk and potential impacts defined as a function of hazard, exposure (inventory), and vulnerability (UNISDR 2004; Grossi and Kunreuther 2005) as depicted in Figure 10.
Figure 10: Elements of direct risk
Source: Keating et al. 2014
28
First, the risk of the hazard phenomenon is determined, which in the case of flooding is characterized by frequency and intensity (water depth, duration, and flow velocity). Next, the exposure (or inventory/portfolio) of properties at risk is characterized by first assigning geographic coordinates to a structure or collection of structures and then determining how many structures in the portfolio are at risk from floods of different water depths and associated frequencies. The hazard and inventory modules enable one to calculate the vulnerability or susceptibility to damage of the structures at risk. In essence, this step quantifies the physical impact of the natural hazard phenomenon on the property at risk. Vulnerability is typically characterized as a mean loss (or the full distribution of the losses) given a hazard level. Based on this measure of vulnerability, the financial loss to the property inventory is evaluated. It is important to keep in mind that a risk-based CBA methodology is part of a broader effort aimed at improving community resilience to natural disasters (see Box 3).
29
Box 3: Elements of Risk Analysis within a Resiliency Framework
To inform the work of the Zurich flood resilience alliance, Keating et al.’s (2014) white paper on Operationalizing Resilience Against Natural Disaster Risk sets out a conceptualization of disaster resilience which emphasizes the fact that communities are complex and interactive systems. The white paper outlines the way in which disasters can undermine long-term economic, social and environmental objectives, and that these indirect risks are often neglected in disaster risk reduction decision-making. Figure 11 shows a complex system linking development/wellbeing, risk (direct and indirect), and key sites where ‘resilience’ influences long-term outcomes.
Figure 11: Charting the development-risk-resilience system
Source: Keating et al., 2014
Direct risk, as discussed above, influences the development process via, for example, direct damage to productive assets. Indirect risk influences development via interactions with the state and its development and disaster resilience.
This conceptualization of resilience has significant implications for the practice of risk-based CBA and other decision-support tools. Decision-support tools, including risk-based CBA can be used to evaluate and prioritize interventions which enhance disaster resilience, but to do this we must first identify the drivers and responses of long-term development/wellbeing outcomes in the face of risk. The alliance is undertaking to develop an indicator of community flood resilience which is using a comprehensive and applied method to explore, validate and measure the properties of community flood resilience. This measurement tool is based on systems thinking and will help identify where a communities’ systems may be vulnerable to a flood event, and policies to address these weaknesses. Once indirect risk and policies to address these have been identified, risk-based tools can be used to inform decision-making about choice of resilience enhancing interventions.
30
Exceedance Probability (EP) Curves
Disasters, as low-probability, high-impacts events, follow extreme event distributions which are very different from normal distributions (see Hochrainer 2005). Such risk requires probabilistic analysis to adequately represent the potential for impacts as well as the benefits in terms of reduced impacts. A standard statistical concept for the probabilistic representation of natural disaster risk is the loss-exceedance curve, which traces the likelihood (y-axis) that damage does not exceed pre-specified levels (x-axis). The inverse of the exceedance probability (EP) is the recurrency period, that is, an event with a recurrence of 100 years on average will occur only every 100 years. An important property of a loss-exceedance curve is the area under the curve. This area (the sum of all damages weighted by their probabilities) represents the expected annual damages, that is, the annual amount of damage that can be expected to occur over a certain time horizon. This concept helps to translate infrequent events and damage values into an expected annual loss that can be used for planning purposes. Examining the probability distribution of the losses, though, presents a challenge as discussed further below.
To illustrate how an EP curve is constructed, consider the following example in Table 6. Suppose there is a set of natural disaster events, Ei, which could damage a portfolio of structures. Each event has an annual probability of occurrence, pi, and an associated loss, Li. The number of events per year is not limited to one; numerous events can occur in the given year. A list of 15 such events is listed in Table 6, ranked in descending order of the amount of loss. In order to keep the example simple and calculations straightforward, these events were chosen so the sum of the probabilities for all of the events equals 1.
Table 6: Events, losses, and probabilities
Event
(Ei)
Annual probability of occurrence
(pi)
Loss
(Li)
Exceedance probability
(EP(Li))
E[L] =(pi * Li)
1 0.002 25,000,000 0.0020 50000
2 0.005 15,000,000 0.0070 75000
3 0.010 10,000,000 0.0169 100000
4 0.020 5,000,000 0.0366 100000
5 0.030 3,000,000 0.0655 90000
6 0.040 2,000,000 0.1029 80000
7 0.050 1,000,000 0.1477 50000
8 0.050 800,000 0.1903 40000
9 0.050 700,000 0.2308 35000
10 0.070 500,000 0.2847 35000
11 0.090 500,000 0.3490 45000
12 0.100 300,000 0.4141 30000
13 0.100 200,000 0.4727 20000
14 0.100 100,000 0.5255 10000
15 0.283 0 0.6597 0
Average Annual Loss (AAL) = $760,000
31
As seen in Table 6, the annual probability that the loss exceeds a given value is one minus the probability that all the other events below this value have not occurred. A resulting illustrative exceedance probability curve is shown in Figure 12 below. The x-axis measures the loss in dollars and the y-axis depicts the annual probability that losses will exceed a particular level.
4.1.4 Assessing the Benefits of DRR
Steps 2 and 3 of the risk-based methodology involve the identification of risk reduction measures and associated costs as well as the analysis of the reductions in future impacts and losses due to the investment in disaster risk reduction. And as discussed, an EP curve is an important tool for assessing natural disaster risk potential. DRR measures typically decrease the vulnerability and therefore reduce the expected loss. Graphically, DRR shifts the EP curve to the left and therefore reduces the AAL value as depicted in Figure 12. One thing to keep in mind is that the benefits from a particular mitigation measure may affect different parts of an EP curve (low-end, mid-range or right hand tail), as shown in Figure 12.
possible EP curve
with mitigation measure
right - hand tail mid - range
Loss, L (in Dollars)
Excee
dan
ce p
rob
ab
ilit
y,
p
low - end
original EP curve
Figure 12: Exceedance probability (EP) curve showing potential benefits of disaster risk reduction. Note: The EP curve represents the probability that losses will be a given amount, and flood risk reduction
intervention shifts the EP curve to the left and therefore reduces the expected loss.
32
4.1.5 Calculation of Economic Efficiency
Economic efficiency is assessed (step 4) by comparing benefits and costs using different metrics. Three decision criteria are of major importance:
Net Present Value (NPV): Costs and benefits arising over time are discounted and the difference taken, which is the net discounted benefit in a given year. The sum of the net discounted benefits is the NPV. A fixed discount rate is used for expressing future values in today’s terms to represent the opportunity costs of using the public funds for the given project. If the NPV is positive (benefits exceed costs), then a project is considered desirable.
The Benefit-Cost Ratio is a variant of the NPV. The total discounted benefits are divided by the total discounted costs. By definition, a benefit-cost ratio of 1 means that the expected discounted benefit of implementing the mitigation equals its cost. Any measure where a benefit-cost ratio is greater than 1 is considered to be cost-effective and should be implemented as the benefits exceed costs and a project thus adds value to society. Any measure with a benefit-cost ratio less than 1 (implying that the upfront cost of mitigation is higher than the expected discounted benefit) should not be implemented. Due to its intuitiveness the benefit-cost ratio is often used.
Economic Rate of Return (ERR): Whereas the former two criteria use a fixed discount rate, this criterion calculates the interest rate internally, which is considered the return of the given project. A project is rated desirable if this ERR surpasses an average return on public capital determined beforehand.
These criteria offer different messages for different applications. For example, the UK government often uses the NPV rule, while the World Bank seems to prefer the ERR (HMT 2007; World Bank 2010). In many circumstances, the three methods are equivalent. Arguably, the benefit-cost ratio offers the highest intuitive appeal due to its relative metric (benefits per costs). However it is worth noting that benefit-cost ratios may advise investment in alternatives which create lower overall net economic values.
Finally, using the data from the EP curves with and without mitigation in place coupled with estimates of the upfront costs of the mitigation measures, one can undertake a series of sensitivity analyses to determine the relative cost-efficiency of specific mitigation measures varying different parameters used in the analysis. Time horizon and discount rates can have very large impacts on the economic efficiency measures. Therefore, relevant sensitivity analyses will depict the EP curve for two extreme cases: the one where mitigation will have the highest economic efficiency, for example, the highest benefit-cost ratio (best case) and one where this ratio is among the lowest (worst case). Typical variations are on the discount rates (0-15%) and time horizon (1, 5, 10, 25 years).
4.2 Key Challenges in Implementing a Risk-Based CBA
A rigorous CBA will properly address disaster risk arising from low-frequency, high-impact events; value indirect and intangible losses; include multiple hazards; assess portfolios of systematic interventions vs. single interventions; and account for uncertainty and change over time.
4.2.1 Properly Accounting for Issues and Elements of Measuring Risk
Even in developed countries, availability of good data for comprehensively assessing disaster risk and the benefits of DRR are not guaranteed. In low-income countries, acquisition of quality data becomes a key challenge. Gaps and uncertainties are related to the following issues and elements of measuring risk:
33
Hazard probability: In many settings it can be difficult to obtain scientific information on how often a hazard such as a flood can be expected (frequency), and how large it might be (magnitude). Estimates can often be based on a limited number of data points only (see Box 4.)
Damage assessments: Data will not be available for all relevant direct and indirect effects, particularly for the non-monetary effects. Estimates of damages from natural disasters therefore often focus mainly on direct damages and loss of life. Yet, even figures on direct damages should be regarded as rough approximations since very few countries have systematic and reliable damage reporting procedures. In the case of infrequent but high impact events, previous damage estimates may be from a very long time ago when population, urbanization and infrastructure were significantly different from today.
Vulnerability assessments: Vulnerability curves do often not exist and this information has to be generated, which is often fraught with complications.
Exposure assessments: The dynamics of population increase, urban expansion and increase of welfare should be accounted for. Fundamental changes in infrastructure, population and vulnerabilities over time mean that damage estimates from long past events are not relevant in today’s context.
Identifying the benefits of risk reduction: Often it is difficult to accurately measure the total costs, benefits of avoided loss, and co-benefits of risk reduction measures, particularly relating to indirect and intangible impacts on complex social and environmental interactions which may flow from DRR investments.
Discounting the future: The discount rate used reduces benefits over the lifetime of a project and thus has very important impact on the result.
Tackling these gaps and challenges, and creating the requisite data is associated with considerable costs, effort and expertize. The depth and robustness of assessments to be conducted thus depends upon the objectives of the respective CBA including the availability of data on hazard, vulnerability and exposure, and finally impacts. Because finding data on the elements of risk is time-intensive and difficult and because information on the degree of damage due to a certain hazard (vulnerability) is usually not readily available, , many CBA estimations are based on past impacts and sometimes try to update these to current conditions (see Mechler 2005).
34
Box 4: Applying a Risk-Based CBA Methodology when Dealing with Limited Hazard Data
In many settings it can be difficult to obtain scientific information over a relatively long period of time on how often a hazard such as a flood can be expected (frequency), and how large it might be (magnitude). Furthermore, even if this data is able to be collected questions of its accuracy and consistency need to be addressed. Available hazard data (quantitative and qualitative) may come from a number of sources including: records from municipalities, water authorities, environment agencies, and ministry; media reports; existing documentation from construction or other projects; community based risk assessment methods; existing hydrological monitoring stations, stream flows, and rainfall maps; site investigations; and photos and satellite images. To assign probabilities to hazards of different magnitudes, practitioners need to triangulate all this information and most likely make a number of assumptions. For weather-related disasters like flooding, considerations of changing frequencies and intensities due to climate change need to be accounted for potentially. (Modified from ADPC and UNDP 2005; IFRC/RC 2010).
Examples of CBA working with limited hazard data:
International Federation of the Red Cross (IFRC/RC 2010)
Communities may be able to supply information on the past impacts of disasters yearly, bi-yearly, or longer such as every five-to-ten years. For example, in the Philippines, floods occur every year, so flood frequencies did not need to be considered. Here the analysis was thus deterministic in nature. In the Sudan CBA study location, droughts occur at a similar magnitude twice every five years (on average). Thus, an annual drought frequency of 40 percent was used. In the Nepal analysis, stakeholders differentiated between normal yearly flooding and high-magnitude floods, which occur every five-to-ten years. The practitioners incorporated both these factors into the CBA by averaging their impacts over each year in the analysis period – for example, by spreading the impact of a flood that occurs only every ten years over ten years, to obtain its annual impact.
Practical Action (Willenbockel 2011)
As an outcome of the baseline vulnerability assessment it was determined that crop damage occurs every eight-to-ten years. A flood probability of 0.1, or a 10 year flood event, was used to estimate a crop loss of 8 percent given the occurrence of a ten-year flood with no dam protection. Thus, the annual expected value of avoided crop losses due to the construction of a dam was 0.008 multiplied by the value of annual crop production in the impacted area.
Risk to Resilience project with NGO partners in Rawalpindi, Pakistan (Kull et al. 2013)
Detailed loss data from past events on the Lai River were estimated as a 100-year event. Based on this event, as well as an assumption of no losses below the five-year flood, a truncated Pareto distribution was employed to generate a loss exceedance curve. This was then refined through hazard estimates of the 25- and 50-year floods from a previous study. Losses were updated to current conditions through inflation and exposure adjustments, with population growth used to drive exposure dynamics. Integration under the final estimated loss exceedance curve resulted in an average annual expected flood loss of around PKR 3.7 billion (USD 60 million).
4.2.2 Valuing Indirect and Intangible (Non-Monetary) Losses
Crucial to the application of this risk-based methodology is the ability to identify and estimate the baseline natural disaster economic losses to the area of interest (see Baseline Risk and VCA box). However, depending on the scale and nature of the costs and benefits of specific measures, this might be a hard task. For instance, natural disaster losses can be categorized across economic as well as social and ecological losses that are direct, indirect, tangible, and intangible in nature (see Balbi et al. 2013).
Putting a monetary value on these latter effects is challenging because ecological goods are typically not traded in markets, although the environmental economics discipline has developed techniques to monetize ecological effects. Methods for quantifying intangible impacts fall into two broad categories – revealed preference and stated preference techniques. Revealed preference techniques estimate the
35
value of intangible assets by investigating, for example, the difference in value of houses with a water view to those without, to quantify the amenity of looking at an attractive harbour (hedonic pricing), or the costs expended to visit a nation park to value an endangered species or the forest generally (travel cost). Stated preference techniques utilized advanced surveys to illicit estimates of the value people place on intangible assets and can even estimate existence value (Markantonis et al. 2012).
Ideally, a comprehensive CBA should include all relevant social, economic and ecological impacts while at the same time distinguishing between reductions in direct (stock) and indirect (flow) losses, being careful to avoid double counting (Mechler 2004:13). It would also account for any future change in construction, population growth, and flood hazard modification due to future climate change over the period of time the analysis focuses on. It should also include all the levels of uncertainty associated with future scenarios and decision making of agents influencing future scenarios. While attaching a monetary value to indirect and intangible assets is challenging, it is critically important that they are incorporated because in many cases indirect and intangible values are the ones which are valued most by people.
Table 7: Categories and characteristics of disaster impacts
Categories of impacts Characteristics
Direct Immediate effect due to direct contact with the hazard (e.g., loss of life, physical and monetary loss)
Indirect Occurs as a result of and in response to the direct impacts in the medium-long term (e.g., relief, recovery, reconstruction costs, longer term socio-economic effects)
Tangibles Impacts that have a market value and can generally be measured in monetary terms (e.g., structural losses)
Intangibles Non-market impacts, such as on health or impacts on natural resources
Quantitative disaster risk modelling has focussed on direct, tangible impacts, less so on the indirect and intangible effects (see Box 3). Indirect disaster losses are difficult to identify and quantify and hence are seldom considered in cost-benefit analyses. This is despite the fact that there is increasing evidence that indirect losses from disasters can be significant (see Cavallo and Noy 2010). In poor communities, the inability of households and businesses to fully recover can greatly exacerbate poverty leading to what is referred to as disaster induced poverty traps (Barnett et al. 2008). At the macro scale, recent research has attempted to quantify the indirect impacts of disasters in terms of loss in GDP, consumption, inflation, trade and investment (Burby 1991; Hochrainer 2006; Hochrainer 2009). It is certainly possible to include these effects in a CBA; however data availability is again a key constraining factor. In many cases, benefits of DRR come as reduced effects on household or country income and assets, but there are no databases that systematically assess such effects nor are there standards for measuring these impacts.
Especially in the developing world, where reportedly over 95% of deaths from natural disasters occur, a challenge is to identify DRR measures that can cost effectively reduce mortality and morbidity risk (Cropper and Sahin 2009). If mortality and morbidity risk can be estimated it is important to value fatalities and injuries so as to be commensurate with other benefits and costs of the project. The most
36
common approach to quantifying fatality is value of statistical life (VSL) estimates, typically based on projections of lost future earnings. However VSL estimates do not avoid value judgments and thus introduce substantial controversy (World Bank and UN 2010; Viscusi and Aldy 2003). We note that applying a VSL is controversial, and for this reason we recommend not making use of a point value, but applying a sensitivity analysis to the results over a range of VSL estimates. The same holds true for ‘softer’ environmental and social values, such as existence values for environmental goods as well as cohesion of a social group or community.
4.2.3 Assessing Portfolios of Systemic Interventions vs. Single Interventions
While assessments of the economic efficiency of DRR often focus on hazard and risk-specific interventions and their specific costs, it may likely be the case that the best DRR interventions rather comprise of a portfolio of interventions. What is more, these options may be integrated in broader developmental contexts, and comprise investments into systemic interventions in sectors such as education, health or infrastructure, which may bring about large DRR related benefits by building resilience (see Box 3). A focus on bolstering resilience in terms of maintaining key system functions in the face of adversity rather than reducing source-specific risk calls for a systemic understanding of the interrelationship of development, resilience and shocks. As discussed by Moench et al. (2007), the importance of resilience in social systems for reducing the impacts from extreme events is of high relevance and has been well explained by Amartya Sen and others, for example, for events such as droughts in India and China (see Sen 1999).
Such focus on systemic thinking also invokes a distinction between hard and soft measures (see Moench et al. 2007). Hard resilience refers to the strengthening of structures and physical components of systems in order to brace against shocks imposed by extremes such as earthquakes, storms and floods. In contrast, soft resilience can be built by a set of less tangible and process-oriented measures as well as policy in order to robustly cope with events as they occur and minimize the adverse outcomes. To some extent, preparedness is part of soft resilience measures, yet structural measures can also exhibit some elements. It may be argued that the key distinction is learning to live with risk, rather than assuming risk can fully be eliminated. The role of inclusive and systemic approaches has been underlined recently with high confidence by the IPCC SREX report (IPCC 2012):
Effective risk reduction generally involves a portfolio of actions to reduce and transfer risk and to respond to events and disasters, as opposed to a singular focus on any one action or type of action (high confidence). Such integrated approaches are more effective when they are informed by and customized to specific local circumstances (high agreement, robust evidence). Successful strategies include a combination of hard infrastructure-based responses and soft solutions such as individual and institutional capacity building and ecosystem-based responses.
4.2.4 Accounting for uncertainty
Natural disasters pose challenging problems for decision makers because they involve potentially large losses that are extremely uncertain. Note that there are a variety of ways of representing uncertainty in the loss estimates. Many EP methodologies combine probabilistic representation of hazard with mean descriptions of vulnerability. Approaches like this are relatively simple to deal with computationally, and with what is called primary uncertainty. By representing the hazard in a probabilistic manner, these methods characterize the uncertainty as to whether or not an event will occur. If an event does occur, the methodology indicates which event (as described by hurricane class or peak wind speed) it will be. While it is obvious that different events produce different levels of loss, we do not often think about the fact that a specific event has the potential to produce different levels of loss. Thus, the use of mean
37
vulnerability curves ignores the additional uncertainty associated with other factors. We call these other sources of uncertainty, secondary uncertainty.
Secondary uncertainty is the uncertainty in the size of loss, given that a specific event has occurred. Many factors affect the size of loss from a specific event. Although the magnitude of loss in an event follows certain trends, there is a level of uncertainty regarding the exact, quantifiable effect. The inclusion of secondary uncertainty calculations produces smoother EP curves with longer tails, providing a more accurate assessment of the potential losses caused by a natural catastrophe. Note that secondary uncertainty does not affect the average annual loss – only the EP curves.
Secondary uncertainty accounts for the uncertainty coming from sources such as:
Hazard uncertainty: Flood inundation uncertainty refers to the variable nature of the area inundated. This uncertainty is high in landscapes where erosion and deposition caused by previous floods change the landscape and inundated area, making subsequent floods harder to predict. Also, climate change is changing the frequency, intensity and duration of heavy rainfall, which has implications for flood risk (IPCC 2012)
Vulnerability uncertainty: Vulnerability uncertainty refers to the uncertainty in the amount of damage a building sustains given a specific local hazard condition. Identical buildings subject to the same level of hazard tend to perform differently due to vulnerability uncertainty. The uncertainty in building performance may come from different construction quality, unknown building characteristics, and from the inherent uncertainty in building performance response to the intensity and duration of the hazard.
Specification uncertainty: Specification uncertainty can arise from several sources. For example, the level of geographic resolution, construction characteristics, and local conditions can all be modelled at varying levels of detail. Technological advances are reducing this uncertainty where the results of more detailed GIS information are accessible.
Portfolio data uncertainty: Portfolio data uncertainty has to do with how detailed the model input data is and what data is available.
A further key uncertainty relates to the scale of analysis. While generally (with the exception of risk financing options) DRR will be implemented on community and subnational levels, there is interest particularly by policymakers to generalize and work with national information, and global information at the level of international development and humanitarian assistance. This holds true for CBA more widely. While originally strictly focused on a project well specified in time and space, it has been used to inform larger-scale decisions (such as large-scale dam siting) and global climate change policy. As Gowdy suggests, however, as the remit of the analysis widens, it becomes less clear how the intervention produces costs and benefits, who benefits and who is disadvantaged, and what other external factors come in (Gowdy 2007).
One additional complication is the dynamic nature of (changing) hazard, exposure and vulnerability, and therefore risk. Unless future risk patterns are known, the costs and benefits of risk reduction cannot be accurately calculated. While this is important as risk prevention investments are associated with time horizons of 10, 20 or 30 years, the future patterns are however often unknown or very difficult to project forward. Many dyke systems and other infrastructure investments have even longer life spans, which compound this uncertainty.
38
Box 5: Addressing Key Challenges through Baseline and Community Based Risk Assessments - Vulnerability and Capacity Assessment (VCA) and Participatory Capacity and Vulnerability Assessment (PCVA)
In order to measure vulnerability of communities and households, Anderson and Woodrow (1991) developed the Capacity and Vulnerability Analysis matrix. This largely qualitative participatory and monitoring approach came to be widely accepted and used by many NGOs in their work on DRR (see ActionAid 2005; Davis 2004).
In working with communities on implementing DRR activities, the International Federation of the Red Cross (IFRC) and Practical Action use participatory assessment processes to gather, organize and analyse information on the vulnerability and adaptive capacity of communities. These processes are completed with the collection of secondary information to provide a baseline of communities’ risk to different hazards.
These participatory approaches are particularly valuable in helping to understand the key challenges discussed above, namely: (1) the multitude of benefits and local values attached to these; (2) the historical perspective not only in regard to major disasters but also the less intense but recurrent minor shocks and stresses; and (3) providing an opportunity to link community perceptions with what science and policymakers are predicting will occur in the future due to existing underlying issues and climate change. This merger of traditional with scientific knowledge adds great value to planning approaches that attempt to consider multiple hazards and accommodate increasing uncertainty.
VCAs/PCVAs aim to support communities to:
Identify key vulnerabilities of communities
Understand communities’ perceived and actual risks
Analyse the resources and capacities available to reduce said risks
Develop action plans to address identified vulnerabilities and risks.
In working with communities on implementing DRR activities, Practical Action identifies and estimates the historic and potential natural disaster situation and works with the community to estimate the social, environmental and economic losses expected in the area of interest through their participatory capacity and vulnerability assessment (PCVA) process.
The baseline aims to measure DRR project progress and process measurement as well as the outcomes of project interventions through the following tools: (1) Participatory assessments -- used to enable communities to genuinely participate in project design, planning, and management to promote increased ownership, accountability and impact; (2) Key informant interview – identify key stakeholders and engage them in the planning process; (3) Household surveys – used to assess economic, social and environmental asset base for the key demographics in the community; (4) Scientific and traditional knowledge – bring technical specialists and the communities together to discuss existing natural disaster scenarios and current capacity and asset base to identify key opportunities and risks. These tools collectively aim to capture notions of the community’s physical, natural, financial, and social capital and identify critical DRR activities which match their vulnerability and livelihood profile.
The aims of PCVA are to:
Assess risks and hazards facing communities and the capacities they have for dealing with them;
Involve communities, local authorities and humanitarian and development organizations in the assessment from the outset;
Draw up action plans to prepare for and respond to the identified risks; identify risk-reduction activities to prevent or lessen the effects of expected hazards, risks and vulnerabilities.
This process of community selection => baseline risk assessment => vulnerability and capacity assessment => leads to the prioritization of DRR activities through probabilistic CBA in order to circle back to a reduced baseline risk.
It is an integral part of disaster risk reduction and contributes to the creation of community-based disaster risk reduction programs at the rural and urban grass-roots level. The assessments ultimately enable local priorities to be identified and appropriate action taken to reduce disaster risk.
39
4.3 Review of the Economic Evidence for DRR from CBA in Light of the Key Challenges
After presenting the key opportunities and challenges of CBA for DRR, we now present a comprehensive overview of the evidence found in the literature in light of these challenges. The discussion is based on a large review done by Mechler (2012) for the UK Foresight Report “Reducing Risk of Future Disasters.”
Table 8 lists in chronological order the 27 CBA studies on DRR interventions found in the literature in terms of location (country), hazards, and types of DRR covered. It also scans the studies on whether they address the five key challenges of conducting a CBA from section 4.2: properly addressing disaster risk arising from low-frequency, high-impact events; valuing indirect and intangible losses; including multiple hazards; assessing portfolios of systematic interventions vs. single interventions; and accounting for uncertainty and change over time. The review distinguishes between using CBA for ex ante project appraisals as well as ex post evaluations of implemented projects. Some of the studies have focussed on the USA because the regulation there has required cost-benefit analysis for each project receiving federal funding, and documentation for the projects is readily accessible. Lately, the development cooperation context has moved to the forefront due to interest by international financial institutions, donors and NGOs to gauge the economic efficiency of their interventions, and a number of studies have been conducted for this context.
Table 8: Studies on the CBA of flood risk reduction including coverage of key criteria
Study-detail Coverage of risk
Intangibles Indirect effects
Portfolios of interventions
Systemic intervention
EVALUATIONS (ex post) FEMA (1998): Ex-post evaluation of implemented risk prevention measures in the paper and feed industries (USA)
D
BTRE (2002): Flood risk reduction (Australia) E
Venton and Venton (2004): Risk reduction of floods, Bihar and Andhra Pradesh (India)
D
MMC (2005): Review of wide set of risk reduction grant programs (USA)
E
MMC (2005): Community flood risk prevention – Freeport, New York (USA)
E
MMC (2005): Community flood risk prevention - Jefferson County, Alabama (USA)
E
MMC (2005): Community flood risk prevention – Tuscola County, Michigan (USA)
E
MMC (2005): Community flood risk prevention – Jamestown USA)
E
MMC (2005): Community multihazard risk reduction - Horry County (USA)
E
MMC (2005): Community landslide risk prevention - Multnomah County, Oregon (USA)
E
Islam and Mechler (2007): Flood risk prevention– (Bangladesh)
E
Kull et al. (2008): Flood risk prevention (India) E
White and Rorick (2010): Flood risk reduction interventions in Kalali district (Nepal)
E
Eucker et al. (2012): Community-based flood risk reduction in 4 districts (Bangladesh)
Mechler (2005): Flood risk prevention and integrated water management - (Semarang, Indonesia)
E
Kull et al. (2008): Flood risk prevention - Uttar Pradesh, India
E
Subbiah et al. (2008): Early warning for hurricane and flood risk across a number of case studies (Bangladesh, Sri Lanka, Vietnam, Thailand, Indonesia, India, Philippines)
E
ECA (2009) and CCRIF (2010): Climate risk adaptation cost curves applied to national and subnational level DRR options
E
Hochrainer-Stigler et al. (2010): Structural risk reduction against hurricane, flood, and earthquake risk --(St. Lucia, Indonesia, Turkey, and India)
E
Venton et al. (2010): Flood risk prevention as part of safer islands programme (Maldives)
E
Willenbockel (2011): A Cost-Benefit Analysis of Practical Action’s Livelihood-Centred Disaster Risk Reduction Project in Nepal. Brighton: IDS.
P
Czajkowski et al. (2012): Elevation of 300,000 single-family residences in two counties in Texas to protect against riverine and surge flooding
P
Aerts et al. (2014): Assessment of multiple interventions in New York City
P
Note: D: Deterministic analysis, E: Expected value, P: Probability distribution considered. Shaded boxes indicate coverage of the attribute in the study.
Source: Updated from Mechler (2012)
4.3.1 Coverage of key DRR related challenges
As Table 8 highlights, there has been no consistent approach to using CBA in estimating the benefits to DRR in light of key challenges. For example, not all of the studies listed utilize a risk-based approach nor are all benefit types typically considered in the analysis. Assessing multiple DRR interventions are not the norm, and systematic interventions are almost completely ignored. Most interventions cover structural measures, and here most prominently flood risk prevention. Yet, preparedness has increasingly been tackled. Risk financing assessments have held some appeal and some studies have aimed at assessing more comprehensive packages, such as flood risk prevention coupled with water management plans, or seismic retrofit integrated with risk financing (see Table 8).
41
Coverage of risk
As discussed above, implementing a risk-based methodology is a central challenge to CBA for DRR. While a few studies take a deterministic approach and compare effects of interventions between actual events only, most analyses consider disaster risk probabilistically. Only a few studies take probabilistic analysis as far as relating benefit-cost ratios to layers of risk.
Valuing intangible and indirect effects
Most studies with a few exceptions (Venton and Venton 2004; Mechler 2004; MMC 2005; Mora et al. 2009; Mechler et al. 2008) take monetary costs avoided as a proxy for benefit. This approach is not strictly correct from a methodological perspective, since benefits in CBA should technically be estimated in terms of avoided reduction in utility or consumption. By estimating benefits in this way, indirect effects are generally not factored into DRR analyses, as they would be under the resource-intensive utility/consumption estimation method. As one example, Mechler et al. (2008) focussed their assessment entirely on the indirect effects, aiming at understanding what disaster risk means for the livelihoods of small scale farmers. The study is based on, among other statistical sources, a survey with small scale farmers, which reported important large income losses. As such information is not regularly reported, this case study conducted extensive surveys to elicit such information, which then led into the modelling analysis.
While it is possible to estimate indirect and intangible values for many elements, as the MMC (2005) study notes, the requisite data often is not available. Methods for estimating the monetized value of non-market impacts include contingent valuation and choice experiment methods. Both of these methods elicit individual willingness-to-pay for specific environmental goods or health effects. Contingent valuation methods use marketed goods to infer intangible value. For example, by statistically analysing the impact of a mountain view on house prices, analysts can estimate the value placed on that view by the community. Choice experiment methods use carefully designed surveys to ask people their willingness-to-pay for the good. In some cases, the data issue can be addressed by using benefit-transfer methods. Benefit-transfer methods essentially transfer the estimated values from one study to the specific case being analysed. This method works well if the transfer is valid, that is, if the populations and intangibles in question are similar enough that the transfer is reasonable. Benefit-transfer is attractive because it is significantly less resource intensive than generating new estimates. Both the primary valuation process and the transfer between cases can, however, be controversial. As a result, non-monetized costs and benefits are often ignored.
Accounting for human impacts in CBA, however, poses key ethical issues. A contentious area of discussion concerns whether non-market values, such as impacts on human life, can and should be included into cost-benefit calculations. Many argue against measuring the ’immeasurable’ due to value judgments involved, others argue in favour of doing so, as else such values may be omitted from decision-making. Very few CBA studies in DRR have done so, and one interesting example was carried out by Smyth et al. (2004) and is discussed in the next case study section.
Clearly, indirect and intangibles impacts matter, and as another example (to be discussed in more detail as well in Section 5), Kull et al. (2013) evaluated the historical performance of the embankment of the Rohini River in northern India since 1973 and found, when making the analysis more realistic by considering a host of intangible effects, that a project may eventually become inefficient.
Assessing portfolios of interventions
Whereas earlier studies often focussed on single interventions, many analyses reviewed here studied multiple interventions for flood, seismic, drought and windstorm risk. As another example from Mechler
42
et al. (2008), a combined intervention of risk reduction and risk financing was studied for helping drought-exposed farmers deal with extremes. While simple interventions showed positive benefit-cost (with irrigation showing higher returns); a joint intervention produced even better results. For example, in an integrated approach where irrigation ameliorating frequent drought events was combined with insurance for dealing with more extreme droughts, benefits accrued were more the addition of the approaches individually because of the way they interact with one another. Assessing portfolios of interventions thus requires some more advanced analysis in order to work towards a good estimate of risk, which is necessary to understand how frequent and infrequent risks are tackled and modified.
Assessing systemic interventions
Studies assessing systemic interventions such as building community capacity overall through enhanced education and health interventions, were assessed in only 3 studies (Venton and Venton 2004; Eucker et al. 2012; Venton et al. 2012). The robustness of the estimates compiled is not clear, and none of the three studies use best practice for estimating risk based on probability, which renders estimates not robust.
4.4 Opportunities and Challenges Inherent to CBA More Broadly
Although we have discussed in detail specific key challenges in implementing a rigorous risk-based CBA, several other methodological opportunities and challenges are inherent to CBA, and we discuss a few key ones here.
Discounting and choice of discount rate
The choice of discount rates heavily affects CBA results. The Stern Review (2006) on the economics of climate change led to intense debate due to the suggestion made to use low discount rates in order not to discount away future debilitating climate change, while mainstream economists suggested that market rates should be used instead. A similar argument could be made for catastrophic risk characterized by fat tails (that is, events happening with low recurrence and leading to large impacts over future time periods), which would call for lower discount rates for DRR projects also. A number of studies take this point into account and conduct sensitivity analyses across different discount rates.
Consideration of behavioural biases in implementation
Studies suggest that individuals are not willing to invest funds to reduce future losses even if they are residing in highly hazard-prone areas (Mileti 1999). Simple steps, such as securing a water heater (for example, with plumbers' or Teflon tape), can normally be done by residents for under $5 in materials and one hour of their own time (Levenson 1992). This measure can reduce damage by preventing the heater from toppling during an earthquake, creating gas leaks and causing a fire. Yet residents in earthquake-prone areas are not adopting such simple and other loss-reduction measures. Following is a more detailed analysis of the factors that influence the decision to adopt protective measures.
There are four principal reasons why homeowners do not appear to want to invest in mitigation measures: short time horizons, desire for a quick return on investment, budget constraints and lack of perception of added economic value.
First, when considering the recoupment of their investment in a mitigation measure, in general, individuals consider relatively short time horizons. Even if the expected life of the house is 25 or 30 years, the person may only look at the potential benefits from the mitigation measure over the next 3 to 5 years. This may be based on their expected length of stay in the current residence.
43
A related reason why mitigation is often unattractive is that individuals expect a quick return on their investment. Financially this is consistent with using a high discount rate for evaluating potential future payoffs. In order to test this hypothesis, Loewenstein and Prelec (1992) proposed a behavioural model of choice whereby the discount function is steep and hyperbolic, rather than exponential. Their model and related results appear to explain the reluctance of individuals to incur the high immediate cost of energy-efficient appliances in return for reduced electricity charges over time (Hausman 1979; Kempton and Neiman 1987).
Third, many individuals perceive the probability of a disaster causing damage to their property as being so low that they consider an investment in protective measures as unnecessary. Even if there is some concern with the potential of a hazard, budget constraints lead homeowners to place mitigation as a low priority item for the use of their funds. It is not unusual for one to hear the phrase, “We live from payday to payday” when asked why a household has not invested in protective measures (Kunreuther et al. 1978).
Finally, individuals may have little interest in investing in protective measures if they believe that the measures will have limited added economic value to them. For example, they may not consider an investment to be cost effective if they believe that it will not increase the resale value of their property. If they are financially responsible for only a small portion of their losses should a disaster occur, the measure would be even less attractive. In addition, if they have limited assets at stake, they may feel they can walk away from their destroyed property without much financial harm. Similarly, if residents anticipate liberal government disaster relief, they have even less reason to invest in a mitigation measure (Kunreuther 2000).
A basic point to recognize from these results is that whether particular mitigation measures will be viewed as worth adopting by a homeowner is not a foregone conclusion but requires a detailed assessment of the costs and benefits under various hazard scenarios.
Accounting for risk aversion
Risk-averse individuals are willing to pay more than their expected losses to avoid the risk of incurring very large losses at one time. In principle, this would also hold true in developing countries where absent reliable safety nets, a large loss can threaten livelihoods and even lives. There is some evidence on willingness to pay for insurance premiums beyond expected loss (e.g., farming households in India, see Bhavnani et al. 2010) yet, in most cases very tight budget constraints, particularly for those at low incomes, mean that in effect there is no demand for insurance, unless it is heavily subsidized. Apart from Kind (2013), case studies in this report did not take risk aversion into account. Losses to housing structures were expressed in risk-neutral terms as mean damage ratios or expected losses. To take account of risk aversion, expected utility rather than expected value becomes the basis of the calculations, where expected utility might be expressed in terms of an equivalent monetary gain. In practice, it is not straightforward to determine a utility function, and to simplify, often a method is used that makes use of the mean and variance of the distributed losses, weighted by a risk aversion parameter.
Limited role in informing decisions
The general principle underlying CBA is the Kaldor-Hicks-Criterion, which holds that those benefiting from a specific project or policy should potentially be able to compensate those that are disadvantaged by it (Dasgupta and Pearce 1978). Whether compensation is or can actually be done, however, is often not of importance in practice. Techniques for considering the distribution of costs and benefits exist, yet these are relatively complicated and have not found wide usage (Little and Mirrlees 1990). CBA’s ability to influence decision process and learning may be limited as the World Bank (2010) review shows. Using
44
CBA for ex-ante project appraisal is critical for the deliberative thinking necessary for proper risk reduction of low-probability, high-consequence events such as floods. However, CBA cannot easily resolve conflicts and strong differences in value judgements that are often present in controversial projects and policies (for example, nuclear power, bio-technology, but also flood management (see also Wenz 1988; Gowdy 2007)). The distribution of costs and benefits remains a key challenge.
Taking account of time evolving risks, such as climate change
A cost-benefit analysis that considers benefits accrued may be sensitive to changes in the baseline risk level over time. This is particularly relevant today where climate change is expected to adjust hazard levels. A methodology for including climate change in the benefit calculations is illustrated in the case of the Rohini River basin in India and of New York City in the USA. This and other approaches, however, are still in their infancy and present an appreciable methodological challenge for future research. A key challenge here is how to represent uncertainty in the effect of climate change on hazard levels. To date it has not been possible to credibly assign probabilities to climate scenarios, particularly beyond the medium term (beyond 2030). Moreover, climate change is not the only driver of adjustments in risk over time. We note that any increase in hazard intensity might in the future be outweighed by autonomous decreases in asset vulnerability or exposure (e.g., individuals moving away from high hazard regions). Other drivers of increasing risk are economic development and urbanisation (e.g., Nicholls et al. 2007). Jakarta is an interesting case in point as recent analyses showed that urbanisation itself has increased flood hazard significantly over the past few decades by reducing the effectiveness of natural and manmade drainage systems (Lloyd’s of London 2008). Loss estimates that do not incorporate such changes should be treated with caution. In the next section we will discuss alternative tools.
Box 6: From Vulnerability to Resilience (V2R)
The incidence of disasters is increasing and climate change is expected to result in more frequent and severe hazards. Poor people's livelihoods will be the hardest hit, because they often live in risk prone areas and have few resources to protect themselves against disasters. Practical Action is working with communities to reduce the risks of disasters through strengthening disaster preparedness such as early warning systems, and preventing hazards through better environmental management, and by strengthening communities’ capacity to cope. Our approach, known as from Vulnerability to Resilience (V2R), sets out key factors that contribute to peoples' vulnerability: exposure to hazards and stresses; fragile livelihoods; future uncertainty; and weak governance. It provides a framework for local communities to explore the linkages between these factors and how to plan actions to strengthen their resilience.
The V2R is a participatory process that engages the local community with local authorities and stakeholders to analyse their situation, to actively participate in local development planning and to voice their demands or influence wider institutions where appropriate.
The V2R can prompt practitioners to see possible opportunities to make programmes more successful. For example, traditional food security projects have benefitted from including disaster risk reduction interventions. The V2R framework is a means to an end; the increased resilience of poor people to multiple hazards and an uncertain future.
5 Highlighting and Tackling the Challenges: Illustrative Flood Risk Reduction CBA Case Studies
This section discusses two specific case studies where a CBA approach was developed to measure the efficiency of specific risk reduction measures. As mentioned above, undertaking CBA can be done for different purposes, at different levels of analysis, from focusing on a single building (e.g., the owner would like to retrofit his building against flood or simply flood-proof it) to undertaking an analysis for a large number of buildings with similar construction (e.g., all single-family houses or all commercial buildings in a city) or to a community, city or region (including residential, commercial, industrial and public construction and infrastructure).
The CBA can focus not only on the avoided direct economic loss (e.g., reconstruction of a building damaged by a disaster) but can include the value of life when mitigation measures are expected to save lives and reduce health costs to the victims of the disaster as well as indirect costs to the community (e.g., evacuation costs from residential homes and business interruption). The modelling of the hazard can range from deterministic scenarios to probabilistic risk assessment including uncertainty on possible futures (e.g., impact of climate change on damage from storm surge and flooding to property in New York City in the next 20 to 50 years). This section focuses on the following case studies undertaken by the research team, that together provide complementary views on how to use risk-based CBA methodology in practice:
a) A CBA analysis for the City of New York. Here we initially focus on storm surge flood hazard only and do not include the value of lives potentially saved by protection measures. But we combine residential and commercial exposure (including business interruption) and integrate uncertainty about avoided flood risk estimates and future climate scenarios in the analysis. Finally, the quantification focuses on both collective flood mitigation measures (i.e., a barrier system) and individual measures (i.e., flood-proofing houses).
b) An analysis studying historical and future river embankment performance in the Rohini River basin in northern India using backward- and forward-looking risk estimation techniques integrated with stakeholder dialogue. The analyses highlights that CBA can be a useful tool if certain issues are considered properly, including: complexities in estimating risk; data dependency of results; negative effects of interventions; and distributional aspects. Intervention design and uncertainties should be qualified through dialogue, indicating that process is as important as numerical results.
5.1 Evaluating Flood Resilience Strategies for Coastal Mega-Cities: Illustration with New York City
Location
Prompted by the occurrence of Hurricane Irene in 2011 and especially Hurricane Sandy in 2012, different flood risk reduction strategies have been proposed for New York City (NYC) by scientists, engineers, NGOs and policymakers (Aerts et al. 2013a; NYC 2013). Some measures are effective in lowering the probability of the flood hazard and protecting large parts of the city, for example, through barriers, levees, and wetland restoration or beach strengthening. However, some of these large scale engineering options have received criticism since their initial investment costs are very high, as Aerts et al. (2013a) show. Other measures lower exposure and vulnerability by linking to current policies, for
46
example, through zoning regulations and enhancing building codes (Aerts and Botzen 2011). These measures may considerably reduce the potential damage that floods cause and entail lower investment costs than flood protection infrastructure such as storm surge barriers, but they do not prevent flood waters from entering the City.
Approach
Aerts et al. (2014) provide a comprehensive cost-benefit analysis of flood risk reduction strategies by focusing on both main strategies (preventing flooding and reducing vulnerability), and some derivatives:
1. The Resilient Open City strategy (S1) builds upon enhancing current building codes in NYC (Aerts and Botzen 2011), by elevating or wet-or dry- flood proofing of both existing and new buildings.
2. The Storm Surge Barrier Strategies 2a, b and c (S2a,b,c) described in Aerts et al. (2013a) aim at lowering flood probabilities in NYC and parts of New Jersey (NJ), with different sets of storm surge barriers and, additionally, protective measures such as levees and beach nourishments.
S2a “Environmental dynamics” consists of three barriers to close off parts of NYC and NJ, while preserving the wetland dynamics of Jamaica Bay.
S2a is expanded to S2b, “Bay closed” by adding a fourth barrier that closes off Jamaica Bay.
S2c, “NJ-NY connect” replaces three barriers from S2b with one large barrier in the Outer Harbor, thereby protecting a larger area. The barriers systems are designed to withstand an extreme surge of 25-30ft.
3. S3, the “hybrid solution” proposed by Aerts et al. (2013a), combines cost-effective building code measures of S1 only in high risk 100-year return flood zones (defined by the U.S. Federal Emergency Management Agency, FEMA) with protection of critical infrastructure to reduce economic losses due to business interruption. S3 includes moderate local flood protection measures, such as levees and beach nourishment that are also part of S2c. These building code measures and local protection measures are adjustable to future climate change as they can be upgraded if flood risk increases.
Figure 13: Left panel: strategy S2c; right panel: strategy S3 (discussed below)
Source: Aerts et al., 2014
47
As Aerts et al. (2014) explain: “Strategy S2c (left panel) reduces the length of the coastline of the NYC-NJ area as much as possible, to minimize flood protection costs. Two storm surge barriers are developed: one large barrier that connects Sandy Hook in NJ and the tip of the Rockaways in Queens, NY and a barrier in the East River. Some lower spots (bulkheads, levees, or landfill) on the inside of the protection system will be elevated to accommodate rising water levels caused by Hudson River peak discharges during a storm event. Strategy S3 (right panel) combines cost effective flood-proofing measures with local protection measures of critical infrastructure. Such a ‘hybrid solution’ aims at keeping options open: either (a) building codes can be further enhanced in the future with additional local protection measures or (b) storm surge barriers can be developed.”
The CBAs of building code strategies for S1 and part of S3 pertain to three main categories of measures: elevation, wet flood proofing, and dry flood proofing. The costs and benefits of the application of each measure are estimated for 2ft, 4ft, and 6ft above the current height of existing buildings. A distinction is made for each strategy whether it applies to existing buildings or only new residential buildings. A further distinction is made between application of the measures in the 1/100 and 1/500 FEMA flood zones, based on the maps that were available in 2012. Elevation is applicable to both 1/100 high-risk named “A” and “V” zones, while wet and dry flood proofing is only analysed for application in A zones since these stand-alone measures are less effective to cope with high velocity waves in V zones, especially if flood depths are high.
Detailed cost estimates of the building code measures are provided in Aerts et al. (2013a). These cost estimates are based on GIS information on the current and projected (until 2040), building stock in NYC flood zones. Based on the number and characteristics of these buildings and engineering cost estimates of flood proofing buildings, flood zone aggregated costs of applying a building code strategy to all buildings for which this strategy can be applicable are obtained. Aerts et al. (2013a) estimate the investment and maintenance costs of the storm surge barrier strategies based on costs of barrier designs made for NYC by engineering firms, and by checking on the reliability of these estimates by examining costs of large storm surge barrier projects conducted around the world in relation to the characteristics of their designs. In addition, the costs of additional flood protection works, such as strengthening the coastline around the barriers are included by assessing where such reinforcements are needed, and by calculating their costs based on published literature of unit prices.
The resulting cost estimates show that flood proofing existing buildings through elevation is very expensive (between $2.3bn and $2.6bn in the A zone). The total costs of dry or wet flood-proofing these buildings is lower, but nevertheless substantial (between $0.25bn and $1bn in the A zone) (Aerts et al. 2013a). Flood proofing of new buildings is cheaper. Especially, elevation is considerably less costly if it is applied to new instead of old buildings, since additional costs of elevating a building are low when this is done during construction of a building (Aerts et al. 2013a). The investment costs of the flood protection strategies S2a,b,c are much higher than the building code options: namely, about $19bn for S2a,b and $13bn for S2c. The hybrid solution (S3) investment costs are about $11bn.
The risk reduction benefits of the building code and flood protection strategies are estimated using a probabilistic flood risk model, which is an extension of Aerts et al. (2013b), that estimates potential flood damage on the census block level in NYC. Average annual flood damage estimates of this model are based on 549 synthetic storm surge scenarios produced by a coupled hurricane – hydrodynamic model. This model is based on the HAZUS MH4 methodology using a detailed database for NYC, and applies flood depth-damage curves to calculate potential damage to buildings and vehicles, for each of the particular 549 inundation scenarios. The risk to other categories (like infrastructure), and indirect economic effects (business interruption) have been added to the model damage output based on observed consequences of Hurricane Sandy (Aerts et al. 2013a). The coupled hurricane model also
48
simulates the effects on surge heights of increased storminess due to climate change. Therefore, future risk and avoided flood damage by each strategy was also simulated using different climate change conditions, related to both sea level rise and storminess. This resulted in three climate change scenarios which built on the Global Climate Model simulations used by Lin et al. (2012) and sea level rise projections for NYC produced by Horton et al. (2010). Another future scenario represents the increase in urban exposure, due to new construction in flood zones until the year 2040. It should be noted that those benefit-cost ratio (BCR) and (Net Present Value) NPV estimates include only reduced annual flood risk to building stock as benefit (including business interruption and infrastructure losses).
Results
Aerts et al. (2014) present the results of an extensive cost-benefit analysis of the aforementioned strategies which was conducted over a 100 year period. A time horizon of 150 years has also been used for the flood protection strategies, but these results are very similar to the calculations with a 100-year time horizon. Sensitivity of the results to the discount rate is examined by conducting all cost-benefit analyses using a low (4%) and high (7%) value of the discount rate. Moreover, all cost-benefit analyses are conducted using an interval of a lower (-22%) and upper (+17%) value of the avoided flood damage estimate which reflects the 95% confidence interval of the water level caused by a storm and uncertainty in the resulting damage estimate (and thus risk reduction of a strategy). Finally, the influence on the results of delaying the investment in flood protection infrastructure by 25 years is examined.
None of S2a,b,c nor S3 is economically beneficial under current levels of flood risk and the low climate change scenario, although the proposed S3 by Aerts et al. (2014) shows the highest Net Present Value (NPV) and benefit cost ratio. Under the middle climate change scenario and high discount rate (7%) S3 is the only strategy that would make sense economically. When a low 4% discount rate is considered, all strategies make economic sense if sea level rise occurs and climate change increases storminess. In that case, S2c results in the highest NPV. All storm surge barriers are economically feasible if flood risk develops according to the high rapid ice melt scenario. Since trends in flood risks are still highly uncertain (Lin et al. 2012), flood management strategies for coastal cities must also be flexible to allow for a change in policy when more detailed and reliable information becomes available on, for example, sea level rise. Therefore, Aerts et al. (2014) propose to start with implementing building code measures that are part of S3 which are already cost effective under current climate conditions: namely, elevating new buildings +6ft in V zones and +4ft in A zones. Moreover, critical infrastructure should be protected against flooding by mainstreaming adaptation measures into recovery and repair works. If climate develops according to the middle climate change scenario – meaning that storminess increases – then NYC should consider investing in storm surge barrier S2c.
Highlights
Overall, this study by Aerts et al. (2014) shows that a comprehensive and spatially detailed flood risk analysis on a metropolis scale can provide a robust cost-benefit evaluation for policy makers, despite the modelling of large uncertainties related to discounting, risk estimates, time horizons of investments, and future scenarios of development of flood risk. Future work could aim to integrate reduction of casualties, health risks, and environmental impacts of the flood protection strategies.
49
5.2 Studying River Embankment Performance and a People-Centred Approach in the Rohini River Basin in India
This study tackles two key challenges: (i) few studies have rigorously taken a retroactive approach and evaluated whether, and to what extent, implemented DRR has brought about benefits; and (ii) there is a lack of integration of CBA with the decision-process, particularly those concerned with the distributional effects. Integrating CBA in a participatory and iterative community-based decision-process (see Figure 14). Kull et al. (2013) evaluated the historical (as well as future) performance of the embankment of the Rohini River in northern India since 1973. The key finding of this study was that deriving realistic parameters and assumptions through a participatory process is indeed feasible and delivers robust results. While strict flood engineering-based estimates showed high benefit-cost ratios, when rendering the analysis more realistic by considering a host of other and intangible societal effects and costs (such as land compensation costs, real embankment performance, as well as disbenefits associated with waterlogging), which traditional engineering analysis of infrastructure projects tends to ignore, the assessed project becomes less efficient.
Figure 14: CBA as part of an iterative shared learning dialogue
Source: Moench et al. 2008
Location
The Rohini River is part of the Gangetic Basin, located primarily in the Gorakhpur and Maharaganj Districts of Uttar Pradesh State, India. Starting in Nepal, the river flows approximately north to south, ending at its junction with the Rapti River near Gorakhpur City. Like all of eastern India, the Rohini is prone to floods during the monsoon. There is always some annual flooding, with major floods occurring most recently in 1998, 2001, and 2007. The primary flood risk reduction strategy in the Rohini Basin, started in the 1970s, is to reduce the hazard through the construction of embankments. These fail frequently, often due to insufficient maintenance, while sometimes their designs simply are exceeded. So, the question addressed in this case was what can be said about embankment performance ex post and how can performance be made more resilient.
50
Figure 15: Location of the Rohini River
Approach
Kull et al. (2013) conducted a CBA of engineered flood risk prevention, continued operation and maintenance of the 113.1 kilometres of existing embankments along the Rohini River, assuming no further embankments would be built. A contrasting decentralised ‘people-centred’ strategy was also designed and analysed for projected economic performance. The multiple interventions within this strategy, including also the types of flood risks they were assumed to reduce, are listed Table 9. The table exhibits the different types of interventions at individual, community and societal levels, as well as the frequent data gaps, where no solid data is available to estimate the returns to these strategies. As discussed above, data gaps are particularly pronounced for intangible and indirect risks as well as for the impacts related to softer options and more systemic interventions, such as strengthening self-help groups or enhancing flood-adapted agriculture, compared to hard-resilience interventions, such as maintaining flood drainage points.
Owing to the objectives and data/resource limitations, a combined backward- and forward-looking risk analysis was performed. Flood risk was first estimated based on two recent large-scale events, updated to current conditions, and then adapted to incorporate downscaled climate change projections to localized scales.
Basin-wide flood losses for the large 1998 and 2007 floods were estimated primarily using results from a household survey (reviewed in Hochrainer et al. 2011), calibrated with secondary data. Application of survey results to the full basin took into account differences in the risk profiles of the survey sample versus the full basin. Secondary data was used to estimate public infrastructure losses.
Observed regional population dynamics were employed to account for changes in exposure. Between 1998 and 2007 some housing transitioned from mud to brick construction and rural communication improved (particularly mobile telephones), leading to decreases in flood vulnerability. It was estimated that the 1998 flood was approximately a 50-year event, and the 2007 flood a 25-year event. These two events, as well as an assumption that floods below two-year return periods do not cause losses, were used to develop a truncated Pareto distribution for the loss frequency curve.
51
Table 9: Key benefits and potential for quantification in the Rohini case study
Source: Kull et al. 2013
These backward-looking risk estimates were then adapted using a forward-looking methodology to incorporate potential climate change impacts. A statistical down-scaling model was developed to investigate potential climate change impacts on precipitation patterns in the Rohini Basin up to 2050 (Opitz-Stapleton and Gangopadhyay 2011). Projections were analysed under the SRES A2 and B1 scenarios (Nakicenovic and Swart 2000). Precipitation projections were then applied in a hydrologic–hydraulic model to determine potential climate-induced changes in flooded areas.
Under the assumption that flood losses are related linearly to flooded areas, the loss exceedance curve developed during the backward-looking analysis was adapted to incorporate projected future climate change impacts. It is accepted that this flooded area verses loss assumption oversimplifies a complex issue, particularly for small events and economic flow losses, however the limitations of the flood modelling warranted such a simplification. Such assessment limitations are common in often data-sparse development contexts. Benefits and costs in future years were exposure-adjusted based on projected population growth.
Results
The key finding of this study was the ability to derive realistic parameters and assumptions through a participatory process in order to arrive at robust results. While the strict flood engineering estimate showed high benefit-cost ratios, when rendering the analysis more realistic by considering a host of other and intangible effects, the assessed project became less economically efficient. Traditional engineering analysis of infrastructure projects tends to ignore dis-benefits and often does not capture all societal costs. Taking such an engineering approach first based on official embankment costs and hydrologic engineering analysis at a discount rate of 10%, the authors arrived at a benefit-cost ratio of about 4.6, indicating high economic efficiency. It might therefore be concluded that the embankments
52
have been worthwhile. When refining the analysis, however, the economic efficiency reduced greatly. By considering real land compensation costs, the benefit-cost ratio was about halved. Further adding to the analysis, a truer assessment of embankment performance caused by insufficient maintenance (as also reflected in the costs) leading to failures, the benefit-cost ratio further reduced to about 1.6. When these disbenefits, plus the disbenefits of not being able to divest of beneficial water flows from recurrent flooding, were explicitly taken into account, the embankments became economically inconclusive (benefit-cost ratio of 1.0). Considering that all disbenefit assumptions and computations were conservative, and reflecting on the many uncertainties within this probabilistic analysis, it thus cannot finally be concluded with confidence that the performance of embankments in this case has been truly economically viable (see Figure 16).
Figure 16: Evaluation of the performance of embankments along the Rohini River basin in India
Source: Kull et al. 2008
53
6 Actual Usage of CBA for Decision Making
The previous sections have provided the detailed CBA risk-based assessment methodology, associated case study context, as well as the available quantitative evidence for the operational application of CBA, but have not explicitly focused on the decision-making utilization of the CBA technique. Table 3 in section 3 provides the three main general decision-making contexts in which a CBA is applied: ex-ante project appraisal, ex-post project evaluation, or a study done for informational purposes.
CBA has been applied to the assessment of various disaster risk reduction strategies in developed countries. For instance, the U.S. FEMA mitigation grant program (see Box 2) mandates that local communities undertake CBA in advance of spending federal money to protect against future disasters (ex-ante project appraisal). But such ex ante mandates are more challenging in low-income countries where CBA is often done from an ex-post evaluation perspective (World Bank 2010) in contrast to the cost-effectiveness of ex-ante actions to reduce risk and prepare for events (Mechler 2012).
In addition to being an optimization tool used to select (or justify ex-post) the risk reduction strategy that is most economically efficient, CBA also involves systematic decision-making processes used to identify and agree on the most important benefit and cost aspects amongst risk managers and key stakeholders (IFRC 2010). Not utilizing CBA for ex-ante DRR project appraisal may not capture this important attribute of the technique.
They way decisions under risks are made is nicely illustrated by Daniel Kahneman, a professor of psychology at Princeton University, in his Nobel address (2003) and book, Thinking, Fast and Slow (2011) who characterizes two modes of thinking as “System 1” and “System 2” by building on a large body of cognitive psychology and behavioural decision research (see Box 7). The intuitive System 1 operates automatically and quickly with little or no effort and no sense of voluntary control. It uses simple associations (including emotional reactions) that have been acquired by personal experience with events and their consequences. The deliberative System 2 initiates and executes effortful and intentional mental operations as needed, including simple or complex computations or formal logic. We argue that using CBA for ex-ante project appraisal is critical for the deliberative System 2 thinking necessary for proper risk reduction of low-probability high consequence events such as floods.
54
Box 7: Intuitive and Deliberative Thinking as Inputs to Risk Reduction
A large empirical literature has revealed that individuals, small groups and organizations often make decisions under risk and uncertainty by undertaking processes that can be characterized as intuitive thinking. Choices are often made by emotional reactions and simplified rules that have been acquired by personal experience. There is a tendency to misjudge probability levels, focus on short time horizons, utilize simple heuristics in choosing between alternatives and selectively attend to subsets of goals and objectives.
Intuitive thinking works well when decision makers have extensive experience on the outcomes of different decisions and recent experience is a meaningful guide for the future. These processes do not work well for low-probability, high-consequence events for which the decision maker has limited or no past experience. There is evidence that intuitive thinking plays a role in people poorly estimating the risks posed by climate change. This has relevance for climate adaptation decisions and judging the importance of mitigation policy goals.
A wide range of formal methods and tools have been developed to evaluate alternative options and make choices in a systematic manner even when probabilities are difficult to characterize and/or outcomes are uncertain, characterized as deliberate thinking. These methodologies often focus attention on potential short and long-term consequences and evaluate the options under consideration evenly, not favouring the status quo. The relevance of these decision aids for making more informed choices depends on how the problem is formulated and framed, the nature of the institutional arrangements and the interactions between stakeholders. Alternative frameworks that do not depend on precise specification of probabilities and outcomes can be considered in designing risk reduction strategies for climate change.
Successful policy response strategies and instruments that constitute risk reduction often take into account how a range of stakeholders perceive the likelihoods and consequences associated with climate change and their behavioural responses to uncertain information and data, creating incentives that align with people’s intuitive propensities. One example is the creation of financing mechanisms for cost-effective technologies that allow people to enjoy immediate economic rewards from the investment rather than forcing them to incur a high upfront cost, which discourages them for adopting these measures.
Here we provide a few examples of where CBA is/has been used in a deliberative System 2 fashion for ex-ante flood risk mitigation decision making.
United States
Established in 1988, the Hazard Mitigation Grant Program provides funding to undertake projects aimed at significantly eliminating or reducing future risk from natural hazards including floods. Although a presidential declaration of major disaster triggers the availability of funds event ex-post, certain aspects of the program’s funds are event ex-ante in nature such as the pre-disaster mitigation program. Regardless of the specific grant program, in order to receive any mitigation funding a complete grant application must be submitted for which economic efficiency of the mitigation effort must be demonstrated. The Federal Emergency Management Agency (FEMA) benefit cost analysis (BCA) program is used to demonstrate economic efficiency.
“BCA is the method by which the future benefits of a mitigation project are determined and compared to its cost. The end result is a BCR, which is derived from a project’s total net benefits divided by its total project cost. The BCR is a numerical expression of the cost effectiveness of a project. A project is considered to be cost effective when the BCR is 1.0 or greater.” FEMA BCA Reference Guide (2009)
55
From a flood risk perspective, flood insurance study (FIS) data is utilized to establish risk by taking into account probabilities of flooding. For example, the FIS must indicate the source of flooding as riverine or coastal with the associated 10-, 50-, 100-, and 500-year flood events used as the riverine or coastal flood hazard inputs. FEMA building depth-damage functions are then applied to estimate both building and content losses by building type. Other non-property losses can be estimated as well including displacement and loss of function costs. Possible flood mitigation projects include: Acquisition/Demolition, Acquisition/Relocation, Elevation, Mitigation reconstruction, Dry flood proofing, and Minor localized flood reduction projects such as culverts, floodgates, minor floodwall systems, and stormwater management activities. Detailed cost estimates, including maintenance costs, must be provided for these mitigation efforts. Finally, while cost effectiveness of the mitigation project must be shown through CBA, another important portion of the mitigation grant application is the justification of the decision making process that resulted in identification of the project proposed including a description of the process used to select this project as the best solution to the problem (FEMA BCA Reference Guide 2009).
The Netherlands
Flood management policies in the Netherlands have for centuries focused on preventing floods by building comprehensive connected systems of flood protection infrastructure, consisting of dykes, dunes, sluices, and storm surge barriers. The country depends on these engineering measures for keeping dry two-thirds of its low-lying lands. These flood-protection measures have safety standards such that they should not fail more often than once in 1,250 to 10,000 years. These flood safety standards have been set on the basis of a CBA conducted by ‘The First Delta committee,’ who advised the government on flood protection after a destructive North Sea flood occurred in 1953 (van Dantzig 1956).
Despite these high safety standards, extreme river discharges of the Meuse and Rhine rivers threatened to flood large areas in 1993 and 1995. The main dyke system did not fail during these events, but un-embanked populated areas were flooded and more than 250,000 people and 1 million animals needed to be evacuated. These near-catastrophes resulted in calls for improved flood risk management. In view of climate change, the sustainability of the traditional engineering approach of dyke heightening has been questioned in the Netherlands. After the critical situations in 1993 and 1998, an additional approach has been promoted which is to reduce flood risk by improving the natural dynamics and resilience of water systems. In particular, this entails improving discharge capacities of rivers by land use change, restoration (widening and deepening) of floodplains, expansion of wetlands, and the creation of additional water courses. In addition to reducing flood risk, these alternative flood control policies called ‘Room for the River’ create side benefits, such as the creation of new wildlife habitats, nutrient and contaminant assimilation and recycling, as well as recreational and amenity values.
Brouwer and van Ek (2004) used CBA to evaluate these alternative flood control policies for the lower river delta in the west of the Netherlands, where the Rhine and Meuse flow into the North Sea. This evaluation considers hydraulic, hydrological, ecological, economic and social effects of the alternative flood control policies. Hydrological changes associated with the proposed policies were assessed and translated into their associated ecological effects (vegetation) using a “hydrological-ecological dose-effect model.” The economic value of the expected non-priced social and environmental benefits (public safety, biodiversity conservation and landscape amenities) was based on a meta-analysis of 30 international studies of the economic value of wetlands, expressed as willingness-to pay (WTP). Average WTP values were applied to value the creation of additional wetlands, which is a simple ‘benefit transfer’ valuation method. Stakeholder analysis was used to assess effects of the flood policies on inhabitants of affected areas, farmers, environment (representatives), water supply companies, and
56
recreation. These effects were scored qualitatively, while some were monetized in the CBA. In particular, these include the costs of purchasing (farm) land and of increased damage to crops and grazing in areas that will be incidentally flooded, as well as benefits to the recreational sector. Other cost categories include infrastructure and operation and maintenance costs. Material flood damage avoided is the most important benefit category which was estimated using a flood damage model. This model accounts for an increase in future exposure due to economic growth.
Although investing in higher and stronger dykes is a cost-effective option if financial costs and benefits are considered, the land use changes and floodplain restoration implied by the alternative flood control policy can be justified by a CBA that includes monetized long-term ecological and socio-economic benefits (Brouwer and van Ek 2004). Although a financial (cash flow) CBA results in a €2.1bn net loss, accounting for immaterial economic values of public safety, landscape and nature conservation results in an overall net gain of €860mln in present values, as calculated by an extended economic CBA. The main outcome of this study is that the Dutch government should implement the alternative flood control project “Room for the River.” This is, moreover, supported by a multi-criteria analysis (MCA), although that result is sensitive to qualitative scoring of the immaterial (environmental) benefits of floodplain restoration (Brouwer and van Ek 2004). In general, this study illustrates the importance of including non-financial effects in CBA of flood risk reduction policies if these involve significant environmental effects. A drawback of this particular study is that it does not test sensitivity of the results to the applied benefit transfer method to monetize immaterial values. Nevertheless, this CBA provided the economic rationale for the implementation of the “Room for the River” project, which is currently being implemented in the Netherlands and is planned to be finished in the year 2015.
In order to successfully adapt to climate change and sea level rise, it is recognized in the Netherlands that additional flood protection policies are needed to increase discharge capacities of rivers. For example, the “Second Delta committee,” who advises the government on long-term flood risk reduction, has proposed that safety standard of flood defences should be increased by a factor of ten.
Kind (2013) performs a CBA to estimate optimal safety standards of all protected low-lying areas of the Netherlands. The optimization principle of the CBA is to minimize all costs associated with floods, including flood protection and expected residual flood damages. The latter are estimated over time using a flood risk model which simulates a large number (>600) of inundation scenarios per protected area. This model includes the effects of climate change and economic growth which are based on a single scenario for the year 2050. Applied monetized immaterial damages include the loss of life (€7mln per life), injury (€100,000) and stress or inconvenience (€2,500). Environmental damages were estimated at 2-6% of total flood damage. A small risk premium of 8% of material damages was included to account for individual risk aversion. The CBA shows that it is economically efficient to raise protection standards especially along the rivers Rhine and Meuse. However, for many coastal areas, existing legal flood protection standards are high relative to economically optimal standards. These results are robust to a Monte Carlo uncertainty analysis of 10,000 draws of random distributions of uncertain cost parameters. Although this CBA is comprehensive in the monetization of a variety of immaterial effects of flood protection, it lacks a systematic sensitivity analysis of how overall results depend on the monetization of these individual effects or the assumed discount rate. Overall, the CBA results of Kind (2013) do not support the advice by the ’Second Delta committee’ to raise all flood safety standards by a factor of ten. The Dutch government has not agreed to implement that advice either.
57
NGO and Development Context
Venton et al. (2010) reviews several CBA studies that have been conducted by NGOs on disaster risk reduction in communities in developing countries. In particular, Venton et al. (2010) examines 13 CBA cases in detail of which 3 were implemented by the Red Cross (in Nepal, Philippines and Sudan), to inform ongoing and planned DRR programs.
In general, CBA’s ability to influence decision process and learning for decisions in a development context seems to be limited as a recent internal World Bank review shows. This review shows that the usage of cost-benefit analysis for informing decisions on projects has been declining. CBA seems often only to have been done after key decisions had been taken with the technical analysis often prepared by consultants, while senior project staff appeared to be more interested in aspects related to project safeguards, procurement, and financial management. As another consequence, the potential of CBA to support learning during project appraisal and implementation has been considered very limited (World Bank 2010).
58
7 Other Decision Making Tools for Flood Resilience Investments
The previous sections focussed to a larger extent on the evidence, challenges and opportunities associated with CBA. We now proceed to presenting examples on alternative approaches for decision-support.
7.1 Tool # 1. Cost-Effectiveness Analysis
Table 10 shows the outcome of a CEA on options to control dengue infection in two communities in Antigua and Barbuda (Jerath 2014). In instances such as this one, the decision to undertake the risk reduction activity (reduce instance of dengue fever) was considered a priori to be worthwhile, hence the goal of the analysis was to identify the least costly method for achieving the goal. In this case it was the highest number of people protected against dengue fever for the least per capita cost. The portfolio of measures which were found to be the most cost-effective result in a total cost of $17,678 at $4 per person in Yorks and $3 per person in Piggotts. This table illustrates Watkiss and Hunt’s (2012) assertion that a key strength of CEAs is that they are typically relatively easy to undertake and the results are clearly understood by a wide variety of stakeholders.
Table 10: Cost effectiveness analysis of vector control micro-project in Antigua and Barbuda (FIU)
Hazard Proliferation of mosquitoes
Scope of CEA Health risk for community members against potential dengue infection
Communities served Yorks and Piggotts
DRR Measure Vector Control Micro-project includes:
a. Reducing access of mosquitoes to open stagnant water in households
b. Elimination of mosquitoes at larval and adult stage using chemical treatment
c. Strong public education and awareness campaign
Total Cost $17,678
Benefit or
Unit of Effectiveness
Number of persons protected against potential dengue infection
COMMUNITY-WISE ANALYSIS
Yorks Piggotts
Number of people protected
against dengue infection as
result of DRR measure
2,145 2,865
Cost-Effectiveness Ratio
or CER
(The cost per person of
protecting against potential
dengue infection)
$4 $3
A disadvantage of CEA is that the pre-defined target or policy objective may be economically suboptimal or determined in an arbitrary or not-transparent manner. While the fact that CEA does not consider uncertainty in benefits may be advantageous, the corresponding lack of consideration of uncertainty in costs is a key disadvantage. CEA is not recommended in situations of high uncertainty (Watkiss and Hunt 2012). Finally, Watkiss and Hunt (2012) argue that CEA tends to evaluate technical options and ignores
59
capacity building and non-technical options, for many of the same reasons that CBA does, in particular because the costs are less easily quantified.
One example is an assessment of the cost-effectiveness of seismic retrofit in Romania conducted by the World Bank (World Bank 2004). Cost-effectiveness analysis was used to select possible seismic retrofitting options for a number of sub-projects under a seismic retrofitting component of a comprehensive DRR project. Among others, the selection of sub-projects was guided by their contribution to life safety while the cost of retrofitting was to be minimized below a total of 60 percent of the cost of replacement in disaster events.
Jones et al. (2013) argue that CEA should be applied only in situations where uncertainty is low in regards to both the future risk and the success of the possible interventions. They find that CEA is appropriate in situations such as:
A decision has already been made that investment in the arena in question will take place, and the cheapest and/or most effective option is desired.
The benefits of different investments are thought to be generally equal.
Benefits are considered greater than costs in the long term but difficult to quantify because they are indirect and/or intangible, usually environmental or social.
7.2 Tool # 2. Multi-Criteria Analysis
Multi-criteria analysis (MCA) (also called multi-criteria decision analysis or evaluation) has been identified as a methodology which is particularly useful and popular for environmental decision-making (Huang et al. 2011). In practice, MCA is a broad term referring to a flexible set of decision processes from informal weighting of values exercises to the use of computerized algorithms for ordering options. A key application consideration revolves around who determines weightings. If weightings are determined by one analyst or a small group of experts, then the analysis may have internal consistency and defendable fundamentals, but may lack public acceptance and legitimacy. The potential for MCA to be used in a stakeholder setting is a key strength. When utilized in a stakeholder process MCA can be a framework for stakeholders to jointly articulate values and explore potential trade-offs.
Wood et al. (2014) undertook a participatory MCA approach to address the question of where to place tsunami vertical-evacuation refuges in the coastal community of Ocean Shores (Washington DC, USA). Levy et al., (2007) used a computational MCA to model preferences of multiple stakeholders in the 2000 Tokai floods in Japan and generate recommendations based on preference criteria. Many other MCAs have been conducted relating to flood specifically (Ares and Serra 2008; Rohde et al. 2006; Brouwer and van Ek 2004; Chen and Hou 2004; Kenyon 2007; Levy 2005; Levy et al. 2007; Musungu et al. 2012), and cover a wide range of decisions from project selection through to appraisal in both developed and developing countries. Typically MCA is employed because the benefits are not easily quantifiable. In broad environmental decision-making it is sometimes the case that ‘flood control measures’ are considered as one criterion within a MCA (explained below).
With an emphasis on low cost (not least cost as in CEA, and optimal cost in relation to benefits as in CBA), the methodology is organized around objectives, criteria and indicators. Criteria are attributes, which can be used to compare the performance of different (policy) options in achieving one’s stated objectives (economic, social, environmental and fiscal criteria). As another methodological element, indicators are verifiable measures, which can be used to monitor changes over time and space in the behaviour of the attributes mentioned above. They can be expressed in quantitative (monetary or not) or qualitative terms.
60
The approach is based on the following principles (i) policies have multi-dimensional impacts on human societies and the environment; (ii) the impacts can be clustered into economic, social, environmental and governance categories and objectives in terms of reducing or increasing these impacts, for which criteria (such as improved economic performance or high employment) are specified, which are later measured by way of indicators; (iii) dimensions, criteria and indicators are then weighted subjectively, and can be aggregated to one numerical, dimensionless index, which might be used to compare the performance of different strategies and projects. An advantage of MCA relative to CBA is that it does not require the monetization of difficult to value non-market and/or intangible costs and benefits of DRR, such as ecological effects. However, disadvantages of MCA are that the expression of impacts in different terms than only monetary makes them difficult to compare, weighting of different criteria can be seen as subjective, and decisions based on MCA may be economically sub-optimal.
MCA is seen as an attractive and important decision-support methodology in environmental decision making in particular (Steele et al. 2009). It is probable that MCA is perceived as more palatable and flexible than CBA (and CEA) because it allows for a systematic exploration of options without the need to monetize all values, which as discussed above is often seen as contentious when applied to environmental or social assets, and human lives.
In relation to disasters such as flooding, typically the objective of the MCA is to determine a preferred ordering of the available flood risk reduction options. Options might include dykes of various sizes, ecosystem restoration, retrofitting and building regulations, land use planning or a combination of these. Particularly at the community level, the suite of options to be evaluated is determined by a stakeholder process such as a Shared Learning Dialogue in Moench et al. (2008) and Khan et al. (2012) by the Institute for Social and Environmental Transitions – International (ISET). The outcomes of this process are coupled with a vulnerability analysis and together these inform the MCA. Where each option ranks in the preference order depends on how it rates according to various criteria. Criteria broadly relate to social, economic and environmental objectives, again determined by a stakeholder process (see Steele et al. 2009 for discussion of the application broadly to environmental decisions).
The first step of any MCA analysis is to assess how each option measures up to each criteria separately (Steele et al. 2009; Moench et al. 2008; Khan et al. 2012). Moench et al. (2008) suggest several high level questions to be addressed in the MCA stakeholder process to inform the determination of final criteria for evaluation of options at the community level:
1. Can the relationship between the proposed intervention and the risks faced by communities be clearly demonstrated?
2. Does the proposed strategy have major distributional implications? 3. Is the strategy accessible to the intended beneficiaries? 4. Is the proposed strategy based on a sustainable operational model? 5. Is the strategy consistent with emerging and projected social or other trends? 6. Is the effectiveness of the proposed strategy dependent on key assumptions or threshold values
that may be incorrect or may change? 7. Are the capacities for implementing a given strategy available within the society or can they be
developed with relative ease? 8. Are there additional questions beyond the above that relate to the viability of proposed
strategies in the specific region of concern?
Typically, each option is then scored (either cardinally or ordinally) against each criterion (Steele et al. 2009) (see Tables 11 and 12).
61
Table 11: Qualitative comparison matrix
Source: Khan et al. (2012)
For example, Khan et al.’s (2012) “qualitative CBA” of rural climate adaptation strategies in Nepal follows this process, comprised of stakeholder process to identify options and categorize costs and benefits as economic, social and environmental.
Table 12: Illustrative qualitative ranking
Source: Khan et al. 2012
A scale of 1-to-5 or 1-to-10 was then used to score the costs and benefits of each option. Khan et al. (2012) found that economic costs were fairly easily captured but social and environmental scoring took more deliberation. They emphasize that while this is challenging, this is exactly the strength of the process because it draws explicit attention to these values and creates space for discussion. The process was further deepened when distributional impacts based on gender and poverty were considered.
There exist various methods for aggregating the scores to finally determine where each option falls in the preference ranking. The choice of aggregation method depends on the objectives of the analysis, the data requirements and preference for how mathematical the process is. Similarly various methods are available for assigning weights to the criteria. From the weighted scores the options can then be given a final score and ranked accordingly. Typically the weighted scores are added linearly, although more complex algorithms exist (Steele et al. 2009).
As another example, MCA has been applied to DRR in the UNEP project multi-criteria analysis for Climate Change (MCA4C), which was commissioned to provide practical assistance to governments in preparing climate change mitigation and adaptation strategies. The objective was to assist government decision-makers, particularly in developing countries to identify and examine policy options and measures for climate change that are low cost, environmentally effective and in line with national development priorities (see UNEP 2011; http://www.mca4climate.info). One case study within the MCA4C project looked at increasing structural resilience in Mumbai. One of the options explored was
improving building codes to amend existing building regulations and where necessary, introducing new regulations to ensure that in 20 years’ time all floodplain buildings are on stilts, and earthquake-proof. Figure 17 below shows how the building codes option stacked up against the criteria identified by the stakeholders. The option is measured against each criterion on a scale of 100 (perfect fit) to 0 (no fit at all). The criteria range from public sector costs for creating additional employment, reducing mortality to improving legal context and governance. Some criteria would clearly apply to most flood risk reduction decisions worldwide and are quantifiable, e.g. mortality and public sector cost. Other criteria are especially context specific and much more subjective, such as “improve political stability” which was a consideration in this case due to the impact of flood risk reduction measures on informal settlements and the social/political ramifications that stem from this. A key strength of MCA is the capacity to include these types of intangible impacts if they are identified as important by stakeholders.
Figure 17: Using MCA to score achievement of buildings codes options against key criteria
Source: UNEP 2011
MCA in this project appeared to be a promising process-based tool for achieving buy-in and interest of policy-advisers/makers, yet, as Figure 17 shows, there is a high degree of subjective judgment involved. As a consequence, it is difficult to replicate the evaluation route taken and the choices made by an analyst. In this regard the methodology is more comprehensive, but less rigorous than CBA.
7.3 Tool # 3. Robust Decision-Making Approaches
Decisions, particularly those which have implications in the longer term, need to hold up even if there are unpredictable changes in the future. RDMAs attempt to make risk-based decisions without assigning probabilities to future scenarios. They have developed from a perceived need to make decisions under uncertainty regarding future socioeconomic and climatic conditions, in instances where assigning probabilities is difficult. Further to this is the need to make decisions in situations where stakeholders have very different worldviews and find it difficult to come to consensus regarding, for example, likely future scenarios, and preferences and values. Kalra et al. (2014, pg. 15) define a robust decision as “one that performs well across a wide range of futures, preferences, and worldviews, thought it may not be optimal in any particular one.” RDMA uses ranges or, more formally, sets of plausible probability
63
distributions to describe deep uncertainty that play a role in evaluating alternative strategies for today and the future. In contrast to expected utility theory, it assesses different strategies on the basis of their robustness rather than their optimality. In the context of the design of a facility to reduce the likelihood of damage from storm surge and sea level rise, choosing Design 1* may be optimal based on a specific set of estimates of the likelihood of each scenario occurring. However, Design 2* may have a higher expected loss than Design 1* but much less variance in its outcomes, and thus be a preferred choice by the community.
Kalra et al. (2014) contend that the process of agreeing on robust decisions works by inverting the traditional steps of CBA and MCA outlined above. They argue that traditional decision-making processes first require adequate consensus regarding probable future scenarios, preferences and values. RDMA, on the other hand, starts by exploring options under many future scenarios, without needing consensus on which is likely. Similarly in regards to preferences and values, options are tested against multiple value systems. The “stress-testing” of options under multiple scenarios is used to identify critical vulnerabilities to uncertainties. If the vulnerabilities are significant, then this may discount an option; if they are smaller they may be addressed with small adjustments and/or add-on measures (Chambwera et al. 2014).
Lempert et al. (2013) discuss the case of RDMAs for managing flood risks in Ho Chi Min City. This RDMA engaged stakeholders to evaluate the robustness of various flood risk reduction options and portfolios thereof. Computational runs simulated 1,000 scenarios with a spread of socio-economic and climatic uncertainty. The plan identified by more traditional risk reduction processes was found to be fairly robust for future population and economic trends. However the analysis found that it was not robust to increases in rainfall intensity and river rise that have a good chance of occurrence due to climate change. The process allowed for the identification of additional measures to reinforce the plan in case of rainfall increase and river rise.
64
Figure 18: Risk reduction strategies in Ho Chi Minh City, and their robustness to increases in river levels and rainfall intensity.
Source: Lempert et al. 2013
This example illustrates how climate information can be used to identify various thresholds or bounding cases beyond which certain policies will fail. In some cases robust decision methods generate probability thresholds for certain scenarios above which a decision maker might choose a different risk reduction strategy.
The iterative and repeated analysis with varying assumptions and scenarios, across multiple variables, means that formal RDMAs can be very complex, requiring statistical and mathematical expertise (see Lempert and Collins 2007; Ranger et al. 2010). However the broad concept of ‘robust decisions’ is applicable at many levels. A qualitative framework has been worked out in the IPCC SREX framed around the concept of low regrets. Such options are defined as follows:
“Measures that provide benefits under current climate and a range of future climate change scenarios, called low-regrets measures, are available starting points for addressing projected trends in exposure, vulnerability, and climate extremes. They have the potential to offer benefits now and lay the foundation for addressing projected changes (high agreement, medium evidence). Many of these low-regrets strategies produce co-benefits, help address other development goals, such as improvements in livelihoods, human well-being, and biodiversity conservation, and help minimize the scope for maladaptation.” (IPCC 2012).
As one example, managing drought risk in the context of food insecurity in West Africa may be an interesting case in point. Drought risk is a concern of life and death for the Sub-Saharan region, and in West Africa, droughts have been observed over the last few decades to exhibit an increasing trend. In IPCC terminology, confidence in this trend truly occurring is medium, meaning rather solid, but not fully
65
pervasive. Projections suggest that droughts may increase in the future, but with only low confidence. This signal induced by climate change appears thus weak, probably too weak to commit action of climate adaptation on future droughts to serious review, including economic analysis using CBA. Yet, importantly, there are many risk factors and options creating benefits now and likely in the future that can be tackled. Among the risk factors are today’s rainfall variability (hazard), population growth (exposure), ecosystem degradation and poor health and educational systems affecting vulnerability. Among the options that can be taken are improved water management, sustainable farming practices, drought resistant crops and drought forecasting. This approach thus overall emphasises effective and robust portfolios of risk reduction as well as systemic interventions. The framing of low regrets options analysis discussed here and in the IPCC publication is largely conceptual, yet there are analytical tools that can be employed to operationalise the concepts, and application has occurred to environmental and climate change related problems.
66
8 Concluding Remarks
There is increasing interest and need to make the economic case for increased investments into DRR by policymakers including community and national disaster managers, government officials charged with investment decisions, donors, NGOs and international financial institutions. The focus of applied work has been largely on CBA; while there is increasing interest in the use of other tools such as cost-effectiveness analysis, multi-criteria analysis and robust decision-making approaches. These tools are not applied as widely as CBA, and their applicability needs to be further studied.
Our discussion started with an examination of the applicability of CBA for resilience interventions. CBA is focused on economic efficiency only, which has led to it being heavily criticized as being too restrictive. However, if the core element of the strategy at stake is public investment, then using CBA to help such decisions can be defended.
CBA is a quantitative technique and thus requires a certain expertise and access to data. This should not constitute an obstacle to its implementation though. As we show in this report, there are a limited number of steps to follow to perform a risk-based CBA, all of which have been done in numerous contexts now. In several developed countries (e.g., France, UK, USA), the use of CBA is required for a number of investments that use government funds. We illustrated how CBA has been used with significant benefits in developed and developing countries alike. We find CBA as a decision-support tool indeed useful, yet mostly for hard-infrastructure type of options and a context with good and sufficient data. This is often likely to be case in an OECD-context, less so for applications in developing countries.
The extent to which government investment decisions on DRR are really informed by cost-benefit assessments remains an open question. Also, the applicability becomes more limited, particularly for a developing country characterised by a shifting emphasis from infrastructure-based options (such as large dam projects) to preparedness and systemic interventions (such as institutions and human resources needed to reduce risk and prepare).
Going beyond CBA, we showed also that there are complementary decision tools that have been developed, such as cost-effectiveness analysis, multi-criteria analysis and robust decision-making approaches, that can been used with important benefits. Having such a tool kit at the disposal of local, region and national decision makers will be key to balancing among different investment options, or selecting the best options given limited budget.
Options for going forward: Applying a decision-support toolbox CBA should never be used in isolation, but should be part of a wider assessment and decision-making process that includes stakeholder participation; detailed participatory analysis of the factors contributing to flood risk and vulnerability; quantitative and qualitative methods for evaluating the impacts of flood disasters; and transparent and inclusive processes for qualitative and quantitative data collection and analysis (IFRC 2010).
Thus, as a way forward, we propose that CBA and other relevant decision making techniques discussed here may be integrated into existing community participatory approaches such as the Red Cross (IFRC)’s Vulnerability Capacity Assessments (VCA), or Practical Action’s use of the Participatory Capacity and Vulnerability Assessment (PCVA), in order to ensure the application of their systematic decision making capabilities. The IFRC and Practical Action in working with communities on implementing flood DRR activities already extensively use participatory assessment processes to gather, organize and analyse information on the vulnerability and adaptive capacity of the communities. Additionally, these participatory processes are completed in conjunction with the collection of secondary information to
67
provide a baseline of communities risk to different hazards. Therefore, linking to VCA/PCVA, in particular, provides a good entry point for collecting baseline and monitoring data on risk and resilience, as well as for gleaning community views on potential costs and benefits. What is more, the impact-driven and quantitative thinking needed for decision making can be leveraged through VCA/PCVA to enable communities to gain potentially non-traditional perspectives of their own vulnerability and risk, especially around current and future risk, and to develop innovative approaches to community-based DRR and resilience. To integrate such decision-making tools with existing VCA/PCVA processes, practitioners would likely simply need to add lines of questioning to the existing process of gathering quantitative data on outcomes and impacts in the field.
Going beyond the vulnerability and capacity assessments, from a truly integrated perspective, decision tools may be helpful if utilized from the outset of a community-based flood resilience initiative, where they can improve accuracy and reliability. Unless solid flood risk and resiliency baselines have been put in place at the start of the flood resilience-enhancing initiative, ex-post analyses require baselines to be reconstructed retroactively. This is generally difficult, and will affect the quality of the assessments. CBA and other tools add a more quantitative approach to existing qualitative decision-support tools utilized in the VCA/PCVA processes. As such, they can be adapted to operate in line with existing processes, such as VCA/PCVA and to enhance project review and revision processes arising from routine monitoring and evaluation.
Work over the next several years on decision making under risk and uncertainty as part of the Zurich flood resilience alliance program will address decision making for policy makers, analysts and implementers and further develop and apply methodologies in order to quantify the relative costs and benefits of flood protection measures, implementable at the appropriate level. These developed methodologies in turn will help inform the relevant partners, potential donors, governments, as well as individuals and businesses at risk, on the costs and benefits of investing in flood risk reduction with an emphasis on pre-event investment.
Figure 19 is an illustrative example of how specifically CBA might be built into the Zurich flood resilience alliance decision-making process beginning from site/community selection to monitoring and evaluation of the implemented flood DRR initiatives. For example, in selecting the communities in which to work, it is imperative that a transparent, impartial, and consistent process be in place in order to minimize unwanted external influences in the community selection process. Existing CBA evidence on the returns to the various flood DRR initiatives could be useful in this regard to potentially highlight underinvested areas. Further, once the VCA/PCVA process has started in the selected communities, CBAs can potentially provide two useful roles here: (1) to assist in the decision-making process of which DRR strategies to employ based upon the economic efficiency criterion, or (2) to provide insight into the intangible benefits of the various DRR initiatives to assist in prioritizing them for a further quantitative analysis. Finally, as has been shown earlier in section 3.2 in regard to the CBAs implemented by the IFRC and PA from an ex-post perspective, CBA is useful in monitoring just how effective the various DRR initiatives have been given their implementation. Further understanding, developing, applying and testing the role in a community case study context of a decision toolbox comprised of the different tools (not just CBA) importantly along this entire flood DRR implementation spectrum will be a key focus of the future work under the alliance.
68
Figure 19: Entry points for using decision-support tools for building flood resilience
Importantly, this work will also directly connect with complementary work being done by all the partners of the Zurich flood resilience alliance on operationalizing community flood resilience. Further work of the alliance will build on this notion and over the next years test, refine and implement some of the thinking presented here, which will help to take the debate further on making informed decisions on DRR that are efficient, equitable and acceptable to the beneficiaries of DRR interventions.
69
9 References
ActionAid (2005). Participatory Vulnerability Analysis, A Step-by-Step Guide for Field Staff.
ADPC and UNDP (Asian Disaster Preparedness Center and United Nations Development Programme). (2005). Integrated flood risk reduction in Asia. Bangkok: ADPC and UNDP. http://www.adpc.net/maininforesource/uDRR/floodprimer.pdf
Aerts, J.C.J.H. and Botzen, W.J.W. (2011). Climate-resilient waterfront development in New York City: Bridging flood insurance, building codes, and flood zoning. Annals of the New York Academy of Sciences, 1227: 1-82.
Aerts, J.C.J.H., Botzen, W.J.W., de Moel, H. and Bowman, M. (2013a). Cost estimates for flood resilience and protection strategies in New York City. Annals of the New York Academy of Sciences, 1294: 1-104.
Aerts, J.C.J.H., Botzen, W.J.W., Emanuel, K., Lin, N.de Moel, H. and Michel-Kerjan, E. (2014). Evaluating Flood Resilience Strategies for Coastal Mega-Cities: The Case of New York City. Science 344: 473-475.
Aerts, J.C.J.H., Lin, N., Botzen, W.J.W., Emanuel, K. and de Moel, H. (2013b). Low probability flood-risk modeling for New York City. Risk Analysis, 33(5): 772-788.
Anderson, M.B., and Woodrow, P.J. (1991). Reducing vulnerability to drought and famine: Developmental approaches to relief. Disasters, 15(1), 43-54.
Ares J., and Serra J. (2008). Selection of sustainable projects for floodplain restoration and urban wastewater management at the lower Chubut River valley (Argentina). Landscape and Urban
Planning 85: 215–227.
Balbi, S., Giupponi, C., Olschewski, R. and Mojtahed, V. (2013). The economics of hydro-meterological disasters: approaching the estimation of the total costs, BC3 Working Paper Series 2013-12, Basque Centre for Climate Change (BC3), Bilbao, Spain.
Barnett, B.J., C.B. Barrett, and J.R. Skees. 2008. “Poverty Traps and Index-Based Risk Transfer Products.” World Development 36: 1766-1785.
Benson, C. and Twigg, J. (2004). Measuring mitigation: Methodologies for Assessing Natural Hazard Risks and the Net benefits of Mitigation - A Scoping Study. International Federation of Red Cross and Red Crescent Societies (IFRC); ProVention Consortium, Geneva.
Bhavnani Sharma, R., Hochrainer, S. and Mechler, R. (2010). Impact Assessment of Disaster Microinsurance for Pro-Poor Risk reduction: Evidence from South Asia. All India Disaster Management Institute (AIDMI), Ahemadabad, Gujarat, India.
Brent, R.J. (1998). Cost-Benefit Analysis for Developing Countries. Cheltenham, Edward Elgar.
Brouwer, R. and van Ek, R. (2004). Integrated ecological, economic and social impact assessment of alternative flood control policies in the Netherlands. Ecological Economics, 50: 1-21.
BTRE (2002). Benefits of Flood Mitigation in Australia. Bureau of Transport and Regional Economics, Commonwealth of Australia: Canberra.
Burby, R., (ed.) (1991). Sharing Environmental Risks. How to control Governments' Losses in Natural Disasters. Westview Press Boulder, Colorado.
Cavallo, E. and Noy, I. (2010). The Economics of Natural Disasters: A Survey, IDB Working Paper No. 35. Available at SSRN: http://ssrn.com/abstract=1817217 or http://dx.doi.org/10.2139/ssrn.1817217.
CCRIF - Caribbean Catastrophe Risk Insurance Facility (2010). Enhancing the Climate Risk and Adaptation Fact Base for the Caribbean. An informational brochure highlighting the preliminary results of the ECA Study. CCRIF.
Chambwera, M., G. Heal, C. Dubeux, S. Hallegatte, L. Leclerc, A. Markandya, B.A. McCarl, R. Mechler, and J.E. Neumann (2014). Economics of adaptation. In: Climate Change 2014: Impacts, Adaptation, and Vulnerability. Part A: Global and Sectoral Aspects. Contribution of Working Group II to the Fifth Assessment Report of the Intergovernmental Panel on Climate Change [Field, C.B., V.R. Barros, D.J. Dokken, K.J. Mach, M.D. Mastrandrea, T.E. Bilir, M. Chatterjee, K.L. Ebi, Y.O. Estrada, R.C. Genova, B. Girma, E.S. Kissel, A.N. Levy, S. MacCracken, P.R. Mastrandrea, and L.L. White (eds.)]. Cambridge University Press, Cambridge, United Kingdom and New York, NY, USA, pp. XXX-YYY.
Chen S.Y., and Hou Z.C. (2004). Multicriterion decision making for flood control operations: Theory and applications. Journal of the American Water Resources Association; 40: 67–76.
Cropper, M. and Sahin, S. (2009) Valuing Mortality and Morbidity in the Context of Disaster Risks, World Bank Policy Research Working Paper # 4832, World Bank Development Research Group, http://elibrary.worldbank.org/doi/pdf/10.1596/1813-9450-4832.
Czajkowski, J., Kunreuther,H. and Michel-Kerjan, E. (2012). A Methodological Approach for Pricing Flood Insurance and Evaluating Loss Reduction Measures: Application to Texas. Center for Risk Management, The Wharton School, Philadelphia, PA.
Czajkowski, J., Kunreuther, H. and Michel-Kerjan, E. (2013). Quantifying Riverine and Storm-Surge Flood Risk by Single Family Residence: Application to Texas. Risk Analysis, 33(12): 2092-2110.
Dasgupta, A.K. and. Pearce, D.W. (1978). Cost-Benefit Analysis: Theory and Practice. Macmillan, London.
Davis, I. (2004). Progress in analysis of social vulnerability and capacity. In: Bankoff, G., Frerks, G., Hilhorst, D. (eds.): Mapping Vulnerability: Disasters, Development and People. London: Earthscan: 128-144.
Dedeuwaerdere, A. (1998). Cost-benefit analysis for natural disaster management: A case study in the Philippines. Center for Research on the Epidemiology of Disasters (CRED), Brussels.
ECA-Economics of Climate Adaptation Working Group (2009). Shaping Climate-Resilient Development: A Framework for Decision Making Study. Report of the Economics of Climate Adaptation Working Group, New York, NY.
ERN-AL (2010). Seismic risk assessment of schools in the Andean region in South America and Central America. Bogotá, Colombia, Barcelona, Spain, and México DF: Consortium Evaluación de Riesgos Naturales – América Latina.
Eucker, D., Bolte, P., and Rahmadana, M.F. (2012). The long road to resilience. Impact and cost-benefit analysis of community-based disaster risk reduction in Bangladesh. Bangladesh Red Crescent Society (BDRCS).
Federal Emergency Management Agency (FEMA) (1998). Protecting Business Operations: Second Report on Costs and Benefits of Natural Hazard Mitigation. Federal Emergency Management Agency, Washington DC.
Federal Emergency Management Agency (FEMA) (2009). Department of Homeland Security BCA Reference Guide. Available at: http://www.fema.gov/media-library/assets/documents/18870 (last accessed July 2014).
Gowdy, J. (2007). Toward an experimental foundation for benefit-cost analysis. Ecological Economics 63: 649-655.
Grossi, P., and Kunreuther, H. (eds.) (2005). Catastrophe modeling: A new approach to managing risk. New York: Springer.
HMT (2007). The Green Book. Appraisal and Evaluation in Central Government Treasury Guidance. Her Majesty’s Treasury. London: TSO.
Hausman, J. (1997). Individual Discount Rates and the Purchase and Utilization of Energy-Using Durables. The Bell Journal of Economics 10: 33-54.
Hawley, K., Moench, M., Sabbag, L. (2012). Understanding the Economics of Flood Risk Reduction: A Preliminary Analysis. Institute for Social and Environmental Transition-International; Boulder, CO.
Hochrainer, S. (2005). Macroeconomic Risk reduction against Natural Disasters. Deutscher Universitaets-Verlag, Wiesbaden, Germany.
Hochrainer, S. (2006). Macroeconomic Risk reduction against Natural Disasters. Wiesbaden: German University Press (DUV).
Hochrainer, S. (2009) Assessing the Macroeconomic Impacts of Natural Disasters: Are there any? World Bank Research Paper #4968, http://papers.ssrn.com/sol3/papers.cfm?abstract_id=1427628.
Hochrainer, S., Kull, D.,. Patnaik, U., Praveen, S., and Shiraz, W. (2011). Disaster Risk Financing and Poverty Traps for Poor Households: Realities in Northern India. International Journal of Mass Emergencies and Disasters.
Hochrainer-Stigler, S., Kunreuther, H., Linnerooth-Bayer, J., Mechler, R., Michel-Kerjan, E., Muir-Wood, R., Ranger, N, Vaziri, P. and Young, M. (2010). The Costs and Benefits of Reducing Risk from Natural Hazards to Residential Structures in Developing Countries. Working Paper #2010-12-01. The Wharton School, University of Pennsylvania, Philadelphia, PA, USA.
Hoff, H., Bouwer, L., Berz, G., Kron, W., and Loster, T. (2003). Risk reduction in Water and Climate – the Role of Insurance and Other Financial Services, Munich Reinsurance Company, Munich.
Horton, R., Gornitz, V., Bowman, M., and Blake, R. (2010). Climate observations and projections. Annals of the New York Academy of Sciences, 1196: 41-62.
Huang, I., Keisler, J. and Linkov, I. (2011). Multi-criteria decision analysis in environmental sciences: Ten years of applications and trends. Science of the Total Environment 409: 3578–3594.
IFRC/RC (2010). Cost–benefit analysis of community-based disaster risk reduction, Red Cross Red Crescent lessons learned, recommendations and guidance - http://preparecenter.org/resources/cost%E2%80%93benefit-analysis-community-based-disaster-risk-reduction-red-cross-red-crescent.
IPCC (2012). Managing the Risks of Extreme Events and Disasters to Advance Climate Change Adaptation. Eds. [Field, C. B., Barros, V., Stocker, T.F., Qin, D., Dokken, D., Ebi, K.L., Mastrandrea, M. D., Mach, K. J., Plattner, G.-K., Allen, S., Tignor, M. and P. M. Midgley (eds.)]. Cambridge University Press, Cambridge, United Kingdom and New York, NY, USA.
Islam, N. and Mechler, R. (2007). ORCHID: Piloting Climate Risk Screening in DFID Bangladesh. An Economic and Cost Benefit Analysis of Adaptation Options. Institute of Development Studies, University of Sussex, UK.
Jerath, M. (2014). Cost Effectiveness Analysis (CEA) of Vector Control Micro-Project in Antigua and Barbuda.
Jones, R.N., Young, C.K., Handmer, J., Keating, A., Mekala, G.D., Sheehan, P. (2013). Valuing adaptation under rapid change, National Climate Change Adaptation Research Facility, Gold Coast.
Kahneman, D. (2003). Maps of bounded rationality: A perspective on intuitive judgment and choice." American Economic Review, 1449-1475.
Kahneman, D. (2011). Thinking, Fast and Slow. Farrar, Straus and Giroux, New York.
Kalra, N., Hallegatte, S., Lempert, R., Brown, C., Fozzard, A., Gill, S. and Shah, A. (2014). Agreeing on Robust Decisions: New Processes for Decision Making Under Deep Uncertainty, World Bank, Policy Research Working Paper #6906, http://www-wds.worldbank.org/external/default/WDSContentServer/IW3P/IB/2014/06/04/000158349_20140604102709/Rendered/PDF/WPS6906.pdf.
Keating, A., Campbell, K., Mechler, R., Michel‐Kerjan, E., Mochizuki, J., Kunreuther, H., Bayer, J., Hanger, S., McCallum, I., See, L., Williges, K., Atreya, A., Botzen, W., Collier, B., Czajkowski, J., Hochrainer, S., Egan, C. (2014). Operationalizing Resilience Against Natural Disaster Risk: Opportunities, Barriers and A Way Forward, Zurich Flood Resilience Alliance, <http://www.iiasa.ac.at/web/home/research/researchPrograms/RiskPolicyandVulnerability/Operationalizing_Resilience_Against_Natural_Disaster_Risk_II.pdf>
Kellett, J. and Caravani, A. (2013). Financing disaster risk reduction: A 20-year story of international aid, ODI and the Global Facility for Disaster Reduction and Recovery at the World Bank, London / Washington.
Kempton, W. and Neiman, M. (eds.) (1987). Energy Efficiency: Perspectives on Individual Behavior, American Council for an Energy Efficient Economy, Washington, DC.
Kenyon W. (2007). Evaluating flood risk reduction options in Scotland: A participant-led multi-criteria
approach. Ecological Economics; 64: 70–81.
Khan, F., Moench, M., Reed, S. O., Dixit, A., Shrestha, S. and Dixit, K. (2012). Understanding the Costs and Benefits of Disaster Risk Reduction Under Changing Climate Conditions: Case Study Results and Underlying Principles, 100 pp, ISET-International: Bangkok.
Kind, J. (2013). Economically efficient flood protection standards for the Netherlands. Journal of Flood Risk reduction, DOI: 10.1111/jfr3.12026.
Kull, D., Mechler, R. and Hochrainer-Stigler, S. (2013). Probabilistic Cost-Benefit Analysis of Disaster Risk Management in a Development Context. Disasters 37(3): 374-400.
Kull, D., Singh, P. and Chopde, S. (2008). From Risk to Resilience. Evaluating Costs and Benefits of Flood Reduction under Changing Climatic Conditions: Case of the Rohini River Basin, India. Risk to Resilience Working Paper 5. Moench, M., Caspari, E. and A. Pokhrel (eds.), ISET, ISET-Nepal and ProVention, Kathmandu, Nepal. Provention Consortium, Geneva.
Kunreuther, H., Ginsberg, R., Miller, L., Sagi, P., Slovic, P., Borkan B. and Katz N. (1978). Disaster Insurance Protection: Public Policy Lessons. New York: John Wiley and Sons.
Kunreuther, H. (2000).Decision making for protective measures. Extreme Events: Developing A Research Agenda for the 21st Century (National Science Foundation).
Kunreuther, H. and Michel-Kerjan, E. (2011). At War with the Weather. Cambridge: MIT Press.
Lempert, R. and Collins M. (2007). Managing the Risk of Uncertain Threshold Responses: Comparison of Robust, Optimum, and Precautionary Approaches. Risk Analysis 27: 1009-1026.
Lempert, R., Kalra, N., Peyraud, S., Mao, Z., Tan, S.B., Cira, D. and Lotsch A. (2013). Ensuring robust flood risk reduction in Ho Chi Minh City, Policy Research Working Paper 6465. The World Bank.
Levenson, L. (1992). Residential Water Heater Damage and Fires Following the Loma Prieta and Big Bear Lake Earthquakes. Earthquake Spectra, 8:595-604.
Levy J.K. (2005). Multiple criteria decision making and decision support systems for flood risk reduction. Stochastic Environmental Research and Risk Assessment; 19: 438–447.
Levy J.K., Hartmann J., Li K.W., An Y.B., and Asgary A. (2007). Multi-criteria decision support systems for flood hazard mitigation and emergency response in urban watersheds. Journal of the American Water Resources Association 43: 346–358.
Lin, N., Emanuel, K., Oppenheimer, M., Vanmarcke, E. (2012). Physically based assessment of hurricane surge threat under climate change. Nature Climate Change, 1389: 462-467.
Little, I. and Mirrlees J. (1990). Project Appraisal and Planning Twenty Years On. In: S. Fischer, D. de Tray and S. Shah (eds.), Proceedings of the World Bank Annual Conference on Development Economics. The World Bank, Washington DC.
Lloyd’s of London (2008). Coastal Communities and Climate Change: Maintaining Future Insurability. Part of the 360 Risk Project www.lloyds.com.
Loewenstein, G., and Prelec, D. (1992). Anomalies in intertemporal choice: Evidence and an interpretation. Quarterly Journal of Economics. 107 (2) 573-597.
Markantonis, V., Meyer, V. and Schwarze, R. (2012). Valuating the intangible effects of natural hazards – review and analysis of the costing methods. Natural Hazards and Earth System Science 12:1633-1640.
Mechler, R. (2004). Natural Disaster Risk reduction and Financing Disaster Losses in Developing Countries, Verlag für Versicherungswirtschaft, Karlsruhe.
Mechler, R. (2005). Cost-benefit analysis of natural disaster risk reduction in developing countries. Deutsche Gesellschaft für Technische Zusammenarbeit (GTZ). Arbeitskonzept. Eschborn, Germany.
Mechler, R. (2012). Reviewing the economic efficiency of disaster risk reduction. Background paper for Foresight Project "Improving Future Disaster Anticipation and Resilience." UK Government Science Office.
Mechler, R., Hochrainer, S., Kull, D., Chopde, S., Singh, P., Opitz-Stapleton, S., Wajih, S. (2008). Uttar Pradesh Drought Cost-Benefit Analysis. Risk to Resilience Working Paper 4. Moench, M., Caspari, E. and A. Pokhrel (eds.), ISET, ISET-Nepal and ProVention, Kathmandu, Nepal. Provention Consortium, Geneva.
Mechler, R. and Islam, N. (2013). Cost Benefit Analysis of Disaster Risk reduction and Climate Adaptation in Bangladesh. In: D. Guha-Sapir and I. Santos. The Economic Impacts of Natural Disasters. Assessing the Costs of Prevention, Mitigation and Adaptation. Cambridge University.
Michel-Kerjan, E., Hochrainer-Stigler, S., Kunreuther, H., Linnerooth-Bayer, Mechler, R. Muir-Wood, R., Ranger, N., Vaziri, P., and Young, M. (2012). Catastrophe Risk Models for Evaluating Disaster Risk Reduction Investments in Developing Countries. Risk Analysis 33(6): 984-99.
Mileti, D. (1999). Disasters by Design: A Reassessment of Natural Hazards in the United States. National Academies Press.
Ministry of Agriculture (2001). Flood and Coastal Defence Project Appraisal Guidance. Overview. Ministry of Agriculture, London.
MMC (2005). Natural Hazard Mitigation Saves: An Independent Study to Assess the Future Savings from Mitigation Activities. Volume 2-Study Documentation. Multihazard Mitigation Council, Washington DC.
Moench, M., Ahmed, S., Mustafa, D., Khan, F., Mechler, R., Kull, D., Dixit, A., S. Opitz-Stapleton and The Risk to Resilience Study Team (2008). Moving from Concepts to Practice: A Process and Methodology Summary for Identifying Effective Avenues for Risk reduction Under Changing Climatic Conditions, From Risk to Resilience Working Paper No. 8, eds. Moench, M., Caspari, E. and A. Pokhrel, ISET, ISET-Nepal and ProVention, Kathmandu, Nepal, 44 pp.
Moench, M., Mechler, R, Stapelton, S, (2007). The Costs and Benefits of Disaster Risk reduction and Cost Benefit Analysis. Background paper prepared for UNISDR High level Platform on Disaster Risk Reduction. Geneva, June 4-7, 2007.
Mora, M.G., Ordaz, M., Yamin, L.E., Cardona, O.D. (2009). Relaciones beneficio costo probabilistas del refuerzo sísmico de edificios. Memorias del IV Congreso Nacional de Ingeniería Sísmica. Pereira, Colombia mayo 13, 14 y 15 de 2009.
Musungu, K., Motala, S. and Smit, J. (2012) Using Multi-criteria Evaluation and GIS for Flood Risk Analysis in Informal Settlements of Cape Town: The Case of Graveyard Pond. South African Journal of Geomatics 1(1).
Nakicenovic, N. and Swart R. (eds.) (2000). Special Report on Emission Scenarios. Intergovernmental Panel on Climate Change, Geneva.
New York City (2013). A Stronger More Resilient New York. New York City. Available at: http://www.nyc.gov/html/sirr/html/report/report.shtml.
Nicholls, R., Hanson, S., Herweije,r C., Patmore, N., Hallegatte, S., Corfee-Morlot, J., Chateau, J., and Muir-Wood, R. (2007). Ranking port cities with high exposure and vulnerability to climate extremes: Exposure estimates. OECD Environment Working Paper 1, ENV/WK(1)2007.
Opitz-Stapleton, S. and Gangopadhyay, S. (2011). A non-parametric, statistical down scaling algorithm applied to the Rohini River Basin, Nepal. Theoretical and Applied Climatology 103(3-4), 375-386. doi: 10.1007/s00704-010-0301-z.
Penning-Rowsell, E., Green, C., Thompson, P., Coker, A., Tunstall, S., Richards, C. and Parker, D. (1992). The Economics of Coastal Management - A Manual of Benefit Assessment Techniques (The Yellow Manual). London.
Ranger, N., Millner, A., Dietz, S., Fankhauser, S., Lopez, A. and Ruta, G. (2010). Adaptation in the UK: a decision making process. Grantham/CCCEP Policy Brief funded by the Adaptation Sub-Committee.
Rohde S, Hostmann, M, Peter, A, Ewald, K.C. (2006). Room for rivers: An integrative search strategy for floodplain restoration. Landscape and Urban Planning 78: 50–70.
75
Sen, A. (1999). Poverty and Famines. Oxford University Press, Delhi.
Smyth, A.W., Altay, G., Deodatis, G., Erdik, M., Franco, G., Gülkan, P., Kunreuther, H., Luş, H., Mete, E., Seeber, N., and Yüzügüllü Ö. (2004). Probabilistic Benefit-Cost Analysis for Earthquake Damage Mitigation: Evaluating Measures for Apartment Houses in Turkey. Earthquake Spectra, February.
Steele, K., Carmel, Y., Cross, J. and Wilcox, C. (2009). Uses and Misuses of Multicriteria Decision Analysis (MCDA) in Environmental Decision Making, Risk Analysis 29(1): 26-33.
Stern, N. (2006). The Economics of Climate Change: The Stern Review. London, Cabinet Office – HM Treasury.
Subbiah, A., Bildan, L. and Narasimhan, R. (2008). Assessment of the Economics of Early Warning Systems for Disaster Risk Reduction. Background Paper for World Bank - UN Project on the Economics of Disaster Risk Reduction. World Bank.
UNEP (2011) A Practical Framework for Planning Pro-Development Climate Policy, MCA4Climate Final Report, United Nations Environment Program, Milan http://www.mca4climate.info/_assets/files/FINAL_MCA4report_online.pdf.
United Nations Framework Convention on Climate Change The Nairobi Work Programme on Impacts, Vulnerability, and Adaptation to Climate Change (2011). Assessing the Costs and Benefits of Adaptation Options An Overview of Approaches. http://unfccc.int/resource/docs/publications/pub_nwp_costs_benefits_adaptation.pdf.
UNISDR (United Nations International Strategy for Disaster Reduction) (2004) Living with Risk: A Global Review of Disaster Reduction Initiatives. United Nations, Geneva.
van Dantzig, D. (1956). Economic decision problems for flood prevention. Econometrica, 24(3): 276-287.
Venton, C., Fitzgibbon, C., Shitarek, T., Coulter, L. and Dooley, O. (2012). The Economics of Early Response and Disaster Resilience: Lessons From Kenya and Ethiopia. Final Report.
Venton, C. and Venton, P. (2004). Disaster preparedness programmes in India: A cost benefit analysis. Humanitarian Practice Network, ODI, London.
Venton, C., Venton, P. and Shaig A. (2010). Cost Benefit Study of Disaster Risk Mitigation Measures in Three Island in the Maldives. United Nations Development Programme: Malé.
Viscusi, K. and Aldy, J. (2003). The Value of a Statistical Life: A Critical Review of Market Estimates Throughout the World. Journal of Risk and Uncertainty, 21(1): 5-76.
Watkiss, P. and Hunt, A. (2012). Cost- effectiveness analysis: Decision Support Methods for Adaptation, MEDIATION Project, Briefing Note 2.
Wenz, P. (1988). Environmental Justice. State University of New York Press, New York.
White, B. and Rorick M. (2010). Cost-Benefit Analysis for Community-Based Disaster Risk Reduction in Kalali, Nepal. Mercy Corps Nepal.
Willenbockel, D. (2011) A Cost-Benefit Analysis of Practical Action’s Livelihood-Centred Disaster Risk Reduction Project in Nepal. Brighton: IDS.
World Bank (1996). Argentina Flood Protection Project. Staff Appraisal Report 15354, World Bank, Washington DC.
World Bank (2004). Project Appraisal Document on a Proposed Loan in the Amount of US$150 million and a grant from the Global Environment Facility in the Amount of US$7 million for Government of Romania for a Hazard Risk Mitigation and Emergency Preparedness Project. Report No: 282 17 RO. Washington DC: World Bank, Environmentally and Socially Sustainable Development Unit, Europe and Central Asia Region, 2004.
World Bank (2010). Cost Benefit Analysis in World Bank Projects. The International Bank for Reconstruction and Development/. World Bank. Washington DC.
World Bank and United Nations (2010). Natural Hazards, UnNatural Disasters: The Economics of Effective Prevention. World Bank, Washington DC.
Wood, N., Jones, J. and Schelling, J. (2014). Tsunami vertical-evacuation planning in the U.S. Pacific Northwest as a geospatial, multi-criteria decision problem. International Journal of Disaster Risk Reduction 9: 68-83.