Making it in America: Outlook for manufacturing and automation in the United States CONFIDENTIAL AND PROPRIETARY Any use of this material without specific permission of McKinsey & Company is strictly prohibited January 2018 Rated #1 Think Tank 2016 (private sector category) by the Global Think Tank Index, University of Pennsylvania
Transcript
Making it in America:Outlook for manufacturing and automation in the United States
CONFIDENTIAL AND PROPRIETARYAny use of this material without specific permission of McKinsey & Company is strictly prohibited
January 2018
Rated #1 Think Tank 2016 (private sector category) by the Global Think Tank Index, University of Pennsylvania
2McKinsey & Company
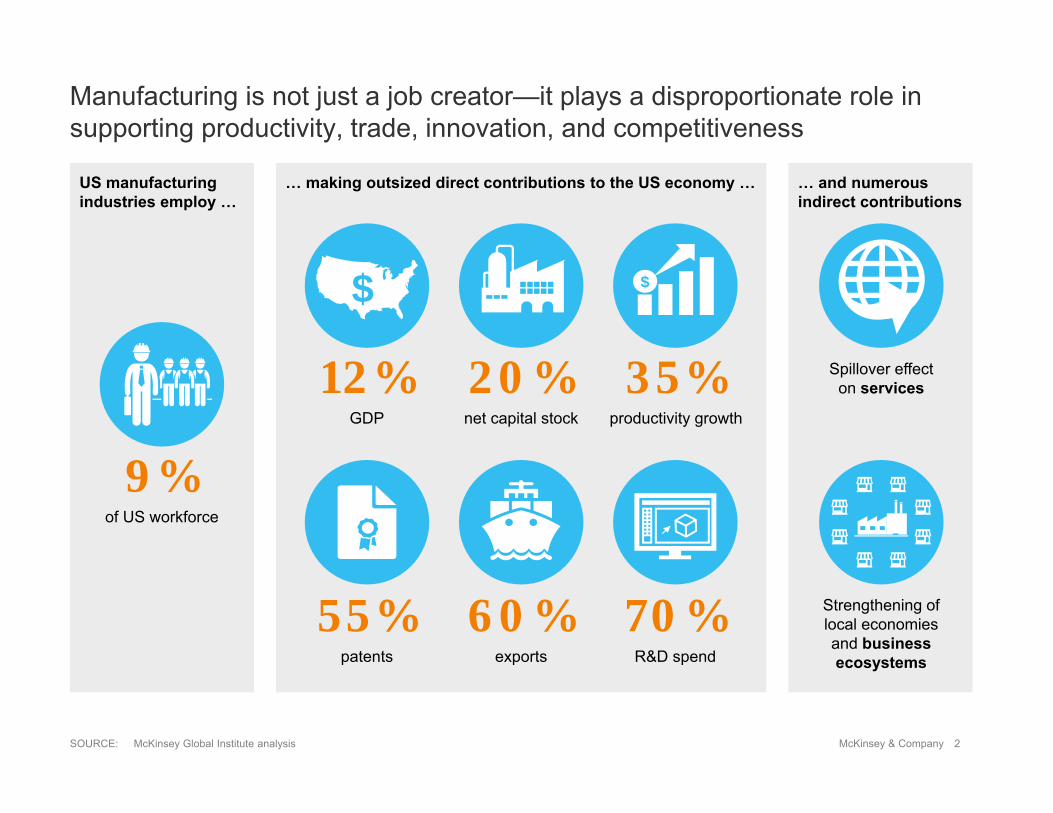
… and numerous indirect contributions
US manufacturing industries employ …
… making outsized direct contributions to the US economy …
Manufacturing is not just a job creator—it plays a disproportionate role in supporting productivity, trade, innovation, and competitiveness
SOURCE: McKinsey Global Institute analysis
55%patents
60%exports
70%R&D spend
9%of US workforce
Spillover effect on services
Strengthening of local economies and business ecosystems
35%productivity growth
$
20%net capital stock
12%GDP
$
3McKinsey & Company
180
100
120
0
160
140
260
240
220
200
Total US manufacturing
10
Total manufacturing less computers,pharmaceuticals, and medical devices
05 201695 2000901980 85
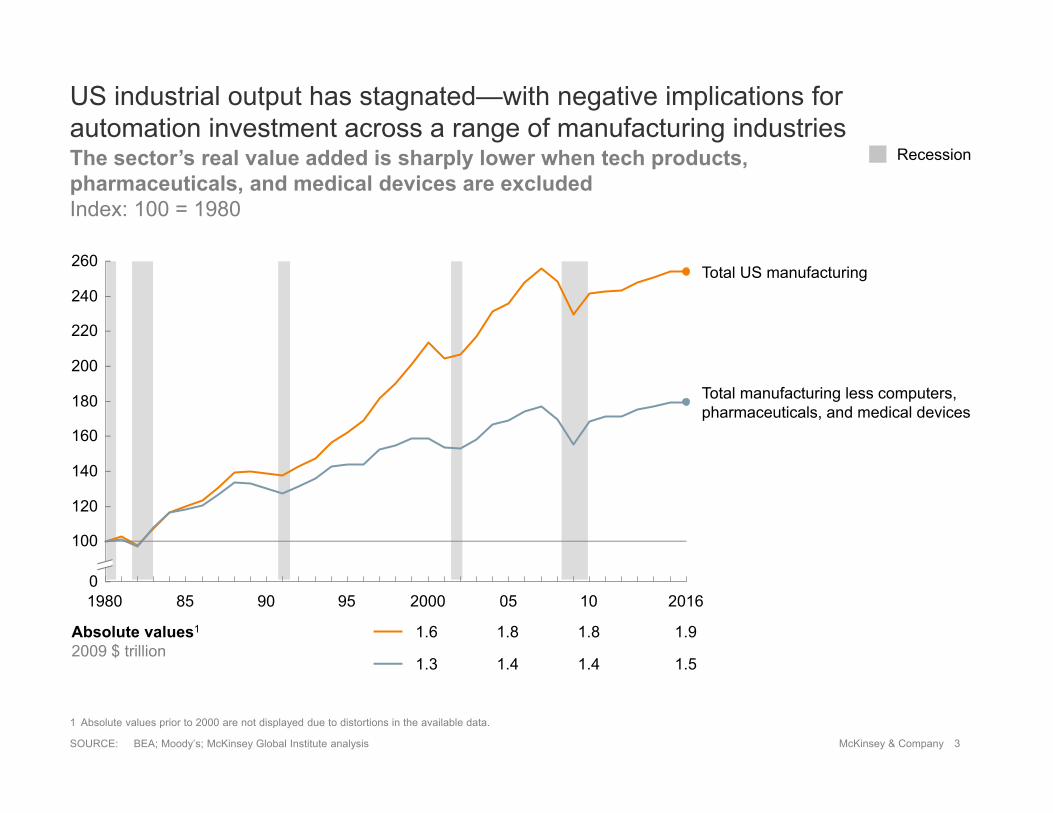
The sector’s real value added is sharply lower when tech products, pharmaceuticals, and medical devices are excludedIndex: 100 = 1980
SOURCE: BEA; Moody’s; McKinsey Global Institute analysis
1 Absolute values prior to 2000 are not displayed due to distortions in the available data.
US industrial output has stagnated—with negative implications for automation investment across a range of manufacturing industries
Recession
Absolute values1
2009 $ trillion1.6 1.8 1.8 1.9
1.3 1.4 1.4 1.5
4McKinsey & CompanySOURCE: US Census Bureau; BEA; McKinsey Global Institute analysis
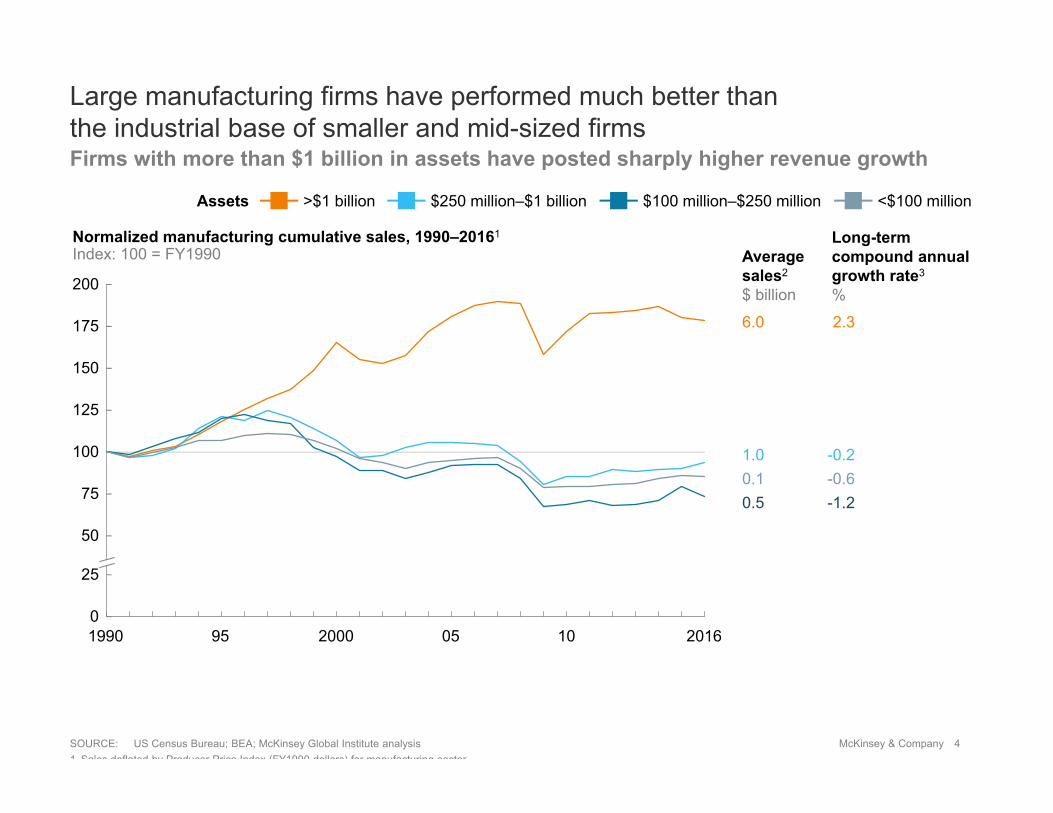
Large manufacturing firms have performed much better than the industrial base of smaller and mid-sized firms
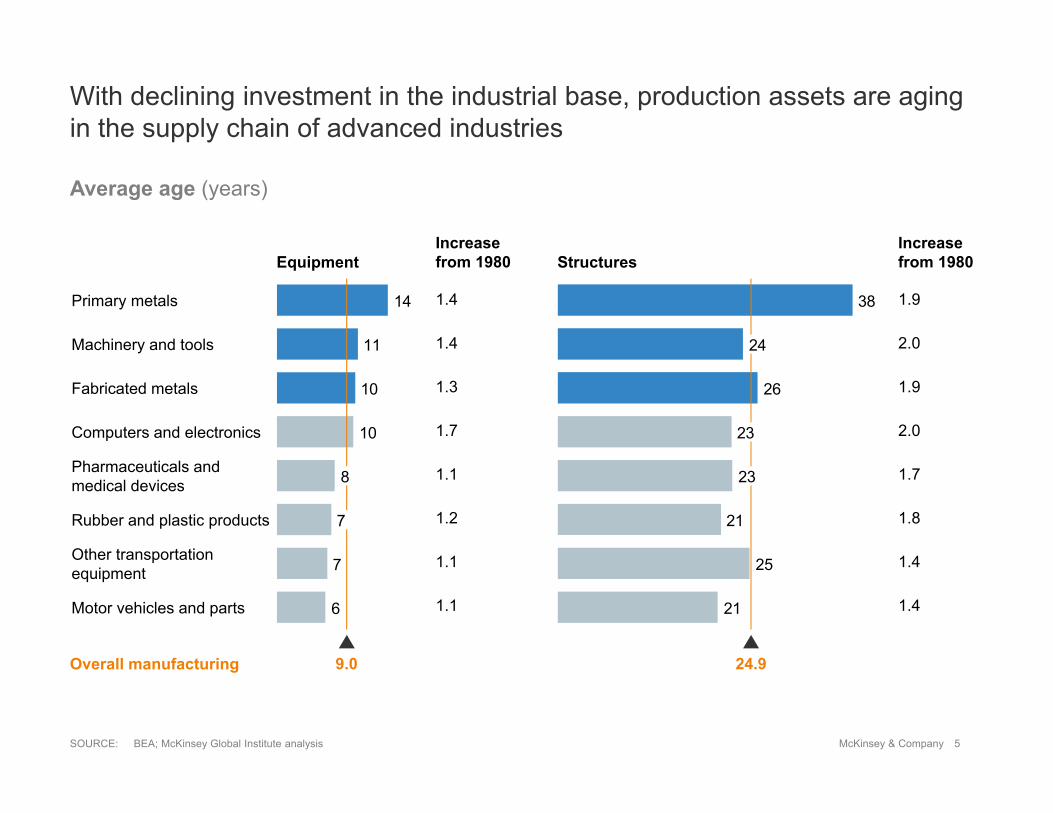
With declining investment in the industrial base, production assets are aging in the supply chain of advanced industries
2.0
1.7
1.9
1.9
2.0
1.8
1.4
1.4
1.7
1.2
1.3
1.4
1.1
1.1
1.1
Overall manufacturing
Equipment StructuresIncrease from 1980
Increase from 1980
1.4
SOURCE: BEA; McKinsey Global Institute analysis
6McKinsey & Company
0
160
14
60
2016
140
120
240
220
200
180
100
08069692
80
1094 02 1204981990 2000
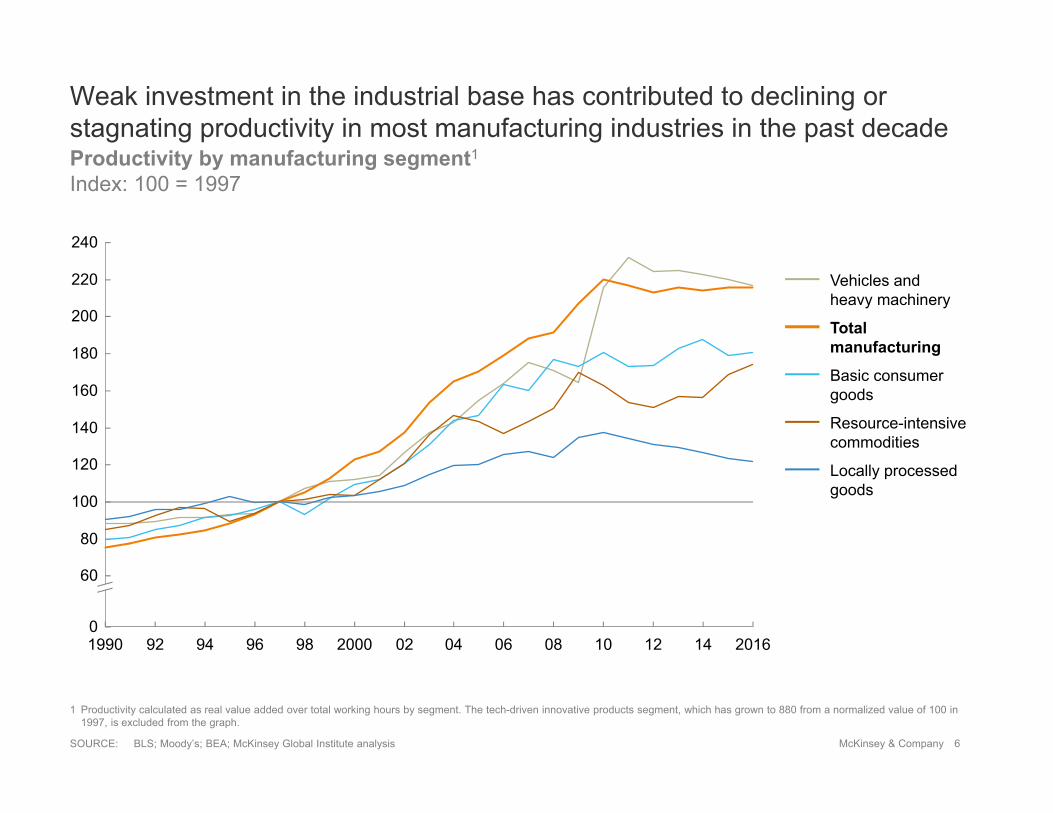
Weak investment in the industrial base has contributed to declining or stagnating productivity in most manufacturing industries in the past decade
Basic consumergoods
Totalmanufacturing
Resource-intensivecommodities
Vehicles andheavy machinery
Locally processedgoods
Productivity by manufacturing segment1
Index: 100 = 1997
1 Productivity calculated as real value added over total working hours by segment. The tech-driven innovative products segment, which has grown to 880 from a normalized value of 100 in 1997, is excluded from the graph.
SOURCE: BLS; Moody’s; BEA; McKinsey Global Institute analysis
7McKinsey & Company
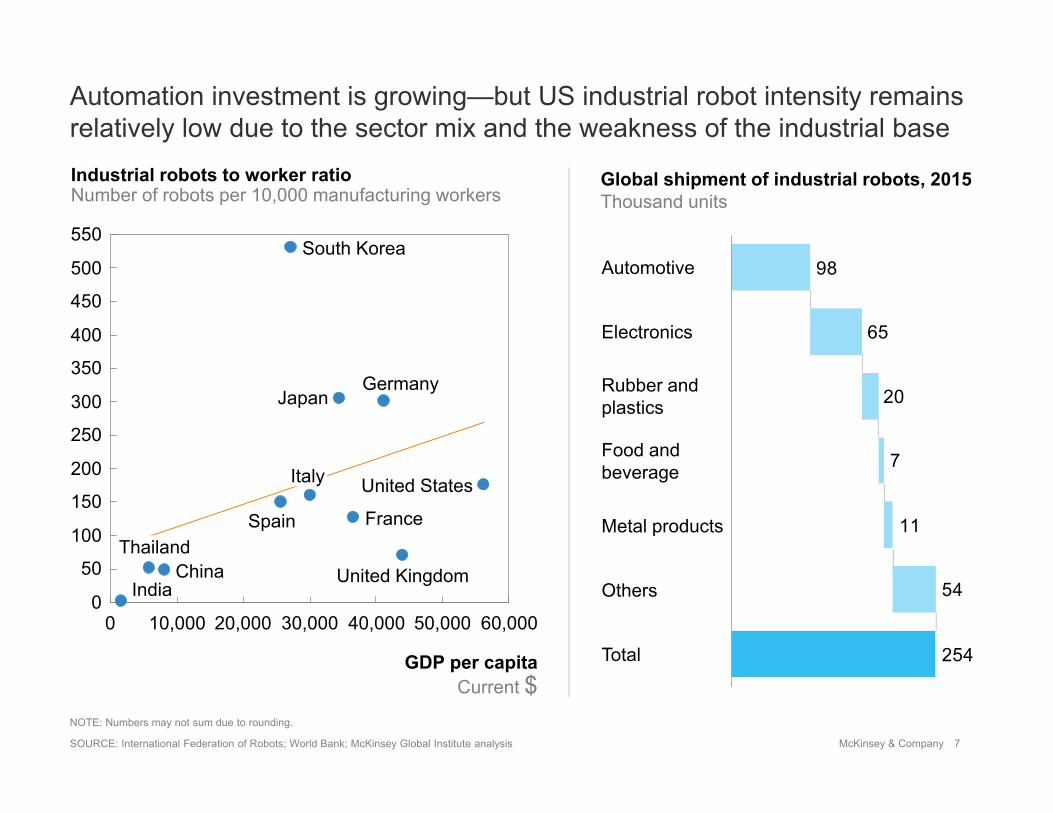
Automation investment is growing—but US industrial robot intensity remains relatively low due to the sector mix and the weakness of the industrial base
254
54
11
7
20
65
98Automotive
Total
Others
Metal products
Food andbeverage
Electronics
Rubber andplastics
SOURCE: International Federation of Robots; World Bank; McKinsey Global Institute analysis
0
300
550
450
500
350
200
400
50
60,00050,000
100
150
250
30,0000
20,000 40,00010,000
United States
India
France
United Kingdom
South Korea
GDP per capitaCurrent $
Italy
ThailandSpain
Industrial robots to worker ratioNumber of robots per 10,000 manufacturing workers
GermanyJapan
China
Global shipment of industrial robots, 2015Thousand units
NOTE: Numbers may not sum due to rounding.
8McKinsey & Company
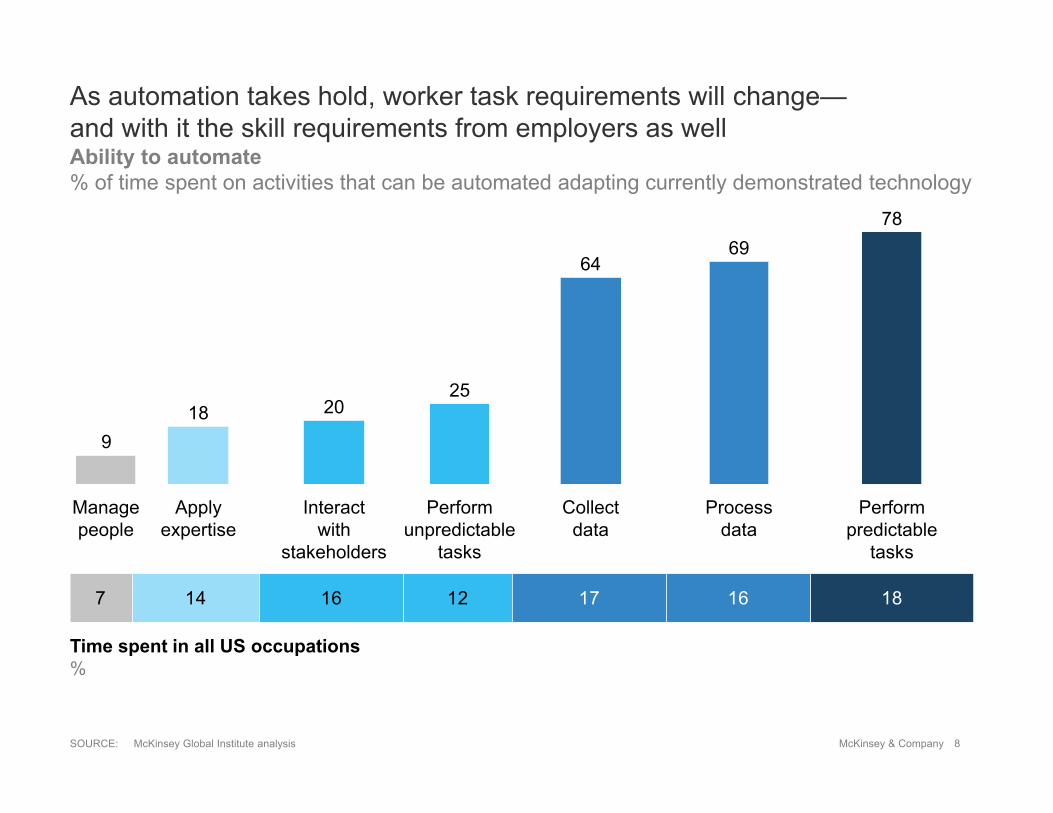
As automation takes hold, worker task requirements will change—and with it the skill requirements from employers as well
7 14 16 12 17 16 18
Perform predictable
tasks
78
Time spent in all US occupations %
SOURCE: McKinsey Global Institute analysis
9
Manage people
18
Apply expertise
Interactwith
stakeholders
2025
Perform unpredictable
tasks
64
Collectdata
69
Processdata
Ability to automate % of time spent on activities that can be automated adapting currently demonstrated technology
9McKinsey & Company
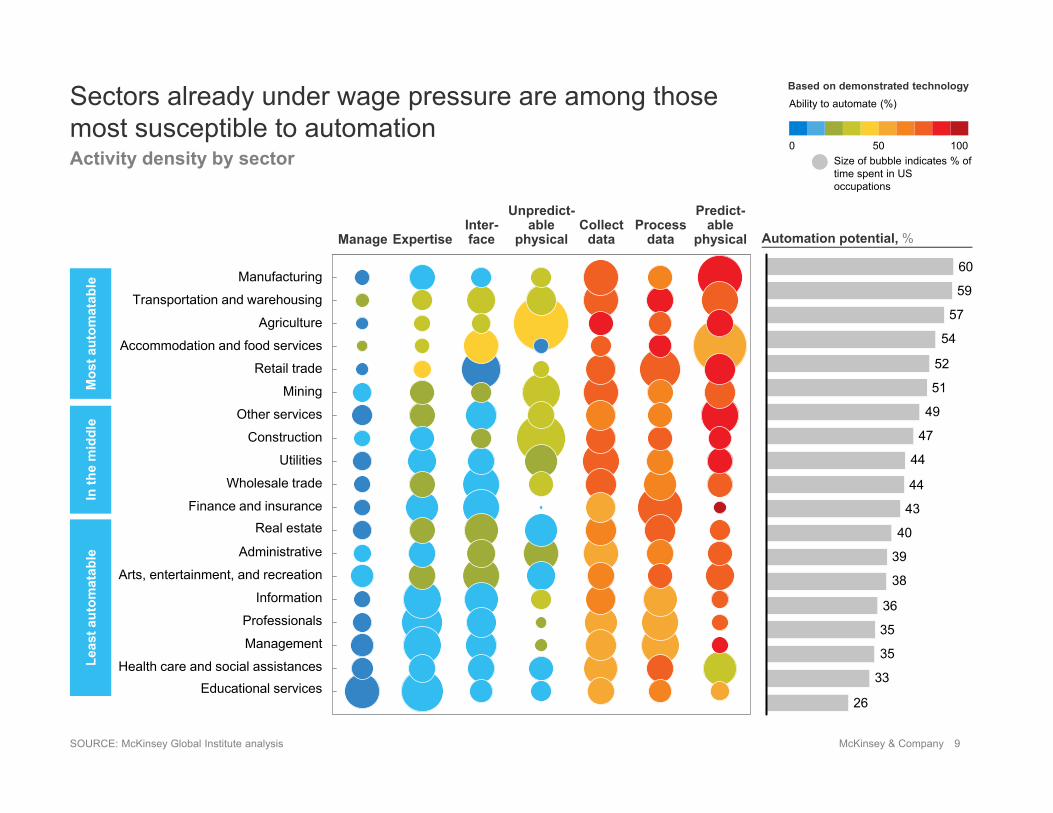
Agriculture
Transportation and warehousing
Retail trade
Accommodation and food services
Manufacturing
Mining
Construction
Utilities
Wholesale trade
Other services
Finance and insurance
Administrative
Health care and social assistances
Information
Professionals
Management
Arts, entertainment, and recreation
Real estate
Educational services
Size of bubble indicates % of time spent in US occupations
Mos
t aut
omat
able
Leas
t aut
omat
able
In th
e m
iddl
eBased on demonstrated technology
Automation potential, %Collect
data
Predict-able
physicalProcess
data
Unpredict-able
physicalInter-faceExpertiseManage
26
33
35
35
36
38
39
40
43
44
44
47
49
51
52
54
57
59
60
Sectors already under wage pressure are among thosemost susceptible to automationActivity density by sector
0 50 100
Ability to automate (%)
SOURCE: McKinsey Global Institute analysis
10McKinsey & Company
Example: Ford Model T assembly line
50
150
250
350
200
0
400
100
300
0
600
1,000
800
400
200
Model T units shippedThousand
1914 191519111910 1912 19131909
Price$
25
10
20
5
15
20
15
0
5
0
10
ProductivityNumber Model T units produced
per employee per year
1909 19111910 1912
Number of employeesThousand
19141913 1915
Automation can stimulate employment by lowering the price of a good and unleashing latent demand
Assembly line improved productivity and number of employees…
… as prices fell and sales rose
SOURCE: US Bureau of Labor Statistics; FDIC; David Hounshell, From the American system to mass production 1800–1932: The development of manufacturing technology in the United States, Baltimore, JHU Press, 1985; Bernard C. Beaudreau, ICT: The industrial revolution that wasn’t, Lulu, May 2008; McKinsey Global Institute analysis
11McKinsey & Company
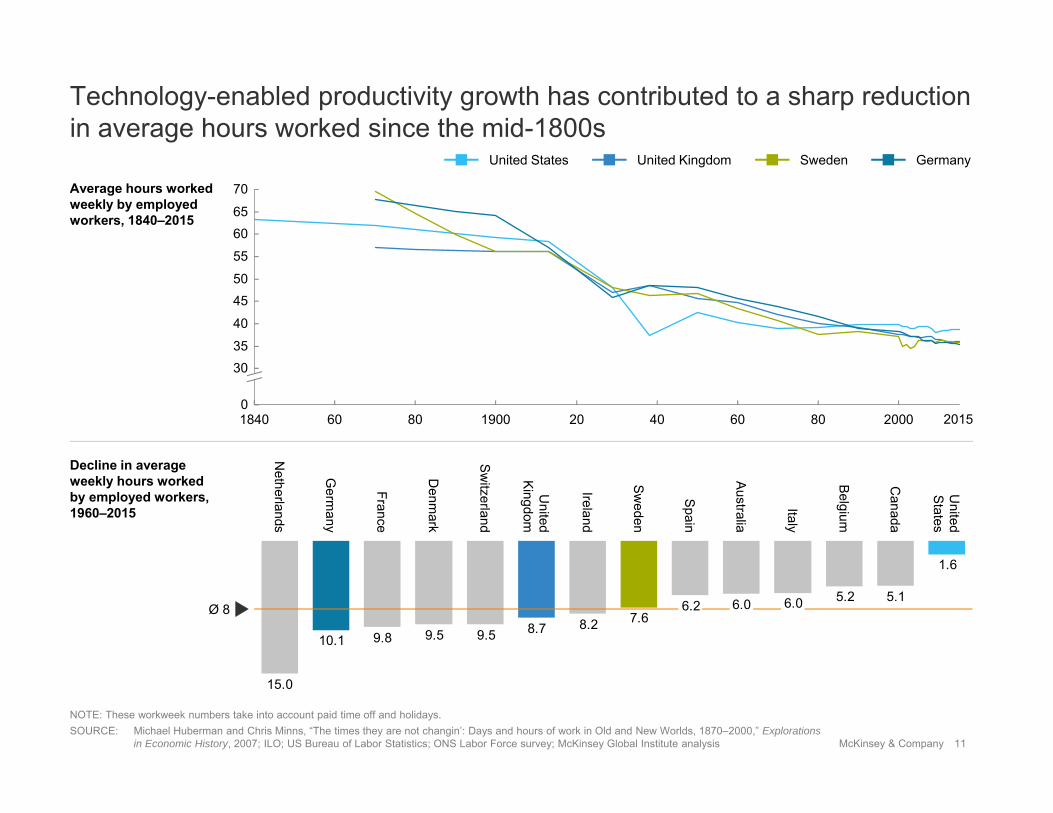
20
40
801840 1900 60
70
80
65
5055
45
60
2000
35
0
30
60 40
Average hours worked weekly by employed workers, 1840–2015
1.6
5.15.26.06.06.27.68.28.79.59.59.810.1
15.0
United
Kingdom
Netherlands
Denm
ark
France
Germ
any
Switzerland
Canada
Ireland
United
States
Australia
Spain
Ø 8
Belgium
Italy
Sweden
Decline in average weekly hours worked by employed workers, 1960–2015
Technology-enabled productivity growth has contributed to a sharp reduction in average hours worked since the mid-1800s
2015
United States United Kingdom Sweden Germany
NOTE: These workweek numbers take into account paid time off and holidays.SOURCE: Michael Huberman and Chris Minns, “The times they are not changin’: Days and hours of work in Old and New Worlds, 1870–2000,” Explorations
in Economic History, 2007; ILO; US Bureau of Labor Statistics; ONS Labor Force survey; McKinsey Global Institute analysis
12McKinsey & Company
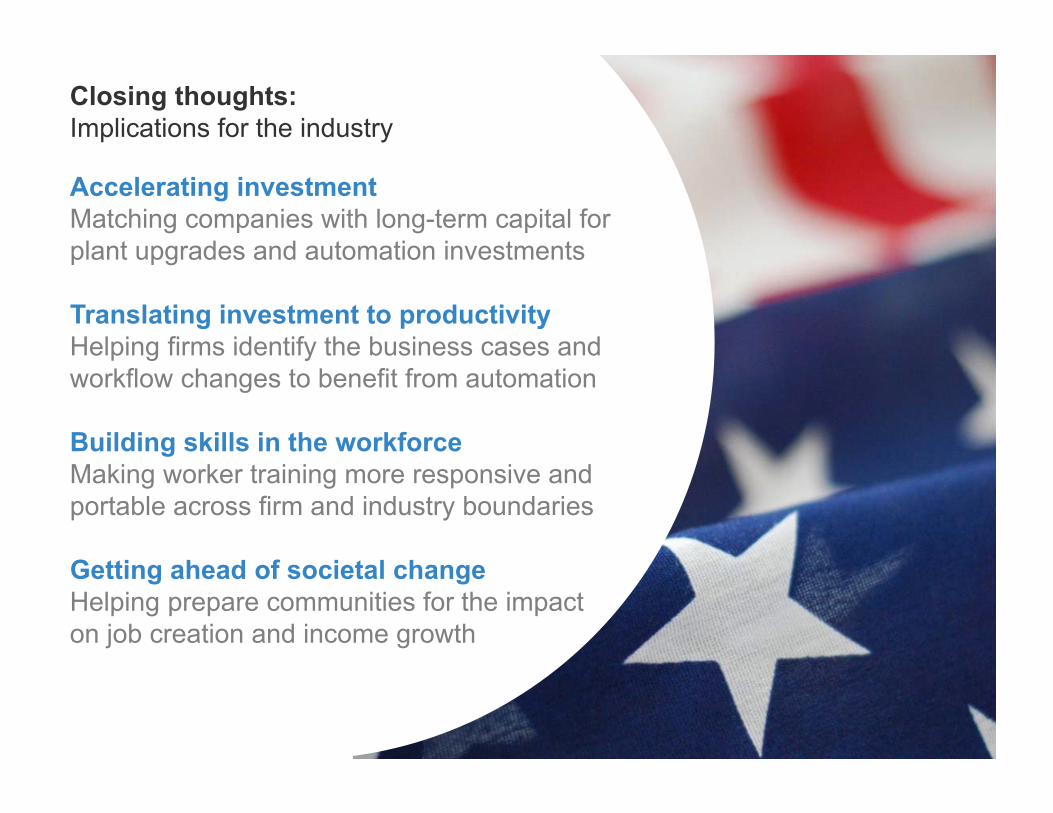
Closing thoughts:Implications for the industry
Accelerating investmentMatching companies with long-term capital for plant upgrades and automation investments
Translating investment to productivityHelping firms identify the business cases and workflow changes to benefit from automation
Building skills in the workforceMaking worker training more responsive and portable across firm and industry boundaries
Getting ahead of societal changeHelping prepare communities for the impact on job creation and income growth
Download MGI research atwww.mckinsey.com/
@McKinsey_MGI
McKinseyGlobalInstitute
@SreeRamaswamy
14McKinsey & Company
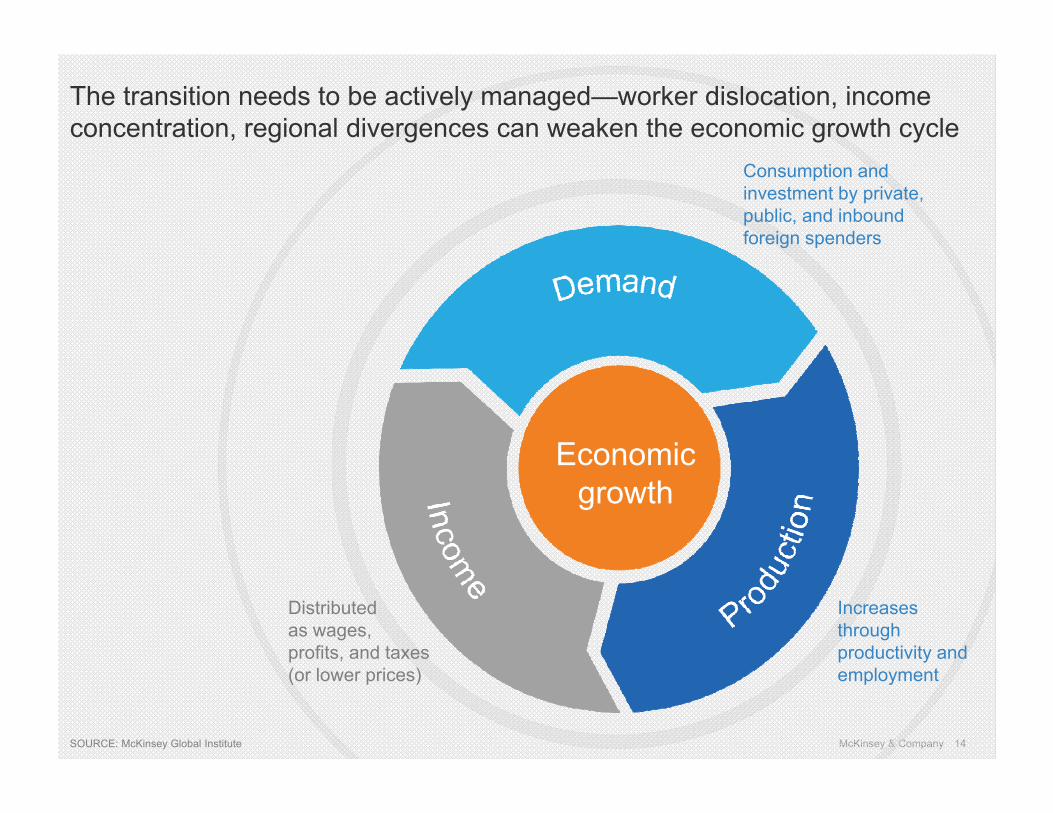
The transition needs to be actively managed—worker dislocation, income concentration, regional divergences can weaken the economic growth cycle
Increases through productivity and employment
Economic growth
Distributed as wages, profits, and taxes (or lower prices)
Consumption and investment by private, public, and inbound foreign spenders
SOURCE: McKinsey Global Institute
15McKinsey & Company
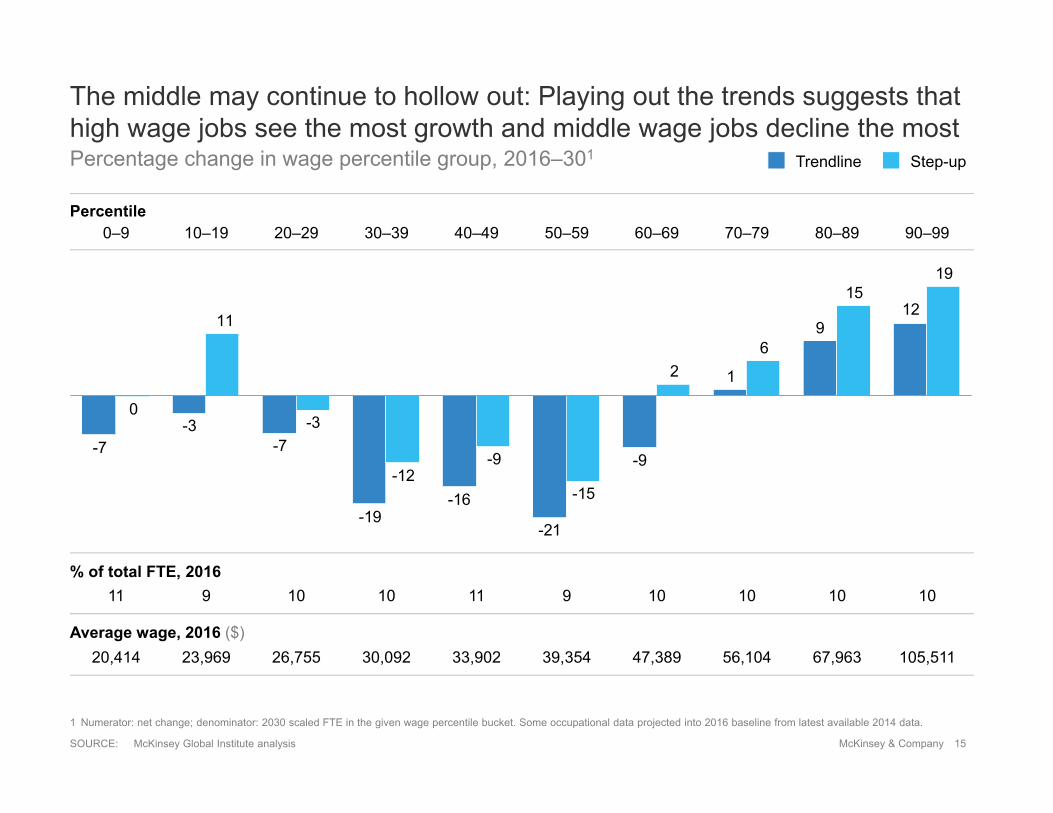
129
1
-9
-21
-16-19
-7-3
-7
1915
62
-15
-9-12
-3
11
0
Percentage change in wage percentile group, 2016–301
The middle may continue to hollow out: Playing out the trends suggests that high wage jobs see the most growth and middle wage jobs decline the most
1 Numerator: net change; denominator: 2030 scaled FTE in the given wage percentile bucket. Some occupational data projected into 2016 baseline from latest available 2014 data.