31
KeralaDistrict Factbook™
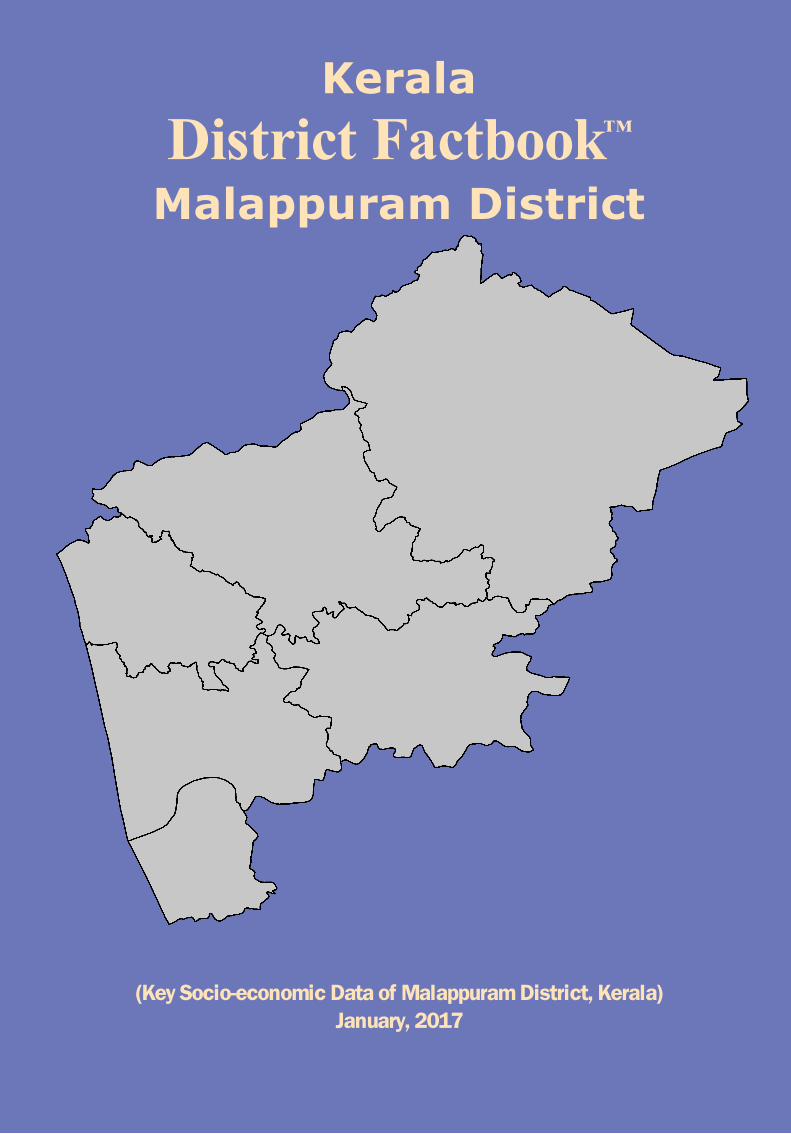
Malappuram District
(Key Socio-economic Data of Malappuram District, Kerala)January, 2017
Editor & DirectorDr. R.K. Thukral
Research EditorDr. Shafeeq Rahman
Compiled, Researched and Published byDatanet India Pvt. Ltd.D-100, 1st Floor,Okhla Industrial Area, Phase-I,New Delhi-110020.Ph.: 91-11-43580781, 26810964-65-66Email : [email protected] : http://www.datanetindia-ebooks.com
Report No.: DFB/KL-592-0117
ISBN :
First Edition : January, 2017
Price : Rs. 7500/- US$ 200
© 2017 Datanet India Pvt. Ltd.All right reserved. No part of this book may be reproduced, stored in a retrievalsystem or transmitted in any form or by any means, mechanical, photocopying,recording or otherwise without the prior written permission of the publisher.
Printed in India
Malappuram District at a Glance
District came into Existence Year 1976
District Headquarter Malappuram
Distance from State Capital 357 Kms.
Geographical Area (In Square km.) 3,554 (Ranks 3rd in State and 342nd in India)Wastelands Area (In Square km.)(2008-2009)
204.74
Total Number of Households 7,74,595
Population 41,12,920 (Persons), 19,60,328 (Males), 21,52,592 (Females) (Ranks 1st in Stateand 50th in India)
Population Growth Rate (2001-2011)
13.45 (Persons), 11.73 (Males), 15.06 (Females)
Number of SubDistricts/Towns/Villages
Sub-districts (06), Towns (44) and Villages (83)
Forest Cover (2015) 41.56% of Total Geographical AreaPercentage of Urban/RuralPopulation
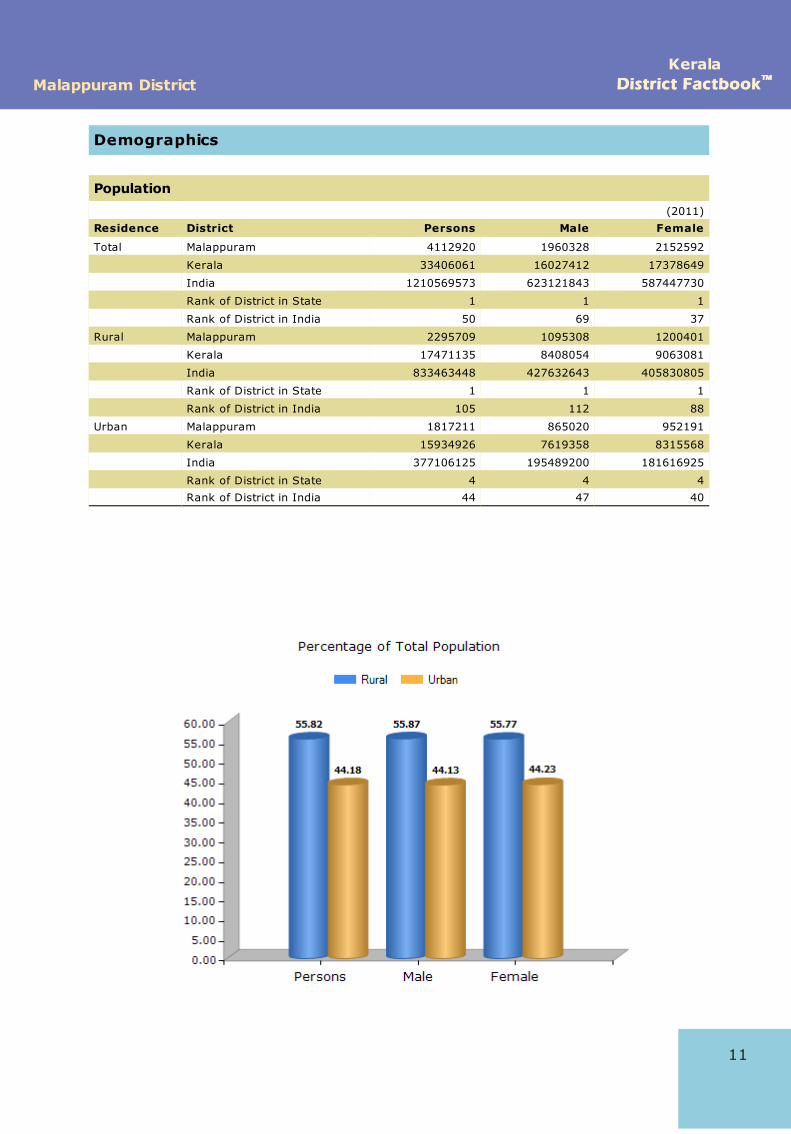
44.18 (Urban), 55.82 (Rural)
Administrative Language Malayalam
Principal Languages (2001) Malayalam (99.43%), Tamil (0.37%), Telugu (0.06%), Kannada (0.04%), Gujarati(0.03%) and Hindi (0.02%)
Population Density 1,157 (Persons per Sq. km.)
Sex Ratio 1098 (Females per 1000 Males)
Child Ratio (Age Group 0-6 Year) 965 (Females per 1000 Males)
Number of Live Births (2014) 92,283 (Persons), 47,723 (Males), 44,558 (Females)
Number of Deaths (2014) 19,066 (Persons), 10,461 (Males), 8,604 (Females)
Literacy Rate (In %age) 93.57 (Persons), 95.76 (Males), 91.62 (Females)
Literates 33,11,315 (Persons), 15,97,404 (Males), 17,13,911 (Females)
Illiterates 8,01,605 (Persons), 3,62,924 (Males), 4,38,681 (Females)
Major Religions Muslim (70.24%), Hindu (27.6%), Christian (1.98%), Jain (0.00%), Buddhist(0.00%) and Sikh (0.00%)
Schedule Caste Population 3,08,266 (Persons), 1,51,557 (Males), 1,56,709 (Females), Percentage of SC inTotal Population (10.14)
Major Schedule Caste Population
Kanakkan, Padanna, Padannan (33.04%); Cheruman (30.46%); Mannan,Pathiyan, Perumannan, Vannan, Velan (11.85%); Kalladi (8.8%); Pulayan,Cheramar, Pulaya, Pulayar, Cherama, Cheraman, Wayanad Pulayan, WayanadanPulayan, Matha, Matha Pulayan (4.15%)
Schedule Tribe Population 22,990 (Persons), 11,272 (Males), 11,718 (Females), Percentage of ST in TotalPopulation (4.74)
Major Schedule Tribe Population Paniyan (32.07%); Muthuvan, Mudugar, Muduvan (12.21%); Kattunayakan(10.34%); Mala Panickar (4.02%); Kanikaran, Kanikkar (3.33%)
Number of Total Workers 10,62,424 (Persons), 8,98,157 (Males), 1,64,267 (Females)Labour Force Participation Rate(2011-2012)
30.11% (Rural), 30.14% (Urban)
Major Source of Income AgriculturalGross District Domestic Product(2014-15) (QE) (Rs. in Lakh)
44,34,668 At Current Price / 36,11,899 At Constant (2011-2012) Prices
Net District Domestic Product(2014-15) (QE) (Rs. in Lakh)
40,22,663 At Current Price / 32,90,630 At Constant (2011-2012) Prices
Per Capita Income (NDDP, At FactorCost) (2014-15) (Q) (In Rs.)
93,478 At Current Price / 76,467 At Constant (2011-2012) Prices
Number of Tourists (2014) 4,49,420 (Domestic Tourist) / 21,613 (Foreign Tourist)
Major Tourist PlacesPadinharekara Beach, Kadampuzha, Angadipuram, Thirunavaya, Trikandiyur,Mumburam, Valiya Juma Masjid Malappurampazhayangadi Mosque, Kondotti,Kottakunnu, Biyyam Kayal, Kadalundi Bird Sanctuary.
Note: A ll figures for 2011 Census, Otherwise year is mentioned.
No. Particulars Page No.
1 Administrative Setup 1-10
Location Map | District w ith Sub-Districts | Reference Map of District |About District | Administrative Unit | Villages | Towns | Wards |Panchayats
2 Demographics 11-33
Population l Sex Ratio | Density | Child Population | Child Sex Ratio |Decadal Growth | Age Group Population | Age Group Population ofCurrently Married | Economically Active Population | Ageing Population |Dependency Ratio | Single Year Age Population | Scheduled CastePopulation | Scheduled Tribe Population | Religious Population | CD BlockPopulation
3 Economy 34-45
GDP/NDP | Per Capita Income | Households by Income Groups |Disposable Income | Banking | District Central Co-operative Banks |Lead Banks | Investment and Debt | Revenue Collection from Minerals |Ration Cards Issued
4 Market Size 46-57
Monthly Per Capita Expenditure | Estimated Annual Expenditure /Average Per Capita Consumer Expenditure on Services and DurableGoods
5 Life Style 58-62
Households having Radio/Transistor, Television | Households havingComputer/Laptop/Internet | Households having Telephone/MobilePhone | Households having Bicycle, Scooter/Motor Cycle/Moped &Car/Jeep/Van | Circulation of Dailies
6 Infrastructure 63-78
Occupied Houses used as Shops/Offices | Amenities | Sanitation | Roadlength | Vehicle Registered | Telecommunication | Post Office & PIN Code| Tourism | LPG Distributors
7 Industries 79-113
Factories, Capital Invested and Persons Employed (2 & 3 digit levelIndustries) | Factories by Type of Organisation/Ownership |Consumption of Fuels | Manufacturing Industries Share of GDP |Outstanding Credit of SCBs according to Industrial Occupation | Micro,Small and Medium Enterprises | Ongoing Projects
8 Labour and Workforce 114-120
Total Workers | Main Workers | Marginal Workers | Non-Workers |Average Wages/Earning per Day Received by Usual Principal ActivityStatus | Daily Agricultural Wages | Employment Indicators
9 Agriculture 121-139
Land Utilistation | Production of Major Food Crops | Production ofCommercial Crops | Production of Fruit & Vegetable Crops | Productionof Spices | Consumption of Fertilisers | Milk, Egg and Meat Production |Fisheries | Animals Slaughtered | Livestock Population | PoultryPopulation | Irrigation | Land Holdings | Farmer
10 Education 140-147
Literacy Rate | Population by Educational Level | Census Houses Usedas School/College etc. | Enrollment | Enrollment by Medium of Instruction| Gross/Net Enrollment Ratio | Teachers | Gini Coefficient Education |Population by Mother Tongue
11 Health 148-165
Health Institutions | Medical Staff, Patients Treated and Beds | LiveBirths Registered | Still Births Registered | Deaths Registered | InfantDeaths Registered | Diseases | Allopathic Manufacturing Units & BloodBanks | Disabled Population by Type of Disability | Houses used forHospital/Dispensary | Households by Married Couples per Householdand Dwelling Rooms | Maternal and Child Health Indicators (HMIS) |District Level Household Health Indicators | Family Welfare Programmes
12 Environment and Pollution 166-169
Geographical Area | Wastelands | Forest Cover | Rainfall | Latitude,Longitude and Altitude | Water Quality
13 Housing 170-181
Households | Houseless Households | Houseless Population | Standardof Living Index | Housing Condition | House and Their Uses
14 Crime & Law 182-188
Incidence of IPC Crime | Prisoners | Family Courts | Kerala Women'sCommission | Road Accidents | Police Officer/Officials | Judicial Officers
15 Social and Welfare Schemes 189-196
Mahatma Gandhi National Rural Employment Guarantee Scheme(MGNREGS) | Indira Awaas Yojana (IAY) | District Rural DevelopmentAgencies (DRDA) | National Rural Drinking Water Programme (NRDWP) |Nirmal Bharat Abhiyan (NBA) | Swachh Bharat Mission (SBM)-Gramin |Self-Help Groups (SHGs) | Aadhaar Card (UIDAI) Enrollments
16 Electoral 197-201
Vote Distribution of Major Parties (Parliamentary Election-2014 andAssembly Election 2016) | Name and Address of MPs/MLAs | Electors
17 Annexure - I to III 202-226
18 Useful Contacts 227
19 Abbreviations & Sources 228
20 Concepts and Definitions 229-232
21 Disclaimer & Terms of Use 233
KeralaDistrict FactbookDistrict Factbook™™ Malappuram District
1
Malappuram DistrictKerala
District FactbookDistrict Factbook™™
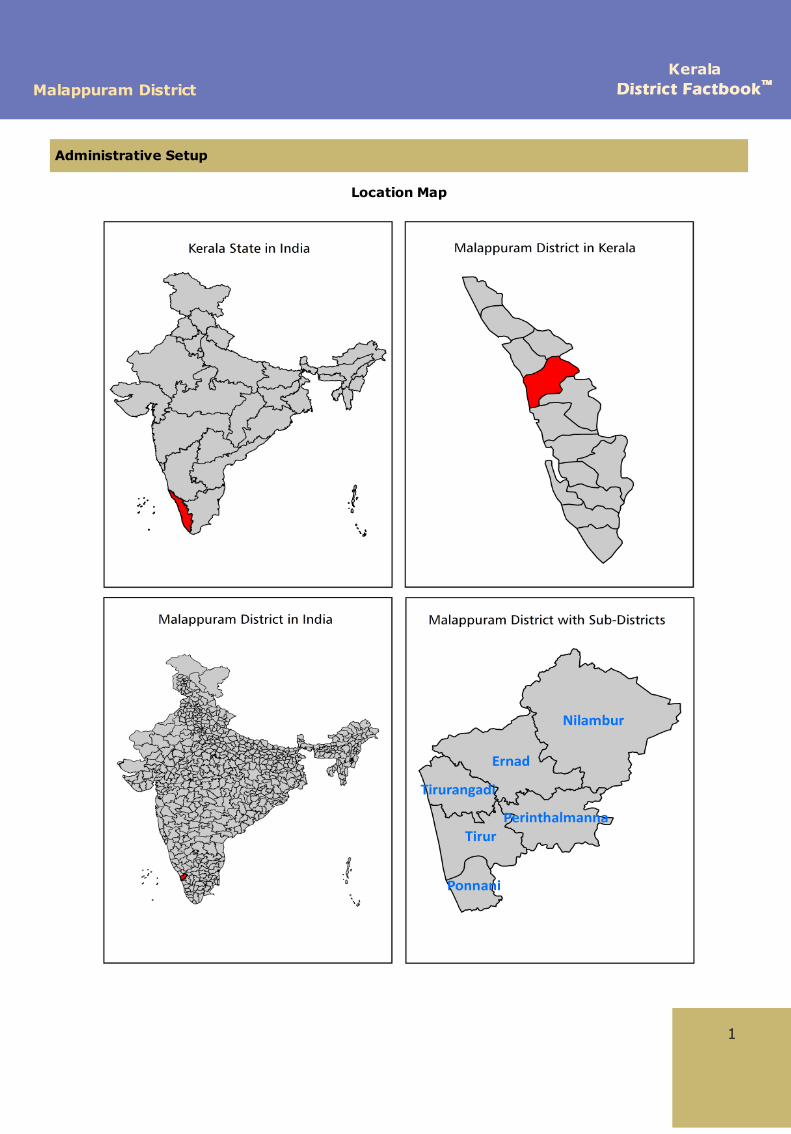
Administrative Setup
Location Map
KeralaDistrict FactbookDistrict Factbook™™ Malappuram District
Administrative Setup
2
3
Malappuram DistrictKerala
District FactbookDistrict Factbook™™
Administrative Setup
KeralaDistrict FactbookDistrict Factbook™™ Malappuram District
4
5
Malappuram DistrictKerala
District FactbookDistrict Factbook™™
About Malappuram District
Malappuram is a district of Kerala state with its administrative headquarters located atMalappuram city. The term Malappuram means "terraced place atop the hills", it is incontext of the general geographical characteristics of the district. Earlier the district wasknown as Eranad,Valluvanad etc. During different periods of time the district was ruledby many differemt powerful dynasties namely Chera dynasty, Kulasekhara dynasty,Valluvanad dynasty, Vettattunadu (Tanur) dynasty, Parappanad dynasty andNediyiruppu (the Zamorins) dynasty. At the time of British rule it was a part of Malabardistrict in the Madras Presidency . But to form the Kerala state, Malabar district wasmerged with Travancore-Cochin on 1 st November 1956. In the year 1976 Malappuramwas emerged as a separate district in the map of Kerala state. Some portion of earlierPalakkad and Kozhikode districts comprises the Malappuram district. It was also formedby some parts of Ernad taluk, Tirur taluk of Kozhikode district and Perinthalmannna andPonnani taluks of Palakkad district. Edasseri Govindan Nair, a distinguished Indian poetwho wrote 19 books and 300 poems in 10anthologies, 6 books of plays and a collectionof essays in his own Malayalam tongue was born on 23 December, 1906 at Kuttippuramin the district. He was also honoured by many awards among which Kerala SahityaAcademy Award for the collection of poems Oru Pidi Nellikka in 1969 and SahityaAcademy Award for the collection of poems Kavile Pattu in 1970 are notable.
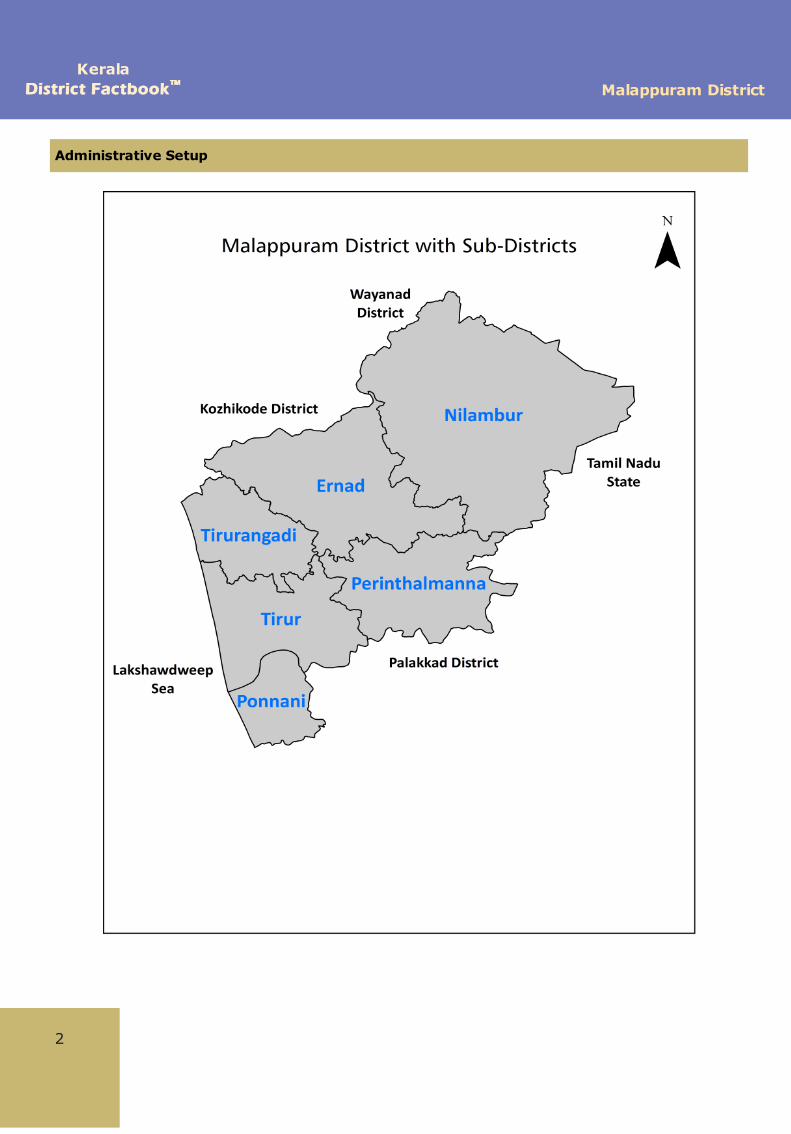
Geographically, the district lies at 11°04'N latitude, 76°08'E longitude and 47 m Altitude.The district occupies a geographical area of 3,554 sq km and it is bounded byWayanad and Kozhikkode districts on the north, Tamil Nadu on the northeast, Palakkaddistrict on the southeast and south, Thrissur district on the southwest, the Arabian Seaon the west and Kozhikode district on the northwest. During the summer the climate ofthe district is mild hot and humid. Monsoon starts with heavy rainfall. The actual rainfallin the district was 2487.1 mm in the year of 2015-16.
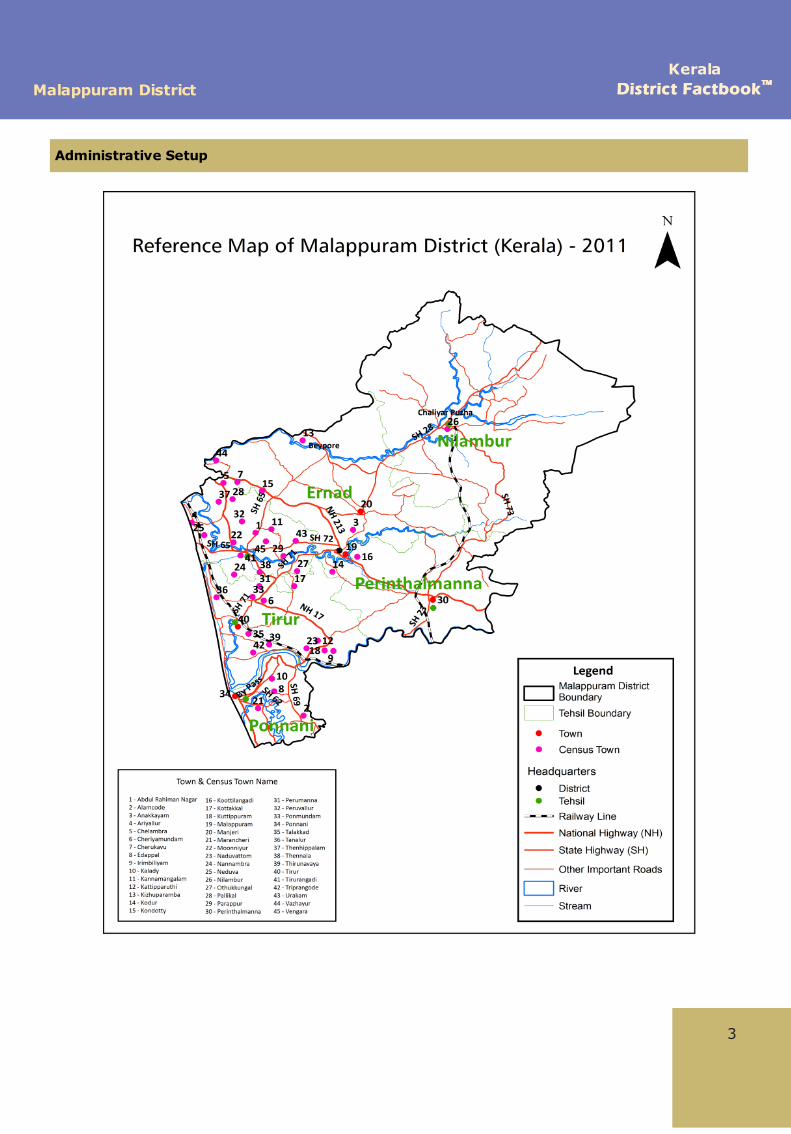
Administration wise, the district is divided into 2 revenue divisions are Tirur andPerintalmanna. Moreover, it comprises 6 sub-districts, 44 towns and 83 villages. Thereare 3 Parliament and 16 Assembly constituencies in the district.
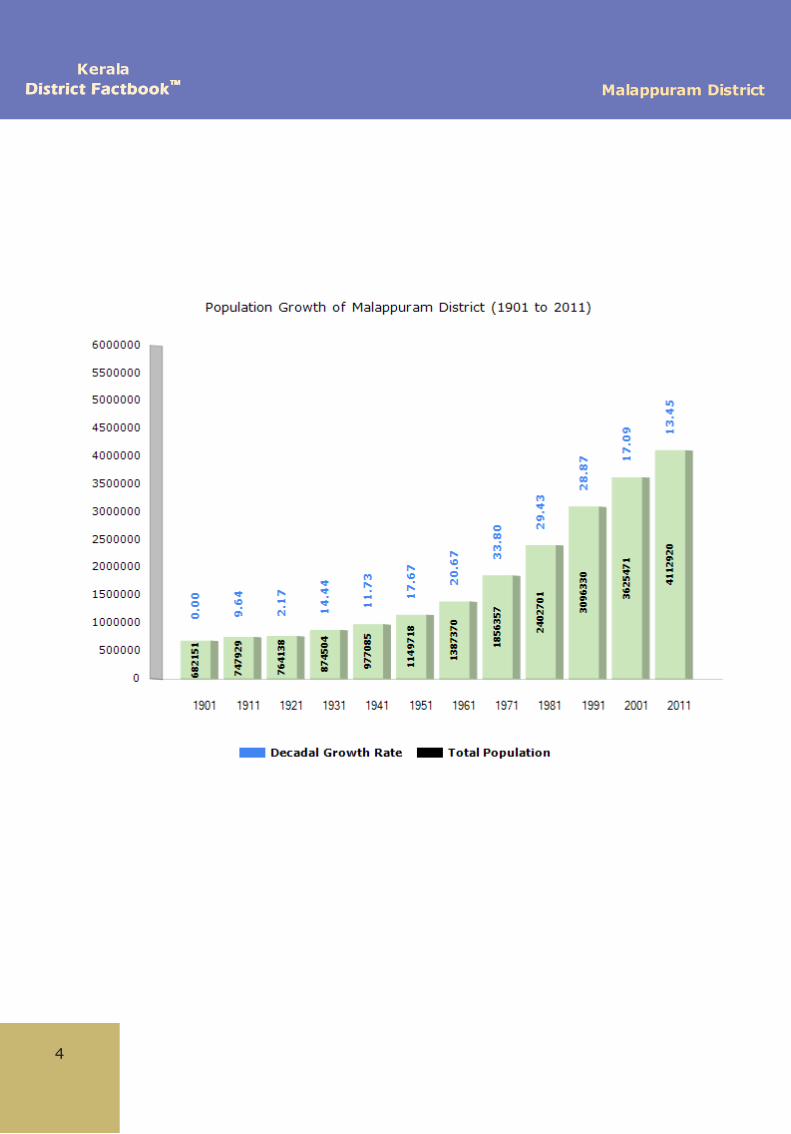
According to 2011 census the district has a population of 41,12,920 (persons) out ofwhich 19,60,328 (males) and 21,52,592 (females). The district has a sex ratio of 1098females for every 1000 males. In the year 2001-2011 the population growth rate in thedistrict was 13.45 % (persons), 11.73 % (males) and 15.06 % (females). The majorreligions in the district are Muslim and Hindu with 70.24% and 27.60% of the totalpopulation respectively .
Agriculture is the backbone of its economy. The chief agricultural crops grows in thedistrict are Paddy, cashew nut, pepper, ginger, pulses, coconut, banana, tapioca,rubber, etc. The district is industrially not so well developed. Wood business is verypopular in Malappuram district. Saw mills, furniture manufactures and timber sales aresome other the most vital trades in the district. A huge chunk of revenue comes fromthese industries every year. In the year 2014-2015 the gross domestic product in thedistrict was Rs 44,34,668 lakh at current price.
KeralaDistrict FactbookDistrict Factbook™™ Malappuram District
The district has numbers schools and other higher educational institutions.The Universityof Calicut , established in 1968 is located at Thenjipalam in the district. Moreover , theAligarh Muslim University Malappuram Centre is situated at Chelamala in the districtprovides a plateform for the higher education. As per 2011 census the literacy rate inthe district is 93.57% (persons), 95.76% (males) and 91.62% (females).
U. A. Beeran, an eminent Indian politician and the minister in the Kerala Government withthe portfolio of Education and Social Welfare (27 January 1978 to 3 November 1978) wasborn on 9 March 1925 at Kottakkal in the district. He was also served as the minister inthe Kerala Government with portfolio of Food and Civil Supplies (24 May 1982 to 25March 1987). Earlier he was a member of Indian Union Muslim League but later joinedwith the Indian National League . Elamkulam Manakkal Sankaran Namboodiripad or EMS ,an illustrious Indian communist politician and theorist, who served as the first ChiefMinister of Kerala (1957–59) and again (1967–69) was born on 13 June, 1909 atPerintalmanna in the district. Before 1964 he is a member of Communist Party of India(CPI) but in 1964, he came out of CPI to form the Communist Party of India (Marxist).
The district has numerous sets of tourist places which attracts the travellers fromdifferent parts of the world. The up and down hill in the district, in the uphill there aremany important government officials on the other hand down hill is basically a commercialarea. Melmuri is situated at a distance of 4 km from the city. Swalath Nagar and GrandMasjid are the identity of the place. Padinharekara beach is located at the end point ofthe Tipu Sulthan road. One can enjoy a mesmerising view of the confluence of the riverBharathapuzha and Tirur puzha with the Arabian Sea. Kadalundi Bird Sanctuary is 19kmsfrom Kozhikode and 7kms from Beypore port. Every year a large variety of native birdsand also migratory birds flock in the place. Kottakkal Arya Vaidya Sala is a world famousAyurveda Institute which is engaged in the practice and propagation of Ayurveda, theancient health care system of India.
6
7
Malappuram DistrictKerala
District FactbookDistrict Factbook™™
Administrative Setup Administrative UnitAdministrative Division:- North Kerala
Sub-districts:
1. Ernad
2. Nilambur
3. Perinthalmanna
4. Ponnani
5. Tirur
6. Tirurangadi
Towns: 1. Abdu Rahiman Nagar (CT) 22. Naduvattom (CT) 43. Vazhayur (CT)2. Alamcode (CT) 23. Nannambra (CT) 44. Vengara (CT)3. Ariyallur (CT) 24. Neduva (CT)4. Chelambra (CT) 25. Nilambur (CT)5. Cheriyamundam (CT) 26. Othukkungal (CT)6. Cherukavu (CT) 27. Pallikal (CT)7. Edappal (CT) 28. Parappur (CT)8. Irimbiliyam (CT) 29. Perinthalmanna (M)9. Kalady (CT) 30. Perumanna (CT)10. Kannamangalam (CT) 31. Peruvallur (CT)11. Kattipparuthi (CT) 32. Ponmundam (CT)12. Kizhuparamba (CT) 33. Ponnani (M)13. Kodur (CT) 34. Talakkad (CT)14. Kondotty (CT) 35. Tanalur (CT)15. Koottilangadi (CT) 36. Thenhippalam (CT)16. Kottakkal (CT) 37. Thennala (CT)17. Kuttippuram (CT) 38. Thirunavaya (CT)18. Malappuram (M) 39. Tirur (M)19. Manjeri (M) 40. Tirurangadi (CT)20. Marancheri (CT) 41. Triprangode (CT)21. Moonniyur (CT) 42. Urakam (CT)
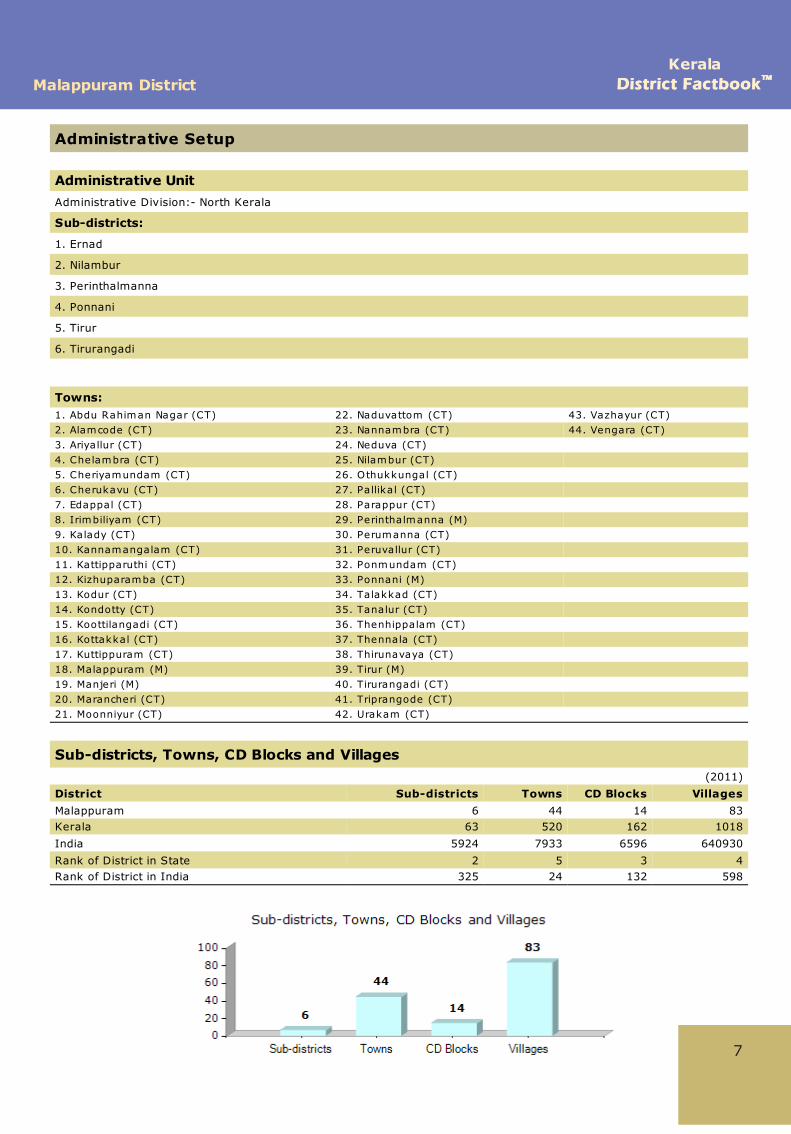
Sub-districts, Towns, CD Blocks and Villages(2011)
District Sub-districts Towns CD Blocks VillagesMalappuram 6 44 14 83Kerala 63 520 162 1018
India 5924 7933 6596 640930
Rank of District in State 2 5 3 4Rank of District in India 325 24 132 598
11
Malappuram DistrictKerala
District FactbookDistrict Factbook™™
Demographics
Population(2011)
Residence District Persons Male Female
Total Malappuram 4112920 1960328 2152592
Kerala 33406061 16027412 17378649
India 1210569573 623121843 587447730
Rank of District in State 1 1 1
Rank of District in India 50 69 37
Rural Malappuram 2295709 1095308 1200401
Kerala 17471135 8408054 9063081
India 833463448 427632643 405830805
Rank of District in State 1 1 1
Rank of District in India 105 112 88
Urban Malappuram 1817211 865020 952191
Kerala 15934926 7619358 8315568
India 377106125 195489200 181616925
Rank of District in State 4 4 4
Rank of District in India 44 47 40
KeralaDistrict FactbookDistrict Factbook™™ Malappuram District
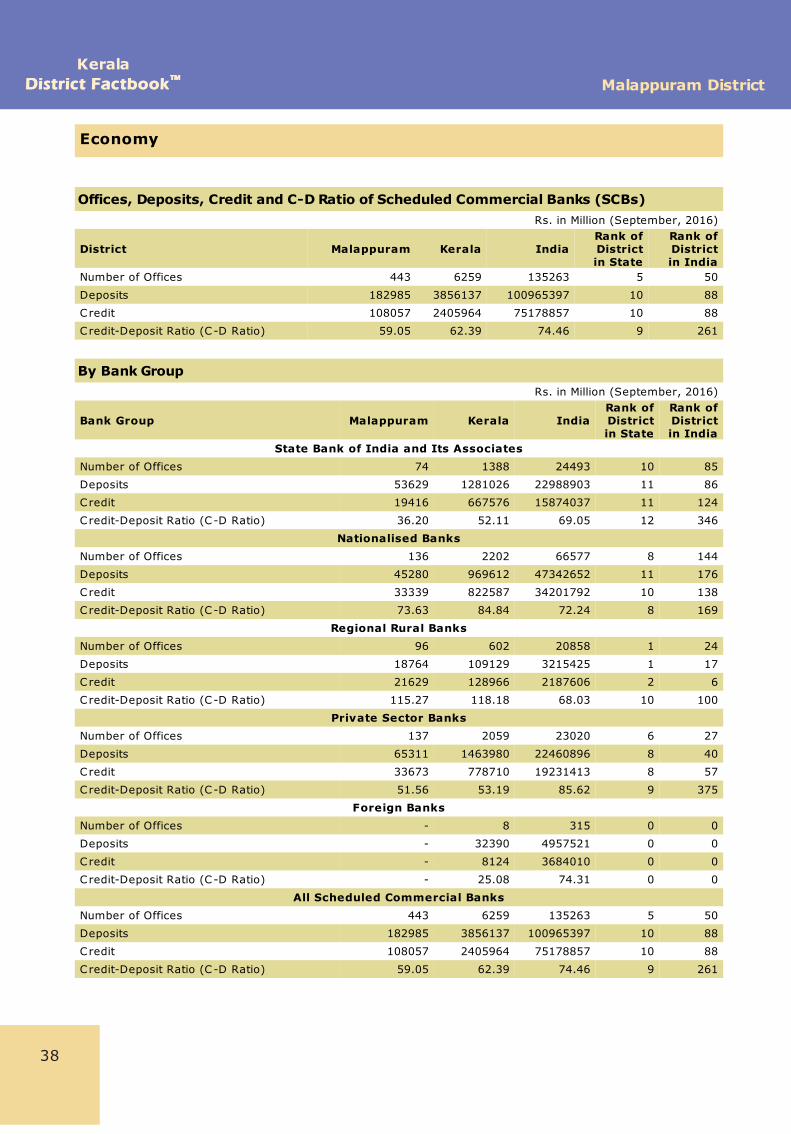
Economy
Offices, Deposits, Credit and C-D Ratio of Scheduled Commercial Banks (SCBs)Rs. in Million (September, 2016)
District Malappuram Kerala IndiaRank ofDistrictin State
Rank ofDistrictin India
Number of Offices 443 6259 135263 5 50
Deposits 182985 3856137 100965397 10 88
Credit 108057 2405964 75178857 10 88
Credit-Deposit Ratio (C-D Ratio) 59.05 62.39 74.46 9 261
By Bank GroupRs. in Million (September, 2016)
Bank Group Malappuram Kerala IndiaRank ofDistrictin State
Rank ofDistrictin India
State Bank of India and Its AssociatesNumber of Offices 74 1388 24493 10 85
Deposits 53629 1281026 22988903 11 86
Credit 19416 667576 15874037 11 124
Credit-Deposit Ratio (C-D Ratio) 36.20 52.11 69.05 12 346
Nationalised BanksNumber of Offices 136 2202 66577 8 144
Deposits 45280 969612 47342652 11 176
Credit 33339 822587 34201792 10 138
Credit-Deposit Ratio (C-D Ratio) 73.63 84.84 72.24 8 169
Regional Rural BanksNumber of Offices 96 602 20858 1 24
Deposits 18764 109129 3215425 1 17
Credit 21629 128966 2187606 2 6
Credit-Deposit Ratio (C-D Ratio) 115.27 118.18 68.03 10 100
Private Sector BanksNumber of Offices 137 2059 23020 6 27
Deposits 65311 1463980 22460896 8 40
Credit 33673 778710 19231413 8 57
Credit-Deposit Ratio (C-D Ratio) 51.56 53.19 85.62 9 375
Foreign BanksNumber of Offices - 8 315 0 0
Deposits - 32390 4957521 0 0
Credit - 8124 3684010 0 0
Credit-Deposit Ratio (C-D Ratio) - 25.08 74.31 0 0
All Scheduled Commercial BanksNumber of Offices 443 6259 135263 5 50
Deposits 182985 3856137 100965397 10 88
Credit 108057 2405964 75178857 10 88
Credit-Deposit Ratio (C-D Ratio) 59.05 62.39 74.46 9 261
38
KeralaDistrict FactbookDistrict Factbook™™ Malappuram District
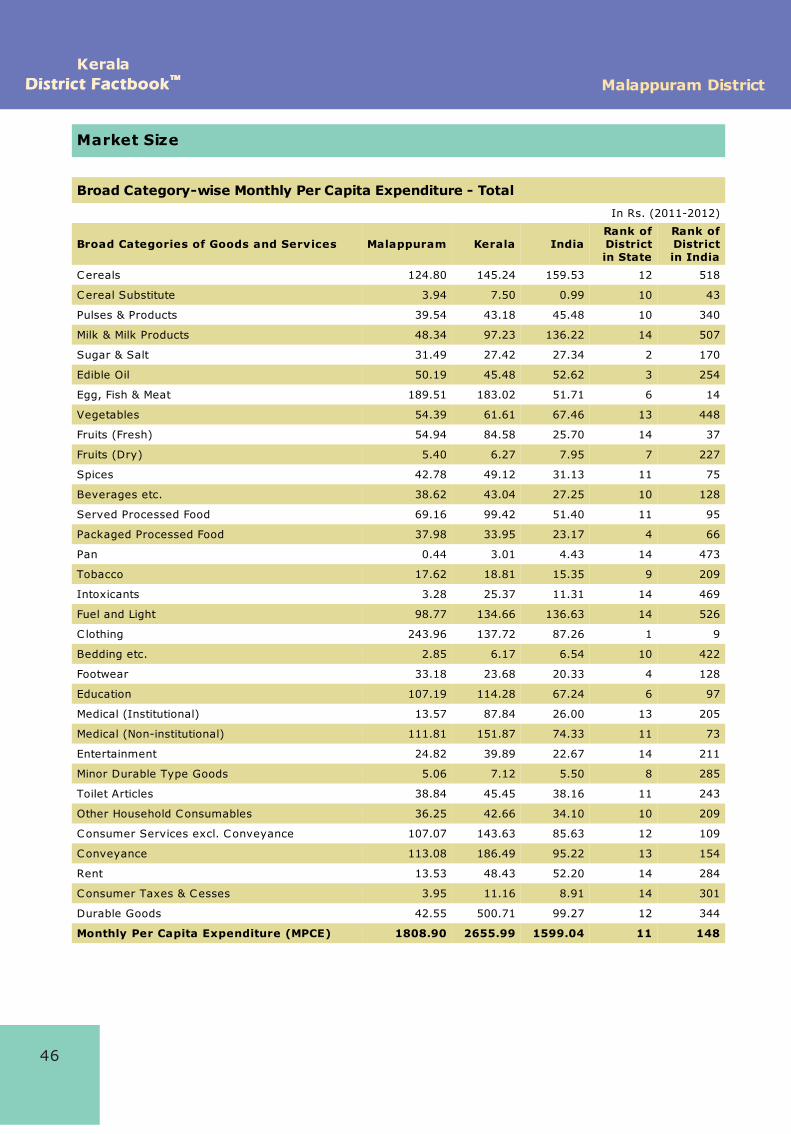
Market Size
Broad Category-wise Monthly Per Capita Expenditure - Total In Rs. (2011-2012)
Broad Categories of Goods and Services Malappuram Kerala IndiaRank ofDistrictin State
Rank ofDistrictin India
Cereals 124.80 145.24 159.53 12 518
Cereal Substitute 3.94 7.50 0.99 10 43
Pulses & Products 39.54 43.18 45.48 10 340
Milk & Milk Products 48.34 97.23 136.22 14 507
Sugar & Salt 31.49 27.42 27.34 2 170
Edible Oil 50.19 45.48 52.62 3 254
Egg, Fish & Meat 189.51 183.02 51.71 6 14
Vegetables 54.39 61.61 67.46 13 448
Fruits (Fresh) 54.94 84.58 25.70 14 37
Fruits (Dry) 5.40 6.27 7.95 7 227
Spices 42.78 49.12 31.13 11 75
Beverages etc. 38.62 43.04 27.25 10 128
Served Processed Food 69.16 99.42 51.40 11 95
Packaged Processed Food 37.98 33.95 23.17 4 66
Pan 0.44 3.01 4.43 14 473
Tobacco 17.62 18.81 15.35 9 209
Intoxicants 3.28 25.37 11.31 14 469
Fuel and Light 98.77 134.66 136.63 14 526
C lothing 243.96 137.72 87.26 1 9
Bedding etc. 2.85 6.17 6.54 10 422
Footwear 33.18 23.68 20.33 4 128
Education 107.19 114.28 67.24 6 97
Medical (Institutional) 13.57 87.84 26.00 13 205
Medical (Non-institutional) 111.81 151.87 74.33 11 73
Entertainment 24.82 39.89 22.67 14 211
Minor Durable Type Goods 5.06 7.12 5.50 8 285
Toilet Articles 38.84 45.45 38.16 11 243
Other Household Consumables 36.25 42.66 34.10 10 209
Consumer Services excl. Conveyance 107.07 143.63 85.63 12 109
Conveyance 113.08 186.49 95.22 13 154
Rent 13.53 48.43 52.20 14 284
Consumer Taxes & Cesses 3.95 11.16 8.91 14 301
Durable Goods 42.55 500.71 99.27 12 344
Monthly Per Capita Expenditure (MPCE) 1808.90 2655.99 1599.04 11 148
46
KeralaDistrict FactbookDistrict Factbook™™ Malappuram District
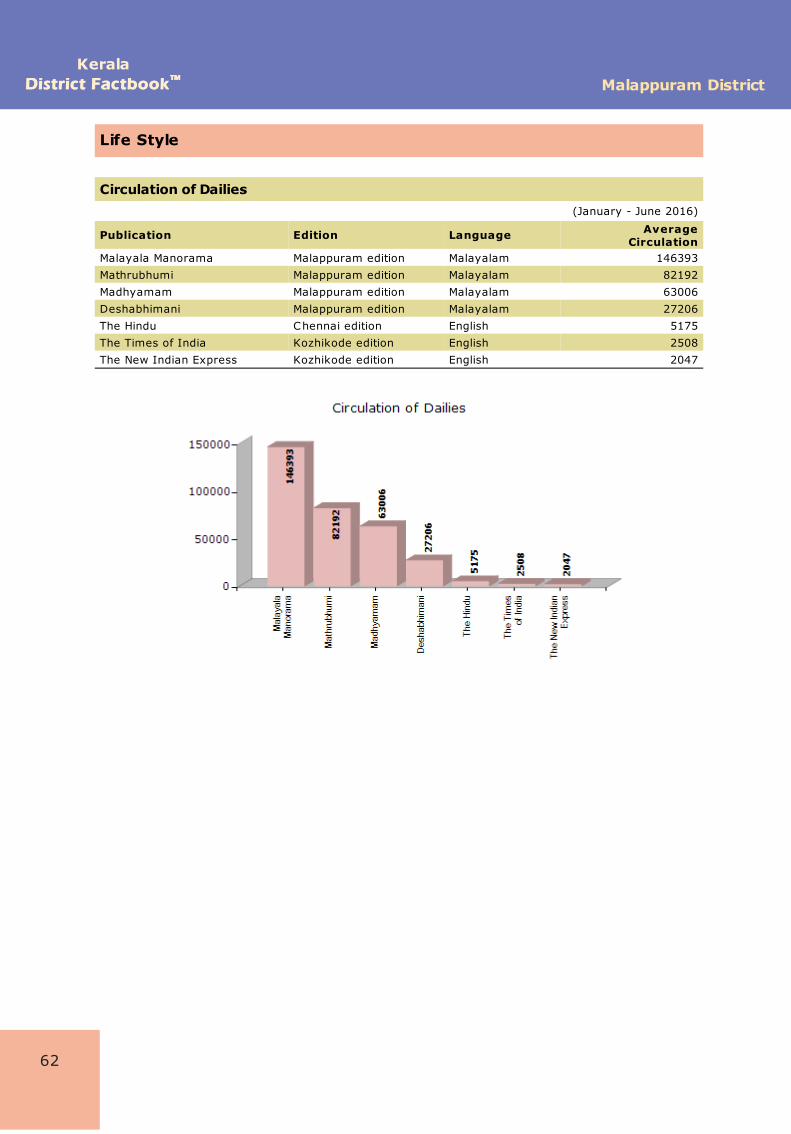
Life Style
Circulation of Dailies (January - June 2016)
Publication Edition Language AverageCirculation
Malayala Manorama Malappuram edition Malayalam 146393
Mathrubhumi Malappuram edition Malayalam 82192
Madhyamam Malappuram edition Malayalam 63006
Deshabhimani Malappuram edition Malayalam 27206
The Hindu Chennai edition English 5175
The Times of India Kozhikode edition English 2508
The New Indian Express Kozhikode edition English 2047
62
65
Malappuram DistrictKerala
District FactbookDistrict Factbook™™
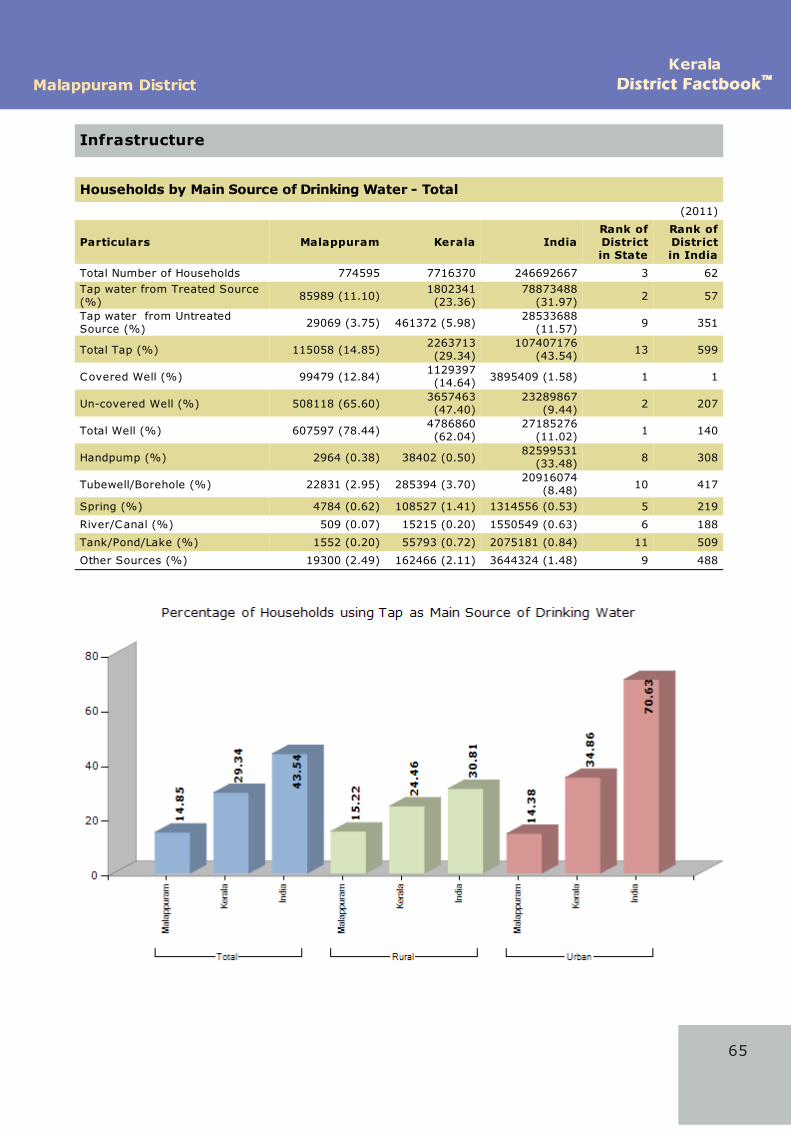
Infrastructure
Households by Main Source of Drinking Water - Total(2011)
Particulars Malappuram Kerala IndiaRank ofDistrictin State
Rank ofDistrictin India
Total Number of Households 774595 7716370 246692667 3 62Tap water from Treated Source(%) 85989 (11.10)
1802341(23.36)
78873488(31.97) 2 57
Tap water from UntreatedSource (%) 29069 (3.75) 461372 (5.98)
28533688(11.57) 9 351
Total Tap (%) 115058 (14.85)2263713(29.34)
107407176(43.54) 13 599
Covered Well (%) 99479 (12.84)1129397(14.64) 3895409 (1.58) 1 1
Un-covered Well (%) 508118 (65.60)3657463(47.40)
23289867(9.44) 2 207
Total Well (%) 607597 (78.44)4786860(62.04)
27185276(11.02) 1 140
Handpump (%) 2964 (0.38) 38402 (0.50)82599531
(33.48) 8 308
Tubewell/Borehole (%) 22831 (2.95) 285394 (3.70)20916074
(8.48) 10 417
Spring (%) 4784 (0.62) 108527 (1.41) 1314556 (0.53) 5 219
River/Canal (%) 509 (0.07) 15215 (0.20) 1550549 (0.63) 6 188
Tank/Pond/Lake (%) 1552 (0.20) 55793 (0.72) 2075181 (0.84) 11 509
Other Sources (%) 19300 (2.49) 162466 (2.11) 3644324 (1.48) 9 488
109
Malappuram DistrictKerala
District FactbookDistrict Factbook™™
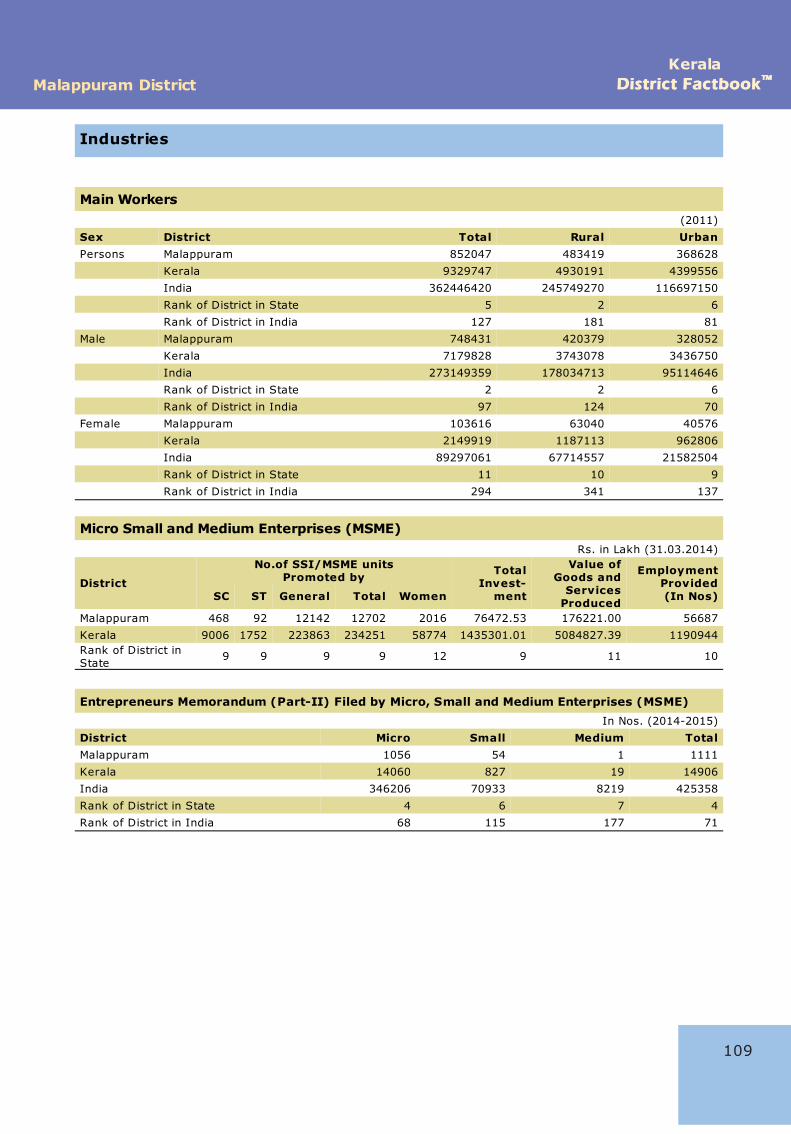
Industries
Main Workers(2011)
Sex District Total Rural UrbanPersons Malappuram 852047 483419 368628
Kerala 9329747 4930191 4399556
India 362446420 245749270 116697150
Rank of District in State 5 2 6
Rank of District in India 127 181 81
Male Malappuram 748431 420379 328052
Kerala 7179828 3743078 3436750
India 273149359 178034713 95114646
Rank of District in State 2 2 6
Rank of District in India 97 124 70
Female Malappuram 103616 63040 40576
Kerala 2149919 1187113 962806
India 89297061 67714557 21582504
Rank of District in State 11 10 9
Rank of District in India 294 341 137
Micro Small and Medium Enterprises (MSME) Rs. in Lakh (31.03.2014)
District
No.of SSI/MSME unitsPromoted by Total
Invest-ment
Value ofGoods and
ServicesProduced
EmploymentProvided(In Nos)SC ST General Total Women
Malappuram 468 92 12142 12702 2016 76472.53 176221.00 56687
Kerala 9006 1752 223863 234251 58774 1435301.01 5084827.39 1190944Rank of District inState
9 9 9 9 12 9 11 10
Entrepreneurs Memorandum (Part-II) Filed by Micro, Small and Medium Enterprises (MSME)In Nos. (2014-2015)
District Micro Small Medium TotalMalappuram 1056 54 1 1111
Kerala 14060 827 19 14906
India 346206 70933 8219 425358
Rank of District in State 4 6 7 4
Rank of District in India 68 115 177 71
KeralaDistrict FactbookDistrict Factbook™™ Malappuram District
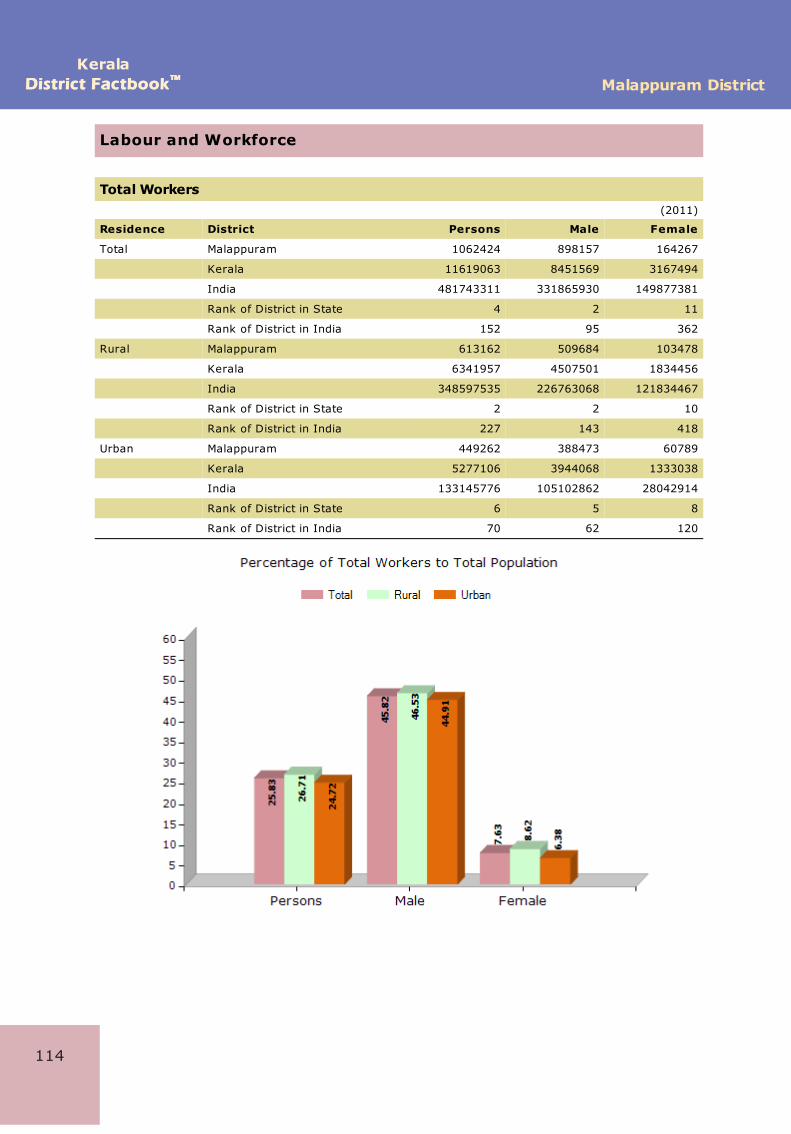
Labour and Workforce
Total Workers(2011)
Residence District Persons Male Female
Total Malappuram 1062424 898157 164267
Kerala 11619063 8451569 3167494
India 481743311 331865930 149877381
Rank of District in State 4 2 11
Rank of District in India 152 95 362
Rural Malappuram 613162 509684 103478
Kerala 6341957 4507501 1834456
India 348597535 226763068 121834467
Rank of District in State 2 2 10
Rank of District in India 227 143 418
Urban Malappuram 449262 388473 60789
Kerala 5277106 3944068 1333038
India 133145776 105102862 28042914
Rank of District in State 6 5 8
Rank of District in India 70 62 120
114
121
Malappuram DistrictKerala
District FactbookDistrict Factbook™™
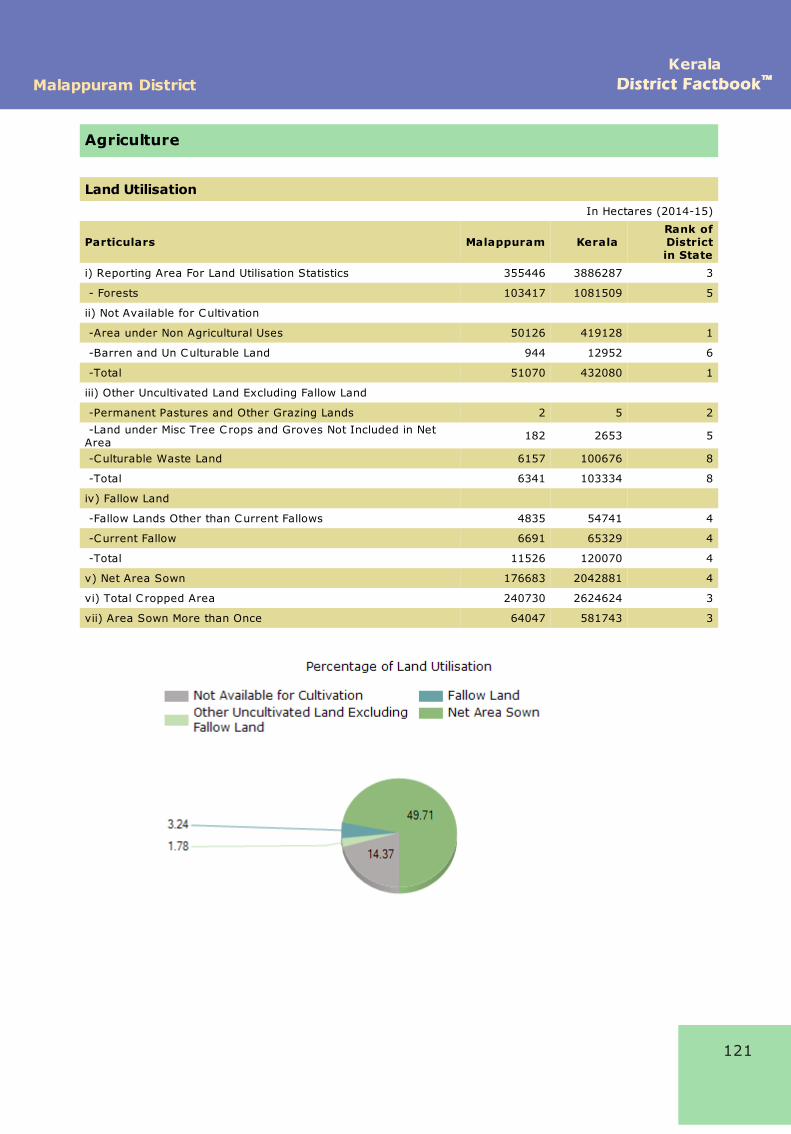
Agriculture
Land UtilisationIn Hectares (2014-15)
Particulars Malappuram Kerala Rank ofDistrictin State
i) Reporting Area For Land Utilisation Statistics 355446 3886287 3
- Forests 103417 1081509 5
ii) Not Available for Cultivation
-Area under Non Agricultural Uses 50126 419128 1
-Barren and Un Culturable Land 944 12952 6
-Total 51070 432080 1
iii) Other Uncultivated Land Excluding Fallow Land
-Permanent Pastures and Other Grazing Lands 2 5 2
-Land under Misc Tree Crops and Groves Not Included in NetArea
182 2653 5
-Culturable Waste Land 6157 100676 8
-Total 6341 103334 8
iv) Fallow Land
-Fallow Lands Other than Current Fallows 4835 54741 4
-Current Fallow 6691 65329 4
-Total 11526 120070 4
v) Net Area Sown 176683 2042881 4
vi) Total C ropped Area 240730 2624624 3
vii) Area Sown More than Once 64047 581743 3
KeralaDistrict FactbookDistrict Factbook™™ Malappuram District
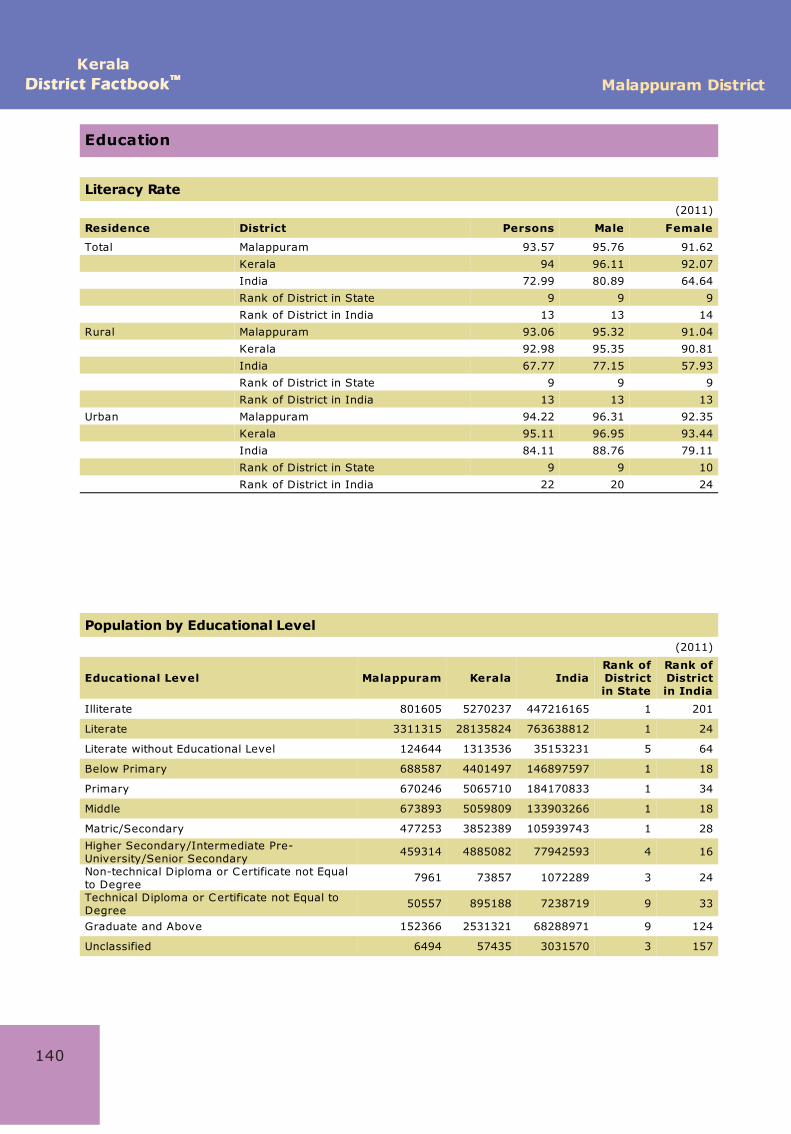
Education
Literacy Rate (2011)
Residence District Persons Male Female
Total Malappuram 93.57 95.76 91.62
Kerala 94 96.11 92.07
India 72.99 80.89 64.64
Rank of District in State 9 9 9
Rank of District in India 13 13 14
Rural Malappuram 93.06 95.32 91.04
Kerala 92.98 95.35 90.81
India 67.77 77.15 57.93
Rank of District in State 9 9 9
Rank of District in India 13 13 13
Urban Malappuram 94.22 96.31 92.35
Kerala 95.11 96.95 93.44
India 84.11 88.76 79.11
Rank of District in State 9 9 10
Rank of District in India 22 20 24
Population by Educational Level(2011)
Educational Level Malappuram Kerala IndiaRank ofDistrictin State
Rank ofDistrictin India
Illiterate 801605 5270237 447216165 1 201
Literate 3311315 28135824 763638812 1 24
Literate without Educational Level 124644 1313536 35153231 5 64
Below Primary 688587 4401497 146897597 1 18
Primary 670246 5065710 184170833 1 34
Middle 673893 5059809 133903266 1 18
Matric/Secondary 477253 3852389 105939743 1 28
Higher Secondary/Intermediate Pre-University/Senior Secondary
459314 4885082 77942593 4 16
Non-technical Diploma or Certificate not Equalto Degree
7961 73857 1072289 3 24
Technical Diploma or Certificate not Equal toDegree
50557 895188 7238719 9 33
Graduate and Above 152366 2531321 68288971 9 124
Unclassified 6494 57435 3031570 3 157
140
149
Malappuram DistrictKerala
District FactbookDistrict Factbook™™
Health
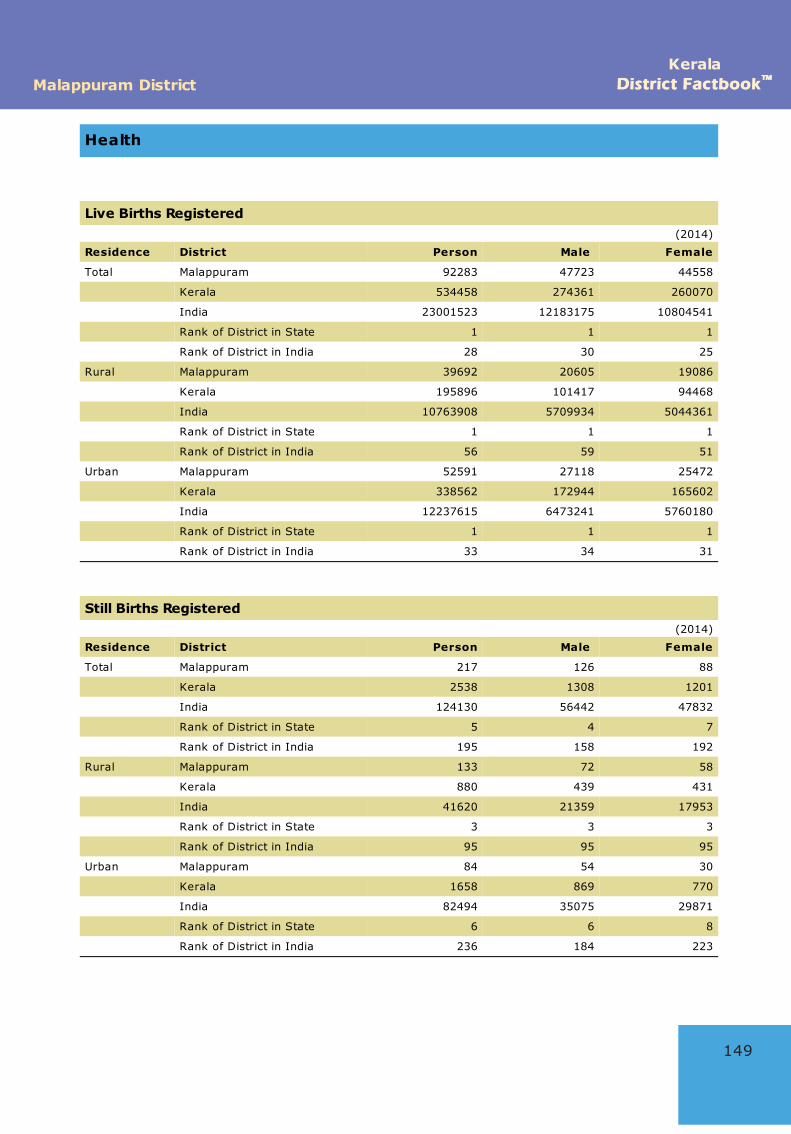
Live Births Registered(2014)
Residence District Person Male Female
Total Malappuram 92283 47723 44558
Kerala 534458 274361 260070
India 23001523 12183175 10804541
Rank of District in State 1 1 1
Rank of District in India 28 30 25
Rural Malappuram 39692 20605 19086
Kerala 195896 101417 94468
India 10763908 5709934 5044361
Rank of District in State 1 1 1
Rank of District in India 56 59 51
Urban Malappuram 52591 27118 25472
Kerala 338562 172944 165602
India 12237615 6473241 5760180
Rank of District in State 1 1 1
Rank of District in India 33 34 31
Still Births Registered(2014)
Residence District Person Male Female
Total Malappuram 217 126 88
Kerala 2538 1308 1201
India 124130 56442 47832
Rank of District in State 5 4 7
Rank of District in India 195 158 192
Rural Malappuram 133 72 58
Kerala 880 439 431
India 41620 21359 17953
Rank of District in State 3 3 3
Rank of District in India 95 95 95
Urban Malappuram 84 54 30
Kerala 1658 869 770
India 82494 35075 29871
Rank of District in State 6 6 8
Rank of District in India 236 184 223
155
Malappuram DistrictKerala
District FactbookDistrict Factbook™™
Health
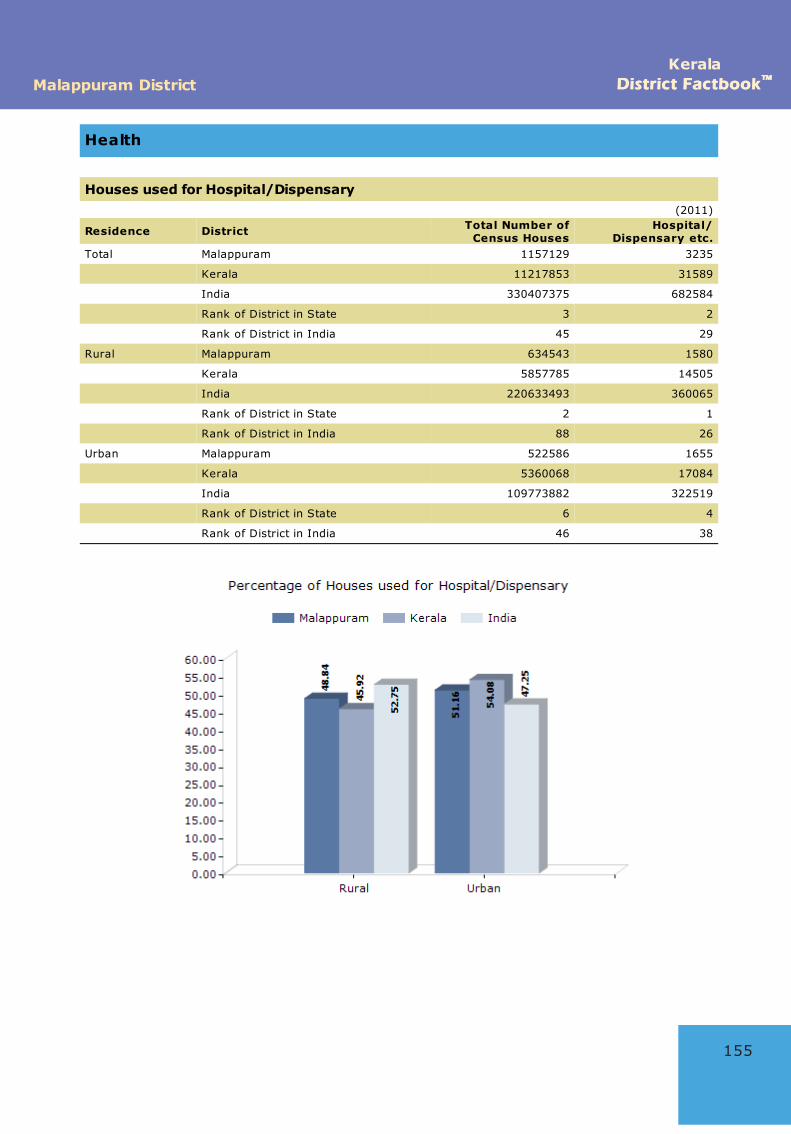
Houses used for Hospital/Dispensary(2011)
Residence District Total Number ofCensus Houses
Hospital/Dispensary etc.
Total Malappuram 1157129 3235
Kerala 11217853 31589
India 330407375 682584
Rank of District in State 3 2
Rank of District in India 45 29
Rural Malappuram 634543 1580
Kerala 5857785 14505
India 220633493 360065
Rank of District in State 2 1
Rank of District in India 88 26
Urban Malappuram 522586 1655
Kerala 5360068 17084
India 109773882 322519
Rank of District in State 6 4
Rank of District in India 46 38
KeralaDistrict FactbookDistrict Factbook™™ Malappuram District
Environment and Pollution
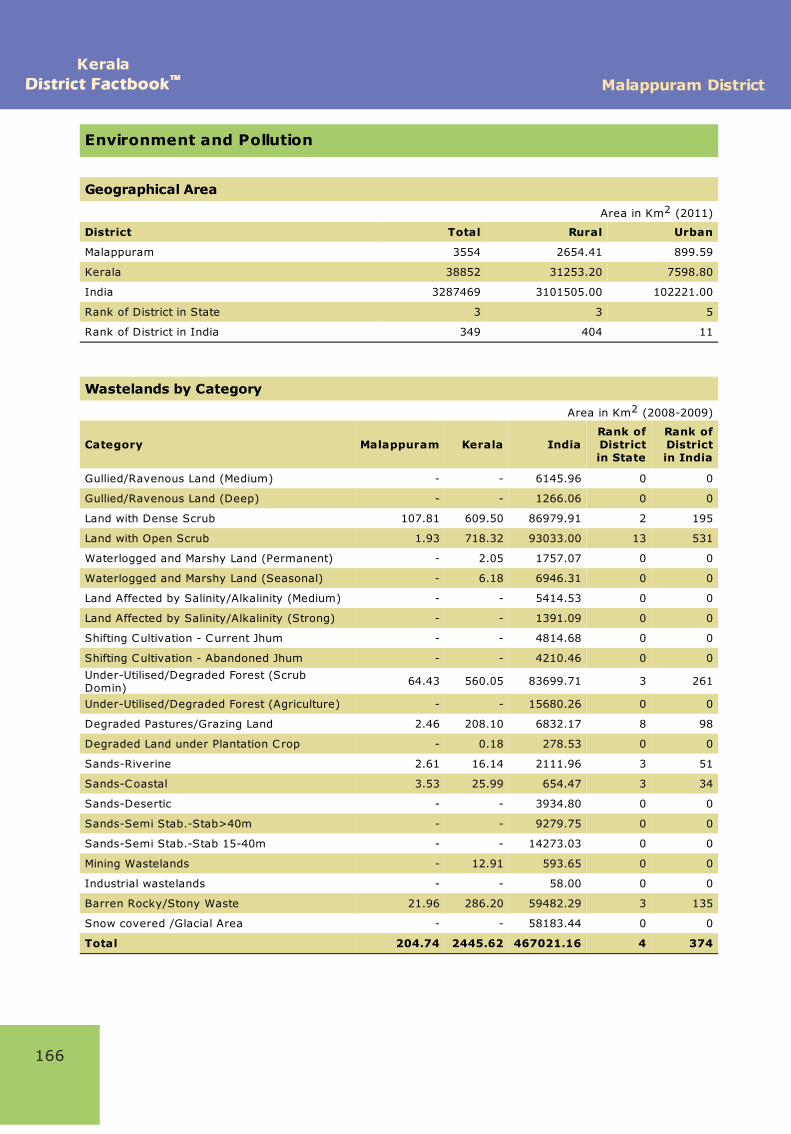
Geographical Area
Area in Km2 (2011)
District Total Rural Urban
Malappuram 3554 2654.41 899.59
Kerala 38852 31253.20 7598.80
India 3287469 3101505.00 102221.00
Rank of District in State 3 3 5
Rank of District in India 349 404 11
Wastelands by Category
Area in Km2 (2008-2009)
Category Malappuram Kerala IndiaRank ofDistrictin State
Rank ofDistrictin India
Gullied/Ravenous Land (Medium) - - 6145.96 0 0
Gullied/Ravenous Land (Deep) - - 1266.06 0 0
Land with Dense Scrub 107.81 609.50 86979.91 2 195
Land with Open Scrub 1.93 718.32 93033.00 13 531
Waterlogged and Marshy Land (Permanent) - 2.05 1757.07 0 0
Waterlogged and Marshy Land (Seasonal) - 6.18 6946.31 0 0
Land Affected by Salinity/Alkalinity (Medium) - - 5414.53 0 0
Land Affected by Salinity/Alkalinity (Strong) - - 1391.09 0 0
Shifting Cultivation - Current Jhum - - 4814.68 0 0
Shifting Cultivation - Abandoned Jhum - - 4210.46 0 0
Under-Utilised/Degraded Forest (ScrubDomin)
64.43 560.05 83699.71 3 261
Under-Utilised/Degraded Forest (Agriculture) - - 15680.26 0 0
Degraded Pastures/Grazing Land 2.46 208.10 6832.17 8 98
Degraded Land under Plantation Crop - 0.18 278.53 0 0
Sands-Riverine 2.61 16.14 2111.96 3 51
Sands-Coastal 3.53 25.99 654.47 3 34
Sands-Desertic - - 3934.80 0 0
Sands-Semi Stab.-Stab>40m - - 9279.75 0 0
Sands-Semi Stab.-Stab 15-40m - - 14273.03 0 0
Mining Wastelands - 12.91 593.65 0 0
Industrial wastelands - - 58.00 0 0
Barren Rocky/Stony Waste 21.96 286.20 59482.29 3 135
Snow covered /Glacial Area - - 58183.44 0 0
Total 204.74 2445.62 467021.16 4 374
166
KeralaDistrict FactbookDistrict Factbook™™ Malappuram District
Housing
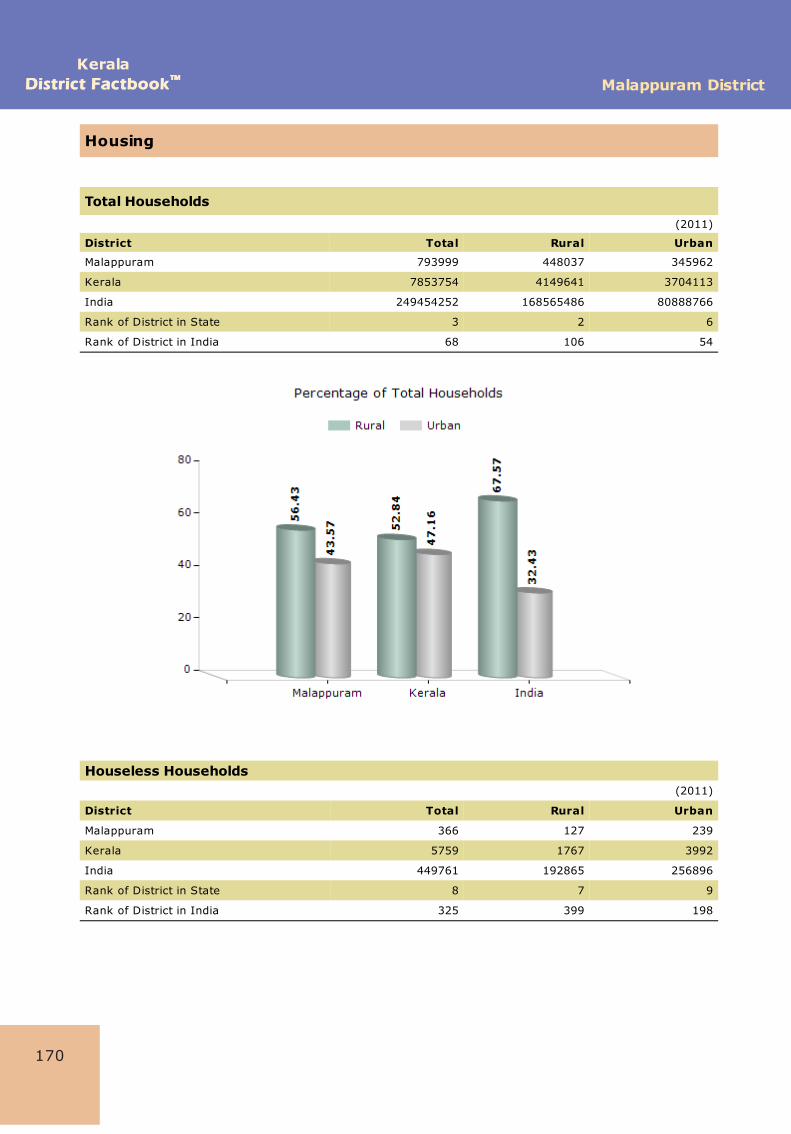
Total Households(2011)
District Total Rural Urban
Malappuram 793999 448037 345962
Kerala 7853754 4149641 3704113
India 249454252 168565486 80888766
Rank of District in State 3 2 6
Rank of District in India 68 106 54
Houseless Households(2011)
District Total Rural Urban
Malappuram 366 127 239
Kerala 5759 1767 3992
India 449761 192865 256896
Rank of District in State 8 7 9
Rank of District in India 325 399 198
170
KeralaDistrict FactbookDistrict Factbook™™ Malappuram District
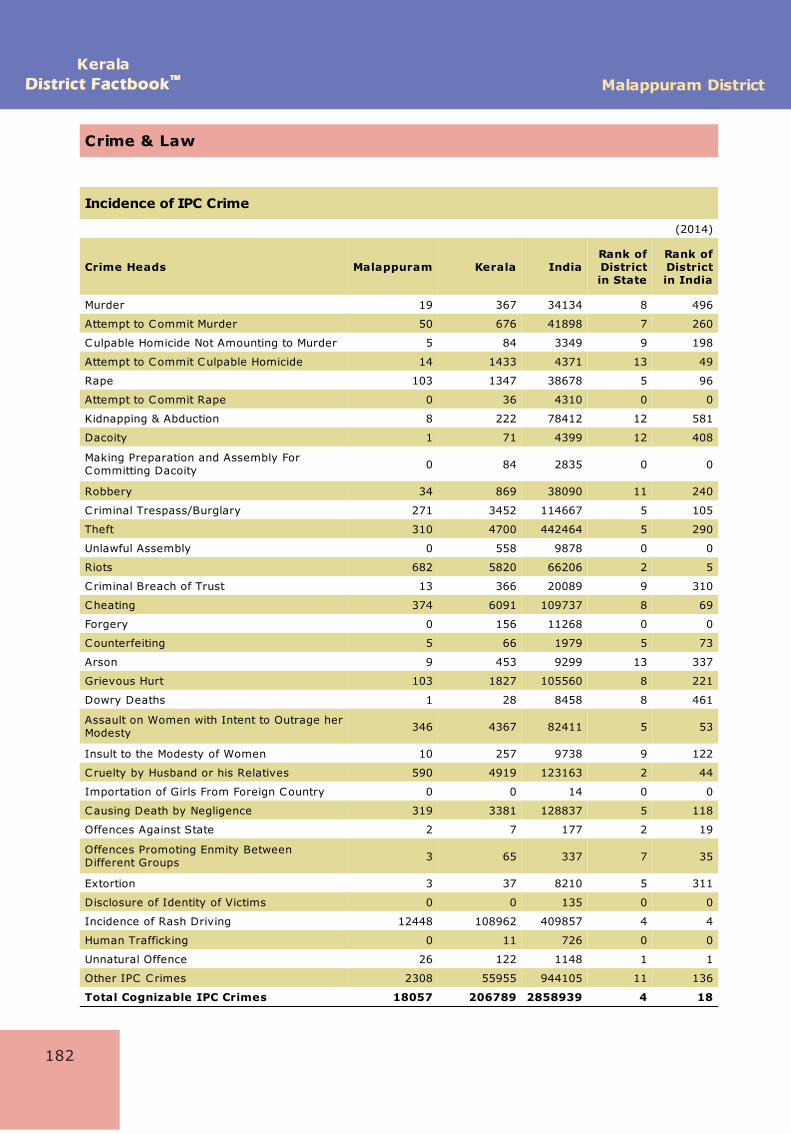
Crime & Law
Incidence of IPC Crime
(2014)
Crime Heads Malappuram Kerala IndiaRank ofDistrictin State
Rank ofDistrictin India
Murder 19 367 34134 8 496
Attempt to Commit Murder 50 676 41898 7 260
Culpable Homicide Not Amounting to Murder 5 84 3349 9 198
Attempt to Commit Culpable Homicide 14 1433 4371 13 49
Rape 103 1347 38678 5 96
Attempt to Commit Rape 0 36 4310 0 0
Kidnapping & Abduction 8 222 78412 12 581
Dacoity 1 71 4399 12 408
Making Preparation and Assembly ForCommitting Dacoity 0 84 2835 0 0
Robbery 34 869 38090 11 240
Criminal Trespass/Burglary 271 3452 114667 5 105
Theft 310 4700 442464 5 290
Unlawful Assembly 0 558 9878 0 0
Riots 682 5820 66206 2 5
Criminal Breach of Trust 13 366 20089 9 310
Cheating 374 6091 109737 8 69
Forgery 0 156 11268 0 0
Counterfeiting 5 66 1979 5 73
Arson 9 453 9299 13 337
Grievous Hurt 103 1827 105560 8 221
Dowry Deaths 1 28 8458 8 461
Assault on Women with Intent to Outrage herModesty 346 4367 82411 5 53
Insult to the Modesty of Women 10 257 9738 9 122
Cruelty by Husband or his Relatives 590 4919 123163 2 44
Importation of Girls From Foreign Country 0 0 14 0 0
Causing Death by Negligence 319 3381 128837 5 118
Offences Against State 2 7 177 2 19
Offences Promoting Enmity BetweenDifferent Groups 3 65 337 7 35
Extortion 3 37 8210 5 311
Disclosure of Identity of Victims 0 0 135 0 0
Incidence of Rash Driving 12448 108962 409857 4 4
Human Trafficking 0 11 726 0 0
Unnatural Offence 26 122 1148 1 1
Other IPC Crimes 2308 55955 944105 11 136
Total Cognizable IPC Crimes 18057 206789 2858939 4 18
182
189
Malappuram DistrictKerala
District FactbookDistrict Factbook™™
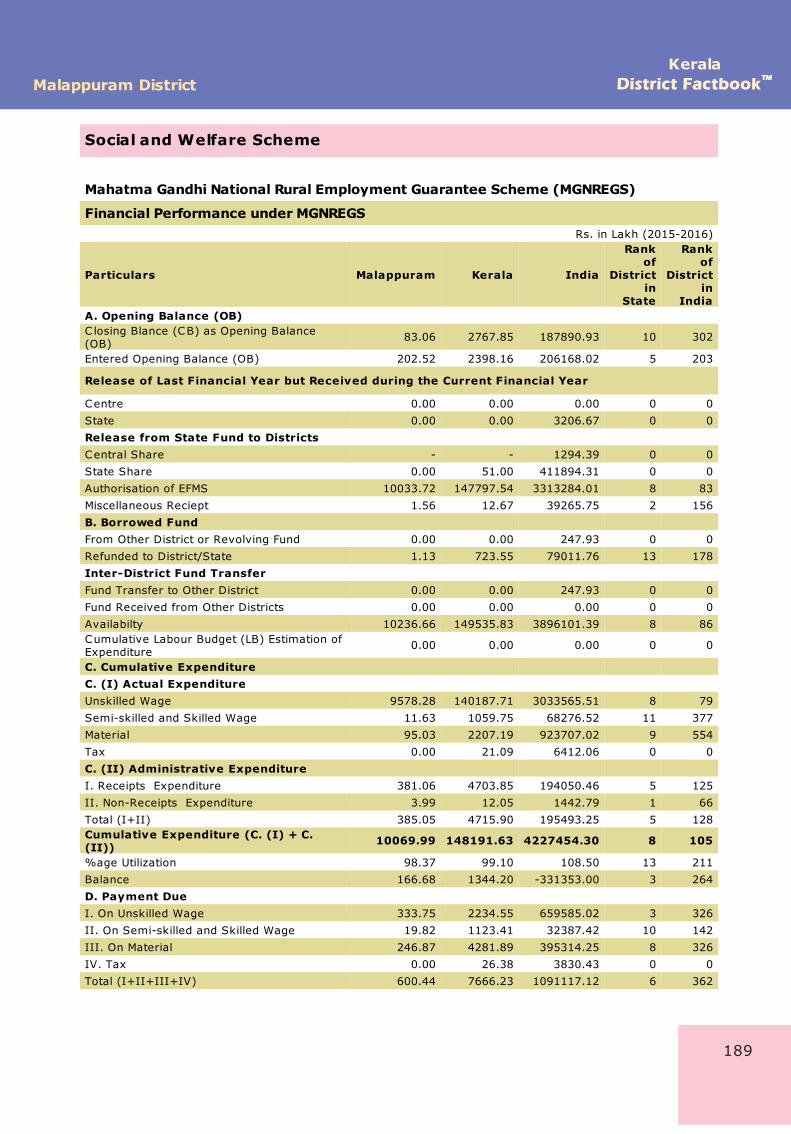
Social and Welfare Scheme
Mahatma Gandhi National Rural Employment Guarantee Scheme (MGNREGS)
Financial Performance under MGNREGSRs. in Lakh (2015-2016)
Particulars Malappuram Kerala India
Rankof
Districtin
State
Rankof
Districtin
IndiaA. Opening Balance (OB)C losing Blance (CB) as Opening Balance(OB)
83.06 2767.85 187890.93 10 302
Entered Opening Balance (OB) 202.52 2398.16 206168.02 5 203
Release of Last Financial Year but Received during the Current Financial Year
Centre 0.00 0.00 0.00 0 0
State 0.00 0.00 3206.67 0 0
Release from State Fund to DistrictsCentral Share - - 1294.39 0 0
State Share 0.00 51.00 411894.31 0 0
Authorisation of EFMS 10033.72 147797.54 3313284.01 8 83
Miscellaneous Reciept 1.56 12.67 39265.75 2 156
B. Borrowed Fund From Other District or Revolving Fund 0.00 0.00 247.93 0 0
Refunded to District/State 1.13 723.55 79011.76 13 178
Inter-District Fund TransferFund Transfer to Other District 0.00 0.00 247.93 0 0
Fund Received from Other Districts 0.00 0.00 0.00 0 0
Availabilty 10236.66 149535.83 3896101.39 8 86Cumulative Labour Budget (LB) Estimation ofExpenditure
0.00 0.00 0.00 0 0
C. Cumulative Expenditure C. (I) Actual ExpenditureUnskilled Wage 9578.28 140187.71 3033565.51 8 79
Semi-skilled and Skilled Wage 11.63 1059.75 68276.52 11 377
Material 95.03 2207.19 923707.02 9 554
Tax 0.00 21.09 6412.06 0 0
C. (II) Administrative Expenditure I. Receipts Expenditure 381.06 4703.85 194050.46 5 125
II. Non-Receipts Expenditure 3.99 12.05 1442.79 1 66
Total (I+II) 385.05 4715.90 195493.25 5 128Cumulative Expenditure (C. (I) + C.(II)) 10069.99 148191.63 4227454.30 8 105
%age Utilization 98.37 99.10 108.50 13 211
Balance 166.68 1344.20 -331353.00 3 264
D. Payment DueI. On Unskilled Wage 333.75 2234.55 659585.02 3 326
II. On Semi-skilled and Skilled Wage 19.82 1123.41 32387.42 10 142
III. On Material 246.87 4281.89 395314.25 8 326
IV. Tax 0.00 26.38 3830.43 0 0
Total (I+II+III+IV) 600.44 7666.23 1091117.12 6 362

i
Get Complete BookAt Datanet India eBooks Store
www.datanetindia-ebooks.comor go directly at
http://www.datanetindia-ebooks.com/District_Factbook/Kerala/Malappuram
KeralaMalappuram District District Factbook™