30
Intuit Overview March 2017
| Date post: | 20-Mar-2017 |
| Category: |
Investor Relations |
| Upload: | investorsintuitinc |
| View: | 3,150 times |
| Download: | 1 times |

Intuit OverviewMarch 2017

2
These presentation materials include forward-looking statements. There are a number of factors that could cause our results to differ materially from our expectations. Please see the section entitled “Cautions About Forward-Looking Statements” in the enclosed Appendix for information regarding forward-looking statements and related risks and uncertainties. You can also learn more about these risks in our Form 10-K for fiscal 2016 and our other SEC filings, which are available on the Investor Relations page of Intuit's website at www.intuit.com. We assume no obligation to update any forward-looking statement.
Forward-Looking Statements

Intuit’s strategy and addressable market

Delivering AwesomeProduct Experiences
Using Data toCreate Delight
Enabling the Contributions of Others - “Network Effect
Platforms”
Be the Operating System Behind SMB Success Do the Nations’ Taxes
EmployeesCreate an environment where the world’s top talent can do the best work of their lives
ShareholdersInspire confidence in our long
term growth, leading to a higher stock price
CustomersDelight customers more than
rivalsin ways that matter most
PartnersDelight partners who
add value to the ecosystem
Integrity Without Compromise We Care & Give Back
Be PassionateBe Bold Be Decisive Learn Fast Win Together Deliver Awesome
To improve our customers’ financial lives so profoundly… they can’t imagine going back to the old way
Values
TrueNorthGoals
Strategy
Mission
Win worldwidewith QBO
Ecosystem
Win withaccountants whofuel SMB success
Win withTurboTax Online
and MobileTechnology to
accelerate growthData-drivenintelligentsystems
Industry-widesecurity
leadershipPriorities
Metrics
• Deliver customer benefit• Grow TAM and share vs.
rivals• Grow customers• Increase attach• Improve QBO ecosystem
NPS vs. rivals (NTTF, Accountants)
• Deliver the customer benefit
• Grow DIY category vs.assisted methods
• Grow online/mobile sharevs. rivals
• Improve conversion• Increase TTO NPS vs. rivals
• Reduce fraud …Intuit customers & industry
• Uphold Intuit trust rating
• Increase % availability of prioritized data sources (business reporting)
• Reduce time-to-insight• Improve conversion withpersonalized experiences
• TTO • QBO
• Increase adoption of and % ready-to-consume strategic services
• Reduce downtime minutes & failed customer interactions
• Reduce contact rate• Reduce developer release cycle time
• Increase % of developers & agents on common (fewer) tools
•Deliver the customer benefit• Accelerate growth in # of multi-service firms
•Accelerate growth in QBO+3•Increase NPS vs rivals
• QBOA• Multi-service firms• Online Tax
4
5
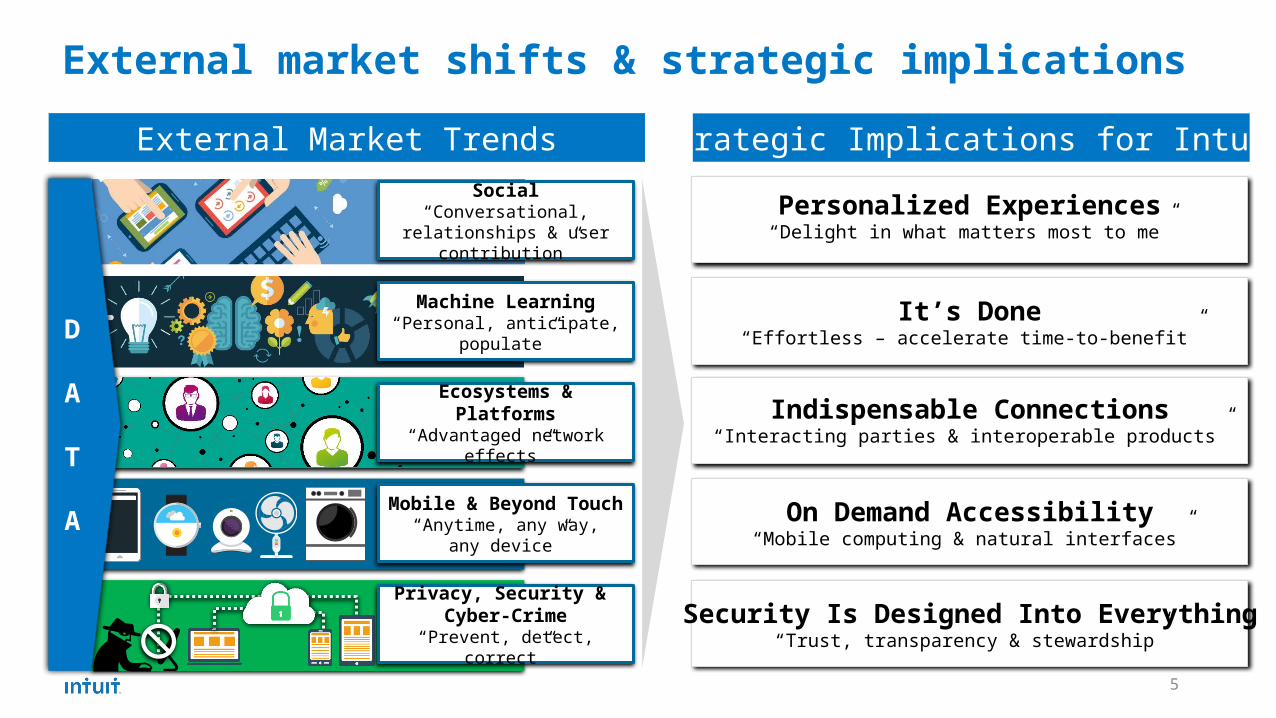
External market shifts & strategic implicationsExternal Market Trends Strategic Implications for Intuit
Personalized Experiences“Delight in what matters most to me”
It’s Done“Effortless – accelerate time-to-benefit”
Indispensable Connections“Interacting parties & interoperable products”
On Demand Accessibility“Mobile computing & natural interfaces”
Security Is Designed Into Everything“Trust, transparency & stewardship”
Social“Conversational,
relationships & user contribution”
Machine Learning“Personal, anticipate,
populate”
Mobile & Beyond Touch
“Anytime, any way,any device”
Privacy, Security & Cyber-Crime
“Prevent, detect, correct”
Ecosystems & Platforms
“Advantaged network effects”
D
A
T
A

6
Accelerating to the cloud Increasing connected services revenueFY’12-’16
CAGR
-1%
12%
FY’13
9M
FY’12 FY’14 FY’15
8M
21M
33M$4,243 $4,192$3,946$3,663
Connected servicesProduct
34%
66%61% 63%
39%37%
73%
FY’12 FY’13 FY’14 FY’15 FY'16
362 455 600 877 1226 1832
83
198
287FY’12-’16 CAGR
36%
100%
Growing global customers
In thousands
Leaned into the cloud Created new connections Entered new markets
FY’12-’16 CAGR
-3%
12%
…tangible proof points of successfulbusiness model transition
27%
QBO non-USQBO US
Online customersDesktop customers
$M
Multi-Year Transformation: Product and Platform Company
$4,694
73%
27%
FY’16 FY’13FY’12 FY’14 FY’15 FY’16

7
Looking back: more than doubling TAM with tangible traction
Cumulative Total Addressable Market Opportunity
Reasons to Believe3
• Enter new markets with QuickBooks ecosystem • Accelerate with Self-Employed
Entering New Markets
$51B - $57B
2 Connecting the Ecosystem• Increase attach / solve additional problems• Facilitate new connections
$36B - $42B
1• Accelerate shift to cloud• Convert non-consumption
$17B - $20B
Growing Our Categories
• Expanded prospect pool … 6 priority countries = 150M prospects- FY’17 Q2: non-US QBO paid subs ~370K … growing +61%, both the
U.K. and Canada over 100K paid subs
• Accelerated by targeting Self-Employed /gig economy (majority of TAM)- FY’17 Q2: ~180K paid subs (+3.6X YOY) … recently entered Australia
• Attach rates of Intuit and 3rd party solutions increase ARPC & retention- FY’16: QBO users adopting at least one 3rd party app is 15% (vs 10%
prior yr)- FY’16: attaching solutions can increase QBO retention by 10 pts
• One Intuit Ecosystem connections- FY’16: SMB & acct collaboration … 640K QBO subs have linked with an
acct- FY’16: Improved SMB cash flow … 43M e-invoices (+48%) … paid in 1/3
time- FY’16: QB Financing … $450M+ SMB loans to date … 70% approval in
days- FY’16: QBSE to TurboTax … 30% QBSE penetration … avg. $4,340 tax
savings
• Cloud and mobile adoption expanding our categories > historical rates- FY’16: QB active user base +3% … QB paid users +23% … QB new users +15%- FY’16: DIY tax category grew 5X faster than assisted … gained >1 pt share
• New customers choosing cloud & mobile solutions- FY’16: 65% new SMBs chose QBO … 84% new QBO users 1st time users - FY’16: 90% new tax filers chose TTO … those who filed on mobile up 4X
Win worldwide with the
QBO ecosystem
9
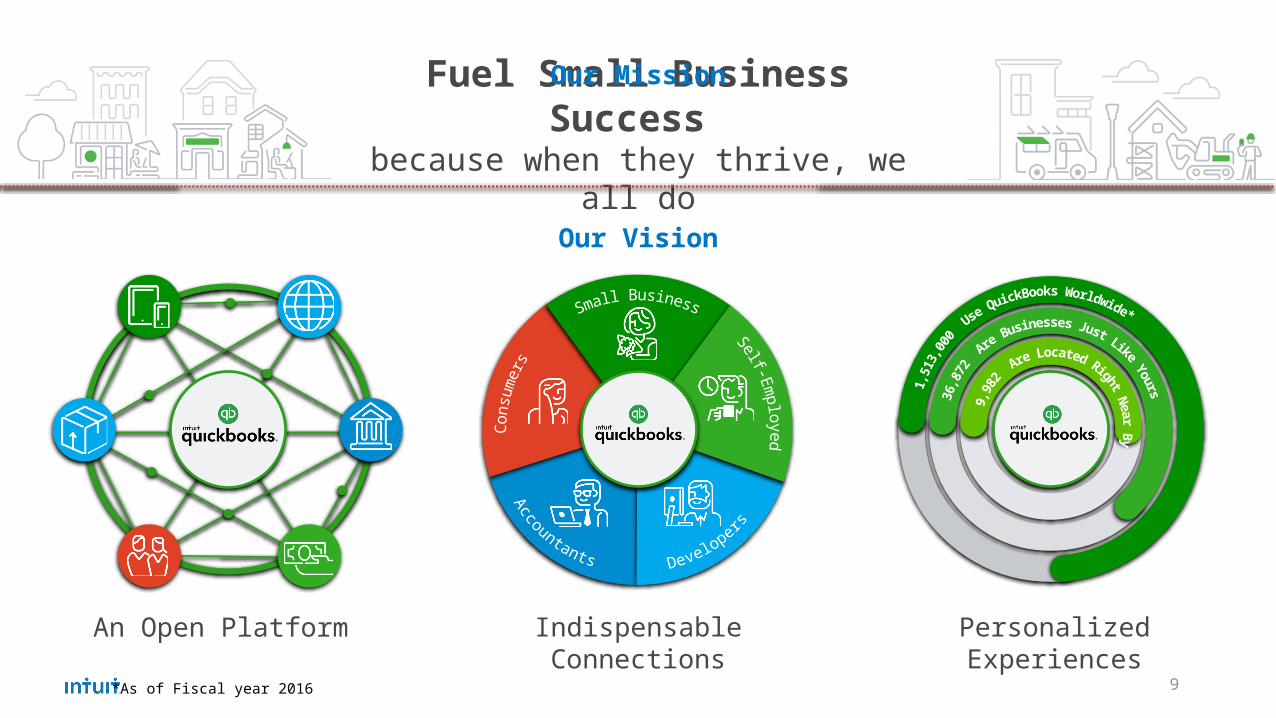
An Open Platform Indispensable Connections
Fuel Small Business Success
because when they thrive, we all do
Our Mission
Our Vision
Personalized Experiences
*As of Fiscal year 2016
10
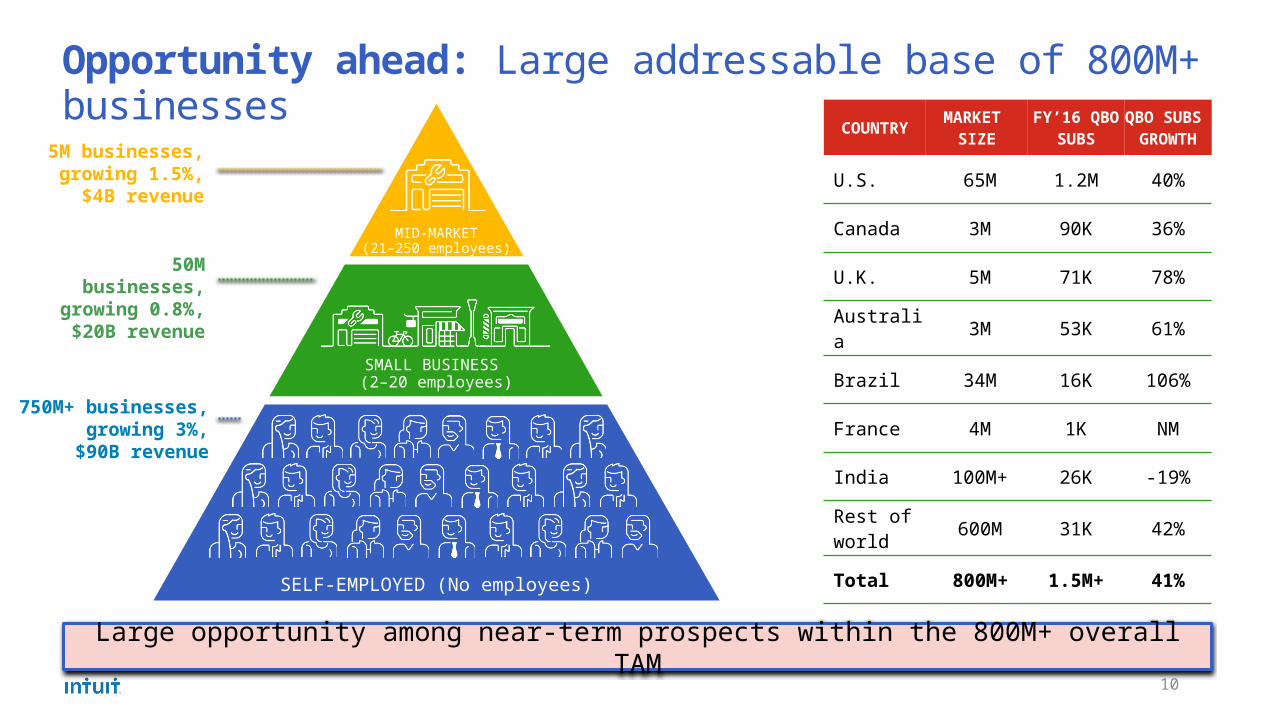
Opportunity ahead: Large addressable base of 800M+ businesses
5M businesses,
growing 1.5%, $4B revenue
50M businesses,
growing 0.8%, $20B revenue
750M+ businesses,
growing 3%,$90B revenue
COUNTRY MARKET SIZE
FY’16 QBO SUBS
QBO SUBS
GROWTH
U.S. 65M 1.2M 40%
Canada 3M 90K 36%
U.K. 5M 71K 78%
Australia 3M 53K 61%
Brazil 34M 16K 106%
France 4M 1K NM
India 100M+ 26K -19%Rest of world 600M 31K 42%
Total 800M+ 1.5M+ 41%
Large opportunity among near-term prospects within the 800M+ overall TAM
MID-MARKET(21–250 employees)
SMALL BUSINESS (2–20 employees)
SELF-EMPLOYED (No employees)

11
FY’16 Subs growth driven by strength throughout the funnel
Expand TAM & increase penetration• Non-U.S. QBO subs grew 45% to 287K• More to do on product market fit outside U.S.• Grew Self-Employed 3.4x to 85K
Improve conversion• Improved QBO first time use, conversion +1 point• Integrated Self-Employed with TurboTax, 30% attach• 640K QBO subs have linked to an accountant• Opportunity to increase payroll and payments penetration
Improve customer experience• Product & platform work improved NPS by 5 points• Self-Employed launched mileage tracking; app has 4+
stars• Accountant NPS +14 points with refreshed platform
214M 224M +5%
50M 69M +38%
1.9M 2.3M +21%
666K 837K +26%
69% 70% +1pt
FY’15 FY’16 YoY
TAM in Core Countries
Traffic
Signups
GrossNew Subs
438Knet
adds
Accelerated QBO base growth in FY’16, up 41% to 1.5M+ subs from 1.1M in FY’15
Cohorted Retention
(12 month)
392K
FY’15
Acquisition funnel for QBO Worldwide

12
FY’17 outlook: Online ecosystem driving franchise growth
Grow to 2.2M online subscribers Grow online revenue 25–30%
FY'14 FY'15 FY'16 FY'17QB Desktop QBO U.S. QB Self-EmployedQBO Non-U.S.
QB Customer GrowthPaying QBO users and Desktop purchases
2.3M2.1M
2.8M
QBO subscribers
Desktop units/ subscribers
1.5M1.1M0.7M
3.4M
2.2M
1.2M
FY'14 FY'15 FY'16 FY'17
Desktop Revenue Online Revenue
Small Business Revenue
Our business continues to evolve, growth being driven by our QBO ecosystem
$2.1B $2.0B$2.2B
$2.4B-$2.5B
Online Revenue
Desktop Revenue

13
Long-term growth driversOne point of growth in these key drivers
…
Number of addressable SMBs
Accounting software consumption
QuickBooks share
QuickBooks ARPC (Attach, Price, Mix)
Yields revenue growth of … Multi-year range
~1% 1 - 2%
~4% 4 - 6%
~3% 1 - 2%
~1% 4 - 5%
Implied Small Business Rev Growth: 10 – 15%
Continuing focus on customer growth in FY’17, while delivering 9% to 11% revenue growth

Win with accountants who fuel SMB success

15
Intuit leads ingrowth categories
Total individual returns U.S./Canada (M)
CAGRFY'13-'16
1%
(3%)
4%
(9%)
#1 Position• 26M returns• 31% share of returns
#1 Position• 45M returns• 65% share of returns
69
19
82
FY’16
178
7
Pros
Stores
Software
Manual
Leadership position with opportunity to capture share
#1 Position in the two growing categories of the tax prep market, DIY and Pros

16
Small businesses and accountants depend on each other
TotalNumber
% Using Bookkeeping
Services
% Using Tax Services
85% on Tax and Accounting
Who accountants serve
Where accountants make money
% of U.S. Small Businesses/Self-Employed using Accountants
Value of Small Businesses/Self-Employed to Accountants
Tax55%
Other15%
Consumer40%
Small Business 60%
15M
6M
44M
Registered Employers
Sole Proprietor QBO
Service Economy
70%
70%
9% 79%
89% of small businesses say they are more successful when they work with an accountant
79%
95%
Accounting
30%

17
Strategy: Operating system behind accountant success
Accounting and Tax Are Done
Connect SMBs and Accountants
Collaborate and Get Insights
Ideal State Goals
Zero wasted hours
100% firms achieve ideal growth rate
2 SMB success increases 50%1 3
One Online Platform… “THE OPERATING SYSTEM” behind accountants’ success
Grow the Business
Save Time
Grow My Practice
Manage My
Employees
Transact with
Customers
Collaborate
Save Time Grow My Practice Make a Difference
The Place where accountants and their clients work, grow and collaborate

Win with TurboTax online and mobile

19
Intuit leads ingrowth categories
Total individual returns U.S./Canada (M)
CAGRFY'13-'16
1%
(3%)
4%
(9%)
#1 Position• 26M returns• 31% share of returns
#1 Position• 45M returns• 65% share of returns
69
19
82
FY’16
178
7
Pros
Stores
Software
Manual
Well-positioned: Processing ~40% of all individual tax returns
#1 Position in the two growing categories of the tax prep market, DIY and Pros

20
U.S. Market opportunity: room for growth
COMPLEX SIMPLE TOTALS 5-YEAR TREND
Tax StoreNPS: 42 8M 8M 16M
ProsNPS: 39 46M 23M 69M
DIYNPS: 49 26M 34M 60M
ManualNPS: (45) 2M 3M 5M
+0% CAGR
-4% CAGR
+5% CAGR
-9% CAGR
FY07 FY08 FY09 FY10 FY11 FY12 FY13 FY14 FY15 FY160
10
20
30
40
50
60
70
47% 46%
15% 11%
57%61%
TaxStore
Pros
• While DIY continues to disrupt stores and has 40% unit share, the category captures less than 10% share of spend
• Over 30M simple returns still being processed through pros and tax stores at higher ARPC and lower NPS
Strong progress disrupting tax storesOpportunities to reimagine the Pro experience
DIY category growth outpacing all othersStill many simple filers not willing to try it

21
Well-positioned: DIY software category continues to expand
0
20
40
60
80
100
120
140
160
37%
4%
57%
39%
FY’09
143
9%
30%
60%
FY’08
143
10%
28%
61%
FY’07
138 141
8%
32%
60%
FY’10
12%
27%
61%
FY’11 FY’12
143 145
FY’13 FY’14 FY’15 FY’166%
34%
145 147
58% 57%
4%
40%
59%60%
35%
4%5%
36%
60%
5%
149 151
DIY SoftwareAssisted (Pro/Tax Store)
DIY Manual
Returns (M)U.S. Only

22
60
16
69
5
151
FY’16
Well-positioned: Our share of DIY continues to expand
Pros
Stores
Software
Manual
Total IndividualReturns U.S.
(M)
1%
(4%)
5%
(8%)
#1 Share Position in U.S. with 65%… 40M Returns Processed in FY’16
59% 61% 62% 65%
14% 13% 13% 11%18% 17% 17% 15%
9% 9% 9% 8%
FY’15
Competitor 2
Competitor 1
Other
FY’16FY’14FY’13
CAGRFY'13-'16

23
Strong performance, but opportunities to improve
Total Visitors(DIY Consideration)
Log-Ins
Returns Filed
Attrition
3.6Mnet adds
FY’15 FY’16 YoY
89M 92M +3%
34M 39M +12%
24M 28M +15%
6M 6M (3%)
2.3M 3.6M 56%
Expanded top of funnel and improved overall conversion
• Total TurboTax Online net customer adds up 56%• New and Free segments both growing +21%• Overall conversion >70% (> 1 pt improvement YOY)• Retention rate >75% (> 1 pt improvement YOY)
Opportunities • Expand consideration beyond just DIY• Improve new (first year) conversion rate• Improve Free retention rate
Our approach• Solidify brand trust given industry related security
concerns• Reassure ‘Max Refund’ as the benefit• Explain how software delivers accurate returns• Communicate our value
TurboTax Online US Funnel

24
2005 2006 2007 2008 2009 2010 2011 2012 2013 2014 2015 2016$0
$10
$20
$30
$40
$50
$29$34
$38 $38 $39 $42 $43 $46 $47 $47 $49 $49
Maintaining ARPC through business model transformation
Average Revenue Per U.S. TurboTax Return
• Continuing to drive share through free while maintaining or improving revenue per customer• As we build a large free customer base, we need to continue to add incremental value that they’ll pay for• Nearly 50M simple returns still using alternative providers in DIY or methods such as an assisted experience
Tax Act Launches Free Fed Edition
TTO Value Tier Promo
TTO Absolute
Zero Promo
Expanded Absolute
Zero Promo
TTO Free Fed Edition rolled out broadly

25
One point of growth in these key drivers…
IRS returns
Category share
Total TurboTax share
Revenue per return
Yields revenue growth of… Multi-year range
~1% 0 - 2%
~3% 3 - 5%
~1.5% 1 - 2%
~1% ~1%
With operating margins of 60%+
Long-term growth drivers
In our core DIY business, we anticipate revenue growth ranging between 5-10%

Intuit financial perspectives

27
Grow organic revenue double digits• Sustain small business online ecosystem growth 25-30%; win every tax season
Grow revenue faster than expenses• Margins expanding as we invest for growth
Deploy cash to the highest-yield opportunities• Investing in organic growth drivers (R&D, infrastructure, sales & marketing)• Use acquisitions to accelerate growth in talent and technology• Return cash to shareholders via dividend and share repurchase
Maintain a strong balance sheet• Net cash position at the end of FY
Financial principles remain enduring

28
FY’14 – FY’19 revenue trends
Online revenue driving growth, desktop remains important
FY’16
FY’15
FY’14
FY’17
FY’18
FY’19
TT OnlineSBG Online
Desktop60%
40%
1. Online is the engine ... ~60% of our revenues by FY’19
2. Small business online ecosystem revenue accelerating
3. Steady desktop revenue base
37%
63%

29
• Balance share repurchases and dividends subject to the same disciplined return on investment we apply to all uses of cash
• Increased dividend from $0.60 in FY’12 to $1.36 for FY’17
• Maintain investment-grade credit rating
Disciplined and consistent capital allocation
Returning cash to shareholders
Generate strong free cash flow; returned ~130% to shareholders over last 5 years
30
Cautions about Forward-Looking StatementsThis presentation includes "forward-looking statements" which are subject to safe harbors created under the U.S. federal securities laws. All statements included in this presentation that address activities, events or developments that Intuit expects, believes or anticipates will or may occur in the future are forward looking statements, including: our expected market, customer and share growth; our goals, our ability to achieve them, and their impact on our business; our opportunities and strategies to grow our business; our expected revenue results and growth; our expectations regarding future dividends, share repurchases and ROIC improvements; our expectations for our product and service offerings and cross-sell opportunities; and future market trends. Because these forward-looking statements involve risks and uncertainties, there are important factors that could cause our actual results to differ materially from the expectations expressed in the forward-looking statements. These factors include, without limitation, the following: inherent difficulty in predicting consumer behavior; difficulties in receiving, processing, or filing customer tax submissions; consumers may not respond as we expected to our advertising and promotional activities; the competitive environment; governmental encroachment in our tax businesses or other governmental activities or public policy affecting the preparation and filing of tax returns; our ability to innovate and adapt to technological change; availability of our products and services could be impacted by business interruption or failure of our information technology and communication systems; any problems with implementing upgrades to our customer facing applications and supporting information technology infrastructure; any failure to properly use and protect personal customer information and data; our ability to develop, manage and maintain critical third-party business relationships; increases in or changes to government regulation of our businesses; any failure to process transactions effectively or to adequately protect against potential fraudulent activities; any loss of confidence in using our software as a result of publicity regarding such fraudulent activity; any significant product accuracy or quality problems or delays; any lost revenue opportunities or cannibalization of our traditional paid franchise due to our participation in the Free File Alliance; the global economic environment may impact consumer and small business spending, financial institutions and tax filings; changes in the total number of tax filings that are submitted to government agencies due to economic conditions or otherwise; the seasonal and unpredictable nature of our revenue; our ability to attract, retain and develop highly skilled employees; increased risks associated with international operations; unanticipated changes in our income tax rates; changes in the amounts or frequency of share repurchases or dividends; we may issue additional shares in an acquisition causing our number of outstanding shares to grow; our inability to adequately protect our intellectual property rights may weaken our competitive position; disruptions, expenses and risks associated with our acquisitions and divestitures; amortization of acquired intangible assets and impairment charges; our use of significant amounts of debt to finance acquisitions or other activities; and the cost of, and potential adverse results in, litigation involving intellectual property, antitrust, shareholder and other matters. More details about these and other risks that may impact our business are included in our Form 10-K for fiscal 2016 and in our other SEC filings. You can locate these reports through our website at http://investors.intuit.com. Fiscal 2017 guidance speaks only as of the date it was publicly issued by Intuit. Other forward-looking statements represent the judgment of the management of Intuit as of the date of this presentation. We do not undertake any duty to update any forward-looking statement or other information in this presentation.only as of the date it was publicly issued by Intuit. Other forward-looking statements represent the judgment of the management of Intuit as of the date of this presentation. We do not undertake any duty to update any forward-looking statement or other in


![Alfonsina y El Mar [Zamba Argentina] · Alfonsina y El Mar Zamba Argent/ha ajRamirež íf2Í-20ÍØ Alfonsina y El Mar m' -200 . Armonima7ny Arreg/opara Guitarrapor Fé/ir Rodríguez](https://static.documents.pub/doc/80x56/5e3e21d616462310f64072b0/alfonsina-y-el-mar-zamba-argentina-alfonsina-y-el-mar-zamba-argentha-ajramire.jpg)


