Date post: | 12-Apr-2018 |
Category: |
Documents |
Upload: | nopipelines |
View: | 226 times |
Download: | 0 times |
7/21/2019 Marcellus Shale Players Instructions
http://slidepdf.com/reader/full/marcellus-shale-players-instructions 1/5
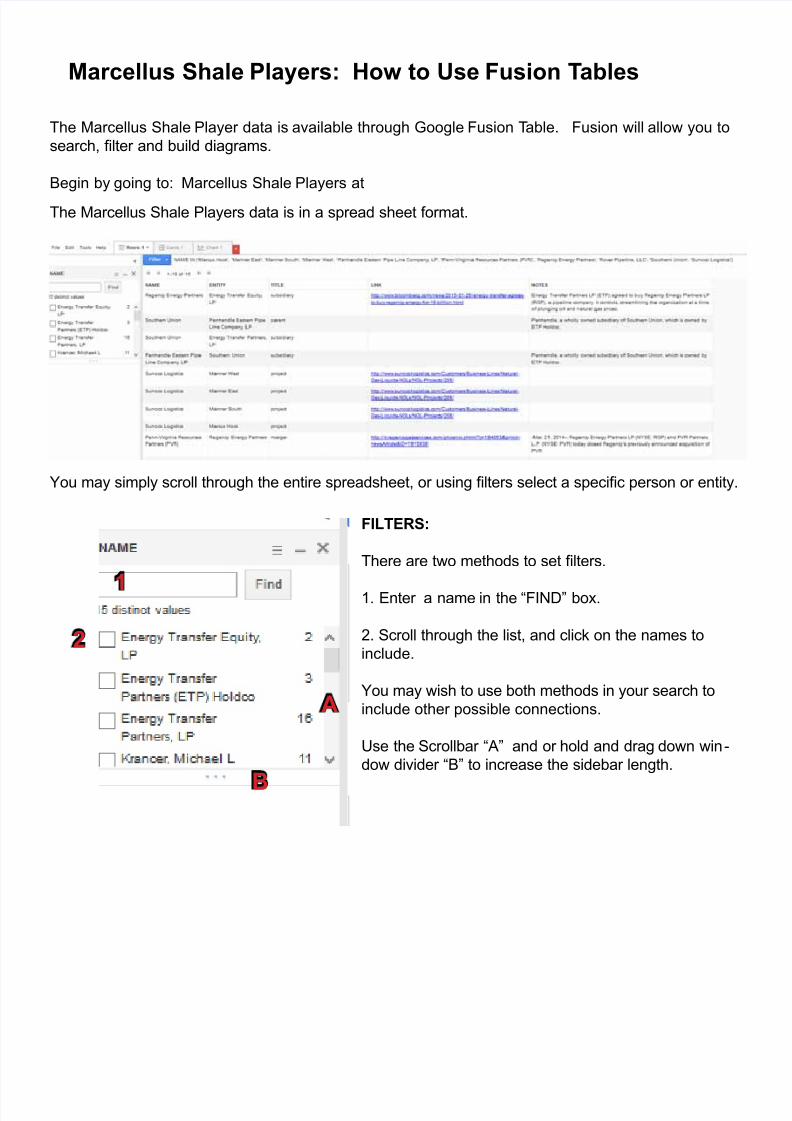
Marcellus Shale Players: How to Use Fusion Tables
The Marcellus Shale Player data is available through Google Fusion Table. Fusion will allow you to
search, lter and build diagrams.
Begin by going to: Marcellus Shale Players at
The Marcellus Shale Players data is in a spread sheet format.
You may simply scroll through the entire spreadsheet, or using lters select a specic person or entity.
FILTERS:
There are two methods to set lters.
1. Enter a name in the “FIND” box.
2. Scroll through the list, and click on the names to
include.
You may wish to use both methods in your search to
include other possible connections.
Use the Scrollbar “A” and or hold and drag down win-
dow divider “B” to increase the sidebar length.
1
2
B
A
7/21/2019 Marcellus Shale Players Instructions
http://slidepdf.com/reader/full/marcellus-shale-players-instructions 2/5
SORTING: You may wish to sort the data by a specic column. The default sort for the Mar -
cellus Shale players is by name.
To change the sort, hover your mouse over the right
hand side of the column heading until you see a down-
ward facing triangle. Click on it and select your option.
Sort A to Z or Z to A will sort the entire speadsheet and
not just the selected column.
CARDS: The card tab will display the same information contained in the spreadsheet in a different
format. Filters may be applied to cards.
7/21/2019 Marcellus Shale Players Instructions
http://slidepdf.com/reader/full/marcellus-shale-players-instructions 3/5
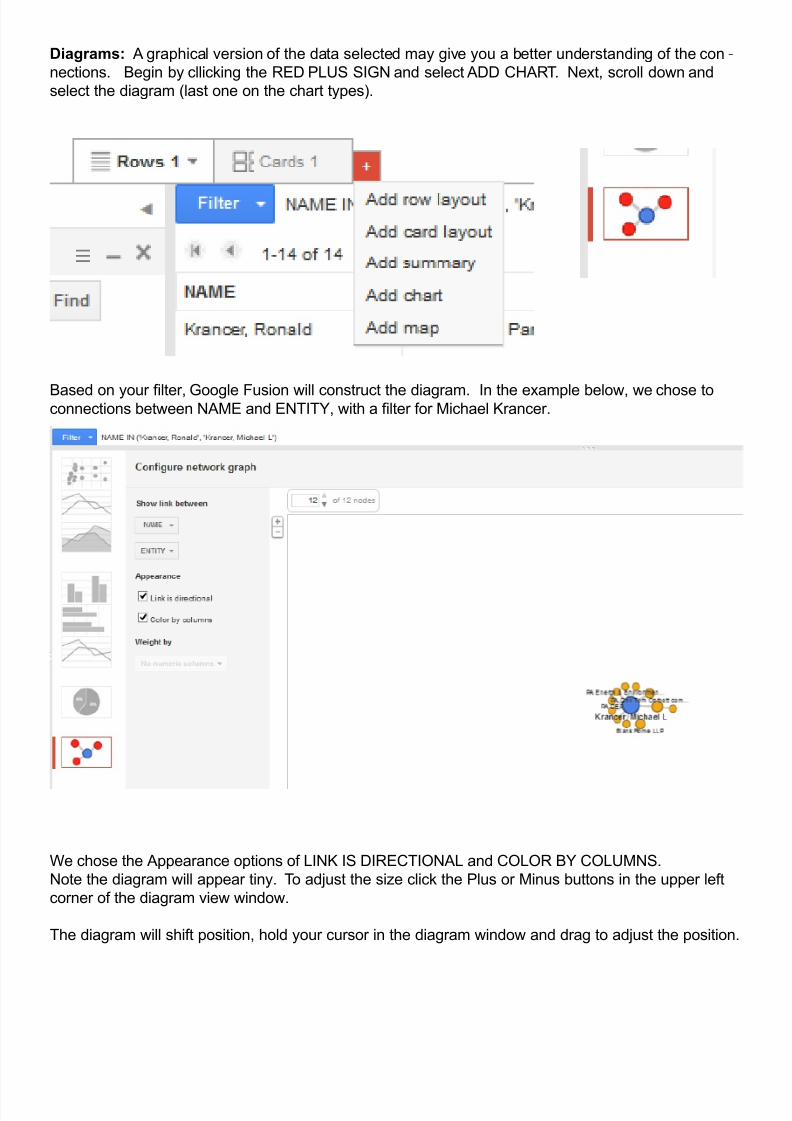
Diagrams: A graphical version of the data selected may give you a better understanding of the con-
nections. Begin by cllicking the RED PLUS SIGN and select ADD CHART. Next, scroll down and
select the diagram (last one on the chart types).
Based on your lter, Google Fusion will construct the diagram. In the example below, we chose toconnections between NAME and ENTITY, with a lter for Michael Krancer.
We chose the Appearance options of LINK IS DIRECTIONAL and COLOR BY COLUMNS.
Note the diagram will appear tiny. To adjust the size click the Plus or Minus buttons in the upper left
corner of the diagram view window.
The diagram will shift position, hold your cursor in the diagram window and drag to adjust the position
7/21/2019 Marcellus Shale Players Instructions
http://slidepdf.com/reader/full/marcellus-shale-players-instructions 4/5
Since Michael Krancer is the selected Filter, his name appears in the center. Ronald Krancer was
also included, so his connections are also shown.
In another example, you may wish to increase or decrease the number of “nodes” being displayed.
Click on the UP/DOWN arrows in the node display option located at the top left of the display window.
7/21/2019 Marcellus Shale Players Instructions
http://slidepdf.com/reader/full/marcellus-shale-players-instructions 5/5
You may also change, add or remove items to display by clicking on or off the lters.
If you wish a larger screen display. Click off the Filter Display sidebar column.
Clicking on the ROWS tab will restore the Filter DisplaySidebar