75
Challenges and opportuni1es induced by Big Data and Open Data for Business Intelligence Keynote @ IEEE CIST’2014 MarieAude AUFAURE 20/10/2014 1 IEEE CIST conference 2014
| Date post: | 13-Jul-2015 |
| Category: |
Data & Analytics |
| Upload: | ieee-cist |
| View: | 234 times |
| Download: | 1 times |

Challenges and opportuni1es induced by Big Data and Open Data for Business Intelligence
Keynote @ IEEE CIST’2014 Marie-‐Aude AUFAURE
20/10/2014 1 IEEE CIST conference 2014
Agenda
• EvoluDon of business intelligence – SemanDc Business Intelligence – Real-‐Time Business Intelligence
• Challenges and opportuniDes: – Taking into account unstructured data
20/10/2014 2 IEEE CIST conference 2014

Business Intelligence
• Business Intelligence (BI) refers to a set of tools and methods dedicated to collecDng, represenDng and analyzing data to support decision-‐making in enterprises.
• BI is defined as the ability for an organizaDon to take all input data and convert them into knowledge, ulDmately, providing the right informaDon to the right people at the right Dme via the right channel.
20/10/2014 IEEE CIST conference 2014 3
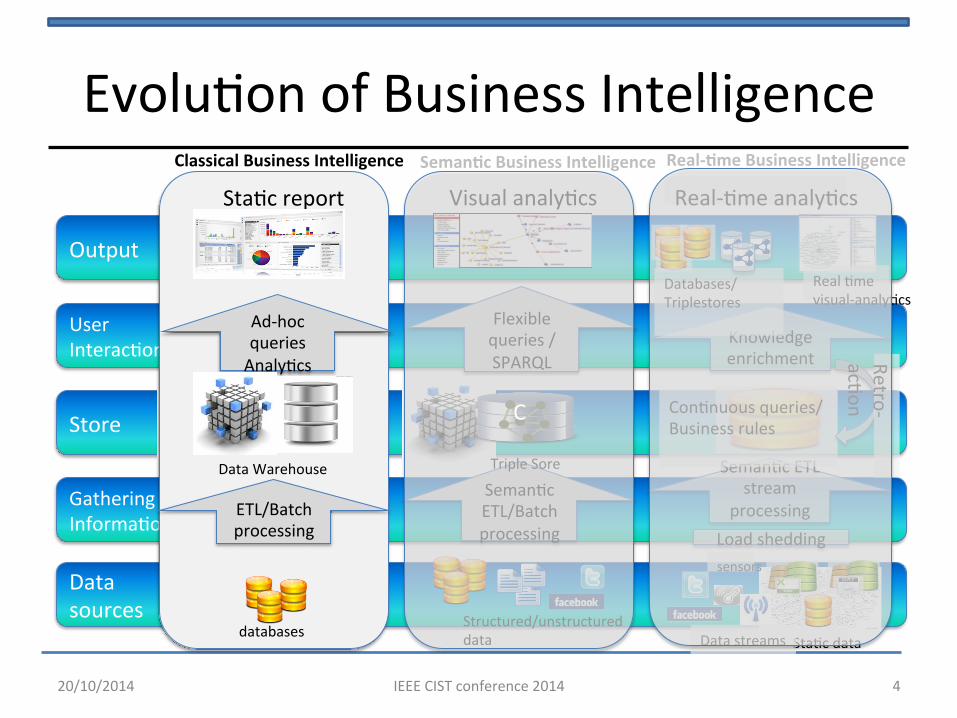
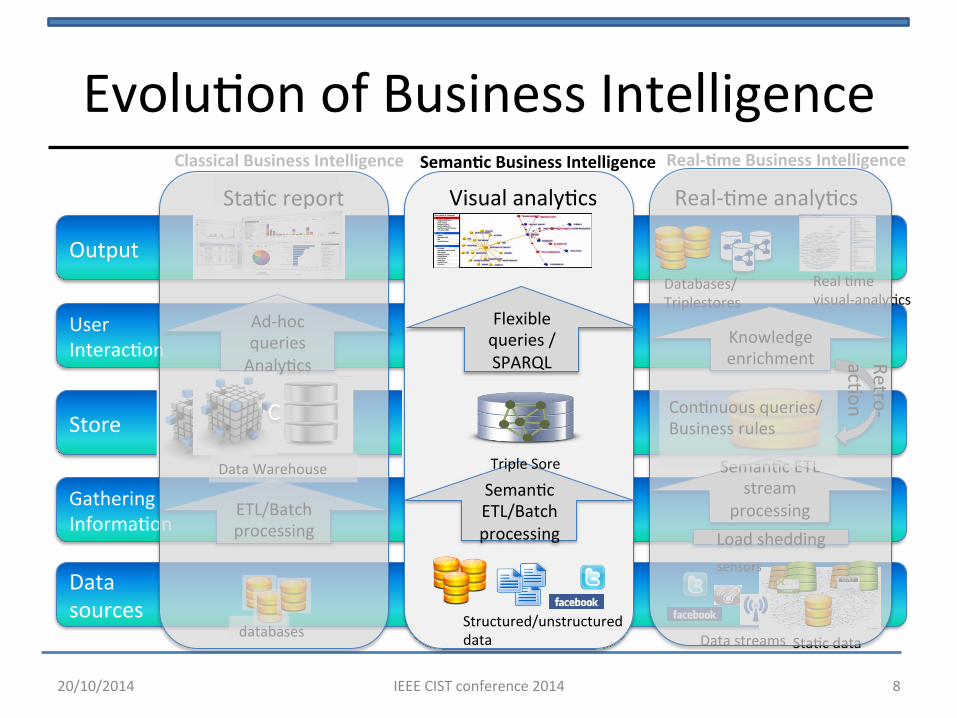
EvoluDon of Business Intelligence
20/10/2014 IEEE CIST conference 2014 4
Output
User InteracDon
Gathering InformaDon
Store
Data sources
Visual analyDcs
Structured/unstructured data
SemanDc ETL/Batch processing
Flexible queries / SPARQL
Triple Sore
C
StaDc report
databases
ETL/Batch processing
Ad-‐hoc queries AnalyDcs
Data Warehouse
Classical Business Intelligence Seman1c Business Intelligence Real-‐1me Business Intelligence
C
Real-‐Dme analyDcs
sensors
StaDc data Data streams
SemanDc ETL stream
processing
ConDnuous queries/ Business rules
Knowledge enrichment
Databases/ Triplestores
Real Dme visual-‐analyDcs
Retro-‐acDon
Load shedding
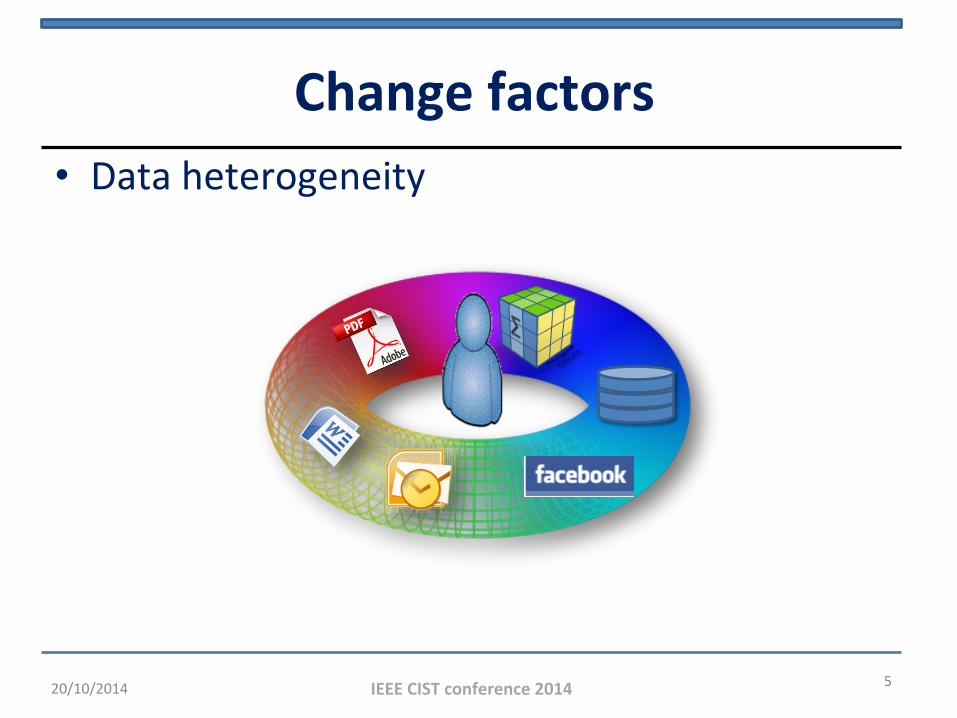
Change factors • Data heterogeneity
20/10/2014 IEEE CIST conference 2014 5
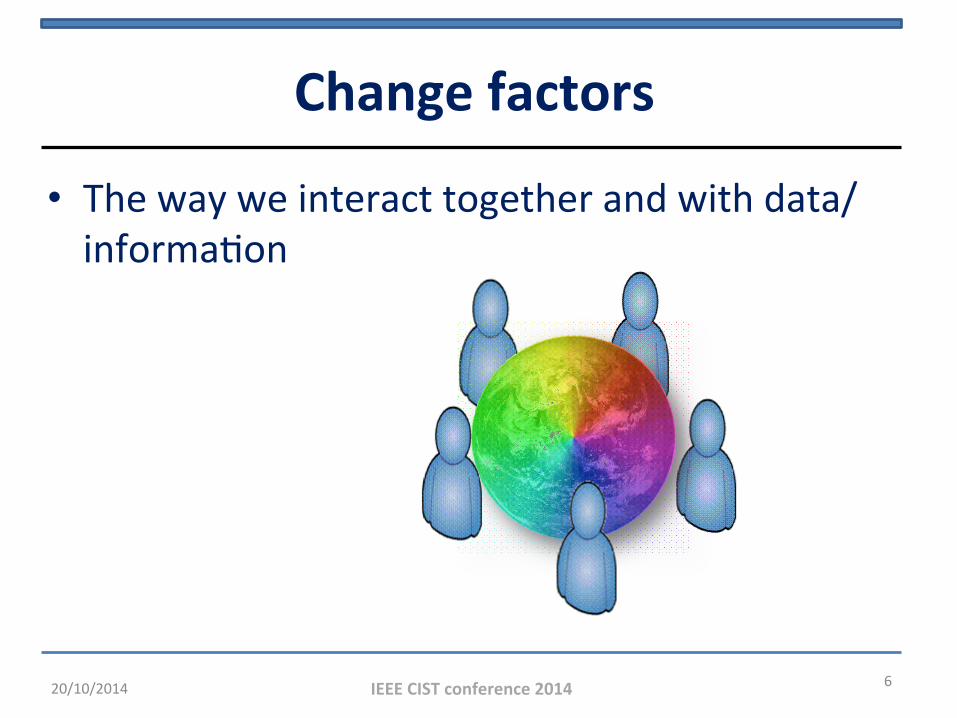
Change factors
• The way we interact together and with data/informaDon
20/10/2014 IEEE CIST conference 2014 6
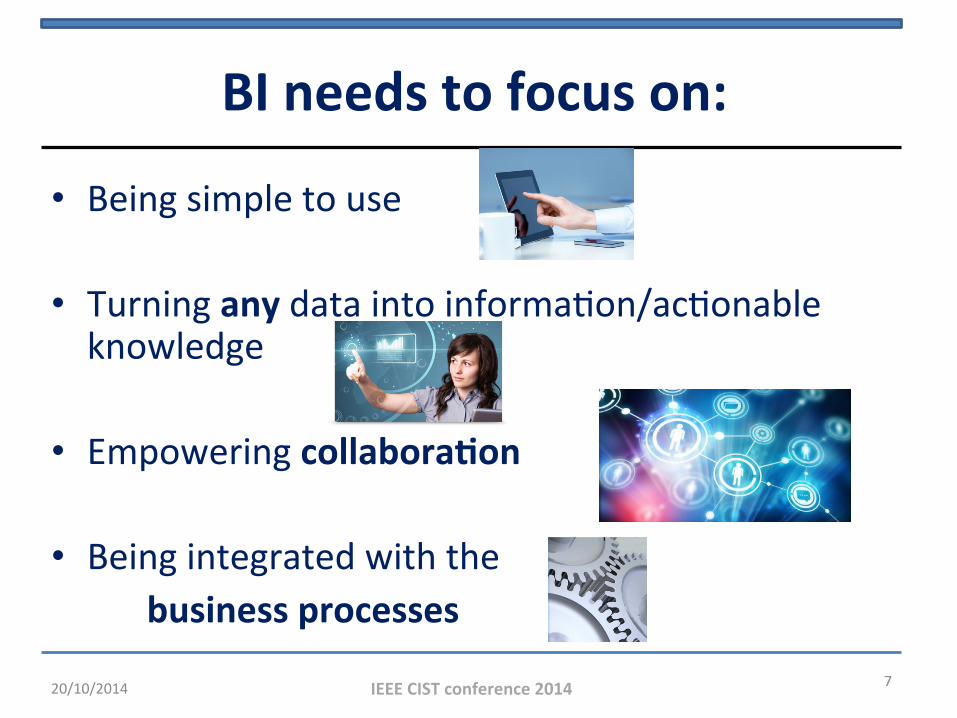
BI needs to focus on:
• Being simple to use
• Turning any data into informaDon/acDonable knowledge
• Empowering collabora1on • Being integrated with the
business processes
20/10/2014 IEEE CIST conference 2014 7
EvoluDon of Business Intelligence
20/10/2014 IEEE CIST conference 2014 8
Output
User InteracDon
Gathering InformaDon
Store
Data sources
C
Visual analyDcs
Structured/unstructured data
SemanDc ETL/Batch processing
Flexible queries / SPARQL
Triple Sore
Real-‐Dme analyDcs
sensors
StaDc data Data streams
SemanDc ETL stream
processing
ConDnuous queries/ Business rules
Knowledge enrichment
Databases/ Triplestores
Real Dme visual-‐analyDcs
Retro-‐acDon
Load shedding
Classical Business Intelligence Seman1c Business Intelligence Real-‐1me Business Intelligence
StaDc report
databases
ETL/Batch processing
Ad-‐hoc queries AnalyDcs
Data Warehouse
C

And now?
20/10/2014 IEEE CIST conference 2014 9
Big Data
Open Data /Linked Data
Connected objects

20/10/2014 IEEE CIST conference 2014 10
Aspect Characteris1cs Challenges and technological answers
Volume More visible aspect of b i g d a t a b u t l e s s challenging
Storage Virtualisa1on in data centers, generalizaDon of cloud-‐based soluDons NoSQL Solu1ons for storing and querying highly distributed data
Velocity Data produced and collected in a shorter Dme window
Real-‐1me Plateforms Connected objects will increase volume but also real-‐Dme needs
Variety MulDplicaDon of data sources, from structured data to free text
New data stores intégraDng lexibles data models Collect and analyze unstructured data
Value More subjecDve aspect dealing withe the non exploitaDon of these massive datasets
Transform raw data into valuable informaDon New Business models
Open data • An open data is a digital data public or private and published in a way
allowing user to freely access and reuse, without any technical, jridic or financial restricDon.
• Examples : data on public transportaDon, cartography, les staDsDcs, géography, la sociology, environnement, etc.
• Governemental wave in the 2000: – data.gov project in 2009, USA – European DirecDve in 2003 on reuse of public data – In France Etalab (2011) is in charge of data.gouv.fr, an open data portail for public data..
• Benefits for the public sector : – Transparency, costs reducDon, beher services
• Economic benefits: – Access to data, mainly for SMEs
20/10/2014 IEEE CIST conference 2014 11
!!!

Connected objetcs : smart applicaDons
20/10/2014 IEEE CIST conference 2014 12
Smart ci1es
Smart grids
Connected Health Quan1fied-‐self
Connected car
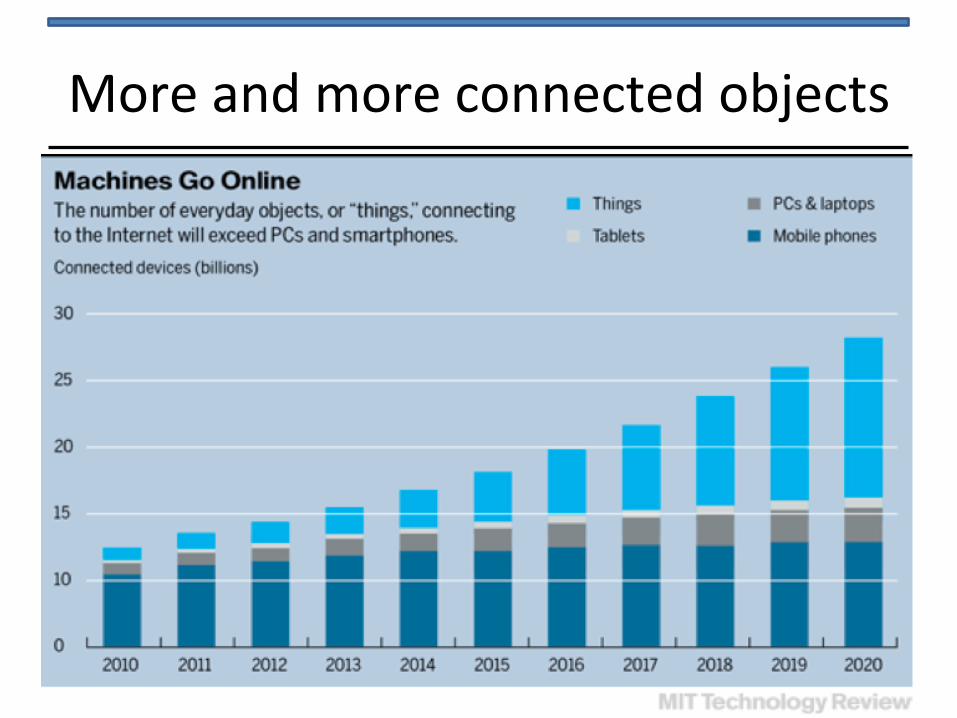
More and more connected objects
20/10/2014 IEEE CIST conference 2014 13
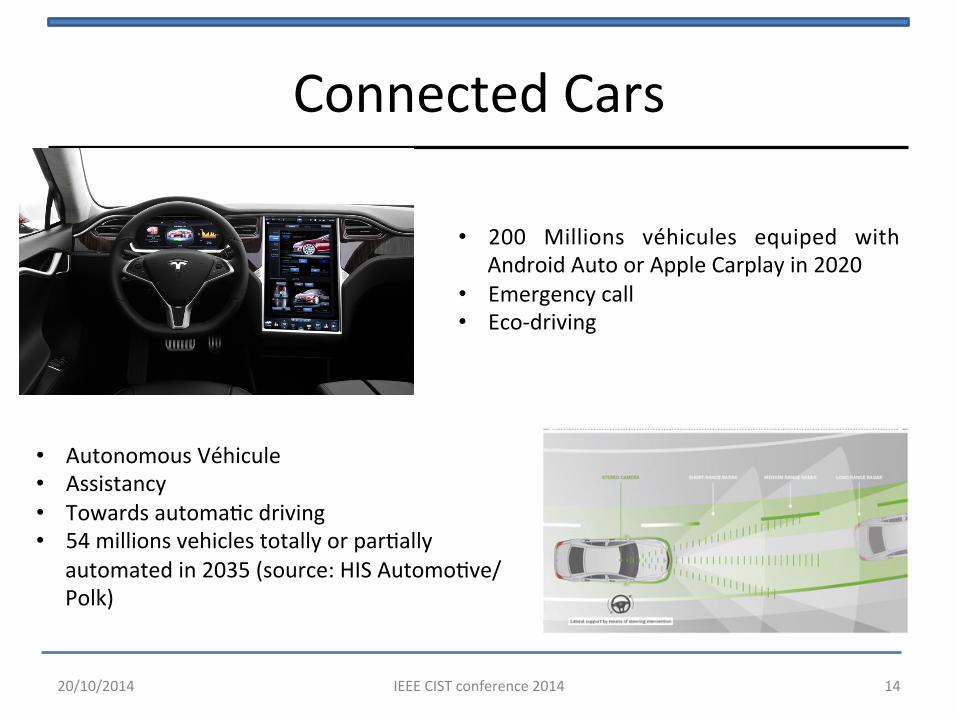
Connected Cars
20/10/2014 IEEE CIST conference 2014 14
• 200 Millions véhicules equiped with Android Auto or Apple Carplay in 2020
• Emergency call • Eco-‐driving
• Autonomous Véhicule • Assistancy • Towards automaDc driving • 54 millions vehicles totally or parDally
automated in 2035 (source: HIS AutomoDve/Polk)

Big Data : Challenges?
• Vector of innovaDon – DisrupDve technologies: cloud, internet of things, AnalyDcs – Open InnovaDon
• Enhancement of producDvity, services and compeDDvity – Public services, « sokware-‐intensive » companies
• Economic impact – Benefits for the analysis of internal and external data – New jobs
• Big Data Centres of excellence (Hack/Reduce in Boston)
20/10/2014 IEEE CIST conference 2014 15
BIG DATA: SOCIETAL CHALLENGES
• Big Data for Society: can we expect a posiDve impact on society? • Generate acDonable informaDon that can be used to idenDfy
needs, provide services, and predict and prevent crisis for the benefit of populaDons.
• Health and well-‐being, environment, energy, climate change, etc.
20/10/2014 IEEE CIST conference 2014 16
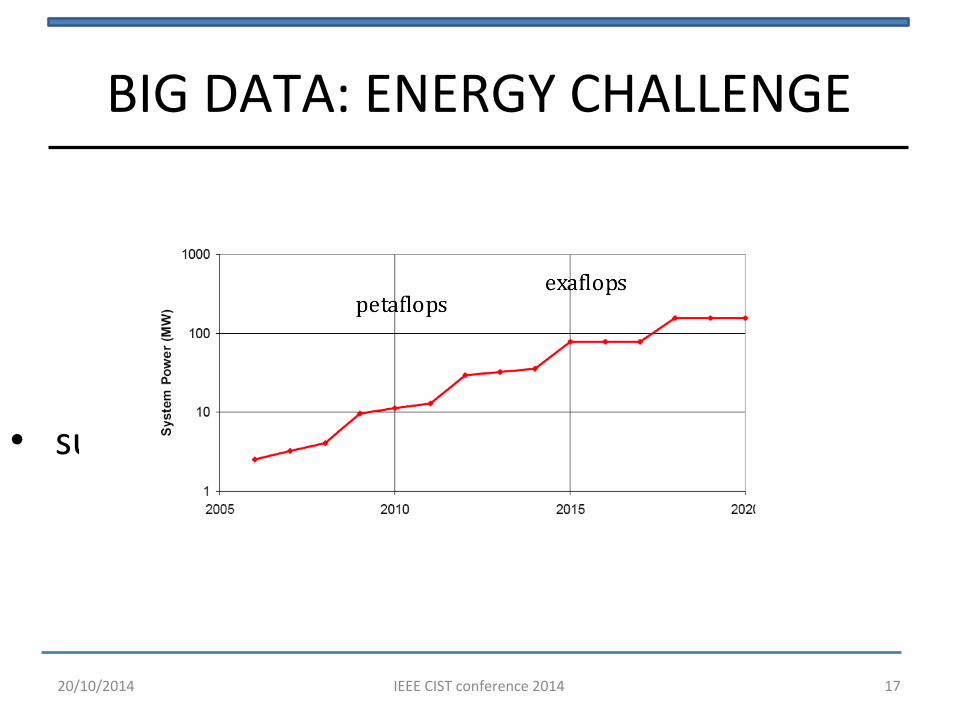
BIG DATA: ENERGY CHALLENGE
• supercomputeurs
20/10/2014 IEEE CIST conference 2014 17
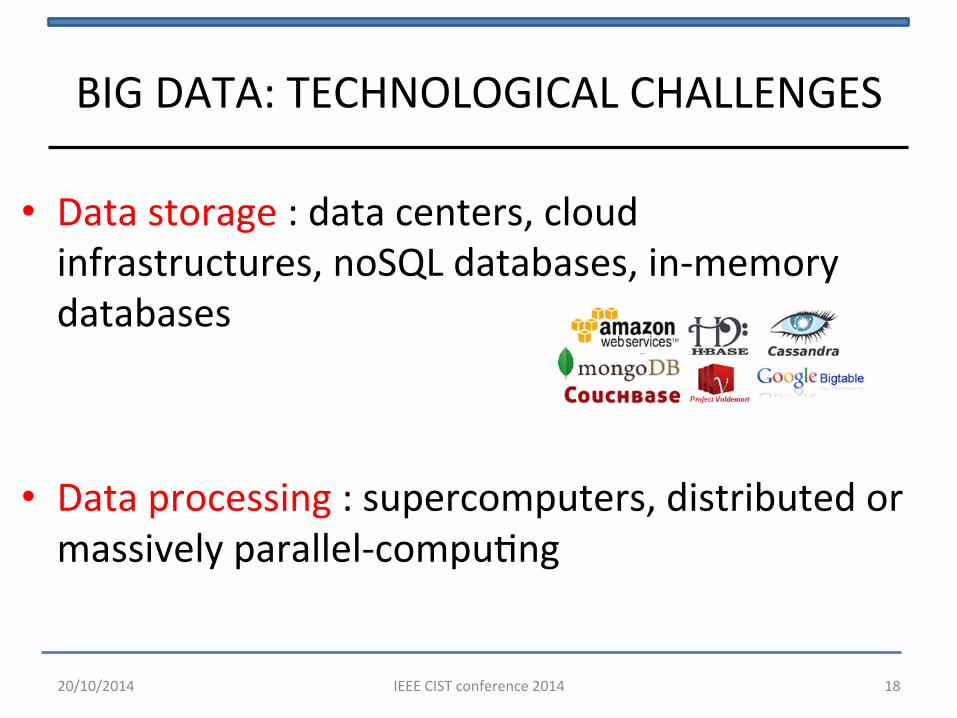
BIG DATA: TECHNOLOGICAL CHALLENGES
• Data storage : data centers, cloud infrastructures, noSQL databases, in-‐memory databases
• Data processing : supercomputers, distributed or massively parallel-‐compuDng
20/10/2014 IEEE CIST conference 2014 18

Some scienDfic challenges
• Big data analyDcs • Context management • VisualizaDon and Human-‐Computer Interfaces • Algorthms distribuDon • CorrelaDons and causality • Real-‐Dme analysis of data streams • ValidaDon, trust
20/10/2014 IEEE CIST conference 2014 19
20/10/2014 IEEE CIST conference 2014 20
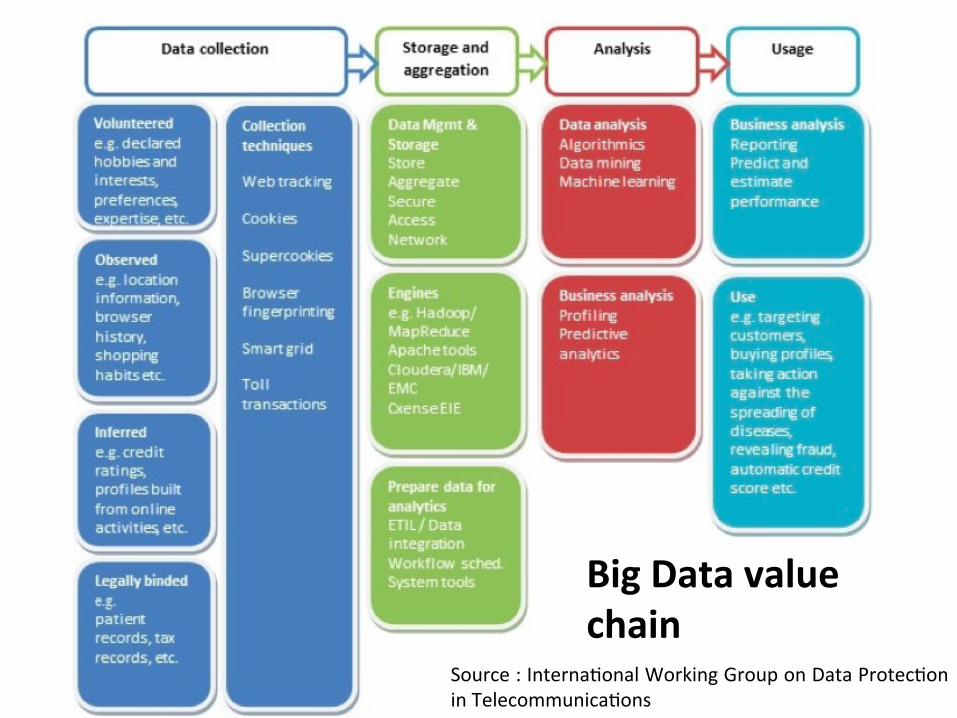
Big Data value chain
Source : InternaDonal Working Group on Data ProtecDon in TelecommunicaDons
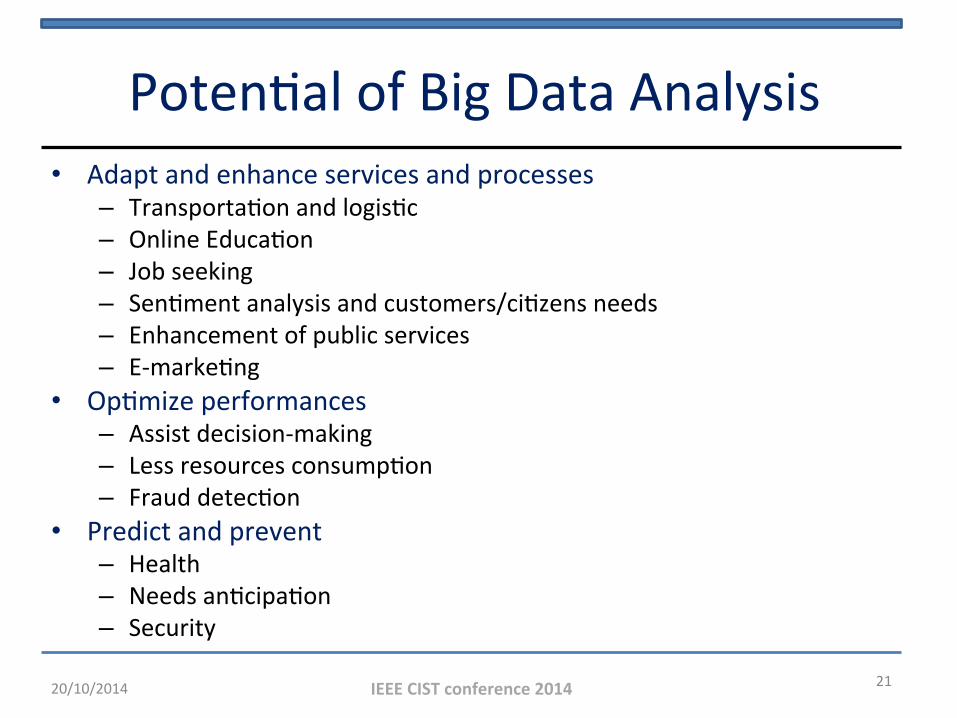
PotenDal of Big Data Analysis • Adapt and enhance services and processes
– TransportaDon and logisDc – Online EducaDon – Job seeking – SenDment analysis and customers/ciDzens needs – Enhancement of public services – E-‐markeDng
• OpDmize performances – Assist decision-‐making – Less resources consumpDon – Fraud detecDon
• Predict and prevent – Health – Needs anDcipaDon – Security
20/10/2014 IEEE CIST conference 2014 21
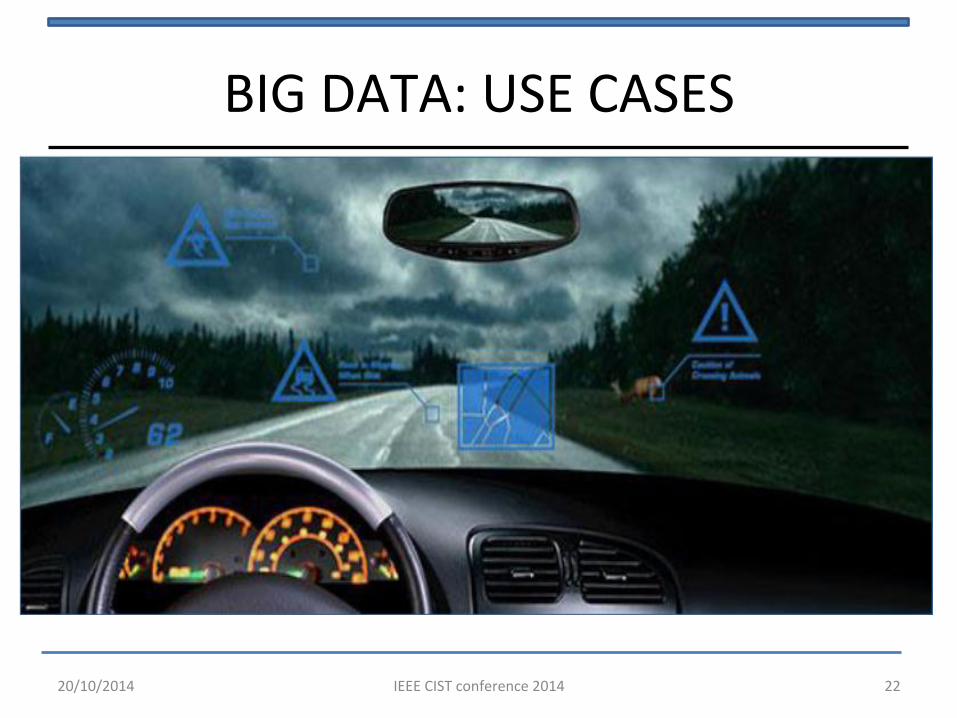
BIG DATA: USE CASES
20/10/2014 IEEE CIST conference 2014 22
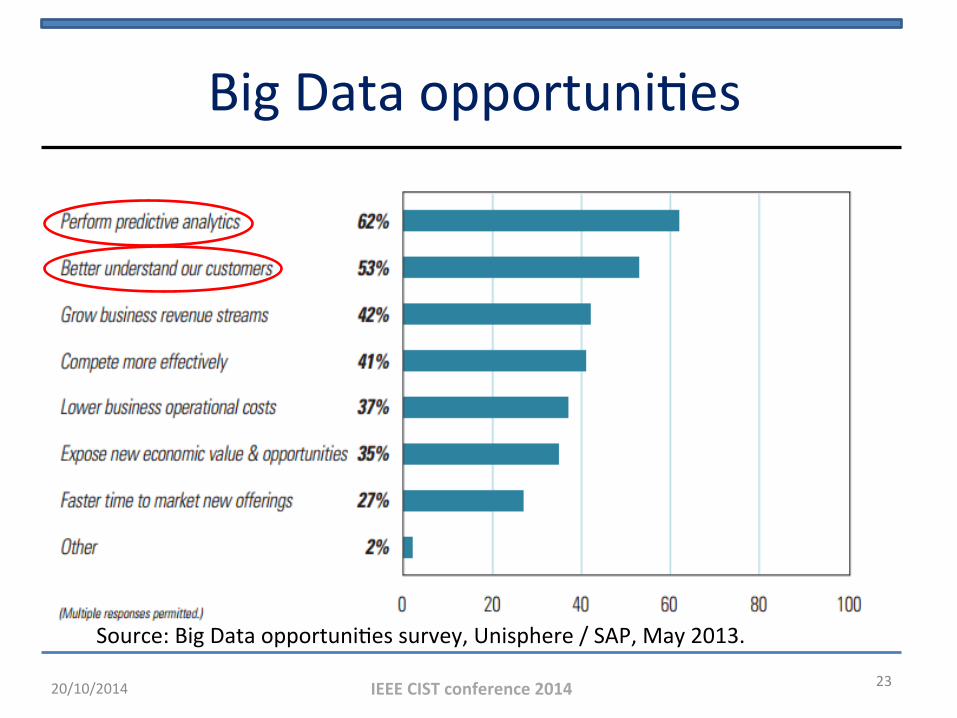
Big Data opportuniDes
Source: Big Data opportuniDes survey, Unisphere / SAP, May 2013.
20/10/2014 IEEE CIST conference 2014 23
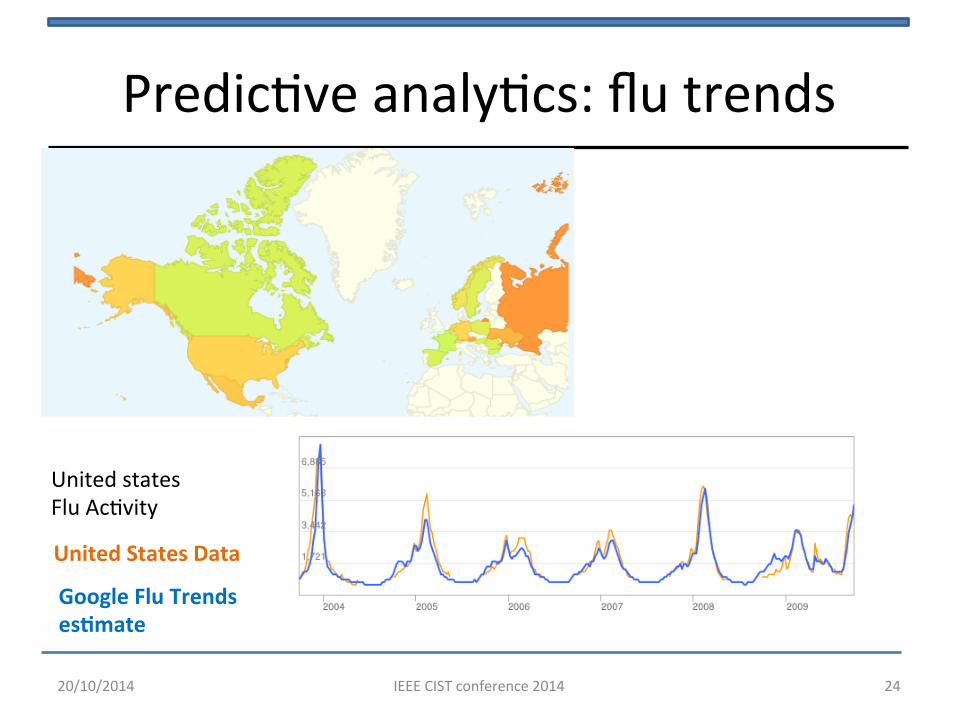
PredicDve analyDcs: flu trends
20/10/2014 IEEE CIST conference 2014 24
United states Flu AcDvity
United States Data
Google Flu Trends es1mate
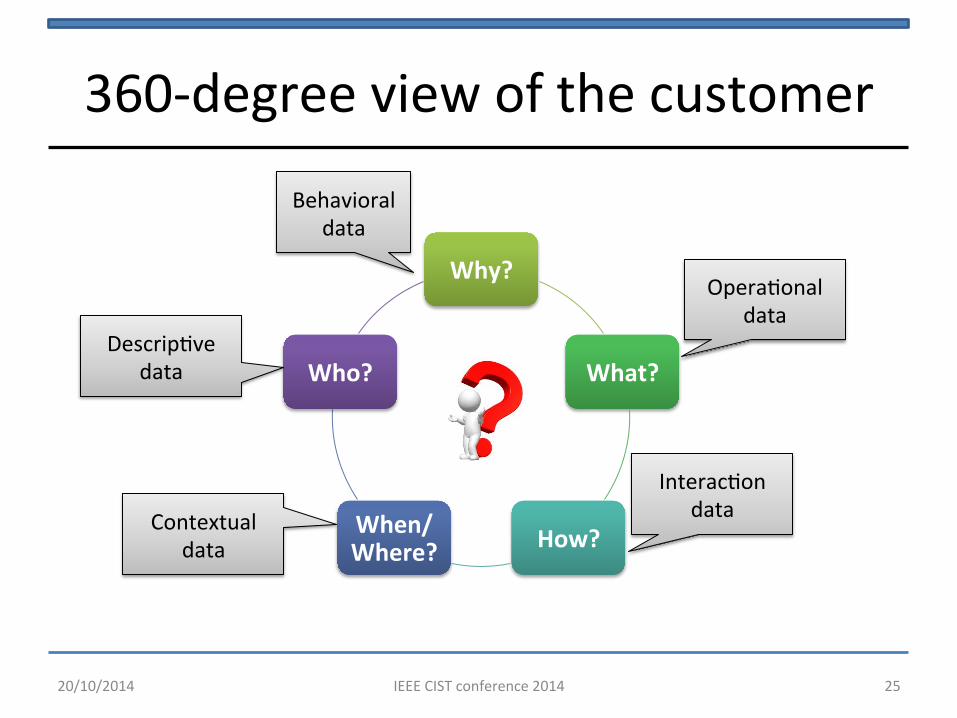
Why?
What?
How? When/Where?
Who?
360-‐degree view of the customer
OperaDonal data
Behavioral data
DescripDve data
InteracDon data Contextual
data
20/10/2014 IEEE CIST conference 2014 25
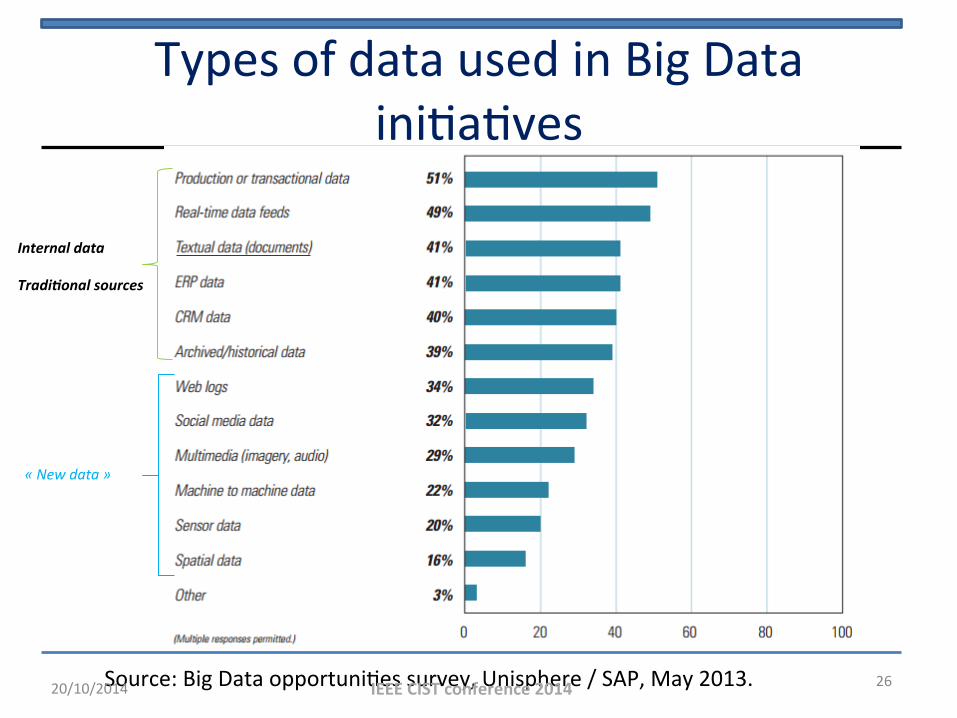
Types of data used in Big Data iniDaDves
Source: Big Data opportuniDes survey, Unisphere / SAP, May 2013.
Internal data Tradi,onal sources
« New data »
26 20/10/2014 IEEE CIST conference 2014
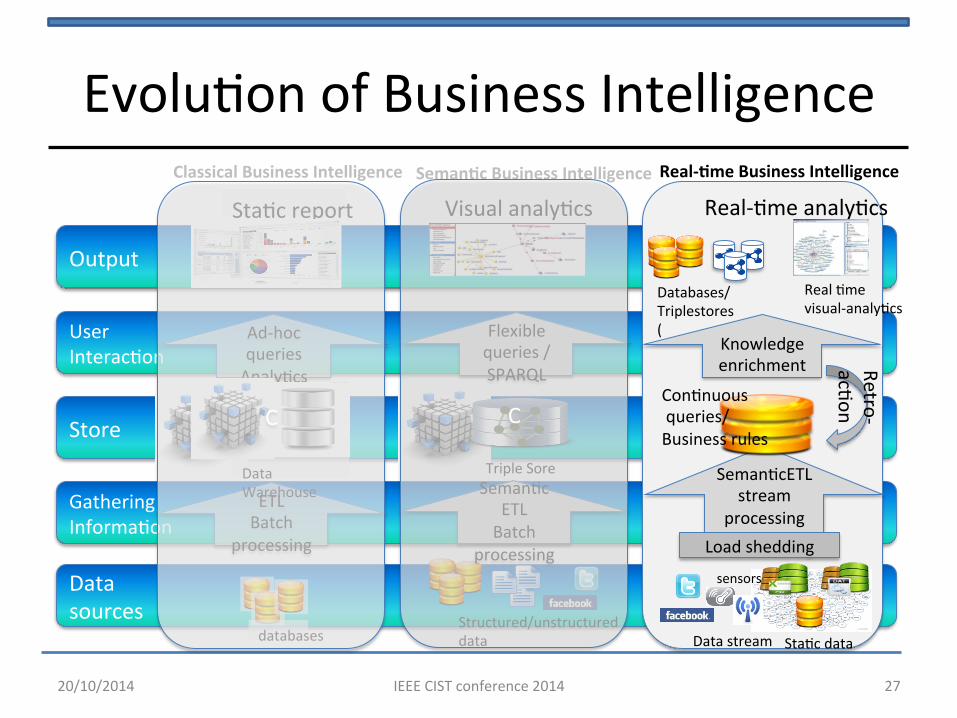
EvoluDon of Business Intelligence
20/10/2014 IEEE CIST conference 2014 27
Output
User InteracDon
Gathering InformaDon
Store
Data sources
Visual analyDcs
Structured/unstructured data
SemanDc ETL Batch
processing
Flexible queries / SPARQL
Triple Sore
Real-‐Dme analyDcs
sensors
StaDc data Data stream
SemanDcETL stream
processing
ConDnuous queries/ Business rules
Knowledge enrichment
Databases/ Triplestores (
Real Dme visual-‐analyDcs
Retro-‐acDon
Load shedding
Classical Business Intelligence Seman1c Business Intelligence Real-‐1me Business Intelligence
StaDc report
databases
ETL Batch
processing
Ad-‐hoc queries AnalyDcs
Data Warehouse
C C
Coping with unstructured data SemanDc BI
SemanDc Technologies for Bi Data Social Networks
20/10/2014 IEEE CIST conference 2014 28

Unstructured data analyDcs process
20/10/2014 Séminaire Big Data 29
Data • Web content • Ontologies • Social data • Logs • Texts • Pictures, etc.
Collect • Web crawling • Web scraping • API (Twiher, Google, …)
• Clics (logs) • Crowdsourcing (Mechanical Turk)
ExtracDon /StructuraDon • SemanDc ETL • Named enDDes • lexico-‐syntacDc paherns
• Dependancy trees
• N-‐grams
Analyze • clustering • Galois larce • Unsupervised and supervised learning
SEMANTIC BI AND VISUAL ANALYTICS: THE FP7 CUBIST PROJECT
20/10/2014 IEEE CIST conference 2014 30
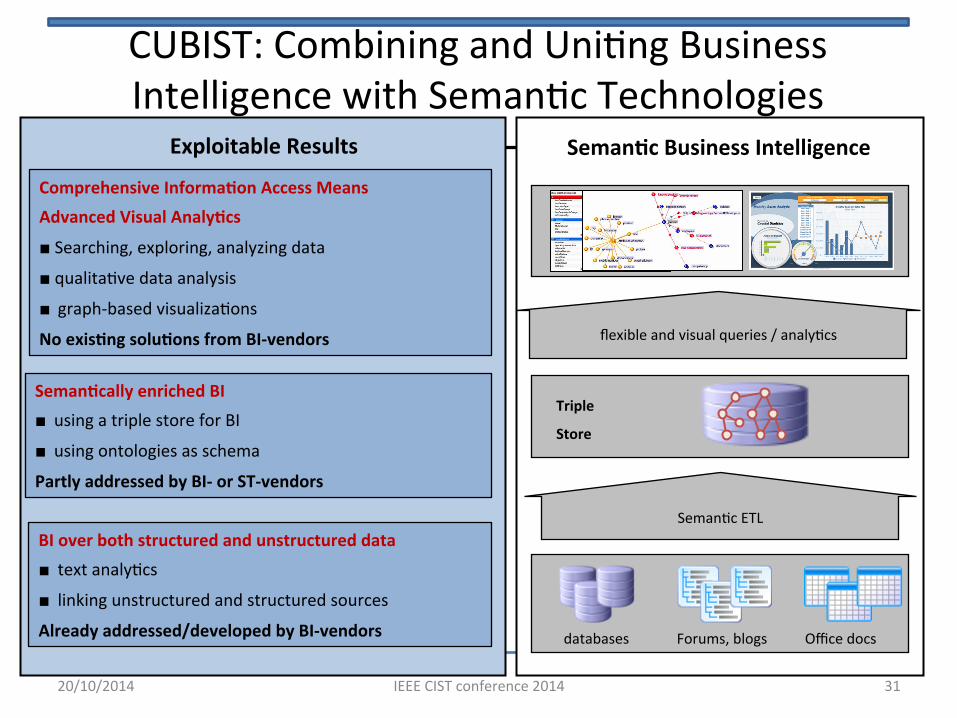
CUBIST: Combining and UniDng Business Intelligence with SemanDc Technologies
office databases Forums, blogs
SemanDc ETL
Office docs
flexible and visual queries / analyDcs
Triple
Store
Seman1c Business Intelligence Exploitable Results
BI over both structured and unstructured data ■ text analyDcs ■ linking unstructured and structured sources Already addressed/developed by BI-‐vendors
Comprehensive Informa1on Access Means Advanced Visual Analy1cs
■ Searching, exploring, analyzing data ■ qualitaDve data analysis ■ graph-‐based visualizaDons No exis1ng solu1ons from BI-‐vendors
Seman1cally enriched BI ■ using a triple store for BI ■ using ontologies as schema
Partly addressed by BI-‐ or ST-‐vendors
20/10/2014 IEEE CIST conference 2014 31
Formal Concept Analysis
32
• Formal Concept Analysis is a method used for invesDgaDng and processing explicitely given informaDon
– An analysis of data – Structures of formal abstracDons of concepts of human thought – Formal emphasizes that the concepts are mathemaDcal objects, rather than concepts of mind
– Formal Concept Analysis help to draw inferences, to group objects, and hence to create concepts
• Visual representaDon by a Hasse Diagram
20/10/2014 IEEE CIST conference 2014
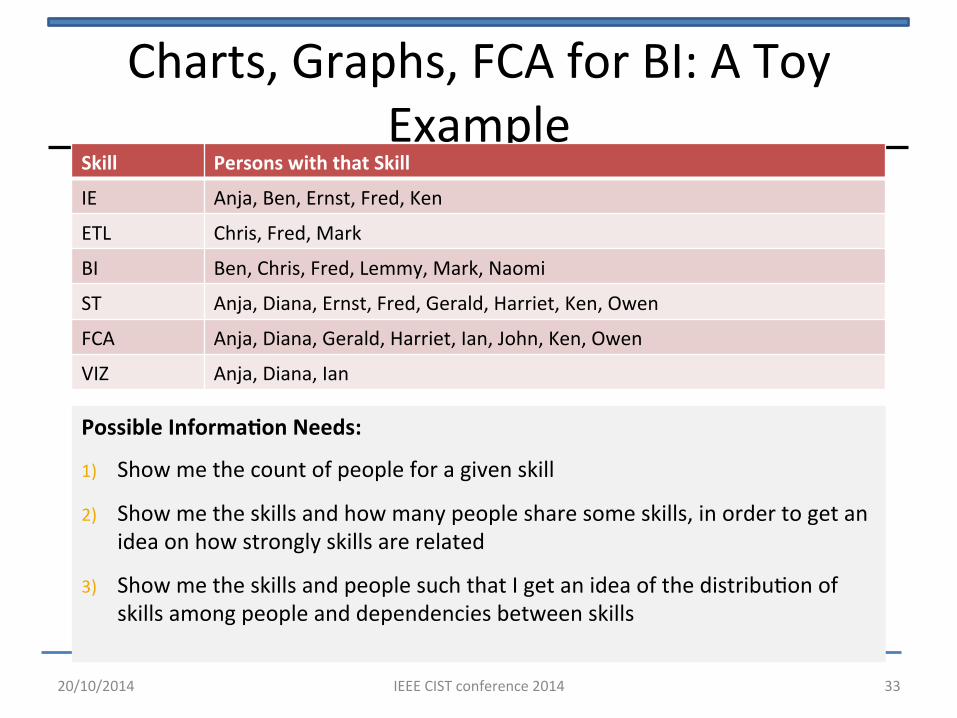
Charts, Graphs, FCA for BI: A Toy Example
Skill Persons with that Skill
IE Anja, Ben, Ernst, Fred, Ken
ETL Chris, Fred, Mark
BI Ben, Chris, Fred, Lemmy, Mark, Naomi
ST Anja, Diana, Ernst, Fred, Gerald, Harriet, Ken, Owen
FCA Anja, Diana, Gerald, Harriet, Ian, John, Ken, Owen
VIZ Anja, Diana, Ian
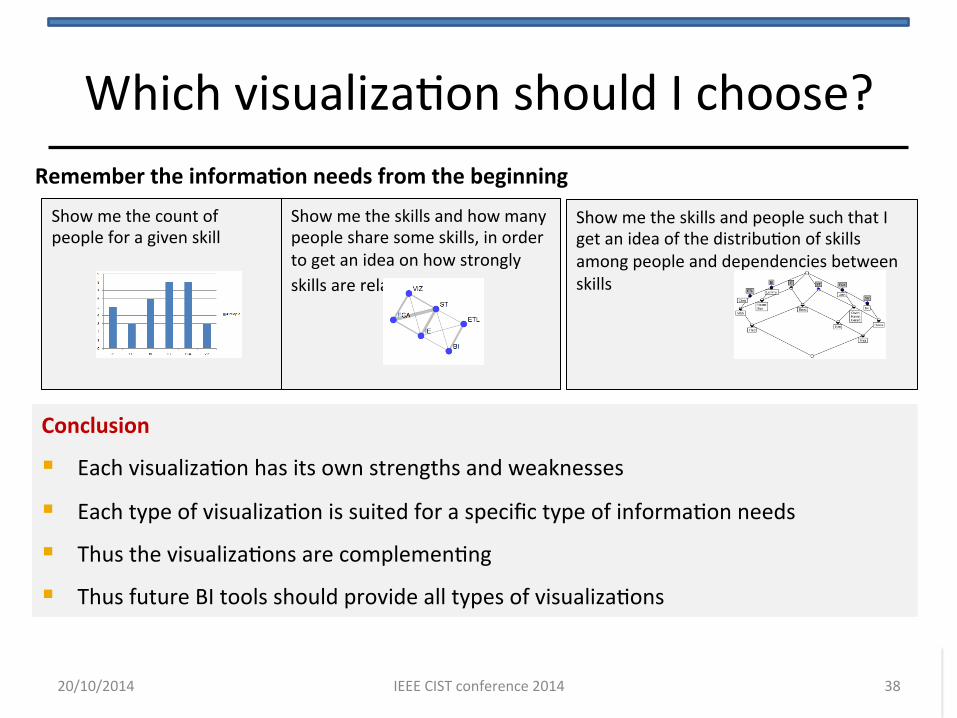
Possible Informa1on Needs:
1) Show me the count of people for a given skill
2) Show me the skills and how many people share some skills, in order to get an idea on how strongly skills are related
3) Show me the skills and people such that I get an idea of the distribuDon of skills among people and dependencies between skills
20/10/2014 IEEE CIST conference 2014 33
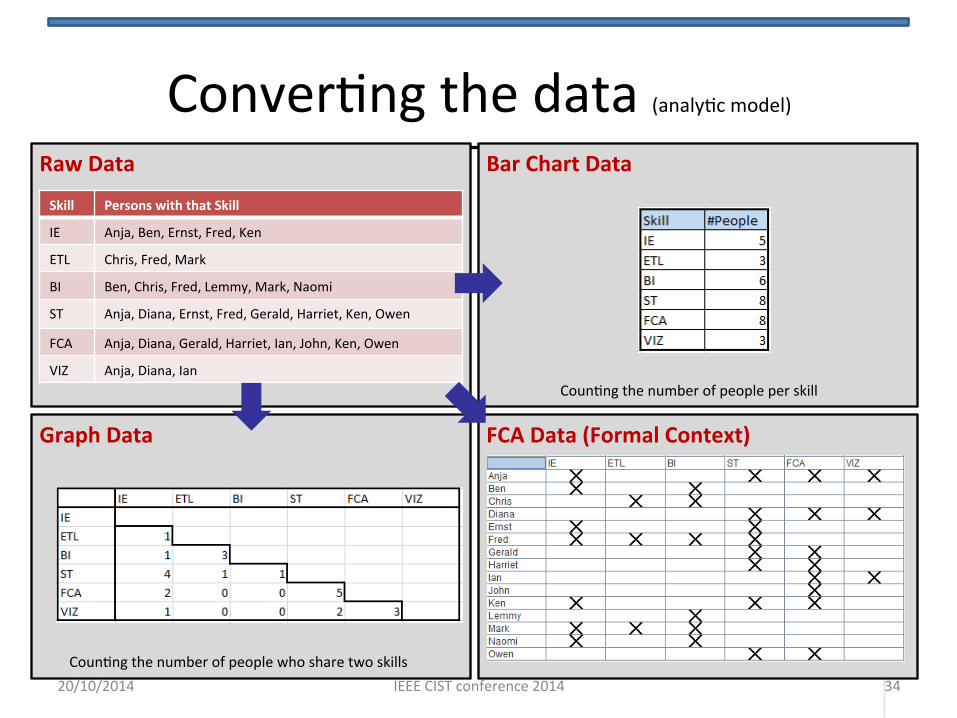
ConverDng the data (analyDc model)
Raw Data Bar Chart Data
Graph Data FCA Data (Formal Context)
CounDng the number of people per skill
CounDng the number of people who share two skills
Skill Persons with that Skill
IE Anja, Ben, Ernst, Fred, Ken
ETL Chris, Fred, Mark
BI Ben, Chris, Fred, Lemmy, Mark, Naomi
ST Anja, Diana, Ernst, Fred, Gerald, Harriet, Ken, Owen
FCA Anja, Diana, Gerald, Harriet, Ian, John, Ken, Owen
VIZ Anja, Diana, Ian
20/10/2014 IEEE CIST conference 2014 34
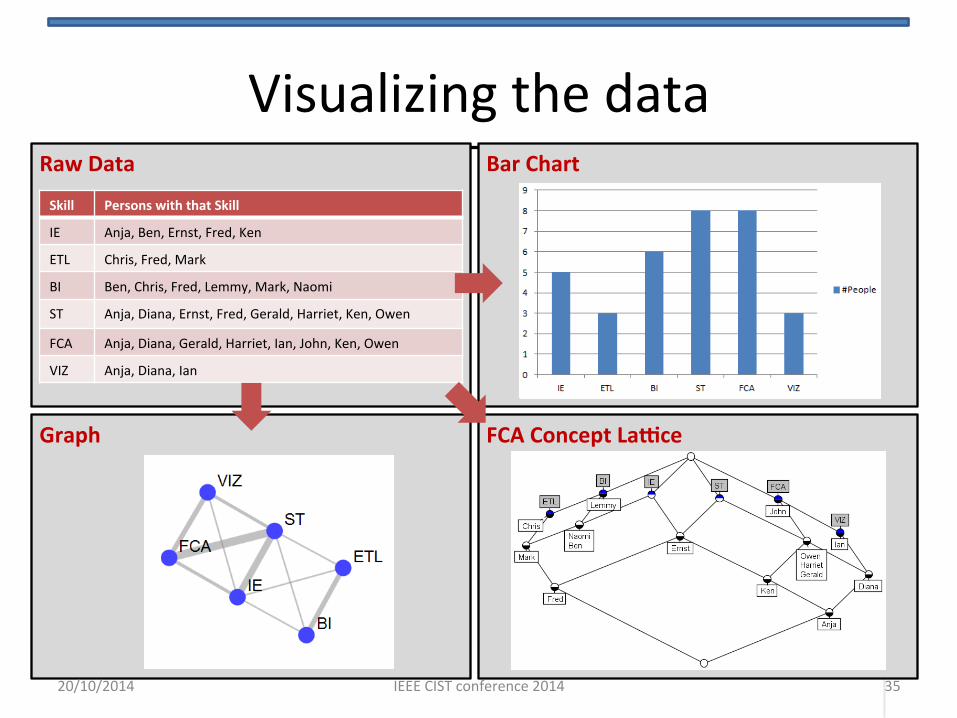
Visualizing the data Raw Data Bar Chart
Graph FCA Concept La^ce
Skill Persons with that Skill
IE Anja, Ben, Ernst, Fred, Ken
ETL Chris, Fred, Mark
BI Ben, Chris, Fred, Lemmy, Mark, Naomi
ST Anja, Diana, Ernst, Fred, Gerald, Harriet, Ken, Owen
FCA Anja, Diana, Gerald, Harriet, Ian, John, Ken, Owen
VIZ Anja, Diana, Ian
20/10/2014 IEEE CIST conference 2014 35
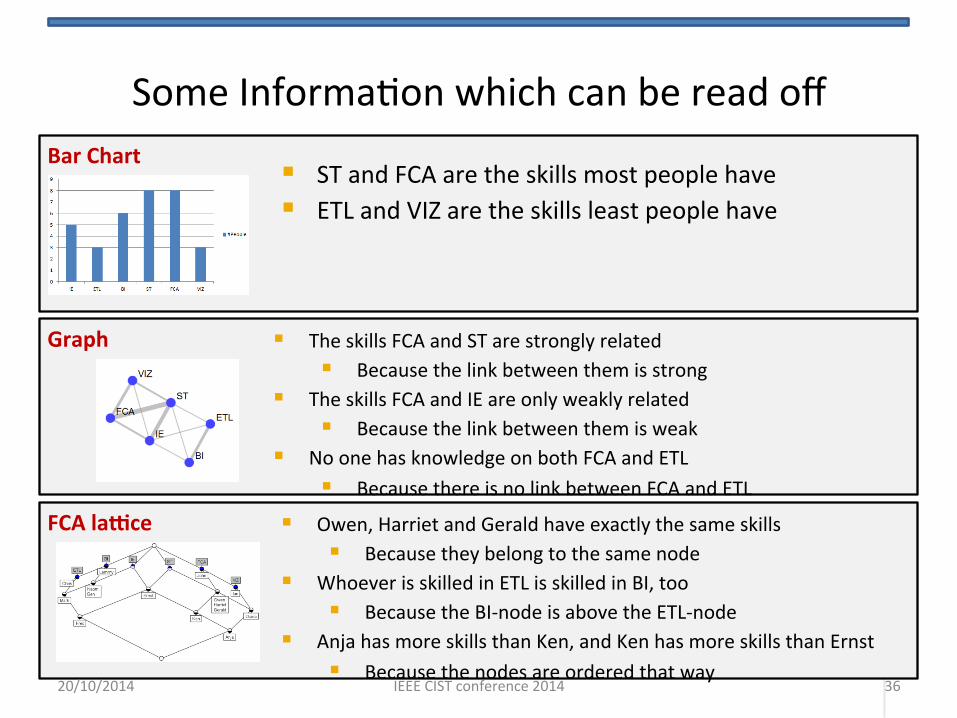
Some InformaDon which can be read off Bar Chart
Graph
FCA la^ce
§ ST and FCA are the skills most people have § ETL and VIZ are the skills least people have
§ The skills FCA and ST are strongly related § Because the link between them is strong
§ The skills FCA and IE are only weakly related § Because the link between them is weak
§ No one has knowledge on both FCA and ETL § Because there is no link between FCA and ETL
§ Owen, Harriet and Gerald have exactly the same skills § Because they belong to the same node
§ Whoever is skilled in ETL is skilled in BI, too § Because the BI-‐node is above the ETL-‐node
§ Anja has more skills than Ken, and Ken has more skills than Ernst § Because the nodes are ordered that way
20/10/2014 IEEE CIST conference 2014 36

Comparison Bar Chart
Graph
FCA la^ce
Ý Many well-‐known visualizaDons
Ý Good (readable and comprehensible) layouts
Ý Good for analyzing numbers
Þ Loss of informaDon (what people)
Þ Misleading for overlapping ahributes (counDng people manifold)
Þ Not uDlizing relaDonships between enDDes
Ý AhracDve visualizaDons Ý (RelaDvely) easy to understand Ý UDlizing and showing links
between enDDes (skills)
Þ Loss of informaDon (what people)
Þ Bad for analyzing numbers
Þ Number of nodes might explode
Þ Finding good layout is unsolved (nice layout in example is accidenDal and has been manually created)
Þ Unfamiliar means for analyDcs
Þ Scalability Þ Bad for analyzing numbers
Ý No loss of informaDon
Ý Meaningful clusters in one node
Ý Showing dependencies between enDDes (both people and skills)
20/10/2014 IEEE CIST conference 2014 37
Show me the skills and how many people share some skills, in order to get an idea on how strongly skills are related
Show me the skills and people such that I get an idea of the distribuDon of skills among people and dependencies between skills
Show me the count of people for a given skill
Which visualizaDon should I choose?
Conclusion
§ Each visualizaDon has its own strengths and weaknesses
§ Each type of visualizaDon is suited for a specific type of informaDon needs
§ Thus the visualizaDons are complemenDng
§ Thus future BI tools should provide all types of visualizaDons
Remember the informa1on needs from the beginning
20/10/2014 IEEE CIST conference 2014 38
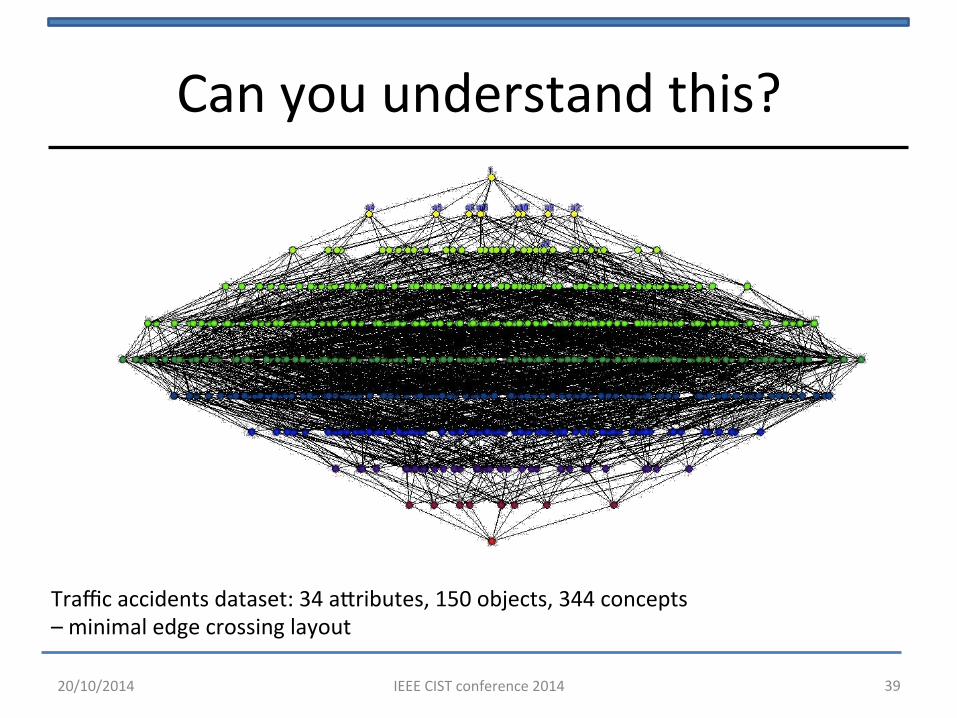
Can you understand this?
39
Traffic accidents dataset: 34 ahributes, 150 objects, 344 concepts – minimal edge crossing layout
20/10/2014 IEEE CIST conference 2014

Visual AnalyDcs
• Visual analyDcs supports human judgment by means of visual representaDons and interacDon techniques [Keim et al. 2001]
• “Overview first, zoom and filter, then details-‐on-‐demand.”[Shneiderman, 1996]
• Visual AnalyDcs for FCA combines: – TradiDonal BI operaDons and visualizaDons – Concept Larce transformaDon and visualizaDon
20/10/2014 IEEE CIST conference 2014 40

FCA-‐based Visual AnalyDcs
41
• Idea: Create visual analyDcs for large contexts – Context reducDon – Allow visual queries through selecDon and filtering – Dynamic visualizaDon – Visual exploraDon becomes a navigaDon problem
20/10/2014 IEEE CIST conference 2014

Cubix: A Visual AnalyDcs tool for FCA
42
• Combines interac1ve features to overcome drawbacks of single techniques
• Features – VisualisaDons – Dashboard – Metrics – Filtering & Search – Clustering – Tree-‐ExtracDon
Publica0on: ICDM 2012 [Melo et al.]
live: cubix.alwaysdata.com
20/10/2014 IEEE CIST conference 2014
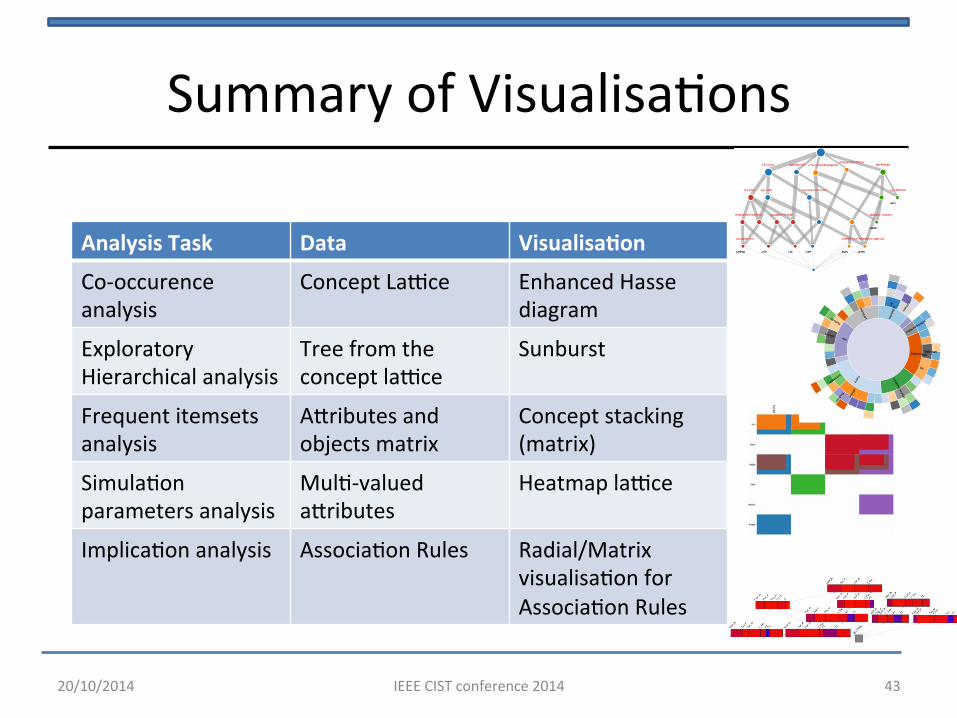
Summary of VisualisaDons
Analysis Task Data Visualisa1on
Co-‐occurence analysis
Concept Larce Enhanced Hasse diagram
Exploratory Hierarchical analysis
Tree from the concept larce
Sunburst
Frequent itemsets analysis
Ahributes and objects matrix
Concept stacking (matrix)
SimulaDon parameters analysis
MulD-‐valued ahributes
Heatmap larce
ImplicaDon analysis AssociaDon Rules Radial/Matrix visualisaDon for AssociaDon Rules
20/10/2014 IEEE CIST conference 2014 43
Coming back to ease of use
• Cubix was experimented on three use cases – The workflow (data selecDon, scaling, filtering and analysis) needed to be simplified
• User creaDon of AnalyDcs – Leading to « BI as a service »
• AutomaDc recommendaDon of VisualizaDon and gadgets: – Decision tree
• Based on the data type and volume – CollaboraDve filtering
• Based on other user’s preferences for similar datasets – Supervised Learning methods
• Based on users profile and history
20/10/2014 IEEE CIST conference 2014 44
Coping with big data for FCA
• ReducDon techniques – Filtering (support, stability)
• Distributed compuDng of concepts • Mining Formal Concepts over data streams • Visual AnalyDcs
– New metaphors for large data – Data overview view: dashboards
• Filtering
20/10/2014 IEEE CIST conference 2014 45

SemanDc Technologies for Big Data
20/10/2014 IEEE CIST conference 2014 46
SemanDc Technologies for Big Data
• Data-‐driven approaches (structure learning, data mining, staDsDcal approaches) are not always sufficient to find all correlaDons among parameters
• SemanDc approaches can provide complementary informaDon: – Simplify the informaDon integraDon process – Provide a unified metadata layer – Discover and enrich informaDon – Provide a unified access to informaDon
20/10/2014 IEEE CIST conference 2014 47

SemanDc processing
• helping to make sense of large or complex sets of data without being supplied with any knowledge about the data
• Turning any data into informaDon/acDonable knowledge
• Some examples: – NLP technologies – Data Mining – ArDficial Intelligence – ClassificaDon – SemanDc Search
20/10/2014 IEEE CIST conference 2014 48
SemanDc technologies / SemanDc Web
• "The Seman0c Web is an extension of the current web in which informa0on is given well-‐defined meaning, beKer enabling computers and people to work in coopera0on.“ (Tim Berners-‐Lee, 2001)
• Standards include: – a flexible data model (RDF) – schema and ontology languages for describing concepts and relaDonships (RDFS and OWL)
– a query language (SPARQL) • Use of semanDc technologies in semanDc processing (e.g. semanDc search)
• Use of semanDc technologies for storing and querying data (triple store and SPARQL)
20/10/2014 IEEE CIST conference 2014 49

SemanDc Data AggregaDon and
Linking for Big Data • Transforming unstructured content into a
structured format for later analysis is a major challenge.
• The value of data explodes when it can be linked with other data, thus data integraDon is a major creator of value
• Data aggregaDon from various sources can establish the veracity
• SemanDc technologies are a way of addressing variety
20/10/2014 IEEE CIST conference 2014 50

Linked Data / Web of Data • Linked Data is a set of principles that allows publishing, querying and consump1on of RDF data, distributed across different servers
• Not necessarily free / open data • ExponenDal growth -‐> a Big Data approach: enriching Big Data with metadata & semanDcs, interlinking Big Data sets
• PricewaterhouseCoopers, 2009: « You’ll be able to find pieces of data sets from different places, aggregate them without warehousing, and analyse them in a more straighSorward, powerful way » 20/10/2014 IEEE CIST conference 2014 51
• Natural Language Processing (NLP) • Ontology Engineering techniques
• SemanDc enrichment:
– AddiDon of contextual informaDon – SemanDc annotaDon – Data categorizaDon / classificaDon – Improved informaDon retrieval – Reasoning
SemanDc Technologies for Big Data
20/10/2014 IEEE CIST conference 2014 52

SemanDc Data AggregaDng and Linking for Big Data
Ontologies
Linked Open Data
Non-structured Structured
Linked Open Data
Textual content
DAT
A LA
YER
Sensor data
Documents
Web pages
Social Media
KNO
WLE
DG
E LA
YER
SemanDc aggregaDon
SemanDc Enrichment and disambiguaDon Linking data
Database 20/10/2014 IEEE CIST conference 2014 53
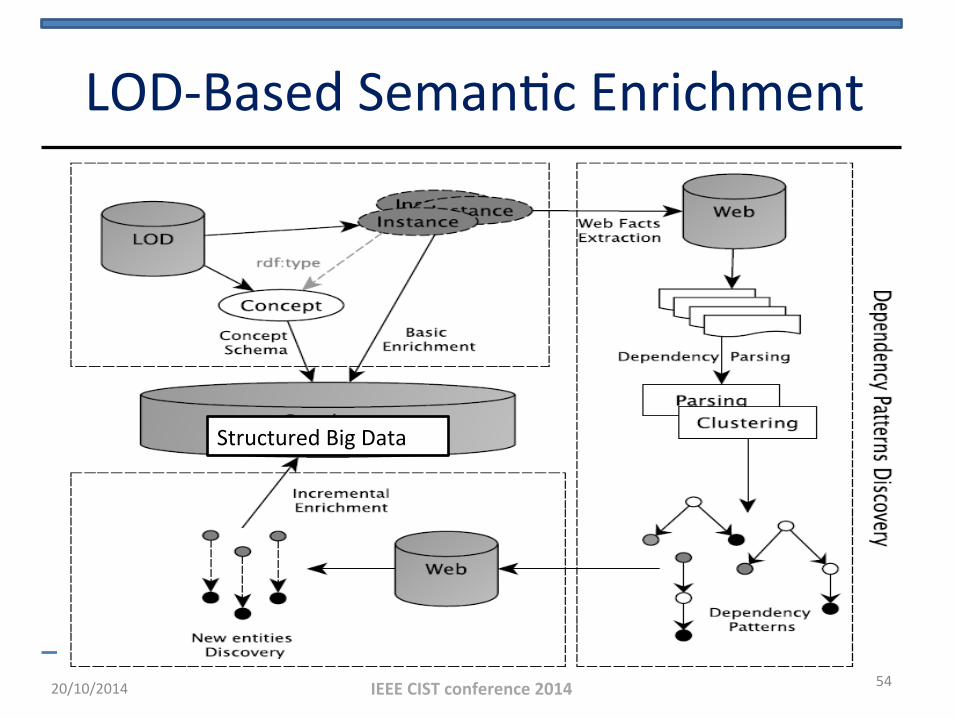
LOD-‐Based SemanDc Enrichment
Structured Big Data
20/10/2014 IEEE CIST conference 2014 54
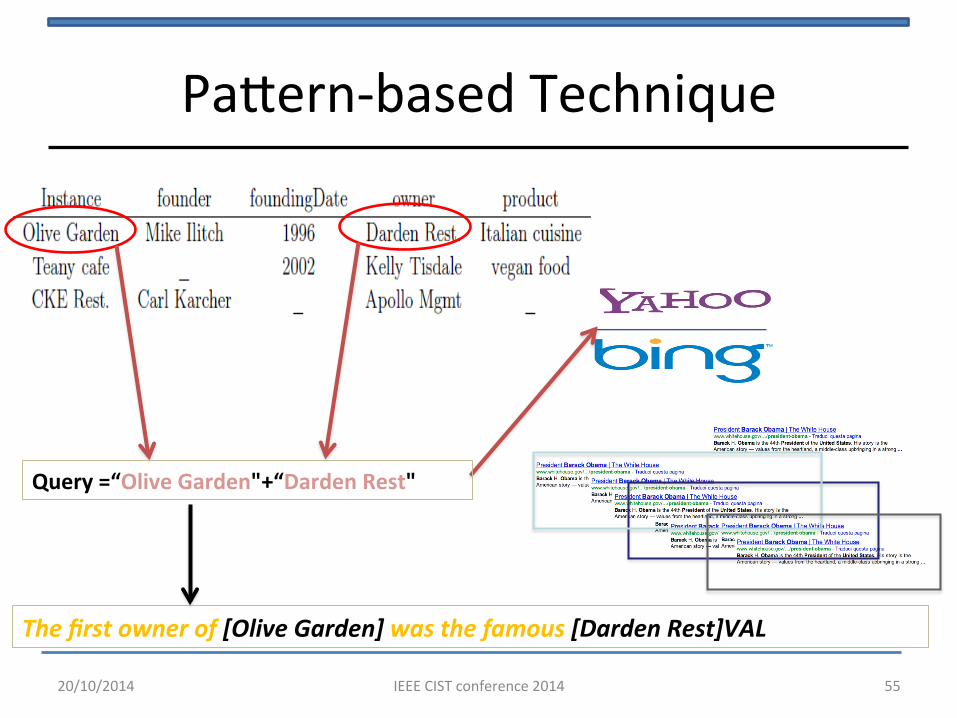
Pahern-‐based Technique
20/10/2014 IEEE CIST conference 2014 55
Query =“Olive Garden"+“Darden Rest"
The first owner of [Olive Garden] was the famous [Darden Rest]VAL
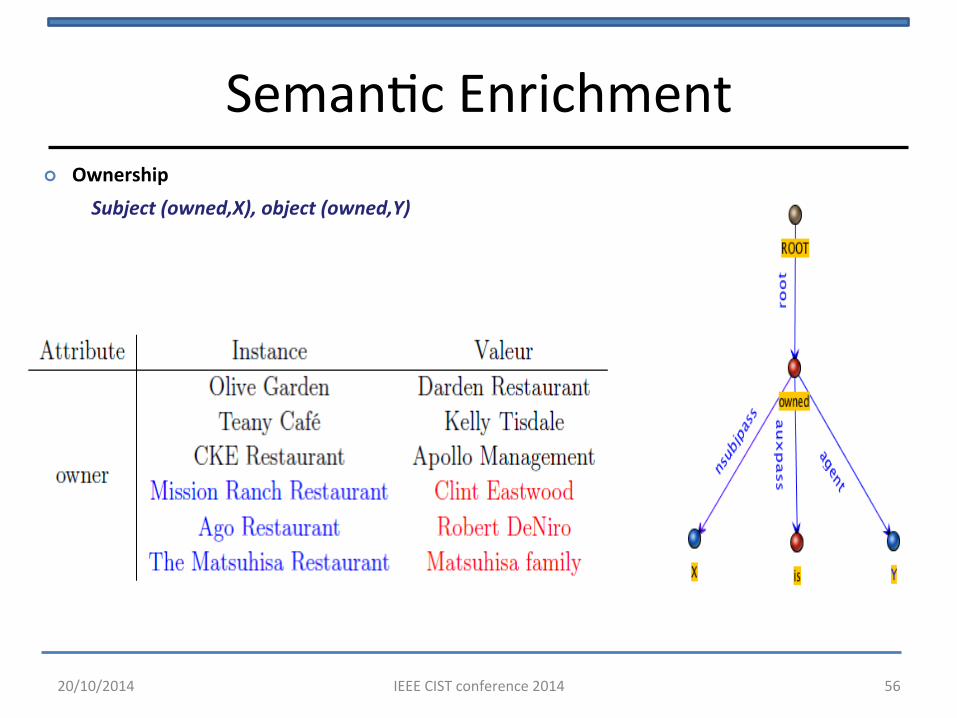
SemanDc Enrichment
20/10/2014 IEEE CIST conference 2014 56
¢ Ownership Subject (owned,X), object (owned,Y)
Value of SemanDc Technologies
• SemanDc Technologies provide opportuniDes for reducing the cost and complexity of data integraDon
• Common metadata layer • Powerful soluDons to find and explore informaDon • SemanDc Technologies are a good fit for Big Data’s Variety
• Velocity and Volume: challenging issues for SemanDc Technologies
• Linked Data will grow into Big Linked Data, but Big Data will also benefit from evolving into Linked Big Data
20/10/2014 IEEE CIST conference 2014 57
Social Networks
20/10/2014 IEEE CIST conference 2014 58
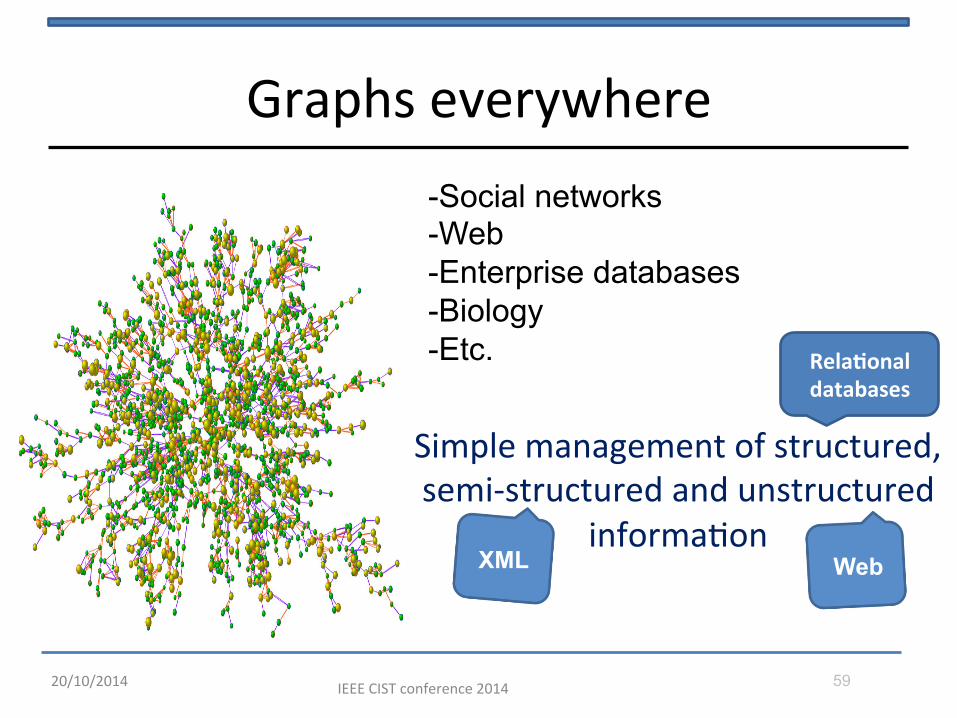
Graphs everywhere
IEEE CIST conference 2014 59
- Social networks - Web - Enterprise databases - Biology - Etc.
20/10/2014
Simple management of structured, semi-‐structured and unstructured
informaDon
Rela1onal databases
XML Web
Graphs: what can we do with? • Traversing linked informaDon, finding shortest path, doing
(semanDc) parDDon • RecommendaDon and discovery of potenDally interesDng
linked informaDon • Exploit the graph structure of large repositories
– Web environment – Digital documents repositories – Databases with metadata
• Use cases : recommendaDon, social networks
IEEE CIST conference 2014 60 20/10/2014
Graphs for Social networks: enterprises use case
• A technology for internal communicaDon, informaDon sharing and collaboraDon
• A technology for informaDon communicaDon towards clients – Vote for the best product, – Understand the clients needs
• A technology for watching the gossip – E-‐reputaDon, opinion mining
• A technology for creaDng collecDve intelligence – CollaboraDve common knowledge – Wikis and blogs associated to social networks
20/10/2014 IEEE CIST conference 2014 61
Graphs for Social networks: public administraDons use case
• Public administraDons need social networks: – As enterprises:
• To analyze internal networks (projects, organizaDon…) • To analyze external networks (suppliers, clients, partners…)
– As an interface for ciDzens: • To be well-‐understood by ciDzens (who does what) • To understand ciDzens (who says what)
• Scenarios examples: – Need to look over the organizaDonal structure (employees, departments,
transversal projects) and idenDfy costs – Need for ciDzens to understand the impact of public poliDcs (offered
services, available resources for each district of the city, which projects are the most relevant, ciDzens complains)
– Opinion analysis from external social networks (Twiher for example)
20/10/2014 IEEE CIST conference 2014 62
Social web – Social Networks
• The Social SemanDc Web combines technologies, strategies and methodologies from the SemanDc Web, social sokware and the Web 2.0.
• Web 2.0 allows users to express their opinion on products and services
• Understanding “what people think” can support decision-‐making, both for consumers and producers
20/10/2014 IEEE CIST conference 2014 63
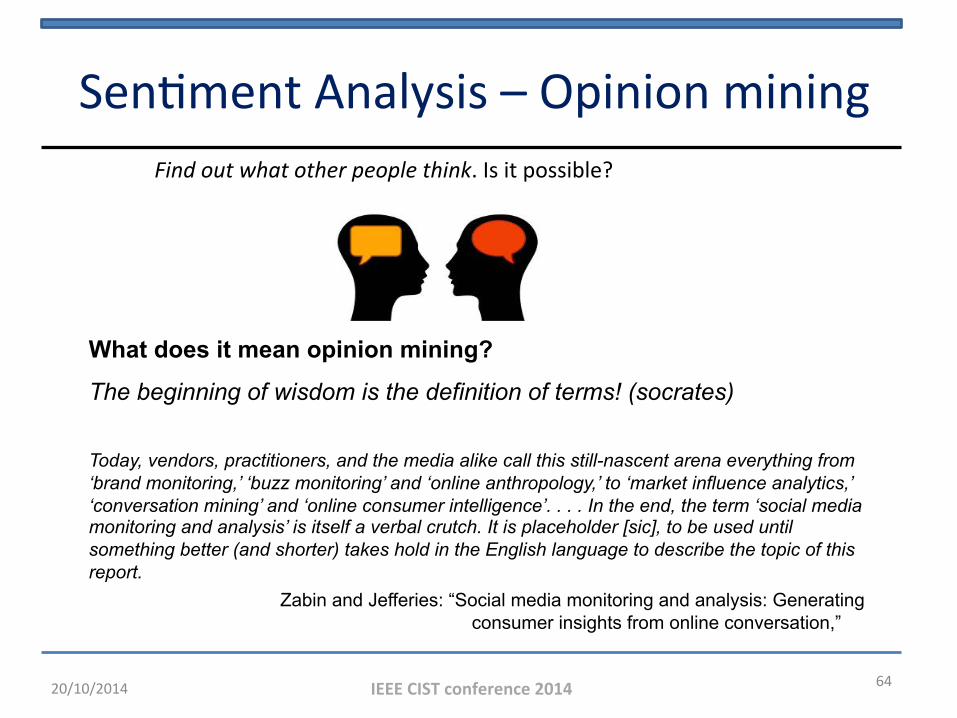
SenDment Analysis – Opinion mining Find out what other people think. Is it possible?
What does it mean opinion mining?
The beginning of wisdom is the definition of terms! (socrates)
Today, vendors, practitioners, and the media alike call this still-nascent arena everything from ‘brand monitoring,’ ‘buzz monitoring’ and ‘online anthropology,’ to ‘market influence analytics,’ ‘conversation mining’ and ‘online consumer intelligence’. . . . In the end, the term ‘social media monitoring and analysis’ is itself a verbal crutch. It is placeholder [sic], to be used until something better (and shorter) takes hold in the English language to describe the topic of this report.
Zabin and Jefferies: “Social media monitoring and analysis: Generating consumer insights from online conversation,”
20/10/2014 IEEE CIST conference 2014 64
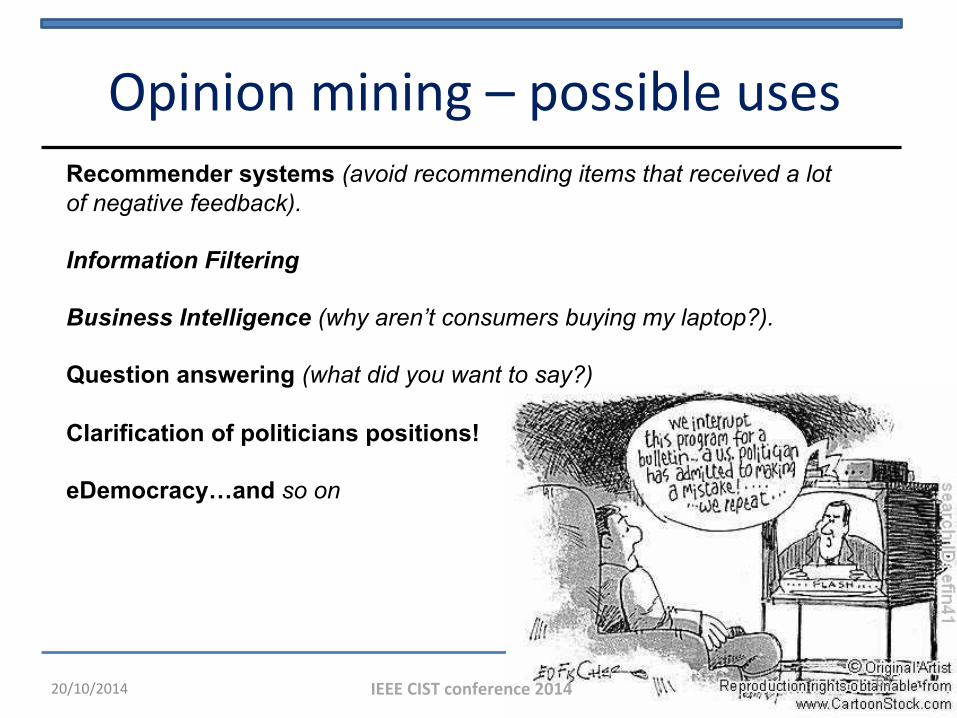
Opinion mining – possible uses Recommender systems (avoid recommending items that received a lot of negative feedback). Information Filtering Business Intelligence (why aren’t consumers buying my laptop?). Question answering (what did you want to say?) Clarification of politicians positions! eDemocracy…and so on
20/10/2014 IEEE CIST conference 2014 65
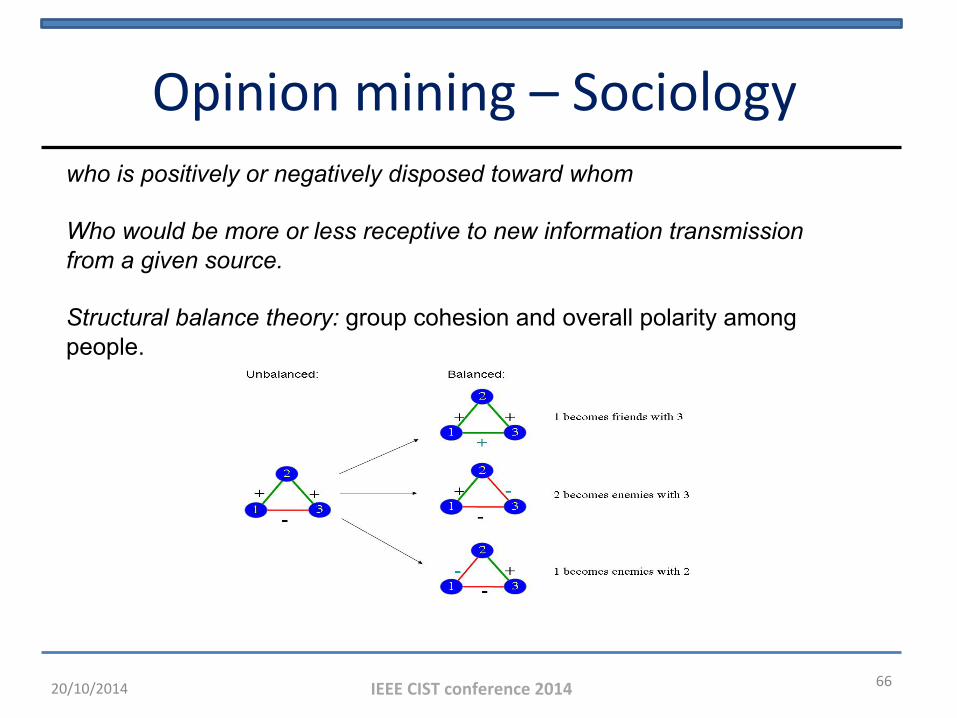
Opinion mining – Sociology who is positively or negatively disposed toward whom Who would be more or less receptive to new information transmission from a given source. Structural balance theory: group cohesion and overall polarity among people.
20/10/2014 IEEE CIST conference 2014 66

Opinion mining – The perfect tool
The development of a complete opinion-search application might involve 1) Determine which documents or portions of documents contain
opinionated material. 2) Identify the overall sentiment expressed by these documents and/
or the specific opinions regarding particular features or aspects of the items or topics in question, as necessary.
3) Finally, the system needs to present the sentiment information it has garnered in some reasonable summary fashion (aggregation of “votes”, selective highlighting of some opinions, etc)

Opinion mining – Polarity
A basic task in sentiment analysis is classifying the polarity of a given text at the document, sentence, or feature/aspect level — whether the expressed opinion in a document, a sentence or an entity feature/aspect is positive, negative, or neutral.
A polarity is a real number quantifying the user’s positive, negative or neutral opinion.
20/10/2014 IEEE CIST conference 2014 68
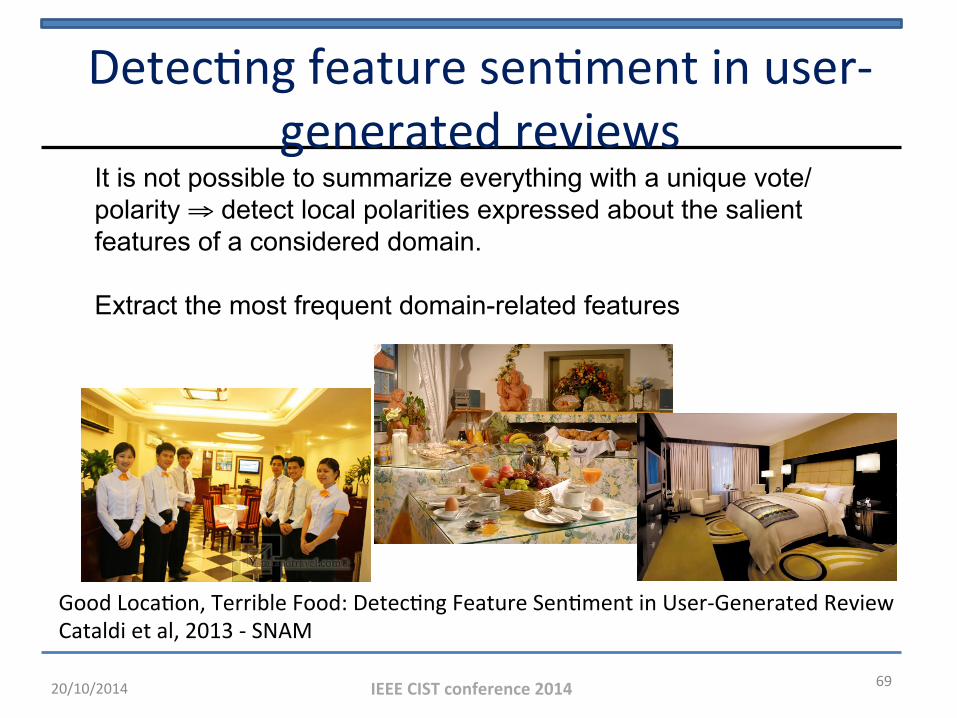
DetecDng feature senDment in user-‐generated reviews
It is not possible to summarize everything with a unique vote/polarity ⇒ detect local polarities expressed about the salient features of a considered domain.
Extract the most frequent domain-related features
20/10/2014 IEEE CIST conference 2014 69
Good LocaDon, Terrible Food: DetecDng Feature SenDment in User-‐Generated Review Cataldi et al, 2013 -‐ SNAM
Combining staDsDcs and NLP 1) We idenDfy the most characterizing aspects of one domain (hotels,
restaurant, products) by analyzing the domain corpus and extracDng the most frequent terms (eventually structuring them as a vocabulary and/or ontology)
2) We formalize the content of each review as a dependency tree among its terms and retrieve (if they exist) the features discussed within it. Then, by using the tree, we aim at discovering all the other terms that vehiculate some polarity linguisDcally connected to them.
20/10/2014 IEEE CIST conference 2014 70

ER
V
1,iφ ni ,φ2,iφ
Feature Extractor
Linguis1c Parser
Raw text
POS-‐tagging
τ
feature1 feature3
feature2 feature4
F
ranking
Synset Polarity computa1on
WordNet
synset
term
pos. polar
neg. polar
Sen1ment Computa1on
feature1
iFSubset of features
in G
Polarity for feature1
Phrase Structure
Dep. Graph G English Corpus
Feature Set
…
Dep. Graph G
synset1 synset2
Synsets in G, carrying some sen0ment, referred to a feature in iF
20/10/2014 IEEE CIST conference 2014 71
Graphs and social networks
• Can be useful for many applicaDons: – E-‐reputaDon and trust management – Monitoring of social networks for security – RecommendaDon of corporate data/informaDon – Retail
20/10/2014 IEEE CIST conference 2014 72
Is TwiKer just a mirror of mass sen0ment or is it also able to influence opinion ?
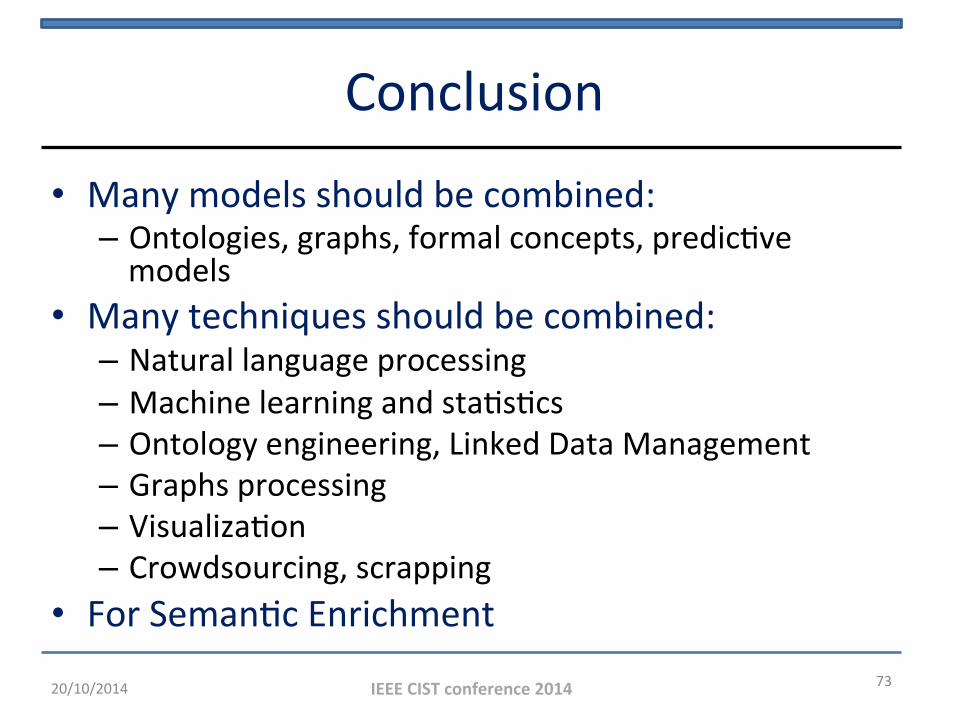
Conclusion
• Many models should be combined: – Ontologies, graphs, formal concepts, predicDve models
• Many techniques should be combined: – Natural language processing – Machine learning and staDsDcs – Ontology engineering, Linked Data Management – Graphs processing – VisualizaDon – Crowdsourcing, scrapping
• For SemanDc Enrichment
20/10/2014 IEEE CIST conference 2014 73

Challenges • SemanDc InformaDon aggregaDon
– Pahern extracDon from streams and cross-‐analysis – InformaDon extracDon from Linked Open Data: concepts and relaDons linked
to the streams paherns – Opinion aggregaDon from social media and web – Social aspects for collaboraDon – InformaDon aggregaDon: “too much data to assimilate but not enough
knowledge to act” • Distributed and real-‐Dme processing
– Design of real-‐Dme and distributed algorithms for stream processing and informaDon aggregaDon
– Storage and indexaDon of a knowledge base – IntegraDon of business processes with aggregated informaDon – DistribuDon and parallelizaDon of data mining algorithms
• visual analyDcs and user modeling – Dynamic user model – Novel visualizaDons for very large datasets
20/10/2014 IEEE CIST conference 2014 74
QUESTIONS?
20/10/2014 IEEE CIST conference 2014 75


