BIODIVERSITAS ISSN: 1412-033X Volume 17, Number 2, October 2016 E-ISSN: 2085-4722 Pages: 753-763 DOI: 10.13057/biodiv/d170251
Markers-traits association for iron toxicity tolerance in selected Indonesian rice varieties
YUDHISTIRA NUGRAHA1,2,♥, DWINITA W. UTAMI1, IDA ROSDIANTI1, SINTHO WAHYUNING ARDIE2, MUNIF GHULAMMAHDI2, SUWARNO1, HAJRIAL ASWIDINNOOR2,♥♥
1Indonesian Agency for Agricultural Research and Development. Jl. Pasar Minggu, Jakarta Selatan 12540, Jakarta, Indonesia. Tel. +62-21-7806202, Fax. +62-21-7800644, ♥email: [email protected]
2 Department Agronomy and Horticulture, Faculty of Agriculture, Institut Pertanian Bogor. Jl. Meranti Kampus Darmaga Bogor 16680, West Java, Indonesia. ♥♥email: [email protected]
Manuscript received: 23 June 2016. Revision accepted: 16 September 2016.
Keywords: Golden gate assay, grain yield, leaf bronzing scores, principle component analysis, single nucleotide polymorphism Abbreviations: SNPs = Single Nucleotide Polymorphisms, AM = Association Mapping, LD= Linkage Disequilibrium, GG= Golden Gate Assay, NGS= Next Generation sequencing ,QTL = Quantitative Trait Loci, LBS = Leaf Bronzing Score, PCA = Principle Component Analysis, SES = Standard Evaluation System For Rice, GLM = General Linear Model, PC = Principle Component, HTDT = Heavy Metal Transport Detoxification
INTRODUCTION
Iron (Fe) toxicity is one of the most important yield-limiting abiotic stresses in flooded lowland rice of humid-tropic areas (Becker and Asch 2005). In Indonesia iron toxicity in rice mostly can be found in swampy-land of acid sulfate soil and acid-clay soil which was occupied about 1 million ha (Ismunadji 1991). The typical symptoms associated with iron toxicity is leaf discoloration (bronzing) and reddish spots (Ponnamperuma et al. 1955). Yield losses associated with iron toxicity commonly range from 15% to 30%. However, in the case of severe toxicity occurs at the seedling stage, total crop failure can happen (Audebert and Sahrawat 2000). While some cultural practices have been suggested to counteract negative effects of Fe excess in soil solution such as water (Prasetyo et al. 2013), soil (Fageria et al. 2008), and nutrient (Ramirez et al. 2002) management strategies, however the most promising approach is to use tolerant genotypes.
Some rice genotypes have been identified as tolerant to iron toxicity, most of them were land races or local varieties which characterized as a photoperiod sensitive, taller plant high and low grain yield (Onaga et al. 2013;
Suhartini and Makarim 2009). Introducing the traits of tolerant to iron toxicity from those varieties into the high yield popular varieties is the way to improved rice productivity in iron toxicity environment. Several study have been mapped on the rice genome related with traits involved in tolerance to Fe toxicity, under various environ-mental conditions and using different segregating populations issued from intra-specific populations (Dufey et al. 2009, 2012a; Shimizu 2009; Shimizu et al. 2005; Wan et al. 2003a, b; Wu et al. 1997, 1998; Wu et al 2014) or interspecific (Dufey et al. 2012b) crosses. These QTLs for traits directly or indirectly linked to iron toxicity tolerance have been localized but challenges of confident genomic localization remain huge, and with several hundred genes involved, their use in breeding programs is difficult. The method for narrowing the QTL via the production of a very large recombinant population, but this method is time consuming, costly and, for small-effect QTLs with low heritability, difficult in practice (Northon et al. 2008).
Marker-traits association is an alternative approach, to identify DNA-markers which are located in or in the neighborhood of the genes of interest. The strategies to identify marker-trait association could be used natural
B IODIVERSITAS 17 (2): 753-763, October 2016
754
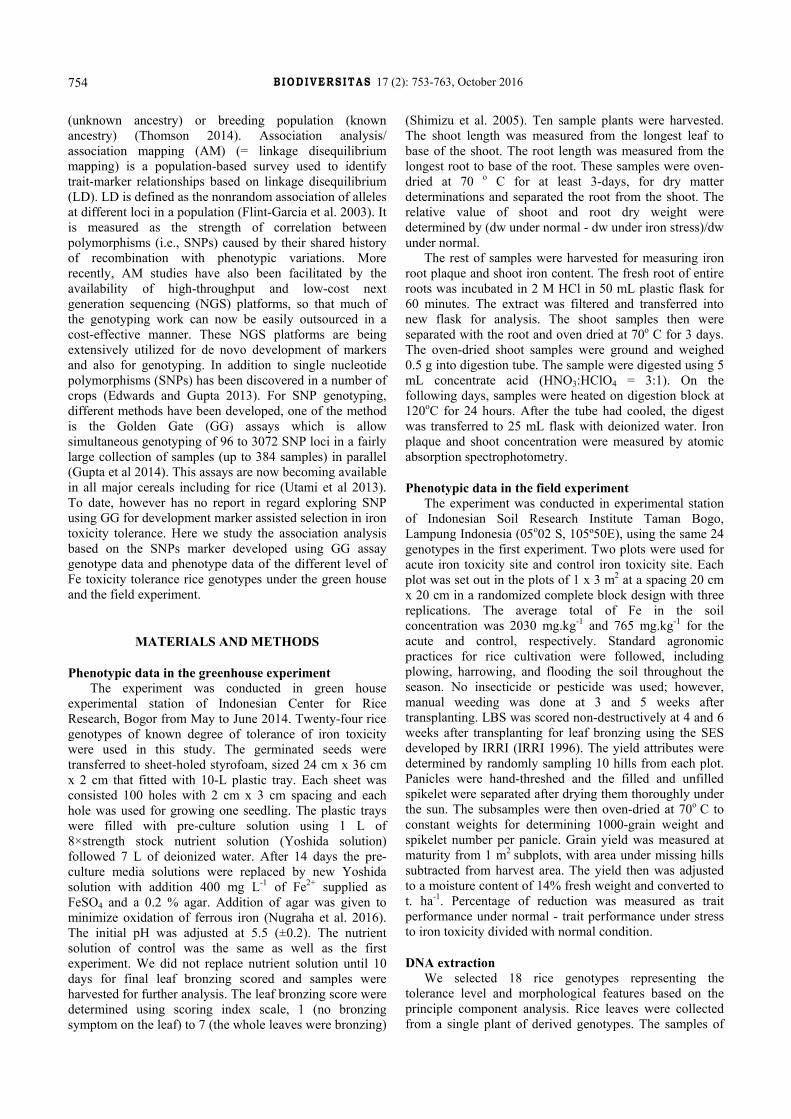
(unknown ancestry) or breeding population (known ancestry) (Thomson 2014). Association analysis/ association mapping (AM) (= linkage disequilibrium mapping) is a population-based survey used to identify trait-marker relationships based on linkage disequilibrium (LD). LD is defined as the nonrandom association of alleles at different loci in a population (Flint-Garcia et al. 2003). It is measured as the strength of correlation between polymorphisms (i.e., SNPs) caused by their shared history of recombination with phenotypic variations. More recently, AM studies have also been facilitated by the availability of high-throughput and low-cost next generation sequencing (NGS) platforms, so that much of the genotyping work can now be easily outsourced in a cost-effective manner. These NGS platforms are being extensively utilized for de novo development of markers and also for genotyping. In addition to single nucleotide polymorphisms (SNPs) has been discovered in a number of crops (Edwards and Gupta 2013). For SNP genotyping, different methods have been developed, one of the method is the Golden Gate (GG) assays which is allow simultaneous genotyping of 96 to 3072 SNP loci in a fairly large collection of samples (up to 384 samples) in parallel (Gupta et al 2014). This assays are now becoming available in all major cereals including for rice (Utami et al 2013). To date, however has no report in regard exploring SNP using GG for development marker assisted selection in iron toxicity tolerance. Here we study the association analysis based on the SNPs marker developed using GG assay genotype data and phenotype data of the different level of Fe toxicity tolerance rice genotypes under the green house and the field experiment.
MATERIALS AND METHODS
Phenotypic data in the greenhouse experiment The experiment was conducted in green house
experimental station of Indonesian Center for Rice Research, Bogor from May to June 2014. Twenty-four rice genotypes of known degree of tolerance of iron toxicity were used in this study. The germinated seeds were transferred to sheet-holed styrofoam, sized 24 cm x 36 cm x 2 cm that fitted with 10-L plastic tray. Each sheet was consisted 100 holes with 2 cm x 3 cm spacing and each hole was used for growing one seedling. The plastic trays were filled with pre-culture solution using 1 L of 8×strength stock nutrient solution (Yoshida solution) followed 7 L of deionized water. After 14 days the pre-culture media solutions were replaced by new Yoshida solution with addition 400 mg L-1 of Fe2+ supplied as FeSO4 and a 0.2 % agar. Addition of agar was given to minimize oxidation of ferrous iron (Nugraha et al. 2016). The initial pH was adjusted at 5.5 (±0.2). The nutrient solution of control was the same as well as the first experiment. We did not replace nutrient solution until 10 days for final leaf bronzing scored and samples were harvested for further analysis. The leaf bronzing score were determined using scoring index scale, 1 (no bronzing symptom on the leaf) to 7 (the whole leaves were bronzing)
(Shimizu et al. 2005). Ten sample plants were harvested. The shoot length was measured from the longest leaf to base of the shoot. The root length was measured from the longest root to base of the root. These samples were oven-dried at 70 o C for at least 3-days, for dry matter determinations and separated the root from the shoot. The relative value of shoot and root dry weight were determined by (dw under normal - dw under iron stress)/dw under normal.
The rest of samples were harvested for measuring iron root plaque and shoot iron content. The fresh root of entire roots was incubated in 2 M HCl in 50 mL plastic flask for 60 minutes. The extract was filtered and transferred into new flask for analysis. The shoot samples then were separated with the root and oven dried at 70o C for 3 days. The oven-dried shoot samples were ground and weighed 0.5 g into digestion tube. The sample were digested using 5 mL concentrate acid (HNO3:HClO4 = 3:1). On the following days, samples were heated on digestion block at 120oC for 24 hours. After the tube had cooled, the digest was transferred to 25 mL flask with deionized water. Iron plaque and shoot concentration were measured by atomic absorption spectrophotometry.
Phenotypic data in the field experiment The experiment was conducted in experimental station
of Indonesian Soil Research Institute Taman Bogo, Lampung Indonesia (05o02 S, 105º50E), using the same 24 genotypes in the first experiment. Two plots were used for acute iron toxicity site and control iron toxicity site. Each plot was set out in the plots of 1 x 3 m2 at a spacing 20 cm x 20 cm in a randomized complete block design with three replications. The average total of Fe in the soil concentration was 2030 mg.kg-1 and 765 mg.kg-1 for the acute and control, respectively. Standard agronomic practices for rice cultivation were followed, including plowing, harrowing, and flooding the soil throughout the season. No insecticide or pesticide was used; however, manual weeding was done at 3 and 5 weeks after transplanting. LBS was scored non-destructively at 4 and 6 weeks after transplanting for leaf bronzing using the SES developed by IRRI (IRRI 1996). The yield attributes were determined by randomly sampling 10 hills from each plot. Panicles were hand-threshed and the filled and unfilled spikelet were separated after drying them thoroughly under the sun. The subsamples were then oven-dried at 70o C to constant weights for determining 1000-grain weight and spikelet number per panicle. Grain yield was measured at maturity from 1 m2 subplots, with area under missing hills subtracted from harvest area. The yield then was adjusted to a moisture content of 14% fresh weight and converted to t. ha-1. Percentage of reduction was measured as trait performance under normal - trait performance under stress to iron toxicity divided with normal condition.
DNA extraction We selected 18 rice genotypes representing the
tolerance level and morphological features based on the principle component analysis. Rice leaves were collected from a single plant of derived genotypes. The samples of
NUGRAHA et al. – Markers-traits association for iron toxicity
755
fresh leaf 21-days-old rice seedling were placed in bead and grounded in a tissue-lyser following the manufacture instruction (Qiagen, Venlo, Netherlands). A minimum of 15 µl genomic DNA (50 ng µL-1) was required for the Golden Gate assay. DNA was stored in TE buffer (10 mM Tris, pH 7.5: 1 mM EDTA). DNA purity was determined by using the A260/A280 ratio of 1.8-2.0 (Sambrook dan Russell 2001).
Custom design 384 SNP-chip The 384 SNP-chip was designed based on the genetic
map several genes/ QTL associated with Fe toxicity tolerant character that has been characterized by a previous study (Utami et al. 2014). The SNPs set of GS0014316-OPA was selected for this study based on Golden Gate Vera Code oligo pool assay (OPA) sets for the Illumina Bead Xpress Reader. This SNPs multiplex previously was validated by Thomson et al (2011) using population within indica and aus germplasm, and also informative for Indica/Indica populations which it has no call threshold of less than 0.25 and nearly more than >90% call frequency and <10% minor allele frequency.
The SNP sets were designed for the Illumina Golden Gate assay using multiplexes of 384 custom SNP panels. These custom Oligo Pool Assay (OPA) sets were then run on the Illumina platform which consists of an iSCAN reader with autoloader and Genome Studio analysis software which can be used with a variety of chemistries for genotyping based on Illumina Product Guide. The Golden Gate assay is an allele-specific oligo hybridization, ligation and extension assay followed by universal PCR amplification, allowing that no amplification bias can occur. These amplification products were then bond to the 3 µM microbeads and alleles were read by fluorescent readout using the iSCAN reader. The Genome Studio software from Illumina was used for allele clustering based on the ratio of the cy3/cy5 signal intensities to call the three genotype classes.
Data analysis Statistical analyses were performed with SAS® version
9.1. For continuous data, we used analysis of variance (ANOVA) after verifying that the residuals met the criterion of normal distribution. When comparing up to three pre-determined means, we analyzed differences between means by Least Square Different. The green house and field experiment data were analyzed using principal component analysis (PCA) on the covariance matrix of traits. PCA analysis were performed using software tool Minitab 15. Association analysis between SNP markers and phenotypical data was tested using the General Linear Model (GLM) in the Tassel v. 3.0 software program (Bradbury et al. 2007). Values of the Q matrix obtained in Structure were presented as covariates. The P value determines whether a marker was associated with the marker and R2 for a marker evaluates the magnitude of QTL effect to phenotypes. Further, dendrogram for clustering among genotypes were done using Tassel v. 3.0 using the selected-identified SNPs marker with probability more than 0.001.
RESULTS AND DISCUSSION
Phenotypic variation of rice genotypes under nutrient solution with iron-toxic stress
In the green house experiment, we identified IPB107-5-1-1 and IR64 had the highest bronzing scores 5.3 and 5.2, respectively (Figure 1 and 2). The rice genotypes Siam Saba (2.8), Cilamaya Muncul (2.9) and Pokkali (3.0) were the lowest bronzing scores among all the tested genotypes (Figure 2). Exceed iron also inhibited growth and development of roots and shoot, which was indicated with greatly reduced the sensitive genotypes, IR64, by 75% and 48% (Table 1). Less reduction of shoot length and root length was observed in the tolerant genotypes like Siam Saba, by 82% and 68%. This genotypes also had less reduction of shoot dry weight along with Margasari, by 87% compared to the lowest loss of shoot dry weight IR64 and IPB107-5-1-1 (58%). All genotypes also showed reduction in root dry weight, but pronounced in IR64 by 30% from the normal condition. The less reduction of root dry weight was found in B13144-1-MR-2 (77%).
Phenotypic variation of rice genotypes under natural iron-toxic stress
The same 20 genotypes (four genotypes could not be planted because of poor germination in nursery) that screened in nutrient solution culture were grown and evaluated for iron-toxicity tolerance in a field in Taman Bogo Lampung (Indonesia), during the 2013 wet season. In the field, plants were not immediately subjected to iron toxicity upon transplanting, in contrast to plants grown in the greenhouse, where iron toxicity was imposed 5 days after they were established in nutrient solution. We observed leaf bronzing scores appearing at the 4-week stage in the field ranged from 3.0 to 7.5 under acute site and 3 to 6 under normal site (Figure 5). Siam Saba and Mahsuri had the least leaf bronzing symptoms while IR64, Inpara 5, Fatmawati, and IPB107-27 had the most leaf bronzing symptoms. During 6-week stage in the field leaf bronzing score of the most bronzing symptom genotypes became higher from the existing scores, suggesting more accumulation of iron during plant growth. Although Siam Saba was the less bronzing score, however we had no data for grain yield and its attributes due to photoperiod sensitive. This cultivar only can be flowering during August-September in the origin where this cultivar is grown in South Kalimantan.
Iron toxicity affected grain yield tiller number, 1000-grain weight and spikelet number and had interactive effect between genotypes and the iron site (Table 2). Significant different reduced of tiller number was also presented in this study. The sensitive cultivar, IR64 and Inpara5 had high tiller number under normal iron toxicity site but highly reduced up to 44% and 47% respectively under acute iron toxicity. We observed that there was no consistency in average of percentage reduced in 1000-grain weight and spikelet number among sensitive, tolerant, and normal genotypes. For example, Batu Tegi, a sensitive cultivar, showed less reduced 1000-grain weight (2%) while inpara2, a tolerant cultivar, had more reduced 1000-grain
B IODIVERSITAS 17 (2): 753-763, October 2016
756
weight (13%) under acute iron toxicity condition. The grain yield of sensitive genotypes was most affected by iron toxicity. Limboto was the most less reduced the grain yield
(0.5%) but under normal condition this cultivar was quit low also compared to average total genotypes both in stressed iron and normal condition.
Table 1. LBS, Relative plant height, root length, shoot dry weight, and root dry weight of the rice genotypes under 400 mg. L-1 of Fe2+ for 10 days
Genotypes Relative Shoot length
Relative Root length
Relative Shoot dw
Relative Root dw
IR64 0.75 e-g 0.48 d-f 0.58 i 0.30 h Inpara5 0.75 e-g 0.45 ef 0.64 ih 0.34 gh Fatmawati 0.78 c-g 0.43 f 0.66 g-i 0.37 gh Batu Tegi 0.77 d-g 0.48 d-f 0.69 gh 0.58 bc Limboto 0.86 a-c 0.59 a-d 0.85 ab 0.52 b-d Margasari 0.82 a-f 0.68 a 0.87 a 0.57 bc Indragiri 0.79 c-g 0.53 b-f 0.75 b-f 0.52 b-d A. Tenggulang 0.77 d-g 0.57 a-d 0.74 d-g 0.50 b-e Siam Saba 0.82 a-f 0.68 a 0.87 a 0.68 ab Inpara 2 0.78 c-g 0.66 ab 0.84 ab 0.61 b Inpara 3 0.83 a-e 0.51 c-f 0.79 a-e 0.47 b-f IPB Dadahp 1R 0.79 c-g 0.54 b-f 0.75 b-e 0.41 d-g IPB Batola 5R 0.79 c-g 0.49 d-f 0.66 g-i 0.40 d-g IPB Batola 6R 0.80 c-f 0.50 d-f 0.70 f-h 0.42 d-g IPBKapuas 7R 0.76 e-g 0.43 f 0.72 e-g 0.40 d-g IPB107F-5-1-1 0.77 d-g 0.48 d-f 0.58 i 0.34 gh Pokkali 0.80 c-f 0.60 a-d 0.83 a-c 0.51 b-e Mahsuri 0.80 c-f 0.62 a-d 0.82 a-c 0.51 b-e B13144-1-MR-2 0.86 a-c 0.56 a-e 0.84 ab 0.77 a B13100-2-MR-2 0.77 d-g 0.51 c-f 0.69 gh 0.42 d-g Cilamaya M 0.88 a 0.58 a-c 0.86 ab 0.73 a Awan Kuning 0.81 a-f 0.65 ab 0.79 a-e 0.51 b-d Mesir 0.81 a-f 0.62 a-d 0.80 a-c 0.53 b-d Kapuas 0.81 a-f 0.63 a-c 0.81 a-c 0.45 c-g CV (%) 9.4 10.9 13.6 14.4 Note: Means followed by the same letters are not significantly different at 0.05 probability error of Duncan Multiple Range Test
IR64 IPB107 Inpara2 Pokkali B13144 Mahsuri
Figure 1. Appearance of leaf bronzing of rice seedling after exposure by 400 mg. L of Fe2+ in nutrient media cultures for 10 days.
NUGRAHA et al. – Markers-traits association for iron toxicity
757
K a p ua sM e s ir
A w an K
C ila m a y a M
B 13 1 00 - 2 -MR -2
B 1 31 4 4- 1 -MR - 2
M ah s u ri
P o k k a li
I PB 1 0 7F -5 - 1
- 1
I PB Kap u a s 7
R
I PB B
a t o la 6R
I PB B
a to la 5R
I PB 1 R
Da d ah up
I np a r a
3
I np a ra 2
S ia m Sa b a
A .Te ng g ula ng
I nd r a g ir i
M a r ga s a ri
L imbo to
B a t u T
eg i
F a tmaw a t i
I np a ra 5I R
64
6
5
4
3
2
LBS
(Sco
re)
Figure 2. Severity of leaf bronzing of rice seedling (scores) exhibited by 24 genotypes of rice after exposure to 400 mg. L-1 of Fe2+ in Yoshida with 0.2% agar nutrient cultures
Table 2. Yield and agronomic performance of 20 genotypes under acute iron toxicity and normal iron toxicity stress Taman Bogo in the WS 2013.
Genotypes Tiller number (no.) 1000-grain weight (g) Filled grain number (no.) Grain yield (t. ha-1) A N % A N % A N % A N %
IR64 8.7 a-c 16.3 ab 44 22.3 e-g 24.1 e 7 70 g 84 f 17 1.43 c 3.94 a-d 64 Inpara5 8.9 a-c 16.7 a 47 22.8 c-f 24.4 e 5 74 g 85 f 11 1.73 c 4.16 a-c 58 Fatmawati 7.2 c 9.0 f-h 22 25.1 a-e 27.3 ab 8 199 a 227 a 12 1.67 c 3.92 a-d 57 Batu Tegi 7.3 c 8.7 gh 22 27.6 a 28.2 a 2 185 a 222 a 17 2.19 bc 3.08 c-e 29 Limboto 7.7 bc 8.6 gh 11 23.6 c-f 25.2 e 6 81fg 92 ef 12 2.05 bc 2.06 e 0.5 Margasari 8.6 a-c 12.0 c-f 25 17.6 i 18.4 h 4 162 bc 180 b 10 2.24 bc 3.09 c-e 28 Indragiri 9.8 a 14.3 a-c 29 24.0 c-e 26.1 cd 8 99 e 113 d 12 2.58 ab 4.90 a 47 A. Tenggulang 7.1 c 11.0 e-h 36 23.2 e-g 25.6 d 9 98 e 109 de 10 2.56 ab 3.50 b-d 27 S. Sabaa 7.5 c 9.3 e-h 11 - - - - - - Inpara 2 8.7 a-c 11.7 c-g 25 23.7 c-f 24.2 e 13 102 e 116 d 12 3.51 a 4.14 a-d 15 Inpara 3 9.2 a-c 13.3 cd 31 27.9 a 29.0 a 4 105 e 118 d 11 2.67 ab 4.60 ab 42 IPB1 R 8.7 a-c 12.3 c-f 25 18.7 hi 19.9 g 6 160 bc 177 b 10 2.49 a-c 4.29 a-c 42 IPB Batola 5R 8.0 bc 13.3 cd 38 18.4 hi 19.1 gh 4 153 dc 180 b 15 2.40 a-c 4.71 a 49 IPB Batola 6R 8.6 a-c 12.2 c-f 25 19.2 f-h 19.8 g 3 148 dc 165 cb 10 2.29 bc 3.87 a-d 41 IPB Kapuas 7R 9.2 a-c 13.0 cd 31 18.7 hi 20.9 f 11 166 bc 186 b 11 2.06 bc 4.19 a-c 54 IPB107-27 9.0 a-c 12.0 cd 25 20.5 gh 21.1 f 6 138 d 155 c 11 2.02 bc 4.04 a-d 50 Pokkali 7.6 c 9.3 e-h 11 24.9 b-e 26.2 cd 5 93 ef 105 de 11 2.50 ab 2.89 de 13 Mahsuri 9.7 a 13.0 cd 23 18.2 ih 19.0 gh 4 184 a 202 ab 9 2.54 ab 4.14 a-d 39 B13144-1 8.3 a-c 13.7 a-d 43 26.3 a-c 27.0 bc 3 96 ef 108 de 11 2.53 ab 4.54 ab 44 B13100-2 9.8 a 13.3 cd 23 25.8 a-e 26.4 cd 2 104 e 124 a 16 2.59 ab 4.46 ab 42 Means 8.6 12.1 27 22.6 23.8 5 127 145 12 2.3 3.9 39 LSD (0.05) (within columns) 1.6
1.3 11.0 1.9
Note: A, the site with acute iron toxicity stress; N, the site with normal; % reduction = (normal iron toxicity stress - stress to iron toxicity)/ normal x 100; a no data because of photoperiod sensitive; LSD, least significant difference test at 5% level with a column; The means separation in a column by Duncan Multiple Range Test at 5% level; ** and *** significant different of F-test at 0.01 and 0.001 level, respectively
Principal component analysis described the phenotypic variation of the used genotypes for marker-traits association
Principal component analysis indicated that four principal components accounted for most of the variation of the genotypes and observed traits. The first four principal components accounted for 72 % of the total variation. The principle component 1 (31.2%) had strong
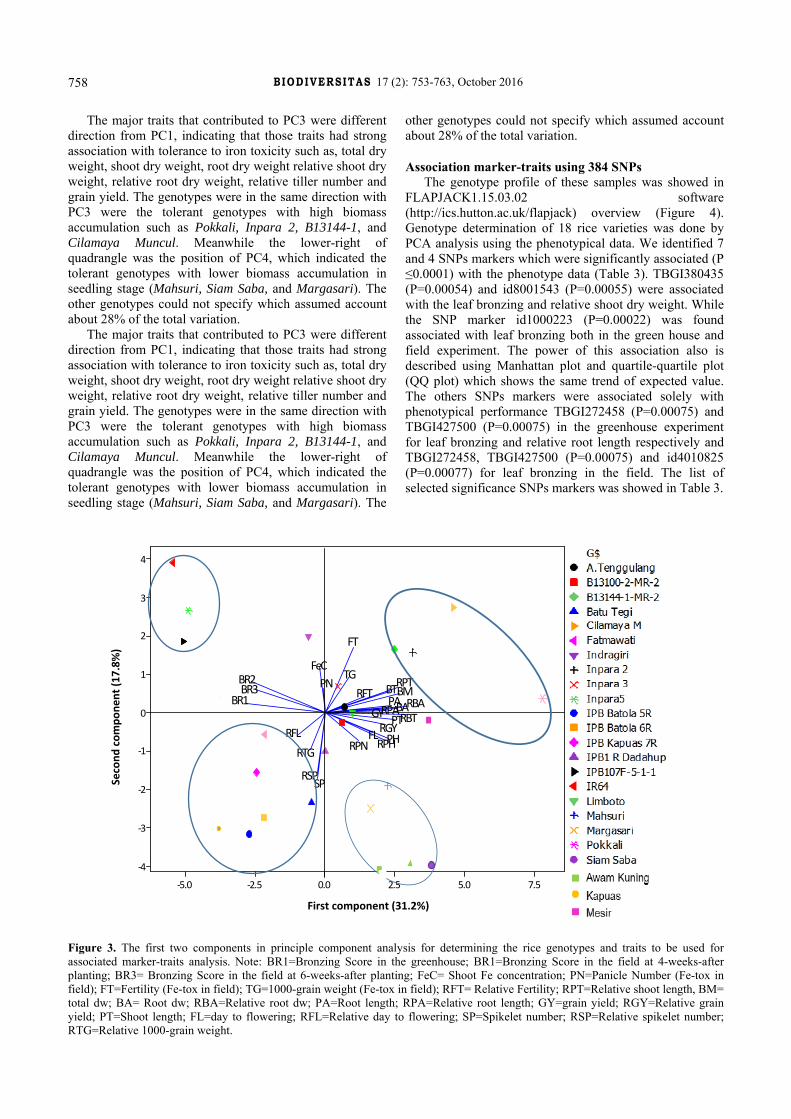
association with bronzing scores, meaning that the genotypes with high value of bronzing scores were in the same group which indicated as sensitive genotypes (IR64, Inpara 5 and IPB107-5-1-1) (Figure 3). The spikelet per panicles and 1000-grain weight were the most important contributors to PC2 (17.8%), which enabled grouping the genotypes of Fatmawati, IPB Dadahup 1R, IPB Batola 5R, IPB Batola 6R, IPB Kapuas 7R, and Batu Tegi.
IR64
Inpara5
Fatm
awati
Batu Tegi
Limbo
to
Margasari
Indragiri
A. Ten
ggulang
Siam
Saba
Inpara 2
Inpara 3
IPB Da
dahp
1R
IPB Ba
tola 5R
IPB Ba
tola 6R
IPBK
apuas 7
R
IPB1
07F‐5‐1‐1
Pokkali
Mahsuri
B131
44‐1‐M
R‐2
B131
00‐2‐M
R‐2
Cilamaya M
Awan
Kun
ing
Mesir
Kapu
as
B IODIVERSITAS 17 (2): 753-763, October 2016
758
The major traits that contributed to PC3 were different direction from PC1, indicating that those traits had strong association with tolerance to iron toxicity such as, total dry weight, shoot dry weight, root dry weight relative shoot dry weight, relative root dry weight, relative tiller number and grain yield. The genotypes were in the same direction with PC3 were the tolerant genotypes with high biomass accumulation such as Pokkali, Inpara 2, B13144-1, and Cilamaya Muncul. Meanwhile the lower-right of quadrangle was the position of PC4, which indicated the tolerant genotypes with lower biomass accumulation in seedling stage (Mahsuri, Siam Saba, and Margasari). The other genotypes could not specify which assumed account about 28% of the total variation.
The major traits that contributed to PC3 were different direction from PC1, indicating that those traits had strong association with tolerance to iron toxicity such as, total dry weight, shoot dry weight, root dry weight relative shoot dry weight, relative root dry weight, relative tiller number and grain yield. The genotypes were in the same direction with PC3 were the tolerant genotypes with high biomass accumulation such as Pokkali, Inpara 2, B13144-1, and Cilamaya Muncul. Meanwhile the lower-right of quadrangle was the position of PC4, which indicated the tolerant genotypes with lower biomass accumulation in seedling stage (Mahsuri, Siam Saba, and Margasari). The
other genotypes could not specify which assumed account about 28% of the total variation.
Association marker-traits using 384 SNPs The genotype profile of these samples was showed in
FLAPJACK1.15.03.02 software (http://ics.hutton.ac.uk/flapjack) overview (Figure 4). Genotype determination of 18 rice varieties was done by PCA analysis using the phenotypical data. We identified 7 and 4 SNPs markers which were significantly associated (P ≤0.0001) with the phenotype data (Table 3). TBGI380435 (P=0.00054) and id8001543 (P=0.00055) were associated with the leaf bronzing and relative shoot dry weight. While the SNP marker id1000223 (P=0.00022) was found associated with leaf bronzing both in the green house and field experiment. The power of this association also is described using Manhattan plot and quartile-quartile plot (QQ plot) which shows the same trend of expected value. The others SNPs markers were associated solely with phenotypical performance TBGI272458 (P=0.00075) and TBGI427500 (P=0.00075) in the greenhouse experiment for leaf bronzing and relative root length respectively and TBGI272458, TBGI427500 (P=0.00075) and id4010825 (P=0.00077) for leaf bronzing in the field. The list of selected significance SNPs markers was showed in Table 3.
7.55.02.50.0‐2.5‐5.0
4
3
2
1
0
‐1
‐2
‐3
‐4
First Component (31.2%)
Second
Com
pone
nt (1
7.8%
)
RGY
RFT
RSP
RTGRPHRPN
RFLGY
FT
SP
TG
PH
PN
FL
BR3BR2
FeC
RBT
RPT
RBARPABMBT
PTBAPABR1
Figure 3. The first two components in principle component analysis for determining the rice genotypes and traits to be used for associated marker-traits analysis. Note: BR1=Bronzing Score in the greenhouse; BR1=Bronzing Score in the field at 4-weeks-after planting; BR3= Bronzing Score in the field at 6-weeks-after planting; FeC= Shoot Fe concentration; PN=Panicle Number (Fe-tox in field); FT=Fertility (Fe-tox in field); TG=1000-grain weight (Fe-tox in field); RFT= Relative Fertility; RPT=Relative shoot length, BM= total dw; BA= Root dw; RBA=Relative root dw; PA=Root length; RPA=Relative root length; GY=grain yield; RGY=Relative grain yield; PT=Shoot length; FL=day to flowering; RFL=Relative day to flowering; SP=Spikelet number; RSP=Relative spikelet number; RTG=Relative 1000-grain weight.
First component (31.2%)
Second
com
pone
nt (1
7.8%
)
NUGRAHA et al. – Markers-traits association for iron toxicity
759
Figure 4. The genotype profile of eighteenth rice lines samples, particularly in one of the significant SNP locus, TBGU313277 which associated with leaf bronzing character and related with the Proline transporter candidate gene.
Table 3. SNP marker significantly associated with selected phenotypic character under Fe stress in the green house and field experiment
Characters Associated marker CRa
Position Mbpb
(cM)
Marker probability
R2
(%) Candidate gene
Greenhouse experiment Leaf bronzing TBGI380435 9 14.45 5.46.10-4 73 Heavy metal transport detoxification Relative shoot dw TBGI380435 9 14.45 2.41.10-4 67 Heavy metal transport detoxification Leaf bronzing id1000223 1 4.21 2.28.10-4 66 Expressed protein Relative shoot dw id8001543 8 4.70 5.51.10-4 63 ATP Binding protein Leaf bronzing TBGI272458 6 2.99 7.46.10-4 52 Nuclear protein in pre-mRNA Relative root length TBGI427500 11 0.90 7.70.10-4 69 F-Box domain Field experiment Leaf bronzing id8001543 8 4.70 5.51.10-4 63 ATP Binding protein Leaf bronzing TBGU313277 7 0.47 1.62.10-4 68 Proline transporter Relative plant height id4010825 4 32.30 7.30.10-4 64 Unknown protein Leaf bronzing id1000223 1 4.21 2.28.10-4 66 Expressed protein Leaf bronzing TBGI132654 3 5.59 9.60.10-4 68 Unknown protein Note: a, Chromosome number, b,Position of SNP marker in the chromosome
Based on the significant SNPs markers, candidate gene (s) could predicted which may contribute to Fe toxicity tolerance. Predicting the candidate gene (s) were done based on MSU IPGRS v.6 genome browser (http://oryzasnp.plantbiology.msu.edu/) and the results was showed on Table 3. The identified genes were Heavy metal transport detoxification, ATP Binding protein, Nuclear protein in pre-mRNA, F-Box domain, Proline transporter, and others expressed protein. The predicted positions of SNPs were distributed in the chromosome 1, 3, 4, 6, 7 and 9 (Figure 6). Those markers also confirm with previous study using QTLs analysis.
Discussion Evaluation of rice genotypes against iron toxicity
provided an insight into the genotypic differences
associated with iron toxicity tolerance. Based on the analysis of study in greenhouse revealed that promising genotypes were Siam Saba, Cilamaya Muncul, Awan Kuning, B13144-1-MR-2, Margasari, Pokkali, Mahsuri, and Inpara 2 (Figure 2). The field experiment also indicated that the low-score LBS genotypes not always had high grain yield under normal condition, except for Inpara2, Cilamaya Muncul and Mahsuri. Those out yielded genotypes in normal condition mostly are improved rice varieties, which have been released and tested in many locations including in iron toxic sites. The genotypes have been described tolerance in one site did not always had same result in the other iron toxicity site due to complexes environmental condition, such as low pH, nutrient starvation (Yamauchi 1989) and others nutrient toxicity such as Al, Mn, and Cd (Shamshuddin et al. 2013;
B IODIVERSITAS 17 (2): 753-763, October 2016
760
Muhrizal et al. 2006). Breeding approaches to address iron toxicity are generally favor as they are high yield, tolerance to others biotic and abiotic stresses and accepted to farmer’s preferences. This finding also indicated that the improved grain yield through improvement of tolerance to iron toxicity still hampered.
The PCA plot (Figure 3) showed a clear separation of highly susceptible accessions (IR64 and Inpara 5) from tolerant genotypes suggesting efficiency of the screening procedure in discriminating between the tolerance and sensitive genotypes. This method also clearly separating the genotypes based on the biomass, yield and its components. The high yield with tolerance to normal reaction to iron excess were located in the PC3, while tolerant local genotypes were located in the PC4. The
position of iron concentration was in the upper-left quadrangle which was also near to tolerant genotypes like B13144 and Inpara2, meaning that the iron concentration relatively high in those genotypes. Meanwhile, in the opposite direction and farther from the iron concentration PC line was Pokkali, Mahsuri, Siam Saba, and Margasari. This result indicated that some tolerant genotypes able stored the iron in the shoot, while the others tolerance excluded on the root surface. Other researchers reported the total amount of Fe accumulated in aboveground plant parts was not always related to leaf-symptom scores (Onaga et al. 2013). While other reported that vigorous growth genotypes, Pokkali has ability to dilute iron in the shoot minimizing detrimental effect of excess iron (Engle et al. 2012b).
Figure 5. Manhattan plot, log P-values of leaf bronzing in greenhouse experiment are plotted against physical map position of SNPs (A) and Quartile-quartile plot (QQ plot) determines how marker-traits association in greenhouse results compare to the expected results.
TBG1380435
Id1000223
NUGRAHA et al. – Markers-traits association for iron toxicity
761
Choice of germplasm is critical to the success of association analysis (Flint-Garcia et al. 2003). Generally, plant populations amenable for association studies can be classified into five groups (Yu and Buckler 2006): (i) ideal sample with subtle population structure and familial relatedness, (ii) multi-family sample, (iii) sample with population structure, (iv) sample with both population structure and familial relationships, and (v) sample with severe population structure and familial relationships. In this study, we used 18 selected Indonesian rice genotypes, represented different features morphological as described in the PCA analysis both under greenhouse and field experiment to meet criteria plant populations above.
Seven characters were associated with the SNP markers (p<0.0001). Some of them over-lap with different markers for instance TBGI380435 and id8001543 SNPs over-lap
with leaf bronzing and relative shoot dry weight and id1000223 was over-lap in different set experiments for leaf bronzing character. In the Table 1 presents the result of the greenhouse experiment, which are tolerant genotypes with high relative shoot dry weight (e.g. Mahsuri, Siam Saba, Cilamaya, and B13144-1-MR-2). Relationship between leaf bronzing and relative shoot dry weight was also reported by (Onaga et al. 2013). This relationship was also confirmed with strong association with the same SNPs markers. The SNP marker, TBGI380435 which located in chromosome 9 at 14.45 Mbp was mapped on the same position of heavy metal transport detoxification (HTDT) gene based on MSU rice SNPs data based (www. h t t p : / / o r y z a s n p . p l a n t b i o l o g y . m s u . e d u / T I G R Pseudomolecules v5). High probability of this gene is described with Manhattan Plot and QQ Plot (Figure 5).
Figure 6. Co-localization analysis of markers-traits association reported in this study with previously reported QTLs for leaf bronzing under Fe toxic condition in rice. QTLs were located on chromosomes based on the physical positions of flanking markers. One quadrate (in blue or white) represents 1 Mb. Stars represent the QTLs mapped in this study and arrows represent the QTLs from other previous reports. LBS, leaf bronzing, SDW, shoot dry weight, DHA, dehydrate ascorbate activity, RDW, root dry weight, PDW, panicle dry weight, GCL, growth cycle length, FR, fertility. Note:
135 DH lines from Azucena/IR64 -nutrient solution, greenhouse at Zeijang, China (Wu et al. 1998) 96 BC1F9 lines from Nipponbare/Kasalath//Nipponbare - nutrient solution, greenhouse at Nanjing, China (Wan et al. 2003a) 66 CSSLs from Asominori/IR24 - nutrient solution, greenhouse at Nanjing, China, (Wan et al. 2003b) F3 lines from Gimbozu/Kasalath- nutrient solution, greenhouse at Tokyo, Japan, (Shimizu 2009) 164 RILs from Azucena/IR64 -fields, Burkina Faso (Dufey et al. 2012a) 164 RILs from Azucena/IR64 - nutrient solution, phytotron, (Dufey et al. 2009) 40 RILs from Azucena/IR64 - nutrient solution, greenhouse in Belgium (Dufey et al. 2012a) 220 BC3DH lines from interspecific cross MG12/Caiapo//Caiapo - nutrient solution, (Dufey et al. 2015). 121 RILs from IR29/Pokkali - nutrient solution, greenhouse (Wu et al. 2014)
Location of associated SNPs marker using 18 rice genotypes under hydroponic and field.
B IODIVERSITAS 17 (2): 753-763, October 2016
762
Previous study also reported some major QTL were located close to the HTDT position (Wan et al 2003a; Dufey et al 2012). The other gene that might be related to iron toxicity stress was proline transporter gene which was detected by SNPs marker TBGU313277 associated with leaf bronzing character in the field test experiment (Table 3). Majerus et al (2007) reported that high iron treatment causing significant decreasing water potential in the lamina and increasing of proline concentrations in the iron-sensitive but not affected in tolerant genotypes. This suggested that there was the inability of the roots from sensitive genotypes to perform osmotic adjustment while the tolerant genotypes perform more efficient using proline to adjust the water deficit disturbance.
The information about the underlying gene expression under iron toxicity is lacking comparing with iron deficiency-related genes (Ishimaru et al. 2006; Lee et al. 2009; Nozoye et al. 2011; Kobayashi et al. 2012). Ricachenevky et al (2010) reported using cDNA-RDA technique to isolate sequences up-regulated by Fe-excess in shoots of rice plants and found that OsWRKY80 was up-regulated by Fe excess. Majerus et al. (2009) reported using mRNA accumulation of OsFer1induced as early as 24 h after the beginning of the Fe treatment in sheaths. Stein et al (2009) found that excess iron treatment led to accumulate mRNA of OsFer2. A micro-array analysis was performed by Quinet et al. (2012) indicating differential gene regulation between short- and long-term responses to excess Fe, and between genes of the same family, highlighted the complexity of plant response and the multi-genic nature of this trait. Recently, Utami and Hanarida (2014) reported based on association analysis, among the three SNP markers, OsIRT1 was the most significant SNP marker (P value = 0.01) which correlated to Fe toxicity tolerant on vegetative stage. Hence, this study is the first report that the iron toxicity tolerance in rice was associated to HTDT gene with high (P < 0.0001).
The rest of the identified genes in this study were not been elucidated or related directly in the tolerance of iron toxicity (eg. ATP Binding protein, Nuclear protein in pre-mRNA, F-Box domain). However, the position of QTLs of iron toxicity tolerance which were reported previously was coincidently near to this trait-marker association study (Figure 6). SNP markers id1000223 was located in chromosome no 1 between 4 Mbp (Wan et al. 2003a) and 5 Mbp (Dufey et al. 2012). TBGI132654 was located on 5.59 Mbp near to QTLs reported by Dufey et al. (2012b). On the top of chromosome seven and eleven there were three markers related to some QTLs studies (Wu et al. 1998, Dufey et al. 2012a, Wu et al 2014) which were near to SNPs marker TBGU313277 and others QTLs studies (Shimizu 2009; Dufey et al. 2012) near to SNPs marker TBGI427500. Two marker of QTLs studies (Wan et al. 2003b; Dufey et al. 2012a) were closed with TBGI380435 on the chromosome no 9. This study was also related to the fact that the gene controlling to iron toxicity were very complexes involving multiple tolerance mechanism, for example excluder-type versus Includer-type (Engel et al 2012). A meta-analysis QTLs study involving 11 scientific journals identified more than 40 candidate genes based on
their known function distributed along all rice chromosomes using (Dufey et al. 2015). This study also supported with other reports there are multitude of small effect QTLs underlines the concept of multiple tolerance mechanisms. Furthermore, highlighting the positions of reliable QTLs and association mapping helping to narrow the target candidate regions for marker-assisted selection.
The authors deeply acknowledge to Mr. Subardi for technical assistant during field experiment in Taman Bogo Lampung and Miss Neng Nuraini for helping and assisting during molecular work in Indonesian Center for Biotechnology and Agricultural Genetic Resource Research and Development. This study was supported by grand from Indonesian Budget Implementation (DIPA) of Indonesian Agency for Agricultural Research and Development 2014/2015.
REFERENCES
Audebert A, Sahrawat KL. 2000. Mechanisms for iron toxicity tolerance in lowland rice. J Plant Nutr 23: 1877-1885.
Becker M, Asch F. 2005. Iron toxicity in rice—conditions and management concepts. J Plant Nutr Soil Sci 168: 558-573.
Bradbury PJ, Zhang Z, Kroon DE, Buckler ES. 2007. TASSEL: software for association mapping of complex traits in diverse samples. Bioinformatics 23: 2633-2635.
Dufey I, Anne-Sophie Mathieu, Draye X, Lutts S. 2015. Construction of an integrated map through comparative studies allows the identification of candidate regions for resistance to ferrous iron toxicity in rice. Euphytica 203: 59-69.
Dufey I, Hiel MP, Hakizimana P, Draye X, Lutts SK. 2012. Multi-environment QTL mapping and constency across environments of resistance mechanisms to ferrous iron toxicity in rice. Crop Sci. 52: 539-550..
Dufey I, Hakizimana P, Draye X, Lutts S, Bertin P. 2009. QTL mapping for biomass and physiological parameters linked to resistance mechanisms to ferrous iron toxicity in rice. Euphytica. 167: 143-160.
Dufey I, Hiel MP, Hakizimana P, Draye X, Lutts S K, B D, KN K and KA, Sie M BP. 2012a. Multi-environment QTL mapping and constency across environments of resistance mechanisms to ferrous iron toxicity in rice. Crop Sci 52: 539-550.
Dufey I 2012b. QTL mapping for resistance to ferrous iron toxicity in rice using an interspecific backcross Oryza sativa x Oryza glaberrima. [Ph.D. Dissertation]. Universite´ Catholique de Louvain, Belgium
Edwards D, Gupta P. 2013. Sequence based DNA markers and genotyping for cereal genomics and breeding. In: Cereal genomics II. Elsevier, The Nederland.
NUGRAHA et al. – Markers-traits association for iron toxicity
763
Engel K, Asch F and Becker M. 2012. Classification of rice genotypes based on their mechanisms of adaptation to iron toxicity. J Plant Nutr Soil Sci 175: 548-552.
Flint-Garcia SA, Thuillet AC, Yu JM, Pressoir G, Romero SM, Mitchell SE, Doebley J, Kresovich S, Goodman MM, Buckler ES. 2005. Maize association population, a high-resolution platform for quantitative trait locus dissection. Plant J 44: 1054-1064.
Gupta PK, Kulwal PL, Jaiswal V. 2014. Association Mapping in Crop Plants : Opportunities and Challenges. In: Advance in Genetics. Elsevier, The Nederland.
IRRI. 1996. Standard Evaluation System. 4th ed. Int Rice Res Inst, The Philippines.
Ishimaru Y, Suzuki M, Tsukamoto T, Suzuki K, Nakazono M, Kobayashi T, Wada Y, Watanabe S, Matsuhashi S, Takahashi M. 2006. Rice plants take up iron as an Fe3+ phytosiderophore and as Fe 2+. Plant J 45: 335-346.
Ismunadji. 1990. Alleviating iron toxicity in lowland rice. Indon Agric Res Dev J 12: 67-72.
Kobayashi T, Itai RN, Aung MS, Senoura T, Nakanishi H, Nishizawa NK. 2012. The rice transcription factor IDEF1 directly binds to iron and other divalent metals for sensing cellular iron status. Plant J 69: 81-91.
Lee S, Chiecko JC, Kim S, An G. 2009. Disruption of OsYSL15 leads to iron inefficiency in rice plants. Plant Physiol 150: 786-800.
Majerus V, Bertin P, Lutts S. 2007. Effects of iron toxicity on osmotic potential, osmolytes and polyamines concentrations in the African rice (Oryza glaberrima Steud.). Plant Sci 173: 96-105.
Majerus V, Bertin P, Lutts S. 2009. Abscisic acid and oxidative stress implications in overall ferritin synthesis by African rice (Oryza glaberrima Steud.) seedlings exposed to short term iron toxicity. Plant Soil (2009) 324: 253-365.
Muhrizal S, Shamshuddin JT, Fauziah I, Husni MAH. 2006. Changes in iron-poor acid sulfate soil upon submergence. Geoderma 131: 110-122.
Northon G, Aitkenhead M, Khowaja F, Price A. 2008. A bioinformatic and transcriptomic approach to identifying positional candidate genes without fine mapping: and example using rice root-growth QTLs. Genomics 92: 344-352.
Nozoye T, Nagasaka S, Kobayashi T, Nishizawa NK. 2011. Phytosiderophore efflux transporters are crucial for iron acquisition in graminaceous plants. J Biol Chem 286: 5446-5454.
Nugraha Y, Ardie SW, Suwarno S, Aswidinnoor H. 2016. Nutrient culture media with agar is effective for early- and rapid- screening of iron toxicity tolerant in rice. J Crop Sci Biotech 19 (1): 61-70.
Onaga G, Egdane J, Edema R, Abdelbagi I. 2013. Morphological and genetic diversity analysis of rice accessions (Oryza sativa L.) differing in iron toxicity tolerance. J Crop Sci Biotech 16: 53-62.
Ponnamperuma F, Bradfield R and Peech M. 1955. Physiological disease of rice attributable to iron toxicity. Nature 175: 265.
Prasetyo T, Ahmad F, Saidi A. 2013. Humic acid and water management to decrease ferro (Fe2+) solution and increase productivity of established new rice field. J Trop Soil 17: 9-17.
Quinet M, Vromman D, Clippe A, Lefèvre I. 2012. Combined transcriptomic and physiological approaches reveal strong differences between short- and long-term response of rice (Oryza sativa) to iron toxicity. Plant Cell Environ 35: 1837-1859.
Ramırez LM, Claassen N, Ubiera AA, Warner H, Moawad AM. 2002. Effect of phosphorus, potassium and zinc fertilizers on iron toxicity in wetland rice (Oryza sativa L.). Plant Soil 239: 197-206.
Ricachenevsky FK, Sperotto RA, Menguer PK, Fett JP. 2010. Identification of Fe-excess-induced genes in rice shoots reveals a WRKY transcription factor responsive to Fe, drought and senescence. Mol Biol Rep 37: 3735-45.
Sambrook J and Russell D. 2001. Molecular Cloning: A Laboratory Manual. 3rd ed. Cold Spring Harbor Laboratory Press, New York.
Shamshuddin J, Elisa AA, Ali M, Siti R, Fauziah IC. 2013. Rice defense mechanisms against the presence of excess amount of Al 3 + and Fe 2 + in the water. Aust J Crop Sci 7: 314-20.
Shimizu A. 2009. QTL analysis of genetic tolerance to iron toxicity in rice (Oryza sativa L.) by quantification of bronzing score. J New Seeds 10: 171-179.
Shimizu A, Guerta CQ, Glenn B. 2005. Improved mass screening of tolerance to iron Toxicity in rice by lowering temperature of culture solution. J Plant Nutr 28 (9): 1481-1493.
Stein RJ, Ricachenevsky FK, Fett JP. 2009. Differential regulation of the two rice ferritin genes (OsFER1 and OsFER2). Plant Sci 177: 563-569.
Suhartini T, Makarim MA. 2009. Selection technique for rice genotypes tolerant to iron toxicity. J Penelit Pertan Tanam Pang 28: 125-130.
Thomson MJ. 2014. High-throughput snp genotyping to accelerate crop improvement. Plant Breed. Biotech. 2 (3):195~212
Thomson MJ, Zhao K, Wright M, McNally K, Leung H, McCouch SR. 2011. Development and application of 96- and 384-plex single nucleotide polymorphism (SNP) marker sets for diversity analysis, mapping and marker-assisted selection in rice. Proceeding of Second Africa Rice Congress: Innovation and Partnerships to Realize Africa’s Rice Potential. Bamako, Mali, 22-26 March 2011.
Utami D, Rosdianti I, Lestari P, Satyawan D, Rijzaani H, Tasma IM. 2013. Development and application of 1536-plex single nucleotide polymorphism marker chip for genome wide scanning of indonesian rice germplasm. Indon J Agric Sci 14 (2): 71-78.
Utami DW, Somantri IH. 2014. Field Evaluation and Molecular Identification of Rice Germplasms for Fe Toxicity. J AgroBiogen 10: 9-17. [Indonesian]
Wan JL, Zhai HQ, Wan JM, Yasui H, Yoshimura A. 2003a. Mapping QTL for traits associated with resistance to ferrous iron toxicity in rice (Oryza sativa L.), using japonica chromosome segment substitution lines. Yi Chuan Xue Bao 30: 893-898.
Wan JJ, Zhai H, Wan JJ, Ikehashi H. 2003b. Detection and analysis of QTLs for ferrous iron toxicity tolerance in rice, Oryza sativa L. Euphytica 131: 201-206.
Wu P, Hu B, Liao CY, Zhu JM, Wu YR, Senadhira D, Paterson AH. 1998. Characterization of tissue tolerance to iron by molecular markers in different lines of rice. Plant Soil 203: 217-226.
Wu P, Luo A, Zhu J, Yang J, Huang N, Senadhira D. 1997. Molecular markers linked to genes underlying seedling tolerance for ferrous iron toxicity. Plant Soil 196: 317-320.
Wu L, Shhadi MY, Gregorio G, Matthus E, Becker M, Frei M. 2014. Genetic and physiological analysis of tolerance to acute iron toxicity in rice. Rice 7: 1-12.
Yamauchi M. 1989. Rice bronzing in Nigeria caused by nutrient imbalances and its control by potassium sulfate application. Plant Soil 117: 275-286.