1 Market Structure, Quality and Consumer Behavior: Exit, Voice and Loyalty Under Increasing Competition T. RANDOLPH BEARD Department of Economics Auburn University 415 W. Magnolia Auburn, AL 36849-5242 [email protected]JEFFREY T. MACHER McDonough School of Business Georgetown University Washington, DC 20057 202-687-4793 (O) [email protected]JOHN W. MAYO* McDonough School of Business Georgetown University Washington, DC 20057 202-687-6972 (O) [email protected]Abstract In this paper we propose a simple theoretical template that provides basic insights into the determinants of consumer decisions to complain, to switch, or to remain loyal to firms with whom they are dissatisfied. We show that, as a theoretical matter, the relationship between complaints and industry structure is ambiguous. We then utilize an extensive panel dataset to explore the empirical determinants of consumer complaining behavior in local exchange telephone service. The empirical results provide considerable support for the famous conjecture of Hirschman (1970) that complaints give way to switching as industries become more competitive. February 2012 * The authors gratefully acknowledge seminar participants at the 2010 Institutions and Innovation Conference at Harvard Business School and at Federal Communications Commission for helpful comments on an earlier version of this paper. We also are grateful for insights from Chris Borek, Silke Forbes, Brad Jensen, Stanley Nollen, Karok Ray, John Rust, Dennis Quinn, Rob Shapiro, Mike Stern, Scott Wallsten and Luke Wathieu. This research was supported in part from funding from The Georgetown Center for Business and Public Policy in the McDonough School of Business. Mayo is also grateful for support from the Institute for Business Innovation at the University of California, Berkeley. All errors are attributable solely to the authors.
Transcript
1
Market Structure, Quality and Consumer Behavior: Exit, Voice and Loyalty Under Increasing Competition
Abstract In this paper we propose a simple theoretical template that provides basic insights into the determinants of consumer decisions to complain, to switch, or to remain loyal to firms with whom they are dissatisfied. We show that, as a theoretical matter, the relationship between complaints and industry structure is ambiguous. We then utilize an extensive panel dataset to explore the empirical determinants of consumer complaining behavior in local exchange telephone service. The empirical results provide considerable support for the famous conjecture of Hirschman (1970) that complaints give way to switching as industries become more competitive.
February 2012
* The authors gratefully acknowledge seminar participants at the 2010 Institutions and Innovation Conference at
Harvard Business School and at Federal Communications Commission for helpful comments on an earlier version of this paper. We also are grateful for insights from Chris Borek, Silke Forbes, Brad Jensen, Stanley Nollen, Karok Ray, John Rust, Dennis Quinn, Rob Shapiro, Mike Stern, Scott Wallsten and Luke Wathieu. This research was supported in part from funding from The Georgetown Center for Business and Public Policy in the McDonough School of Business. Mayo is also grateful for support from the Institute for Business Innovation at the University of California, Berkeley. All errors are attributable solely to the authors.
2
Market Structure, Quality and Consumer Behavior: Exit, Voice and Loyalty Under Increasing Competition
[E]conomists have refused to consider that the discontented consumer might be anything but either dumbly faithful or outright traitorous (to the firm he used to do business with).
A.O. Hirschman, Exit, Voice and Loyalty (1970)
1 INTRODUCTION
The channel from market structure to firm and industry performance is among the most
studied in modern microeconomics. In this context, it is presumed that more (and especially,
highly) concentrated markets “almost always” exhibit higher prices. At the same time, the effect
of structural market characteristics on product quality is far less settled. And there are several
reasons for this. First, quality may not be apparent to buyers prior to use, so information (or the
lack thereof) can alter customer behavior. Moreover, the relationship of market structure to
product information availability is itself a complex problem. Second, “quality” is a multifaceted
concept, and goods can vary in in both horizontal and vertical quality dimensions. Third, cost or
scale effects in the provision of goods of different qualities can cause market structure to alter
cost conditions indirectly, as more concentrated markets may allow greater per firm outputs.
Fourth, in a dynamic context firms may look to their reputations, leading to a host of quality
investment incentives that are absent in a static context (Kranton, 2003). Even the simplest case
of a comparison of quality under monopoly and perfect competition under constant returns
creates ambiguity, as the result depends on the relationship between the average willingness to
pay for quality and the willingness of a marginal buyer (Tirole, 1994). In short, while theoretical
studies of market structure and quality have garnered attention, they have to this point produced
few general conclusions. Consequently, empirical analysis informed by theory may ultimately
produce the most reliable foundation for drawing conclusions regarding the market structure and
quality relationship.1
1 In this vein, see e.g., Goolsbee and Petrin (2004) and Chu (2010).
3
Yet while empirical analysis may provide a fruitful path, a close consideration of the
theoretical developments regarding the market structure-quality relationship reveals an under-
specification which, if more fully developed, holds promising insights. Specifically, existing
models recognize that firms that fail to offer an acceptable quality need to somehow bear the
consequences of this failure, and it is primarily through the actions of consumers that this is
supposed to occur. Formal models of the market structure-quality relationship, however, often
provide little specific focus on this mechanism and instead fashion consumers to react quite
simply to any alleged breach of equilibrium expectations by switching away from the offending
firm. This disciplining of firms by consumers is thought to be least effective under monopoly,
and presumably grows ever more potent as market structure atomizes. The salubrious story of
competitive markets thus rests largely on the ability and willingness of informed consumers to
take actions that discipline ill-behaving firms. If one firm’s price and/or quality are unattractive
relative to those of rival firms, consumers invoke their wrath by fleeing.
While the theoretical and empirical power of such consumer switching behavior (often
denoted as “exit”) has aptly received considerable scholarly attention (Farrell and Klemperer,
2007; Farrell and Shapiro, 1988) another mechanism by which consumers may express their
dissatisfaction with a firm’s price and/or quality is prominent in consumer behavior.
Specifically, when faced with unexpectedly low quality the vast majority of consumers often
engage in complaining behavior—most commonly to offending firms, but also frequently to
public oversight bodies. For example, the Federal Communications Commission (FCC) alone
received over 450,000 complaints between 2003 and 2006 (USGAO, 2008). Despite its
prevalence, this alternative mechanism by which consumers react to lower-than-expectation
quality has received considerably less economic scrutiny than switching behavior. This relative
inattention is partly practical in nature. While firms routinely receive and process consumer
complaints, the scrutiny and management of such complaint data are most often tightly-held
internal practices. Firms are simply not eager to “air their dirty laundry.” Consequently, the
ability of researchers to directly observe and study complaint data is limited.
In this paper, we seek to focus additional theoretical attention on the importance of the
complaint process as part of the portfolio of consumers’ reaction options to quality failures. In
doing so, we emphasize the role that market structure. As this is a complex problem, our goal is
limited to establishing basic facts and offering a simple methodology to consider complaint
4
behavior. We find that that complaints and product quality have—at least in principle—a
complicated relationship. Accordingly, we buttress our analysis with a fresh database that
features both detailed analysis of the evolving market structure in the local exchange telephone
industry in the United States and unique access to complaining behavior that is not typically
made public. We show that increased levels of competition result in decreased levels of
consumer complaints, a result in accord with both basic intuition and wishful thinking.
The rest of this paper is organized as follows. Section 2 frames the theoretical analysis by
providing background and reviewing the extant literature on the economic dimensions of
consumer complaint behavior. It then offers a relatively simple descriptive model of consumer
complaint behavior, in which complaining is taken to represent a response to dissatisfaction of an
intensity intermediate between “suffering in silence” and “exit” (i.e., consumer switching). We
begin by considering a model of consumer behavior in which service quality failures are
exogenously generated. This description highlights the fact that changes in market structure
generally result in changes in the frequencies of complaining and switching for several
intermingled reasons, and suggests it is difficult to claim a priori than one or another effect will
dominate. As a consequence, the relationship between market structure and complaints is
technically ambiguous, even if increases in competition lead to increased product quality. To
develop more specific insights, we then offer a simple oligopoly model that endogenizes the
quality decision by market participants. This generalization produces the results that quality
increases and price falls with decreasing market concentration.
Section 3 the turns to an econometric analysis based on wireline telephone competition in
the United States for which we gathered extensive firm-level complaint data collected by the
FCC over 1996-2006. These data are especially valuable, as this time period experienced large
market structure changes due to entry and consolidation among providers, triggered by the
Telecommunications Act of 1996. The empirical results indicate a strong market structure effect
on complaints, even after controlling for consumer quality perceptions. Section 4 offers
discussion, concluding comments and further research suggestions.
5
2 THEORY
2.1 Background and Extant Literature
A.O. Hirschman (1970) offers a seminal framework for understanding the role of exit,
voice and loyalty that has subsequently been applied in a number of contexts across the
economic, political science, management and marketing domains. At the most general level,
Hirschman (1970) seeks to explain the foundational determinants of when and why some
customers “exit” (i.e., switch), some express their “voice” (i.e., complain), and some maintain
“loyalty” (i.e., suffer in silence). The Hirschman framework has considerable intuitive and
general appeal for the study of complaining behavior and has been applied in many contexts,
including collective action (Pfaff and Kim, 2003), workforce makeup (Davis-Blake et al., 2003)
and job satisfaction (Rusbult et al., 1988; Withey and Cooper, 1989), among others.
While these and other studies have added considerably to understanding the factors that
drive consumer choice regarding exit, voice and loyalty, three shortcomings are readily apparent.
First, capturing the “voice” of dissatisfaction in a systematic way is often limited by an inability
to secure either cross-sectional or time series complaint data. While virtually all larger firms
collect such data, they are understandably reluctant to share it. Second, most empirical
examinations focus solely on individual consumer characteristics as relevant determinants of
complaint behavior, while neglecting other factors that potentially influence this relationship.2 In
particular, more is known about the characteristics of people who complain than the process that
generates complaints, and how this process relates to industry characteristics. Third, a central
proposition of the Hirschman framework has hitherto been largely ignored. Specifically, a
fundamental implication of Hirschman’s analysis is there is a relationship between the extent of
marketplace competition and how consumers express their dissatisfaction with a good or service.
In this regard, Hirschman (1970:33) indicates “[t]he voice option is the only way in which
dissatisfied customers or members can react whenever the exit option is unavailable…In the
economic sphere, the theoretical construct of pure monopoly would spell a no-exit situation, but
the mixture of monopolistic and competitive elements characteristic of most real market
situations should make it possible to observe the voice option in its interaction with the exit
option.”
2 For example, marketing research of consumer complaint behavior has principally focused on the role of
consumer characteristics on the propensity to complain. See Kolodinsky (1995) for a review.
6
Other research that examines complaints, but does not invoke the Hirschman framework
per se, either develops theoretical models or implements empirical approaches using primary
data. On the theoretical side, Gans (2002) develops a theoretical model of customer choice and
switching behavior in response to supplier quality variation. He finds that the number of
competitors increases customers’ abilities to switch suppliers in response to poor service, which
subsequently creates greater competitive pressures to improve current quality levels. As in
virtually all customer loyalty models, however, the theoretical framework is constrained by only
examining the “exit” and “loyalty” (but not “voice”) options. Given the prevalence of
complaining behavior by dissatisfied customers, we seek here to broaden this framework.
On the empirical side, Oster (1980) provides an early economic analysis of complaint
behavior, examining the determinants of consumer complaints filed with the New Haven,
Connecticut Better Business Bureau for a variety of different consumer products. The cross
sectional nature of the data, however, does not readily yield industry structure measures
associated with the products on which the complaints were received. Andreasen (1985) examines
consumers’ propensities to complain using patient survey data on “physician care” (judgmentally
chosen to represent a “loose monopoly”) at a single point in time. Absent both cross-sectional
and time-series industry structure variation, the paper considers only how individual consumers’
characteristics affect their propensity to complain. Forbes (2008) uses publicly-available U.S.
Department of Transportation (DoT) passenger complaint data on airline service (flight problems
or baggage handling), and examines the relationships between: (1) complaints and firm quality
and (2) complaints and the level of expected firm quality. Complaints increase with quality
decreases, but are also affected by consumer service expectations regarding quality. In short,
after controlling for actual service levels, the higher are consumer quality expectations the
greater the propensity for consumers to complain. While providing complementary empirical
complaint examinations, as well as novel insights into understanding changes in observed
complaints, none of the above studies considers explicitly the potentially important role of
industrial organization per the Hirschman hypothesis. It is to such an effort that we now turn.
2.2 Complaining Behavior, Market Structure and Exogenous Quality
Within the context of quality models, goods or services are generally considered to be of
two types. In the first type, consumers are able to observe ex ante the quality of the good or
service they are purchasing (i.e., search goods or services). In the second type, quality may only
7
be determined ex post—after purchase of the good or service (i.e., experience goods or services).
Models of search goods and services and experience goods and services provide a number of
insights into the incentives (or lack thereof) for firms to provide high quality, as well as the
regulatory or private incentive mechanisms that may be employed to promote high quality
offerings (Laffont and Tirole, 1993). But these models generally ignore the relative effects of
consumers’ abilities to complain or switch. We therefore examine this question with a simple
representation of an experience service in which consumers make an initial purchase decision
only to potentially discover ex post that the quality of the service purchased is lower than desired
(or expected).
Consider a market composed of a large number (N) of consumers, each of whom makes a
decision whether or not to purchase a given service. Consumption of the service provides
benefits that depend both on the consumer’s value or taste for the service (given by her type t)
and on the consumer’s actual consumption experience—which depends on how well the service
works and what actions or recourse the consumer (optimally) selects in response to a service
“failure.” We allow such service failures to be exogenously generated to start, but relax this
assumption in the next section. For simplicity, assume consumers have unit demands for the
service (so marginal quantity choice is not analyzed), and there is only a single outside,
composite service. We focus on the behavior of a typical or representative consumer.
Each consumer knows her type t, which is a random variable distributed with marginal
density f(t) and cumulative density F(t) on the interval [tL, tH]. We interpret t as the value that a
consumer attaches to consuming one unit of the service in question, for which she must pay a
price P. The consumer has income M, and utility from the composite good U(q) where q is the
quantity of the composite good consumed. Assume that U is increasing in the composite good q,
and that the price of the composite good is one dollar per unit. If a consumer purchases the
service, she obtains a value of t if the service “works”—an outcome that occurs with a known,
exogenous probability θ, where 0 < θ < 1. Thus, 1-θ represents the probability of service failure,
which (at this stage) we interpret as a binary event.3
3 Our model assumes implicitly that failure has the same effect on each consumer. In particular, failure deprives
consumers of some portion of the value of the service. As these values differ between types, the failure implications are not the same for everyone. An alternative model parameterization would allow for differing degrees of failure, but this would not materially affect the conclusions if the value of functional service was held equal between customers. It would be necessary, however, to re-specify the non-purchase condition.
8
If the service “fails,” then the consumer responds in one of three ways. First, the
consumer “remains loyal” (i.e., by doing nothing). Second, the consumer “complains” (e.g., by
filing a complaint with a public regulatory body). Third, the consumer “exits” (by switching to
an alternative vendor). The precise sequence of events in each of these options is not critical.
What matters instead is interpreting these actions as having payoffs that are related to consumer
types in a sensible way. These three options are thus better understood as shorthand
representations for various consumer responses that presumably incorporate sequential activity.
For example, a “loyal” consumer may engage in informal (low or no cost) complaining to
neighbors or co-workers. Similarly, a consumer who switches vendors might do so only at the
end of series of actions that begins with informal complaining, followed by formal complaining
(i.e., to public oversight bodies), studying market information, and so on. For simplicity, we
define a consumer’s utility V in the following simple forms:
(1) V U M – if the consumer does not buy the service;
(2) V t U M P – if the consumer buys the service, and the service
“works”;
(3) V d t U M P – if the consumer buys the service, the service fails,
and the consumer remains loyal;
(4) V b t U M P – if the consumer buys the service, the service fails,
and the consumer selects the voice or “complaint” response; and
(5) V a t U M P – if the consumer buys the service, the service fails,
and the consumer selects the exit or “switching” response.
We assume 1 > a > b > d > 0.4 Further, let c and s be the consumer’s costs of complaining and
switching, respectively, where we will assume s > c > 0. Thus, we depart slightly from
Hirschman’s (1970:40) original description that “voice tends to be costly in comparison to exit,”
and emphasize instead the often significant costs of switching (Farrell and Klemperer, 2007).
Combining both random values and random failure effects introduces substantial complexity without corresponding benefits in insight.
4 Our assumed ordering is predicated on two considerations. First, as a theoretical matter, a > b (in the presence of s >c) is required for switching behavior to be present at all. Second, the assumption generates the potential for an observed portfolio of consumer behaviors, consistent with our empirical observations. See Section 3 below.
9
The interpretations of these expressions are relatively straightforward. A consumer who
buys a service that “fails” (i.e., does not work to satisfaction) may respond in different ways,
with the optimal response depending on consumer type (or value of service). A consumer can
recapture part of the value attached to the service, although failure is always utility reducing:
t& , , .t U M P i t U M P i d b a We interpret consumer responses ordered by
their degree of “aggressiveness,” with “loyalty” considered the least aggressive, “complaint” the
next aggressive, and “exit” the most aggressive. While more aggressive responses are more
expensive (s > c > 0), they provide consumers with greater expected recovery (a > b > d) of
service value t. Consumers with greater service values may thus find it optimal to respond more
aggressively to service failure than consumers with lesser service values. It is this sorting that
makes our conceptualization informative empirically.
In our context, consumers who buy the service and are satisfied—or do not buy the
service—neither complain nor switch. For consumers who buy the service and experience a
“failure,” complaining is a means to an end. That is, we exclude the case of the rare individual
who enjoys complaining for its own sake.5 We instead argue that complaining is an action taken
to discipline firms—absent a service failure, no complaining occurs. Similarly, no independent
utility arises from switching. We instead argue that switching (and complaining) takes time, and
subsequently presents opportunity costs that reduce the value of the service obtained. In short,
complaining (voice) and switching (exit) both use up time and/or resources that could otherwise
be utilized obtaining value from the service. Further, consumers may experience “psychic” costs
from complaining or switching. We incorporate these factors into the “cost” parameters c and s.
From this basic setup, a consumer of type t will not buy the service whenever:
(6) 1 max , ,U M U M P t d t b t c a t s
so it is sufficient that U M t U M P . For a consumer who buys the service which
subsequently fails, her response is governed by her type and the values of the parameters a, b, d,
c, and s. A number of outcomes are possible, although we are guided in our specification by the
5 Some of our colleagues have suggested that the adjective “rare” is an overstatement. We choose not to explore
the pure consumption value of complaining behavior. We assume similarly that the benefits of complaining accrue solely to the complaining party. An interesting extension beyond the scope of the present model would relax this assumption to allow for the case in which complaining creates a potential positive externality on other consumers’ service quality.
10
simple observation that firms generally have some consumers who are satisfied, other consumers
who are quietly dissatisfied, other consumers who complain, and still other consumers who
switch. Because of the linearity of consumer type utilities, if a consumer of type t prefers to
utilize “voice” instead of “loyalty,” or “exit” instead of “voice,” then any consumer of higher
type would agree with this bilateral judgment. [In other words, preferences satisfy the “single
crossing” property.]
We thus complete our specification of restrictions on the value and cost parameters by
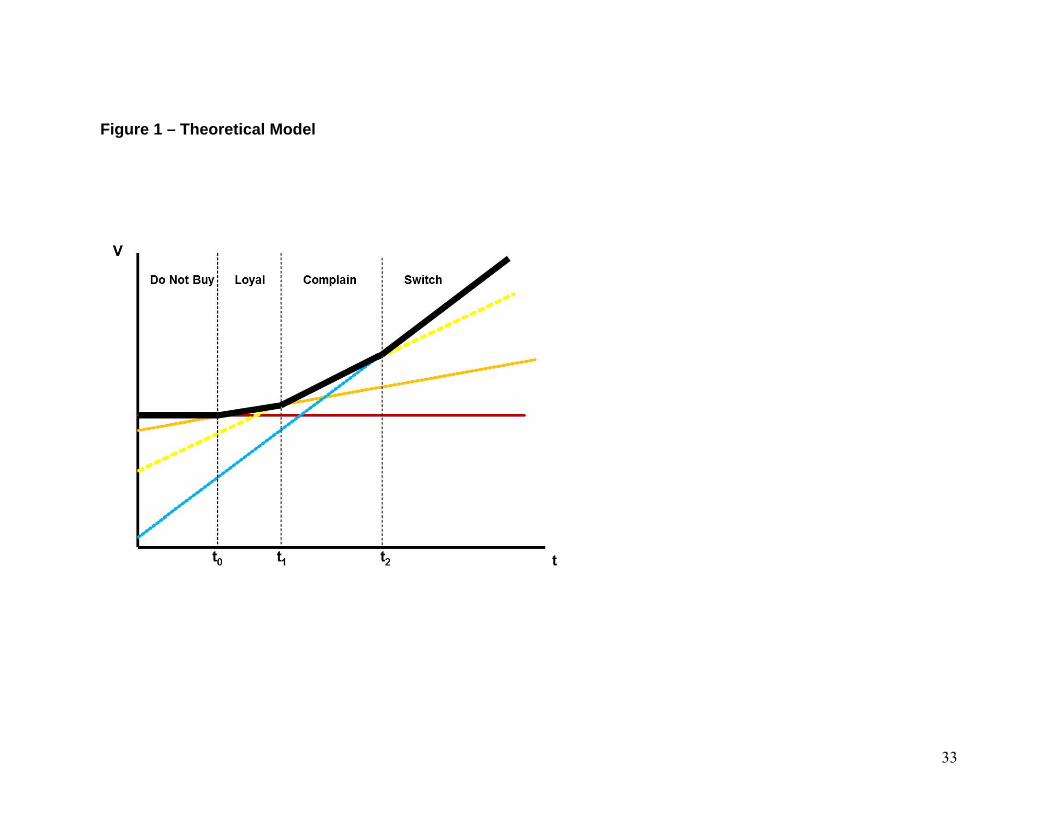
requiring that there exist values t0, t1 and t2, such that tL < t0 < t1 < t2 < tH and that: (1) consumers
with types below t0 do not buy; (2) consumers with types between t0 and t1 buy and do not
complain (i.e., remain loyal) even when failure occurs; (3) consumers with types between t1 and
t2 buy and complain if failure occurs; and (4) consumers with types above t2 buy and utilize exit
if failure occurs.
Of particular interest in the parameterization is the restriction that exit requires higher
type than voice. This restriction is equivalent to the requirement that a b s
b d c
, which has a
fairly natural interpretation. The expression (a-b) measures the additional proportion of value
captured by “exit” compared to “voice,” while the expression (b-d) makes the same comparison
for “voice” versus “loyalty.” Their ratio measures the relative additional gain from switching,
and must be compared to (and smaller than) the ratio of the direct cost of switching (s) to the cost
of complaints (c) (since we take the cost of remaining loyal to be zero). In other words, if
switching is cheap relative to complaining, then complaining would not be observed as
consumers would immediately transition from remaining loyal to switching. Only for certain
values of the cost and value parameters therefore would one observe the pattern of customer
responses that we suggest.
Figure 1 provides an illustration of our theoretical argument. We include three curves
corresponding to the utility obtained by different responses to failure, along with the “cut off”
minimal utility below which no service is purchased. Since the utilities are straight lines, their
upper envelope is always convex. We interpret complaining as a response to service failure lying
between “loyalty” (which as we have explained may be thought of as silent suffering or informal
zero-cost “grousing”) and “exit.” The particular intersection points for t0, t1 and t2 are defined by
the equations:
11
(7) 0
( ) ( )U M U M Pt
d
(8) 1
ct
b d
(9) 2
s ct
a b
Given these considerations, a simple representation of the extent of complaining and/or
switching behavior obtains, whereby magnitudes relate to levels of dissatisfaction. In any given
market, the numbers of customers falling into different categories by the theoretical frequencies
are as follows:
(10) Total customers = 01 ( )N F t
(11) Satisfied customers = 01 ( )N F t
(12) Dissatisfied customers = 01 1 ( )N F t
(13) “Loyal” customers = 01 ( )c
N F F td
(14) “Vocal” customers = 1s c c
N F Fa b d
(15) “Exiting” customers = 1 1s c
N Fa b
The effects of changes in underlying cost parameters, or in product quality θ, on the
theoretical frequencies are obtained directly. Our interest focuses mainly on complaints. It is
easy to see that the numbers of complaints rise as s rises, falls as c rises, and rises as (1 – θ) rises.
In particular, if we denote the number of vocal customers (those who are dissatisfied and adopt
the voice response) by π, then we obtain:
(16) 11 0
s cN f a b
s a b
(17) 11 0
s c cN f a b f
c a b d
12
(18) 0s c c
N F Fa b d
Similar expressions are available for all the other categories of customers. We are now able to
examine the probable effects of changes in competition on consumer complaint behavior. There
are two sorts of effects—ignoring the simple effect that arises from changes in the numbers of
customers firms have. The first effect arises merely from any change in (average) service quality
due to changes in competitive structure. As noted earlier, there is not a consensus on the
direction of this linkage, although in particular cases changes in competition are likely to have
relatively clear quality consequences. The second effect arises from changes in the proportions of
dissatisfied customers who select the voice (rather than the exit) option to express their
displeasure and seek a remedy. Even in a model with univariate consumer types and linear
utilities, if the change in market structure affects either (1) the costs of switching (relative to
voice), or (2) the costs of voicing complaints, then there will be a change in the proportions of
customers utilizing these modes of response. How these costs can be expected to change is itself
an open issue. As a first approximation, it is natural to think that increases in competition reduces
switching costs because of the increased likelihood of a “nearby” alternative vendor, combined
with the efforts of the firms themselves to make switching to their services easier. In contrast, the
presence of many sellers might imply greater likelihood of customers having incompatible
complementary goods, thereby raising the costs of switching. It seems inevitable that
circumstances will vary by industry.
The costs of voicing complaints, to which Hirschman attached great importance, may
also have a complicated relationship to changes in market structure. For example, while it is true
that voice is virtually the only recourse available under monopoly (as Hirschman noted), the case
of positive but limited competition is less clear. On the one hand, firms may not accommodate
complaints (thus making them costly) with little competition under the theory that switching is
unlikely. On the other hand, firms presumably recognize customers are highly profitable when
competition is weak, so losing one is to be avoided.
Finally, it is plausible as well that a change in market structure, at least within some
interval, may have no effect on the costs of switching or complaining, and that both costs are
largely internal to the customer but not the firms. If this condition is so, then we expect to see an
unambiguous and inverse relationship between product quality and the numbers of complaints.
13
By definition, this “neutrality” cannot extend to all markets forms from monopoly to perfect
competition, but such variation is not often seen as a practical matter.
It is therefore apparent that the competitive process adds complexity and idiosyncrasy to
the role of customer complaints. This effect is so because changes in the level of competition
might increase or (in less favorable cases) decrease product quality, leading to changes in
complaint flows. At the same time, changes in competition may alter the costs of voicing
complaints and/or switching.
2.3 Complaining Behavior, Market Structure and Endogenous Quality
To this point, we have taken quality to be exogenously given. We now relax this
constraint by considering a simple model of endogenous quality choice. In the case at hand, we
are particularly interested in a special ex post measure of quality—that of consumer complaints.
Consistent with the previous section, the linkage between quality and complaints occurs when
performance falls below some relevant expectation, which we have characterized as a service
“failure.” Such a failure can be occasioned by numerous performance dimensions, so in this
sense our analysis is sufficiently flexible to be consistent with a variety of specific empirical
specifications of product quality.6 We abstract from the internal components of product quality to
focus instead on their combined effect in producing dissatisfaction. Similarly, we do not envision
dynamic “reputation building” in which consumer experiences with sellers are noisy signals of
underlying quality (Hörner, 2002). Consumers who receive an unsatisfactory experience are
assumed, however, to impose an additional and potentially significant cost on the provider.
To begin, consider an n firm, one-shot oligopoly selling differentiated goods to atomistic
consumers. The offering of firm i is summarized by the duple (Pi, θi) where P is service price
and θ is service quality. We take θ to refer to the probability that a representative customer will
receive a satisfactory experience from the seller, where “satisfactory” means that they will
neither complain about service nor defect to another seller. Alternatively, one could take θ to
represent the probability that the service “works,” so perceived quality is a zero-one variable.7
6 See e.g., Mazzeo (2003) who adopts a specific ex post measure of quality (flight delays by commercial airlines),
and shows such delays are more common along routes with fewer competing carriers. 7 For example, in the context of telecommunications either the customer has or does not have a dial tone. In our
sense, the first case is satisfactory while the second is not.
14
The following flow chart illustrates the possible paths of customer experience in this simple
formulation:
θ Firm receives P
Customer buys from i
1-θ Firm receives P-S
The customer receives acceptable service with probability θ, in which case she pays her
bill. If service is unacceptable (probability 1-θ), the firm incurs a penalty (S) which reflects this
failure. The cost (S) can represent damage to reputation, retroactive service repair (to those who
remain with the provider), and so on, is introduced to provide the firm with a simple internal
incentive to provide good service. Note that the value of S is itself likely to be a function of the
resulting (steady-state) equilibrium. At this stage we ignore this complication but return to it
below.
Let qi be the number of subscribers/customers of firm i. Consumers are atomistic price
takers and do not behave strategically. Given this, the revenue of firm i is:
(19) 1i i iR P S q
Now consider a simple demand model which incorporates the relevant first-order effects of
interest. In particular, take qi to be:
(20) ii
i
PAq
n P
where α > 1 and P-i is the average (unweighted) price of other sellers. This represents a fairly
strong simplification because, inter alia, it implies that quality differences have no ex ante effect
on subscription levels for various sellers. This formulation is consistent, however, with the
assumption that consumers are unable to observe such differences ex ante. Moreover, the way
quality is specified in this analysis provides sellers with incentives to invest in quality, as the
“effective demand” of a firm (the demand which produces revenue P per unit) is i iP , which is
proportional to θ. In other words, the simplification does not imply that demand is invariant to
15
seller quality, but that demand is invariant to the quality of other firms. We return to this issue
below.8
Finally, we look at firm costs. Because of the way quality is specified, it is important to
introduce sufficient convexity in cost to force the model to produce credible solutions, such as
positive prices. Further, the implicit constraint on θ (i.e., 0 ≤ θ ≤ 1) need not be formally imposed
if costs are sufficiently convex in θ. Likewise, zero marginal costs at θ = 0 assures a positive θ
occur in equilibrium, so we can avoid the need to evaluate tedious corner conditions. Further, it
seems reasonable that the “quantity” which drives costs should be taken to be q·θ, as this
represents the total output of good quality service. There may of course be costs which are
caused by the quantity q alone which are presumably generated per account, independent of the
quality of the service given, but these are unimportant for the analysis. Taking the prices P to
refer to prices net of some constant per unit production costs c shared identically by all firms, we
take costs to be:
(21) 2
2i i i
cCOSTS q
where c > 0 can be made sufficiently large to assure that θ does not exceed one in equilibrium.
Now consider price and quality competition. Suppose there are n identical firms, each
simultaneously and noncooperatively selecting their price and quality levels. Price and quality
first order conditions for firm i that result (after some simplification) are given by:9
(22) 2. 1 1 0
. 0
i ii
i i
Si c
P
ii S c q
Suppose we have a symmetric game equilibrium. In this case, we have
* * *,i jP P P * * *i j and * * * .i j
Aq q q
n These results, combined with the first order
conditions and some algebra, yield the following market equilibrium conditions:
8 Note that our results, in a qualitative sense, also arise with various alternative demand forms, such as qi = (1/n)
– ln(Pi / P-i). ) 9 Note that under the usual conditions, firms’ payoffs are concave in (P, θ) for all positive prices and qualities
within the unit interval for the other firms.
16
(23)
*2
*
1.
1
.
n SS
A ci Pn S
cA c
n Sii
A c
The equilibrium conditions in equation (23) define a unique symmetric industry outcome
(P*,θ*) and help establish several results regarding the effects of competition (here represented
by the number of firms n) on prices and service quality. By implication, they also allow
reasonable conjectures on the relationship between competition and complaints. We review the
results implied by equation (23) first, and then describe why these (relatively sharp) findings
contrast with the generally ambiguous relationship between competition and product quality
suggested by the extant literature. We also argue that the approach taken here is reasonable,
given its focus on consumer complaints. The following Proposition summarizes the properties of
the model equilibrium:
PROPOSITION: Let (P*,θ*) be the common prices and product qualities for a symmetric equilibrium. Then the following properties obtain:
a. *
0n
– i.e., equilibrium quality rises with competition;
b. * * *
0; 0; 0c A S
– i.e., equilibrium quality falls with its unit
costs and market size, but rises as failure becomes more costly;
c. *
0P
n
– i.e., equilibrium price falls with competition;
d. *
0P
– i.e., equilibrium price falls as the goods become better
substitutes (individual demands are more elastic).
All of these properties are straightforward results of differentiating the closed form solutions.
The simple model presented here predicts an unambiguously positive theoretical relationship
between competition and product quality, while maintaining the excepted negative link between
competition and price. Yet even a casual review of the existing literature on competition and
endogenous product quality show that such a strong conclusion is not the rule. And there are
17
several reasons for this, as outlined in Section 1. The aspect of quality addressed here (i.e.,
consumer satisfaction) seems quite likely, however, to exhibit the predicted behavior with
respect to competition because of the linearity of revenue in “quality” and the convexity in
cost.10
Further, in the case of oligopoly the ordinary theoretical assumption—as illustrated in
spatial models of product differentiation—is that firms select qualities first and then engage in
price competition later (with quality then fixed). This assumption is certainly a plausible
description of many competitive interactions. And this view also has the convenient property that
firms do not optimize at any point over more than a single variable (i.e., price, or less commonly,
quantity). But such a view implicitly assumes that firms do nothing during the market period
except, for example, set price and sell goods of a given predetermined quality. In such a world,
complaints by consumers can have no role, and the firm cannot, in any event, do anything to
address them ex post. Yet, consumer dissatisfaction is precisely and only a phenomenon of the
market period during which buyers consume the offered services. The degree to which firms
respond is then contemporaneous with the period in which pricing decisions are made. Thus the
approach taken here—with quality and price simultaneously selected in oligopoly—appears to be
far more relevant to the phenomenon of consumer complaints (i.e. “voice”) than the sequential
story.
The model outlined here allows us to rationalize our definition of “quality” as
satisfaction, and suggest that satisfaction rates respond endogenously to market structure in a
manner roughly consistent with our conceptualization of consumer behavior with respect to
voice and switching. And despite the positive theoretical link between quality and competition
obtained here, the analysis does not imply a necessary positive relationship between market
structure and complaints. As indicated in the previous section, such a conclusion would
necessitate assumptions on the relative costs of complaining vis-à-vis switching in various
market structures. The relationship between voice and market competition thus remains a matter
for empirical evidence.
10 We ignore second order-type effects which are submerged under the “parameter” k.
18
3 EMPIRICAL ANALYSIS
3.1 Empirical Setting
Our empirical setting is the telecommunications sector—an industry that has experienced
significant change in its industrial organization over time. The industry began as a patent
monopoly in the late 1800s, but has evolved into a relatively competitive free-for-all today, as
scores of long-distance competitors, dozens of pre-paid calling card vendors, and an increasing
number of inter-modal carriers compete for the patronage of local exchange customers. As the
evolution of the telecommunications industry is described amply elsewhere (Cave et al., 2002),
we provide only a brief overview of industry structure and relevant policy developments here.
Following the expiration of Alexander Graham Bell’s telephone patents, a host of local
exchange telephone competitors entered the industry and began providing telephone service to
local communities. Around 1910, the industry consolidated substantially which eventually led to
monopoly provision of telephone service throughout the U.S. In 1934, the Federal
Communications Commission (FCC) was established to regulate interstate communications,
while state public utility commissions (PUCs) were established to regulate intrastate
communications. With the creation of the FCC, virtually every aspect related to the provision of
telephone services (and equipment) was regulated.
This end-to-end monopoly began to unravel in 1960s and 1970s—first, with the
competitive provision of customer premises equipment; and second, through the spread of
competition in long-distance services. The 1984 AT&T divestiture vertically bifurcated the
industry, ridding AT&T of its local exchange operating companies. But the divestiture more
importantly facilitated a flood of entry into the long-distance market, with competitive inroads
made by de novo firms offering high-capacity telecommunications services to businesses.
Residential local exchange telephone service, however, remained a monopoly.
The passage of the 1996 Telecommunications Act represented a watershed event, as it
sought to provide for a “pro-competitive, deregulatory” policy framework for all
telecommunications services, including local telephone service. The result of this change had a
profound impact on the industrial organization of the industry. Following the 1996
Telecommunications Act, scores of new local exchange competitors entered the market giving
residential consumers a choice in local exchange telephone service.
19
It is this change in industrial structure that provides an ideal setting in which to test the
relationship between consumer complaint behavior and the emergence of marketplace
competition. Moreover and as mentioned, the study of consumer complaint behavior is often
constrained by an inability to secure widespread complaint data. In the case of the telephone
industry, however, an important dimension of the activities of both federal and state regulatory
agencies is to receive and process consumer complaints regarding regulated services.
Accordingly, we are able to assemble comprehensive consumer complaint data from local
exchange telephone service providers operating in the U.S. over the 1996–2006 period.
3.2 Data and Variables
Our data are drawn from the Federal Communications Commission’s (FCC) Electronic
Automated Reporting Management Information System (ARMIS) Filing System, or EAFS.
Specifically, we use FCC Report 43-05 – Service Quality Report and FCC Report 43-06 –
Customer Satisfaction Report in our empirical analysis.11 Each report spans the years from 1996
to 2006 and contains data from U.S. local exchange telephone companies (LECs).12
FCC Report 43-05 includes data on complaints made by either residential or business
customers (both small and large) to state Public Utility Commissions (PUCs) and which are
ultimately recorded in the FCC’s ARMIS database. While complaints are made directly to the
FCC, they represent a very small fraction of the service, installation and back office complaints
received which is our main focus. We instead utilize the more granular data afforded in the
complaints made to local regulatory agencies. Once state regulatory agencies receive complaints,
they inform the relevant local exchange carrier so that any service issues may be resolved.
Complaints filed directly to telephone companies are not required to be reported by the ARMIS
instructions. LECs are, in turn, required to report these complaints in the ARMIS database
annually on or before April 01ST of each year.13 Our focus is on “Service Quality Complaints,”
11 These data are available directly on the FCC website. See http://fjallfoss.fcc.gov/eafs7/paper/43-
05/PaperReport05.cfm and http://fjallfoss.fcc.gov/eafs7/paper/43-06/PaperReport06.cfm in particular. 12 The FCC altered the categorization of local exchange competitors in 2007 that creates an incompatibility with
data collected over the 1996-2006 period. We accordingly focus on the decade following the passage of the Telecommunications Act of 1996.
13 See http://www.fcc.gov/wcb/filing.html#ARMIS.
20
which refer to complaints pertaining to service but not to complaints relating to billing, operator
service providers, or 900 and 976 numbers.14
FCC Report (43-05) separates complaints by residential and business users. Figure 2
displays reported residential and business complaints over 1996-2006, utilizing the publicly
available annual reports. This figure shows that reported residential complaints (more so) and
business complaints (less so) exhibit inverted U-shape patterns over the 1996-2006 period. This
figure also shows that reported residential consumer complaints considerably outpace reported
business complaints—a result not unsurprising given that markedly more residential than
business consumers.
Another FCC Report (43-06) includes data on customer satisfaction levels. Telephone
companies are required to report to the FCC the results of customer satisfaction surveys that are
conducted each year. Customer satisfaction is surveyed across residential and business (both
small and large) consumers based on customer service and business procedure related to
“Installations,” “Repairs,” and “Business Office.”
Finally, we also gather data on the number of local exchange competitors, utilizing the
FCC’s annual Local Competition Reports. These reports provide the number of competitive local
exchange carriers (CLECs) operating in each state and over time.15 Prior to 2005, the FCC
collected data from CLECs with at least ten thousand switched access lines in a particular state.
In 2005, all CLECs regardless of size were required to report these data.16 Figure 3 displays the
average number of CLECs (by state) in operation over the 1996-2006 period. Although this
figure represents an intra-state average, it illustrates nicely the increased number of competitors
over the sample period. We argue that these (de novo) LEC providers gave dissatisfied
consumers additional opportunities to switch from their previous (incumbent) LEC providers.17
Our dependent variable (COMPLAINTSijkt) is the natural logarithm of the number of
complaints received by firm i in state j during year t.18 Complaints are separately identified and
14 See “FCC Report 43-05–Report Definition” at
http://www.fcc.gov/wcb/armis/documents/2007PDFs/4305c07.pdf. 15 See http://www.fcc.gov/wcb/iatd/comp.html 16 We account for this change in our empirical estimation below. 17 Interestingly, from a peak of 181MM local access lines in 1999, incumbent LEC lines have fallen more than 23
percent to 138MM by 2006 (FCC, 2008). 18 We experimented with several alternative econometric specifications, but no substantive changes to the
empirical results reported below obtain.
21
measured for residential and small business customers. Consequently, we estimate the models
separately for thesedifferent customer groups. Our primary emphasis is how reported complaints
vary with industry structure, as competition arose in the telecommunications industry over the
1996-2006 period.
Our main independent variable is the natural logarithm of the number of firms
(COMPETITORSjt) providing service in state j during year t. Several other independent
variables (Xjit) are also included in the empirical estimation. To account for firm size in
complaint reporting, we include the natural logarithm of the number of residential (RES
LINESijt) or business (BUS LINESijt) lines in service by firm i in state j during year t,
appropriate to the econometric model of interest. This approach permits the data to dictate the
complaints-to-firm size relationship, rather than having it imposed as would occur by using
complaints per line as the dependent variable. To account for consumer satisfaction, we include
an aggregate measure of the percentage of residential and business consumers surveyed that
report satisfaction in installations (INSTALL SATISijt), repairs (REPAIR SATISijt) and business
office services (BUS OFFICE SATISijt), appropriate to the econometric model of interest. Each
measure is defined for firm i in state j in year t. The aggregate measure (AVG SATISijt)
represents an average of the three consumer satisfaction measures.19 To account for potential
endogeneity, we utilize a yearly time trend and a measure of state per capita income (PER
CAPITA INCOMEijt), which we discuss below.
For business consumers, we are able to more granularly control for the extent of
consumer satisfaction across businesses, and thus consider separately the percentage of satisfied
small business customers and large business customers from installations, repairs and business
office services in the business empirical estimation. We distinguish these variables by the
prefaces SB for small business and LB for large business. To account for the 2005 FCC change
to a more comprehensive reporting of competitors, we include a dummy variable (POST 2004t),
set equal to one for years 2005 and 2006 and zero otherwise.
Table 1 provides summary statistics of the dependent and independent variables for the
198 local exchange carriers in the sample. The average annual number of residential and
business consumer complaints over the 1996-2006 period are roughly 134 and 21, respectively.
19 We experimented with different permutations (e.g., total of the aggregate satisfaction measure as a robustness
check. The results are substantially invariant to those reported here.
22
As expected, these numbers indicate that residential consumer complaints are significantly more
prevalent than business complaints, but substantial heterogeneity is nevertheless observed for
each dependent variable. The number of CLECs in the average state is large (nearly 17), but also
demonstrates significant heterogeneity. Some states have no competitors while other states have
as many as 70 competitors. Finally, the consumer satisfaction measures for both residential
consumers and small and large business consumers demonstrate significant variability across
installations, repairs, and back office operations, as well as the aggregate measures that we use in
the empirical estimations.
Table 2 provides correlation statistics of the dependent and independent variables. Not
surprisingly, significant positive correlations obtain between residential and business complaints,
between residential and business lines, and between (residential and business) complaints and
(residential and business) lines. There are also moderate negative correlations between
(residential and business) complaints and (residential and business) consumer satisfaction related
to installations, repairs and back office operations. Finally, the number of competitors is
negatively correlated with both residential complaints and business complaints, although pair-
wise significance is achieved only for the latter.
3.3 Empirical Model and Results
Parallel with the development of the theoretical treatment of the complaint generation
process discussed in Sections 2.2 and 2.3, we examine the empirical relationship between
industrial structure and complaint propensities. At the most general level, we posit that:
(24) 0 1ijt jt j ijtijtCOMPLAINTS COMPETITORS X
Note that while the same model is specified for both the residential and small business
complaint-generation process, we do not necessarily expect that same complaint propensities
from these two customer types.20 First, the level of telecommunications services expenditures is
significantly higher for businesses than for residential consumers. Businesses typically require
more telephone lines than residential customers. And for equivalent (e.g., single line flat-rate)
service, rates charged to businesses are well in excess of those charged to residential
20 Telephone companies assign designated account managers who interact regularly with large businesses. This
creates an alternative pathway for large businesses to express any dissatisfaction regarding service quality. Accordingly, our focus here is on residential and small business customers.
23
consumers.21 Second, high call volumes may lead to more preferential treatment and more direct
channels (e.g., designated “account managers”) for business consumers in comparison to
residential consumers. In the event that telephone companies do curry the favor of business
customers more than residential consumers, businesses should be less prone to complain to a
public utility commission in the event of dissatisfaction in comparison to residential consumers.
Third, competition for residential consumers began only in the wake of the 1996
Telecommunications Act. Given their economic profile (higher net revenue to the telephone
provider) business customers attracted competitive attention even prior to 1996. In particular, the
availability of alternative firms to provide high-capacity lines to business began before the Act,
which created greater opportunities for the “exit” rather than “voice” option to these firms’
quality concerns.
In Section 2.2, our initial theoretical specification of consumers’ complaint propensities
was conditional on an exogenously determined service failure process. Consistent with this
specification, we first estimate our models under the assumption of an exogenously generated
customer satisfaction process using standard ordinary least squares methods.22 That is, the
consumer satisfaction variables in the respective econometric models are assumed exogenous.
Recall in Section 2.3, we relax the exogeneity assumption and instead allow for a more general
specification of the industrial structure, complaints and switching relationship. Thus, as in
Hörner (2002), Kranton (2003) and Levhari and Peles (1973) and our own theoretical treatment,
we allow specifically for service quality (here measured by customer satisfaction) to be
endogenously determined by market structure. That is, an instrumental variables approach (i.e.,
two stage least squares) (IV) is used to correct for potential endogeneity in the consumer
satisfaction variables that appear in the respective econometric models. We utilize a yearly time
trend and state per capita income as instruments in both the residential consumer and business
consumer complaint estimations.
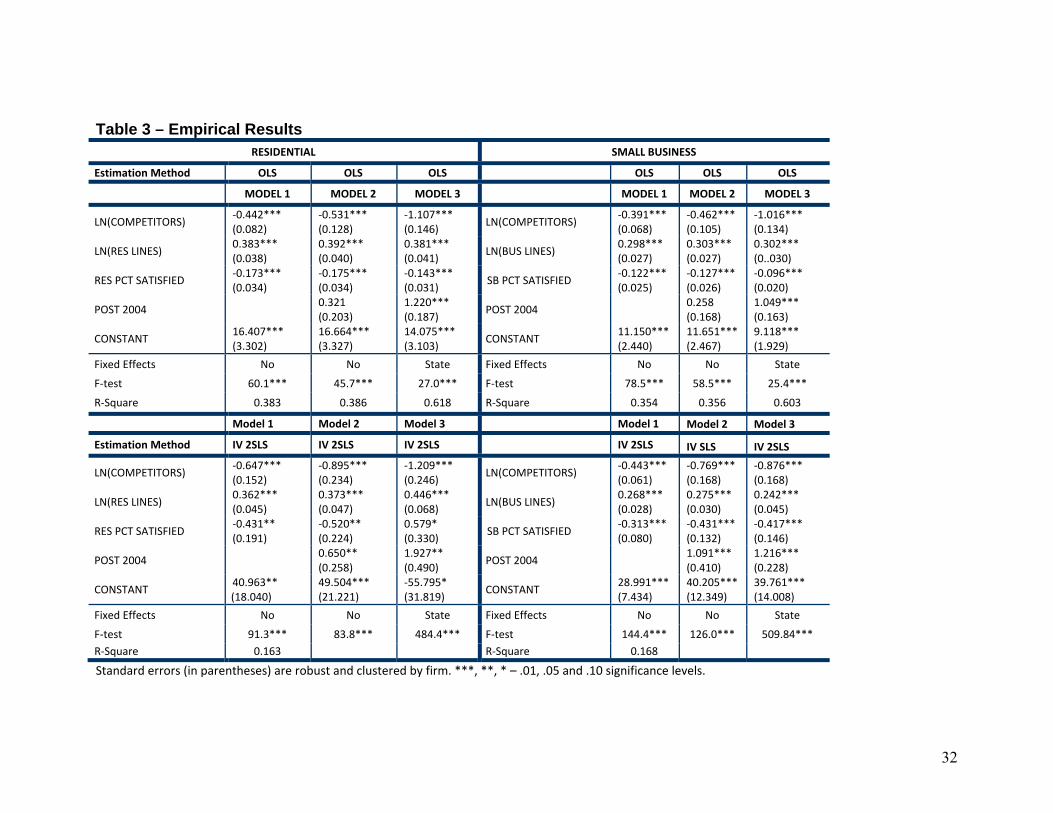
Table 3 reports the empirical results separately for residential consumers (left half) and
business consumers (right half) using OLS estimation (top half) and IV estimation (bottom half),
respectively. Model 1 provides a base estimation. Model 2 adds the temporal change in FCC
21 In 2005, the average flat-rate charge for monthly service for residential consumers was $24.74, while the rate
for the same service to a business consumer was $47.90. See, in particular, Tables 13.2 and 13.3 in FCC( 2007). 22 We estimated the residential and business models via seemingly unrelated regression (SUR) as a robustness
check. The results are inconsequentially different than those reported below.
24
accounting that occurred in 2005 to Model 1. Model 3 adds state-level fixed effects to Model 2.
Likelihood ratio tests confirm statistically significant explanatory power is added to the
residential and business econometric models from the inclusion of state fixed effects. The R2
statistics indicate that each model provides considerable explanatory power in both the
residential and business consumer estimations. Given the modeling approach and statistical
results that obtain, we focus our discussion on the Model 3 OLS and IV estimations.
While our principal focus is on the relationship of complaints and industrial structure, the
empirical results provide several interesting insights with respect to the other independent
variables. As expected, firm size is positively related to residential and business consumer
complaints. As proxied by installed lines, larger telephone providers incur more residential and
business consumer complaints (p < 0.01 in all estimations) than their smaller counterparts do.
The estimations reveal that the elasticity of complaints with respect to firm size is less than unity,
however, for both residential consumers (.38) and small business consumers (.30). Consistent
with previous research (e.g., Forbes, 2008), we generally find that higher consumer satisfaction
levels are associated with lower levels of complaints.23 This negative and statistically significant
result obtains for the OLS and IV business consumer estimations (p < 0.01 in both) and for the
OLS residential consumer estimation (p < 0.01), but reverses sign and loses some statistical
significance for the IV residential consumer estimation (p < 0.10). Finally, the comprehensive
reporting change made by the FCC post-2004 is positive and statistically significant (p < 0.05 in
all estimations).
In terms of our main consideration of the relationship of competition and complaints, the
individual parameter estimates are both consistent with the theoretical linkages discussed in
Section 2 and are highly statistically significant. In particular, across both residential and
business consumer estimations, increases in the number of competitors are associated with
reduced propensities to complain (p < 0.01 in all estimations). For the exogenous quality (OLS)
and endogenous quality (IV) estimations the elasticity of complaints with respect to changes in
competition is -1.1 and -1.2 respectively for residential customers. That is, a ten percent increase
in the number of local exchange competitors within a state (about 2 competitors when taken
23 In unreported regressions, we created a variable representing the summation of the percentage consumers
satisfied across the categories (installations, repairs and back office). Using this variable in place of the average consumer satisfaction variable, results in a positive and statistically significant coefficient estimate in both residential and business econometric models.
25
over the entire sample period) reduced residential complaints by 11-12 percent. Similarly,
increases in competition led to reductions in the complaints among small businesses with
elasticities of -1.0 for the exogenous quality (OLS) and -.88 for the endogenous quality (IV)
estimations.
Our consistent and strong evidence of a negative relationship between the number of
competitors and the propensity to complain to offending firms provides empirical insights into
the conceptual considerations offered in Section 2. While the estimations do not specifically
distinguish whether this reduction in the propensity to complain results in more consumers
moving into the “disgruntled but loyal” (loyal) or the “I am out of here” (exit) category, the logic
of our theory suggests that the emergence of competitive alternatives has reduced the costs
associated with switching, and thereby shrunk the category of “complainers” and expanded the
category of “switchers.” Telephone industry data support this general proposition, as incumbent
local exchange telephone companies’ residential and business lines declined by over 43 million
lines during the 2000-2006 period. This decline is widely attributed to a combination of
consumers switching to newly emergent competitive local exchange carriers, consumers
switching to wireless carriers, and consumer reductions in second lines (FCC, 2008).
3.4 DISCUSSION
While our theoretical model and empirical tests provide new linkages between industry
structure and consumer behavior, they also suggest the possibility of additional explorations.
Several potential refinements of the theoretical models are readily apparent and may yield
additional insights. For example, it seems plausible that as the intensity of competition increases,
the extent of internal complaint mechanisms utilized by firms will vary (Fornell and Wernerfelt,
1988). This effect might be best captured by making the “effectiveness” of informal complaints
(i.e., complaints to the firm rather than a public oversight body) a positive function of industry
fragmentation. In this case, a more sophisticated model that permits firms to manage or optimize
across public and private complaints may provide insights into detailed firm management of both
complaints and the complaint management process that are not considered here.
While we have focused on the relationship between complaints and market structure, our
empirical results convey a relationship between consumer satisfaction and complaint behavior
that is also worthy of additional consideration. While firms are ultimately interested in the level
26
of consumer satisfaction with their goods or services, the level of satisfaction (or dissatisfaction)
is often not directly observable—firms most typically simply observe that customers do or do not
complain. Our analysis, however, suggests that a considerable and varying slip may exist
between the “cup” of satisfaction and the “lip” of complaints. The simultaneous presence of
satisfaction and complaint data may consequently afford a more detailed investigation into this
relationship than has heretofore been possible.
Our empirical results similarly raise several managerial implications and public policy
considerations. Specifically, consider how individual firms assess data they receive from
complaining customers. While firms will be tempted to draw inferences regarding improved
customer service or quality from shorter queues of complaining customers, our results indicate
that such inferences may prove unwarranted. Indeed, for any given level of satisfaction, our
results point toward reduced propensities for consumers to complain as competition grows. That
is, customers are apt to move more quickly from “loyalty” to “exit,” bypassing “voice” as the
number of competitors increases. Firms with internal complaint mechanisms in place—but
without sophisticated customer retention metrics—simply cannot conclude that they are “doing
better” with their customers if complaints are falling.
In terms of public policy, we suggest that while monopolistic structures gave rise to the
establishment of public complaint mechanisms in telecommunications and other industries, the
emergence of competition in the telecommunications industry increasingly gives consumers’
“voice” greater than and quite apart from that which they can express to regulators. In particular,
more competition increasingly allows consumers to avoid the burdens of making complaints;
instead allowing them to rely upon the more market-based, and ultimate, punishment for ill-
behaving firms. In the face of such ultimate punishment, the merits of public complaint
mechanisms are likely to diminish.
Finally, while both our theoretical results and the corresponding empirical analysis seek
to advance our understanding of the market structure, quality and complaint relationships, the
generality of our results are worthy of additional exploration. Our theoretical results stem in part
from various simplifying assumptions, while our empirical results are set within a single
industry. Additional theoretical and empirical research may reinforce or provide detailed
insights into the robustness of our results.
27
4 CONCLUSION
In most markets, the principal vehicle for consumers to discipline ill-performing firms is
to switch to alternative providers of the good or service. Accordingly, considerable and
appropriate attention has been given in recent years to the magnitude of switching costs that
consumers face. To be sure, the ability of consumers to overcome any such switching costs is
seen as a key determinant affecting the market power that firms wield over an extant set of
customers. In this paper, we move both theoretically and empirically to a more granular
specification of consumer behavior in the face of alternative industrial structures. In particular,
we recognize that in the face of a “service failure” consumers may reveal any of several potential
behaviors. While consumers may choose to no longer buy the good or service, we focus on the
propensity and determinants of consumers to alternatively remain loyal, complain, or switch
providers. Among these, our model suggests that as industries become increasingly populated
with competitors, consumers will increasingly represent any dissatisfaction by exiting the
relationship rather than by complaining.
As a matter of practice, large scale studies of complaint behavior have been limited by
that fact that firms do not readily provide complaint data. For regulated industries, however, it is
often the case that one key function of regulatory oversight bodies is to receive and process
customer complaints and to adopt appropriate public policy responses to these complaints. By
drawing on a large-scale database of complaints recorded by the FCC regarding local exchange
telephone service in the U.S., we have been able to explore the relationship between complaints
and industry structure. The empirical analysis provides strong support for the basic proposition
that increases in the number of competitors leads to a reduced propensity to complain, while
simultaneously controlling for the existing level of customer dissatisfaction.
28
REFERENCES
Andreasen A.R. (1985). Consumer Responses to Dissatisfaction in Loose Monopolies. The Journal of Consumer Research, 12(2): 135-141.
Cave M., Vogelsang I., Majumdar S. The Handbook of Telecommunications Economics: Volume 1. North Holland - Elsevier Science: Amsterdam; 2002.
Chu, Chenghaun Sean “The Effect of Satellite Entry on Cable Television Prices and Product Quality,” RAND Journal of Economics, Vol. 41, Winter 2010, pp. 730-764.
Davis-Blake A., Broschak J.P., George E. (2003). Happy together? How using nonstandard workers affects exit, voice, and loyalty among standard employees. Academy of Management Journal, 46(4): 475-485
Duque L.C., Lado N. (2010). Cross-cultural comparisons of consumer satisfaction ratings :A perspective from Albert Hirschman's theory. International Marketing Review, 27(6): 676-693.
Farrell J., Klemperer P. 2007. Co-ordination and Lock-in: Competition with Switching Costs and Network Effects. In: Armstrong, M., Porter, R. (Eds), Handbook of Industrial Organization, vol. 3. Elsevier.
Farrell J., Shapiro C. (1988). Dynamic Competition with Switching Costs. RAND Journal of Economics, 19(1): 123-137.
FCC 2007. Trends in Telephone Service. Industry Analysis and Technology Division, Wireline Competition Bureau, Washington, DC.
FCC 2008. Trends in Telephone Service. Industry Analysis and Technology Division, Wireline Competition Bureau, Washington, DC.
Forbes S.J. (2008). The Effect of Service Quality and Expectations on Consumer Complaints. Journal of Industrial Economics, 56: 190-213.
Fornell C., Wernerfelt B. (1988). A Model for Customer Complaint Management. Marketing Science, 7: 287-298.
Gans N. (2002). Customer Loyalty and Supplier Quality Competition. Management Science, 48(2): 207-221.
Goolsbee, A. and Petrin, A. The Consumer Gains from Direct Broadcast Satellites and Competition with Cable TV. Econometrica, 72: March 2002: 351-381.
Hirschman A.O. Exit, Voice and Loyalty: Responses to Decline in Firms, Organizations, and States. Harvard University Press: Cambridge, MA; 1970.
Hörner J. (2002). Reputation and Competition. American Economic Review, 92: 644-663.
29
Humphrey R.H., Ashforth B.E. (2000). Buyer-supplier alliances in the automobile industry: How exit-voice strategies influence interpersonal relationships. Journal of Organizational Behavior, 21(6): 713-730.
Kolodinsky J. (1995). Usefulness of Economics and Explaining Consumer Complaints. Journal of Consumer Affairs, 29: 29-54.
Kranton R. (2003). Competition and the Incentive to Produce High Quality. Economica, 70: 385-401.
Laffont J., Tirole J. A Theory of Incentives in Procurement and Regulation. MIT Press: Cambridge, MA; 1993.
Lapre M.A., Tsikriktsis N. (2006). Organizational learning curves for customer dissatisfaction: Heterogeneity across airlines. Management Science, 52(3): 352-366.
Levhari D., Peles Y. (1973). Market Structure, Quality and Durability. Bell Journal of Economics, 4: 235-248.
Mazzeo M. (2003). Competition and Service Quality in the U.S. Airline Industry. Review of Industrial Organization, 22(4): 275-296.
Mellahi K., Budhwar P., Li B. (2010). A study of the relationship between exit, voice, loyalty and neglect and commitment in India. Human Relations, 63(3): 349-369.
Oster S. (1980). The Determinants of Consumer Complaints. Review of Economics and Statistics, 62(4): 603-609.
Pfaff S., Kim H. (2003). Exit-Voice Dynamics in Collective Action: An Analysis of Emigration and Protest in the East German Revolution. The American Journal of Sociology, 109(2): 401-444.
Rusbult C.E., Farrell D., Rogers G., Mainous A.G. (1988). Impact of Exchange Variables on Exit, Voice, Loyalty, and Neglect - an Integrative Model of Responses to Declining Job-Satisfaction. Academy of Management Journal, 31(3): 599-627.
Tirole J. The Theory of Industrial Organization. MIT Press: Cambridge, MA; 1994.
USGAO 2008. FCC Has Made Some Progress in the Management of its Enforcement Program but Faces Limitations, and Additional Actions are Needed. Report to the Chairman, Subcommittee on Telecommunications and the Internet, Committee on Energy and Commerce, House of Representatives.
Withey M.J., Cooper W.H. (1989). Predicting Exit, Voice, Loyalty, And Neglect. Administrative Science Quarterly, 34(4): 521-539.
30
Table 1 – Descriptive Statistics VARIABLE MEAN ST DEV MIN MAX
RES COMPLAINTS 134.13 431.42 0.00 9127.00 BUS COMPLAINTS 20.79 84.37 0.00 2451.00 RES LINES 552669.10 1509663.00 0.00 40200000.00 BUS LINES 271189.30 700414.80 0.00 7030147.00 PER CAPITA INCOME 29336.01 4985.16 17702.00 57746.00 COMPETITORS 16.99 15.80 0.00 70.00 RES INSTALL SATIS 93.83 4.28 20.00 100.00 RES REPAIR SATIS 88.62 5.45 66.15 100.00 RES BUS OFFICE SATIS 94.31 3.97 75.00 100.00 RES SATIS 92.25 3.46 65.00 100.00 SB INSTALL SATIS 90.31 5.51 0.00 100.00 SB REPAIR SATIS 90.42 4.48 69.57 100.00 SB BUS OFFICE SATIS 92.65 5.40 50.00 100.00 SB SATIS 91.13 3.56 66.67 100.00 LB INSTALL SATIS 95.52 9.03 0.00 100.00 LB REPAIR SATIS 95.52 8.81 0.00 100.00 LB BUS OFFICE SATIS 94.47 11.85 0.00 100.00 LB SATIS 95.17 7.57 33.33 100.00


![[PPT]Consumer Behavior and Marketing Strategy - Lars … to CB.ppt · Web viewIntro to Consumer Behavior Consumer behavior--what is it? Applications Consumer Behavior and Strategy](https://static.documents.pub/doc/80x56/5af357b67f8b9a74448b60fb/pptconsumer-behavior-and-marketing-strategy-lars-to-cbpptweb-viewintro.jpg)


