Math 355 - Old Tests and Quizzes from Fall 2011 Notes: This document has not been completely editted for errors. As I compiled things, I may have made some mistakes. I also may have some errors in the answers - most likely due to my poor typing. Please let me know about any issues that you find. If you need a document that is more perfect than what I have just described, do not read this one. Math 355 -Fall 2011 - Test #1 Show ALL your work. Incorrect Solutions with no work will receive NO credit. Neatness counts! Re- member to give all of your answers accurate to at least 4 significant digits. For the Multiple Choice problems : Select the answer which best completes the phrase. 1. (4 points) A study of UWSP students asked a random sample of university students living in the residence halls a few questions. The survey looked like this: (a) Gender (b) How many pairs of shoes do you have in your closet? (c) How many brothers do you have? Circle one (A) None (B) 0 (C) 1 (D) 2 (E) 3 or more (d) How many text messages did you send yesterday? For each question, circle whether it is quantitative or categorical. (a) Gender Quantitative Categorical (b) Pairs of Shoes Quantitative Categorical (c) Number of Brothers Quantitative Categorical (d) Text messages Quantitative Categorical 2. (3 points) The mean salary at Packer T-Shirts R Us was $23000 and the standard deviation was $4000. In order to keep all of the employees, everyone was give a $1000 raise. Which of the following is true. (a) The new average salary will be $23000 and the new standard deviation will be $5000. (b) The new average salary will be $23000 and the new standard deviation will be $4000. (c) The new average salary will be $24000 and the new standard deviation will be $5000. (d) The new average salary will be $24000 and the new standard deviation will be $4000. 3. (11 points) The following data are collected. -5 10 27 15 6 8 -8 (a) Find the mean of the data. (b) Find the median of the data. (c) The standard deviation of this data is closest to (A) -8 (B) 0 (C) 3.4 (D) 11.8 (E) 1243 4. (8 points - 2 points each) During the fall of 2006, Math 355 students visited 3 stores throughout the day. Each student purchased a cup of coffee and then we used a device to measure the pH of the coffee. The boxplots shown below summarize the pH of the coffees for the three stores that we visited. Based on the boxplots, fill in the following blanks with either • library • mcdonalds • starbucks • cannot be determined from the information given
Transcript
Math 355 - Old Tests and Quizzes from Fall 2011Notes: This document has not been completely editted for errors. As I compiled things, I may have
made some mistakes. I also may have some errors in the answers - most likely due to my poor typing.Please let me know about any issues that you find.
If you need a document that is more perfect than what I have just described, do not read this one.
Math 355 -Fall 2011 - Test #1
Show ALL your work. Incorrect Solutions with no work will receive NO credit. Neatness counts! Re-member to give all of your answers accurate to at least 4 significant digits. For the Multiple Choiceproblems : Select the answer which best completes the phrase.
1. (4 points) A study of UWSP students asked a random sample of university students living in theresidence halls a few questions. The survey looked like this:
(a) Gender
(b) How many pairs of shoes do you have in your closet?
(c) How many brothers do you have? Circle one (A) None (B) 0 (C) 1 (D) 2 (E) 3 or more
(d) How many text messages did you send yesterday?
For each question, circle whether it is quantitative or categorical.
(a) Gender Quantitative Categorical
(b) Pairs of Shoes Quantitative Categorical
(c) Number of Brothers Quantitative Categorical
(d) Text messages Quantitative Categorical
2. (3 points) The mean salary at Packer T-Shirts R Us was $23000 and the standard deviation was$4000. In order to keep all of the employees, everyone was give a $1000 raise. Which of the followingis true.
(a) The new average salary will be $23000 and the new standard deviation will be $5000.(b) The new average salary will be $23000 and the new standard deviation will be $4000.(c) The new average salary will be $24000 and the new standard deviation will be $5000.(d) The new average salary will be $24000 and the new standard deviation will be $4000.
3. (11 points) The following data are collected.-5 10 27 15 6 8 -8
(a) Find the mean of the data.(b) Find the median of the data.(c) The standard deviation of this data is closest to
(A) -8 (B) 0 (C) 3.4 (D) 11.8 (E) 1243
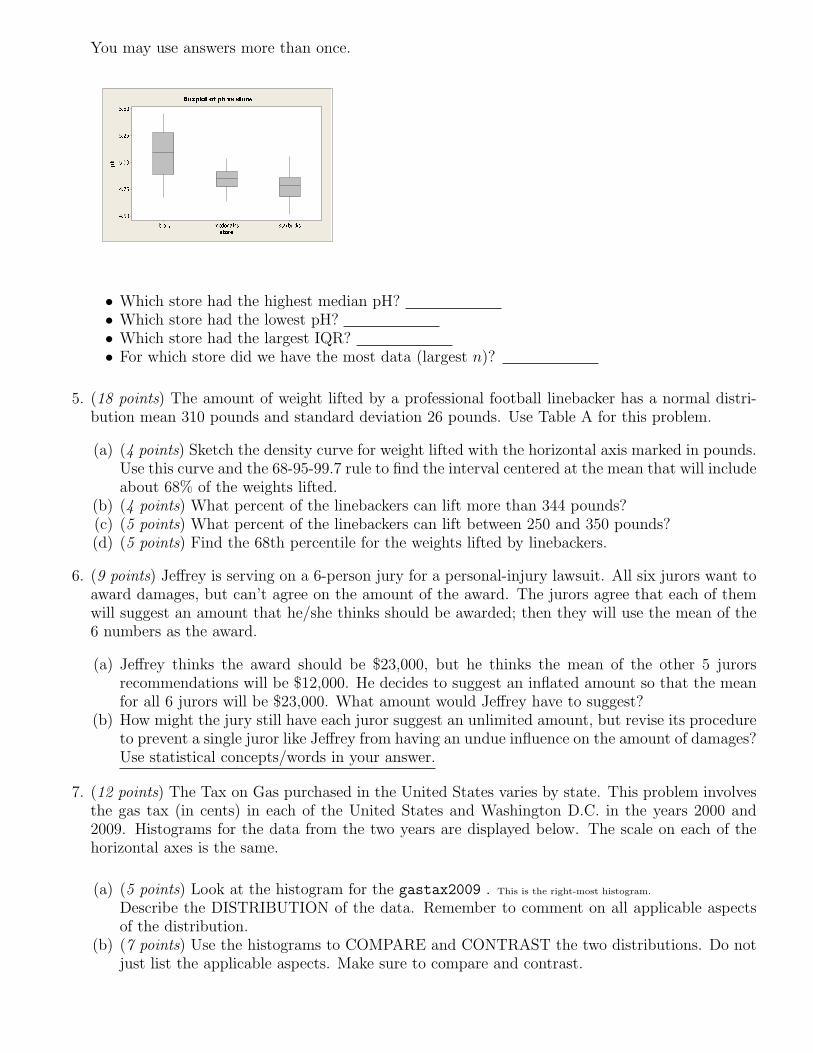
4. (8 points - 2 points each) During the fall of 2006, Math 355 students visited 3 stores throughoutthe day. Each student purchased a cup of coffee and then we used a device to measure the pH ofthe coffee. The boxplots shown below summarize the pH of the coffees for the three stores that wevisited. Based on the boxplots, fill in the following blanks with either
• library• mcdonalds• starbucks• cannot be determined from the information given
• Which store had the highest median pH?• Which store had the lowest pH?• Which store had the largest IQR?• For which store did we have the most data (largest n)?
5. (18 points) The amount of weight lifted by a professional football linebacker has a normal distri-bution mean 310 pounds and standard deviation 26 pounds. Use Table A for this problem.
(a) (4 points) Sketch the density curve for weight lifted with the horizontal axis marked in pounds.Use this curve and the 68-95-99.7 rule to find the interval centered at the mean that will includeabout 68% of the weights lifted.
(b) (4 points) What percent of the linebackers can lift more than 344 pounds?(c) (5 points) What percent of the linebackers can lift between 250 and 350 pounds?(d) (5 points) Find the 68th percentile for the weights lifted by linebackers.
6. (9 points) Jeffrey is serving on a 6-person jury for a personal-injury lawsuit. All six jurors want toaward damages, but can’t agree on the amount of the award. The jurors agree that each of themwill suggest an amount that he/she thinks should be awarded; then they will use the mean of the6 numbers as the award.
(a) Jeffrey thinks the award should be $23,000, but he thinks the mean of the other 5 jurorsrecommendations will be $12,000. He decides to suggest an inflated amount so that the meanfor all 6 jurors will be $23,000. What amount would Jeffrey have to suggest?
(b) How might the jury still have each juror suggest an unlimited amount, but revise its procedureto prevent a single juror like Jeffrey from having an undue influence on the amount of damages?Use statistical concepts/words in your answer.
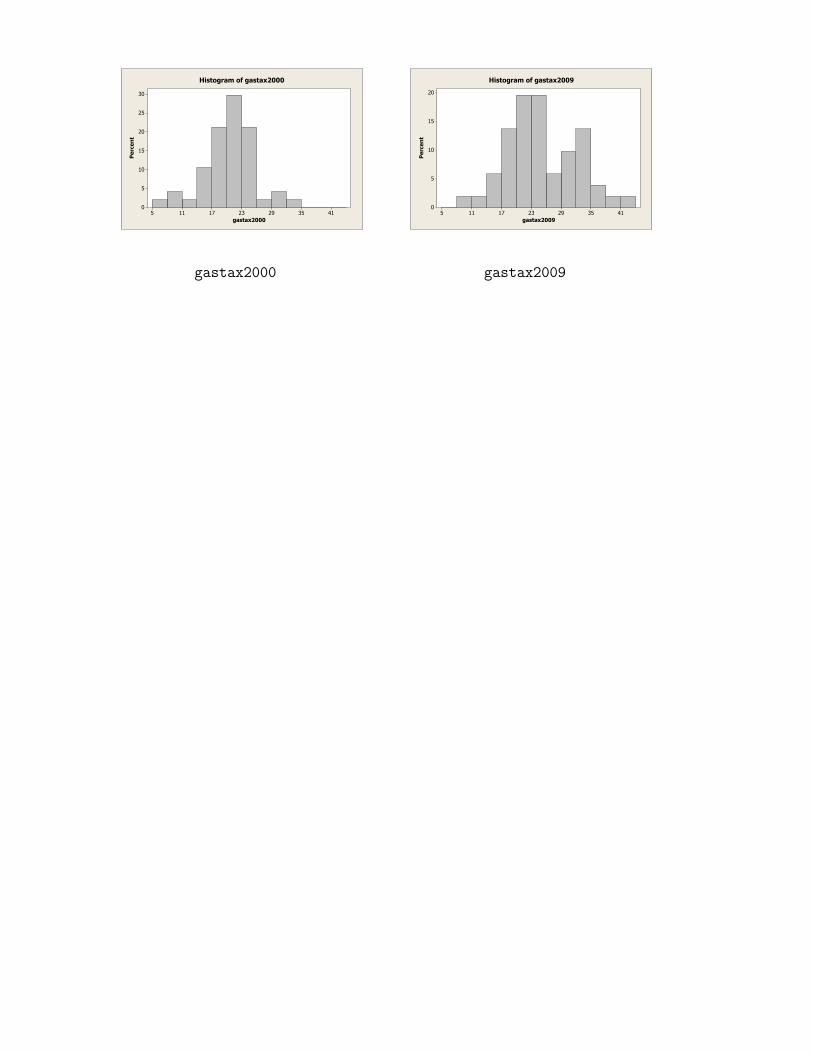
7. (12 points) The Tax on Gas purchased in the United States varies by state. This problem involvesthe gas tax (in cents) in each of the United States and Washington D.C. in the years 2000 and2009. Histograms for the data from the two years are displayed below. The scale on each of thehorizontal axes is the same.
(a) (5 points) Look at the histogram for the gastax2009 . This is the right-most histogram.
Describe the DISTRIBUTION of the data. Remember to comment on all applicable aspectsof the distribution.
(b) (7 points) Use the histograms to COMPARE and CONTRAST the two distributions. Do notjust list the applicable aspects. Make sure to compare and contrast.
4135292317115
30
25
20
15
10
5
0
gastax2000
Percent
Histogram of gastax2000
4135292317115
20
15
10
5
0
gastax2009
Percent
Histogram of gastax2009
gastax2000 gastax2009
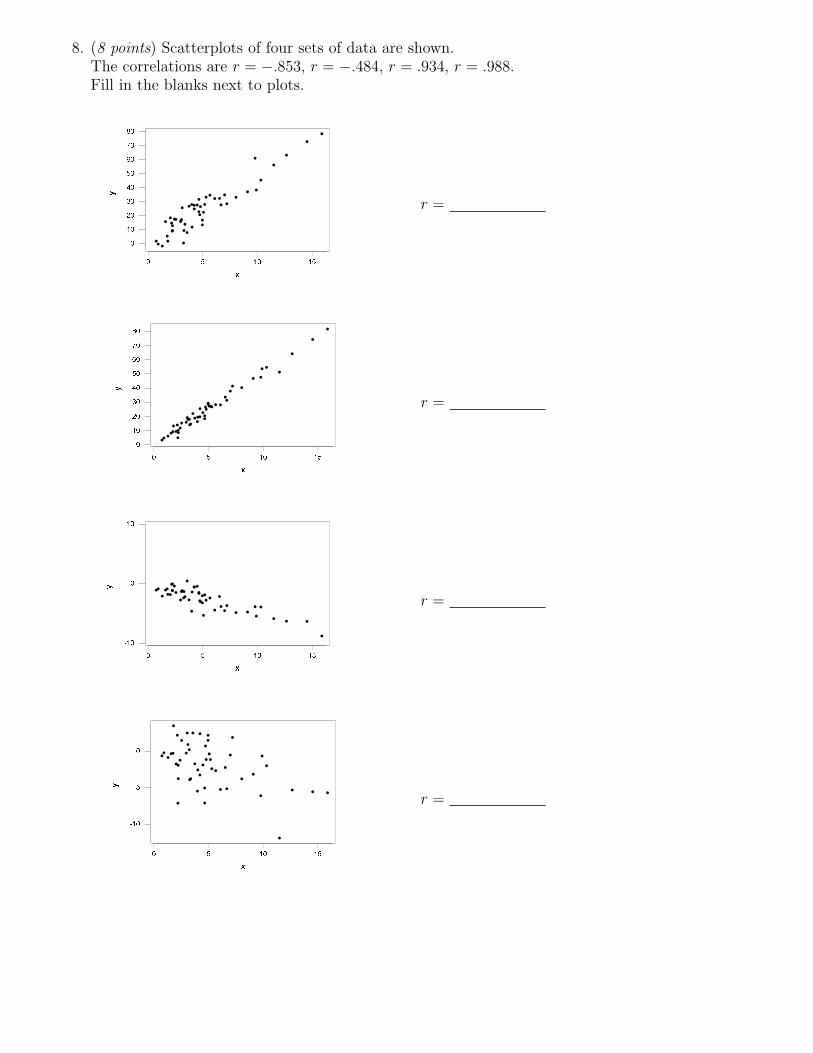
8. (8 points) Scatterplots of four sets of data are shown.The correlations are r = −.853, r = −.484, r = .934, r = .988.Fill in the blanks next to plots.
������
�����������������
[
\
r =
������
�����������������
[
\
r =
������
��
�
���
[
\
r =
������
�
��
���
[
\
r =
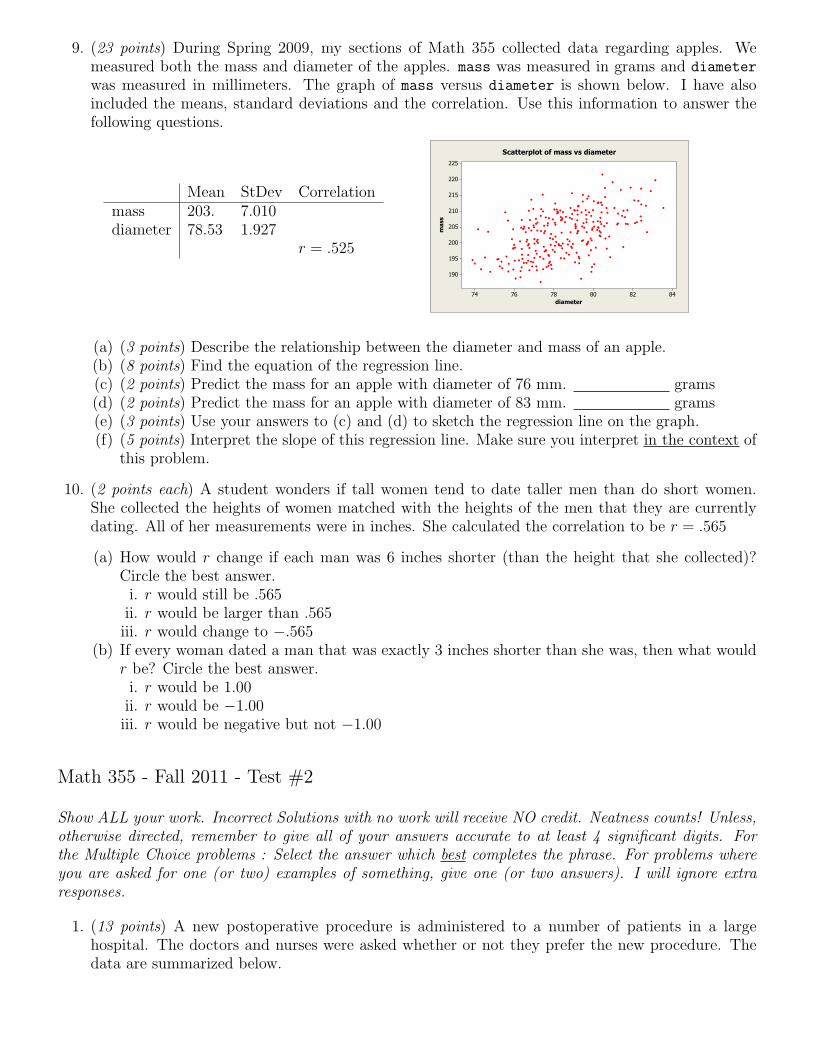
9. (23 points) During Spring 2009, my sections of Math 355 collected data regarding apples. Wemeasured both the mass and diameter of the apples. mass was measured in grams and diameter
was measured in millimeters. The graph of mass versus diameter is shown below. I have alsoincluded the means, standard deviations and the correlation. Use this information to answer thefollowing questions.
Mean StDev Correlationmass 203. 7.010diameter 78.53 1.927
r = .525
848280787674
225
220
215
210
205
200
195
190
diameter
mass
Scatterplot of mass vs diameter
(a) (3 points) Describe the relationship between the diameter and mass of an apple.(b) (8 points) Find the equation of the regression line.(c) (2 points) Predict the mass for an apple with diameter of 76 mm. grams(d) (2 points) Predict the mass for an apple with diameter of 83 mm. grams(e) (3 points) Use your answers to (c) and (d) to sketch the regression line on the graph.(f) (5 points) Interpret the slope of this regression line. Make sure you interpret in the context of
this problem.
10. (2 points each) A student wonders if tall women tend to date taller men than do short women.She collected the heights of women matched with the heights of the men that they are currentlydating. All of her measurements were in inches. She calculated the correlation to be r = .565
(a) How would r change if each man was 6 inches shorter (than the height that she collected)?Circle the best answer.i. r would still be .565ii. r would be larger than .565iii. r would change to −.565
(b) If every woman dated a man that was exactly 3 inches shorter than she was, then what wouldr be? Circle the best answer.i. r would be 1.00ii. r would be −1.00iii. r would be negative but not −1.00
Math 355 - Fall 2011 - Test #2
Show ALL your work. Incorrect Solutions with no work will receive NO credit. Neatness counts! Unless,otherwise directed, remember to give all of your answers accurate to at least 4 significant digits. Forthe Multiple Choice problems : Select the answer which best completes the phrase. For problems whereyou are asked for one (or two) examples of something, give one (or two answers). I will ignore extraresponses.
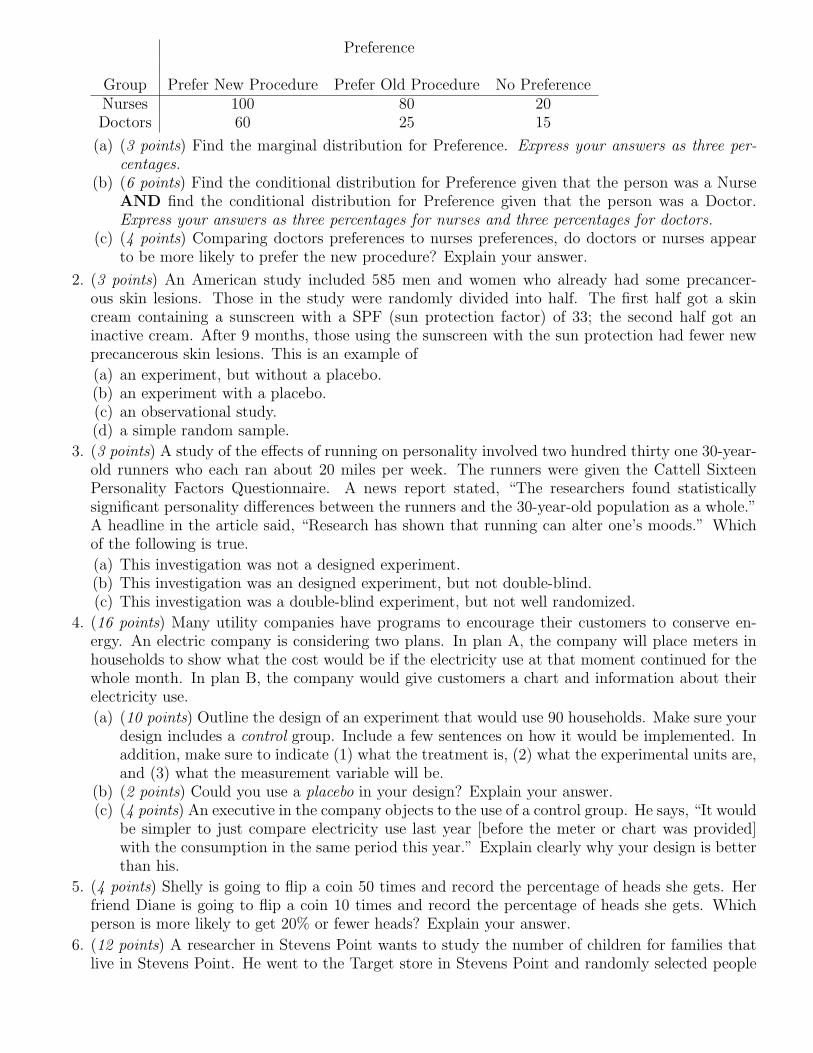
1. (13 points) A new postoperative procedure is administered to a number of patients in a largehospital. The doctors and nurses were asked whether or not they prefer the new procedure. Thedata are summarized below.
Preference
Group Prefer New Procedure Prefer Old Procedure No PreferenceNurses 100 80 20Doctors 60 25 15
(a) (3 points) Find the marginal distribution for Preference. Express your answers as three per-centages.
(b) (6 points) Find the conditional distribution for Preference given that the person was a NurseAND find the conditional distribution for Preference given that the person was a Doctor.Express your answers as three percentages for nurses and three percentages for doctors.
(c) (4 points) Comparing doctors preferences to nurses preferences, do doctors or nurses appearto be more likely to prefer the new procedure? Explain your answer.
2. (3 points) An American study included 585 men and women who already had some precancer-ous skin lesions. Those in the study were randomly divided into half. The first half got a skincream containing a sunscreen with a SPF (sun protection factor) of 33; the second half got aninactive cream. After 9 months, those using the sunscreen with the sun protection had fewer newprecancerous skin lesions. This is an example of
(a) an experiment, but without a placebo.(b) an experiment with a placebo.(c) an observational study.(d) a simple random sample.
3. (3 points) A study of the effects of running on personality involved two hundred thirty one 30-year-old runners who each ran about 20 miles per week. The runners were given the Cattell SixteenPersonality Factors Questionnaire. A news report stated, “The researchers found statisticallysignificant personality differences between the runners and the 30-year-old population as a whole.”A headline in the article said, “Research has shown that running can alter one’s moods.” Whichof the following is true.
(a) This investigation was not a designed experiment.(b) This investigation was an designed experiment, but not double-blind.(c) This investigation was a double-blind experiment, but not well randomized.
4. (16 points) Many utility companies have programs to encourage their customers to conserve en-ergy. An electric company is considering two plans. In plan A, the company will place meters inhouseholds to show what the cost would be if the electricity use at that moment continued for thewhole month. In plan B, the company would give customers a chart and information about theirelectricity use.
(a) (10 points) Outline the design of an experiment that would use 90 households. Make sure yourdesign includes a control group. Include a few sentences on how it would be implemented. Inaddition, make sure to indicate (1) what the treatment is, (2) what the experimental units are,and (3) what the measurement variable will be.
(b) (2 points) Could you use a placebo in your design? Explain your answer.(c) (4 points) An executive in the company objects to the use of a control group. He says, “It would
be simpler to just compare electricity use last year [before the meter or chart was provided]with the consumption in the same period this year.” Explain clearly why your design is betterthan his.
5. (4 points) Shelly is going to flip a coin 50 times and record the percentage of heads she gets. Herfriend Diane is going to flip a coin 10 times and record the percentage of heads she gets. Whichperson is more likely to get 20% or fewer heads? Explain your answer.
6. (12 points) A researcher in Stevens Point wants to study the number of children for families thatlive in Stevens Point. He went to the Target store in Stevens Point and randomly selected people
as they were going into the store. He asked each person, how many children they had. After threedays of study, he had talked with 100 people and the average was 3.7 children.
(a) (1 point) What is the population in this study? Be specific(b) (1 point) What is the sample? Be specific.(c) (2 point) Give one source of bias. Explain your answer.(d) (8 points) Clearly, this data collection would be better with more data. Limiting yourself to a
sample size of 100, give one way in which you could improve the design of the data collectiondescribed. Your improvement should address the bias that you identified above. Explain youranswer.
7. (3 points) Event A has probability 0.4. Event B has probability 0.5. If A and B are disjoint thenthe probability that both events occur is
(a) 0(b) .02(c) .1(d) 0.2(e) 0.9
8. (15 points) I toss a coin and roll a dice (six-sided). I record the coin and dice outcomes in order.For example, H˙ means that the coin toss was heads and the dice was a ˙.
(a) (5 points) Write down the sample space.
S =
{ }(b) (5 points) Using the sample space in part (a), specify ONE example of two events A and B
which are disjoint. You may either describe the events in words or as a set of outcomes.
A =
B =
(c) (5 points) Using the sample space in part (a), specify ONE example of two events C and Dwhich are independent. You may either describe the events in words or as a set of outcomes.
C =
D =
9. (11 points) A diagnostic test for strep throat has a probability of .007 of producing a false positive.That is, when a person free of the strep virus is tested, the test has a probability of .007 of falselyindicating that the virus is present. Assume that the results of individual tests are independent.
(a) (2 points) If a person is free of the strep virus, what is the probability that the diagnostic testwould produce a true negative (a correct test result).
(b) (9 points) If the 106 employees of a medical clinic are tested and all 106 are free of the strepvirus, what is the probability that at least one false positive will occur?
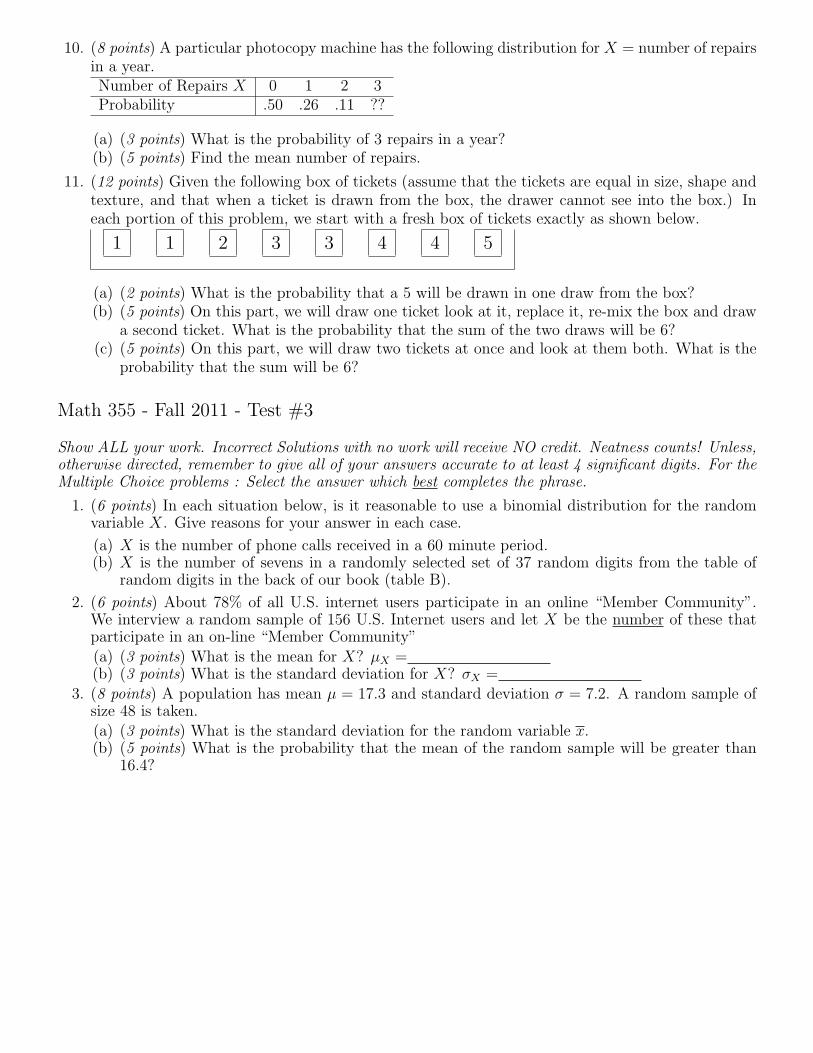
10. (8 points) A particular photocopy machine has the following distribution for X = number of repairsin a year.Number of Repairs X 0 1 2 3Probability .50 .26 .11 ??
(a) (3 points) What is the probability of 3 repairs in a year?(b) (5 points) Find the mean number of repairs.
11. (12 points) Given the following box of tickets (assume that the tickets are equal in size, shape andtexture, and that when a ticket is drawn from the box, the drawer cannot see into the box.) Ineach portion of this problem, we start with a fresh box of tickets exactly as shown below.
1 1 2 3 3 4 4 5
(a) (2 points) What is the probability that a 5 will be drawn in one draw from the box?(b) (5 points) On this part, we will draw one ticket look at it, replace it, re-mix the box and draw
a second ticket. What is the probability that the sum of the two draws will be 6?(c) (5 points) On this part, we will draw two tickets at once and look at them both. What is the
probability that the sum will be 6?
Math 355 - Fall 2011 - Test #3
Show ALL your work. Incorrect Solutions with no work will receive NO credit. Neatness counts! Unless,otherwise directed, remember to give all of your answers accurate to at least 4 significant digits. For theMultiple Choice problems : Select the answer which best completes the phrase.
1. (6 points) In each situation below, is it reasonable to use a binomial distribution for the randomvariable X. Give reasons for your answer in each case.
(a) X is the number of phone calls received in a 60 minute period.(b) X is the number of sevens in a randomly selected set of 37 random digits from the table of
random digits in the back of our book (table B).
2. (6 points) About 78% of all U.S. internet users participate in an online “Member Community”.We interview a random sample of 156 U.S. Internet users and let X be the number of these thatparticipate in an on-line “Member Community”(a) (3 points) What is the mean for X? µX =(b) (3 points) What is the standard deviation for X? σX =
3. (8 points) A population has mean µ = 17.3 and standard deviation σ = 7.2. A random sample ofsize 48 is taken.(a) (3 points) What is the standard deviation for the random variable x.(b) (5 points) What is the probability that the mean of the random sample will be greater than
16.4?
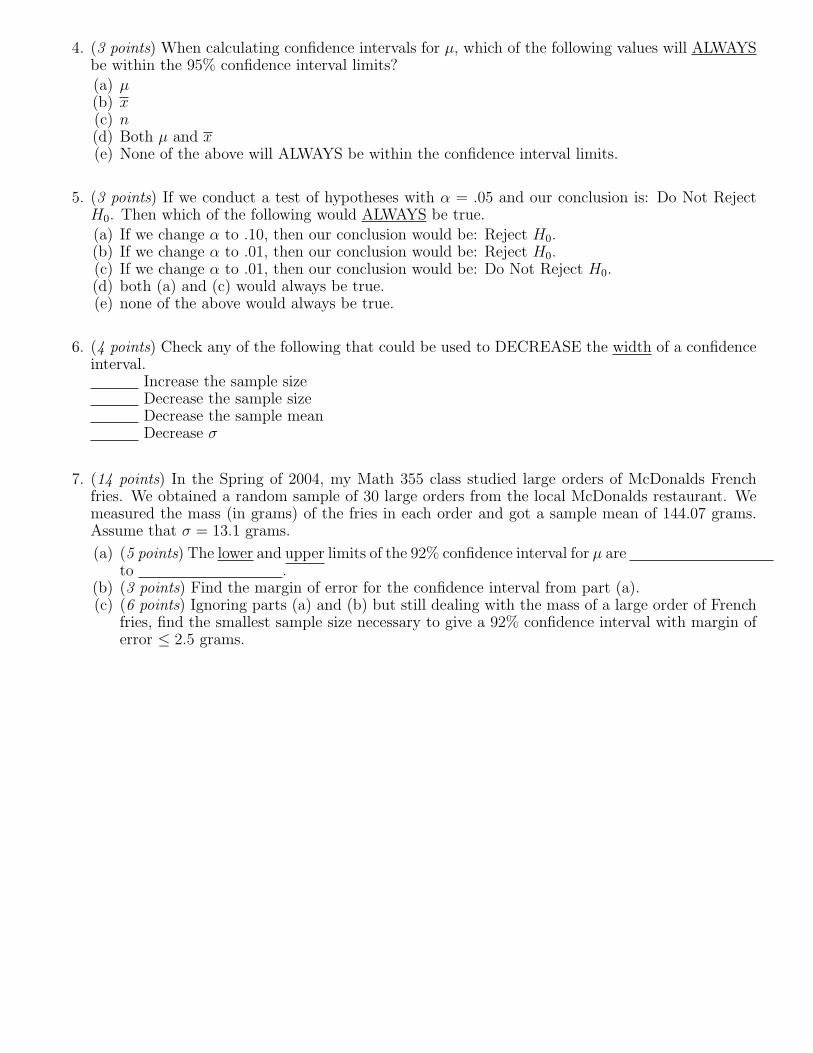
4. (3 points) When calculating confidence intervals for µ, which of the following values will ALWAYSbe within the 95% confidence interval limits?(a) µ(b) x(c) n(d) Both µ and x(e) None of the above will ALWAYS be within the confidence interval limits.
5. (3 points) If we conduct a test of hypotheses with α = .05 and our conclusion is: Do Not RejectH0. Then which of the following would ALWAYS be true.(a) If we change α to .10, then our conclusion would be: Reject H0.(b) If we change α to .01, then our conclusion would be: Reject H0.(c) If we change α to .01, then our conclusion would be: Do Not Reject H0.(d) both (a) and (c) would always be true.(e) none of the above would always be true.
6. (4 points) Check any of the following that could be used to DECREASE the width of a confidenceinterval.
Increase the sample sizeDecrease the sample sizeDecrease the sample meanDecrease σ
7. (14 points) In the Spring of 2004, my Math 355 class studied large orders of McDonalds Frenchfries. We obtained a random sample of 30 large orders from the local McDonalds restaurant. Wemeasured the mass (in grams) of the fries in each order and got a sample mean of 144.07 grams.Assume that σ = 13.1 grams.
(a) (5 points) The lower and upper limits of the 92% confidence interval for µ areto .
(b) (3 points) Find the margin of error for the confidence interval from part (a).(c) (6 points) Ignoring parts (a) and (b) but still dealing with the mass of a large order of French
fries, find the smallest sample size necessary to give a 92% confidence interval with margin oferror ≤ 2.5 grams.
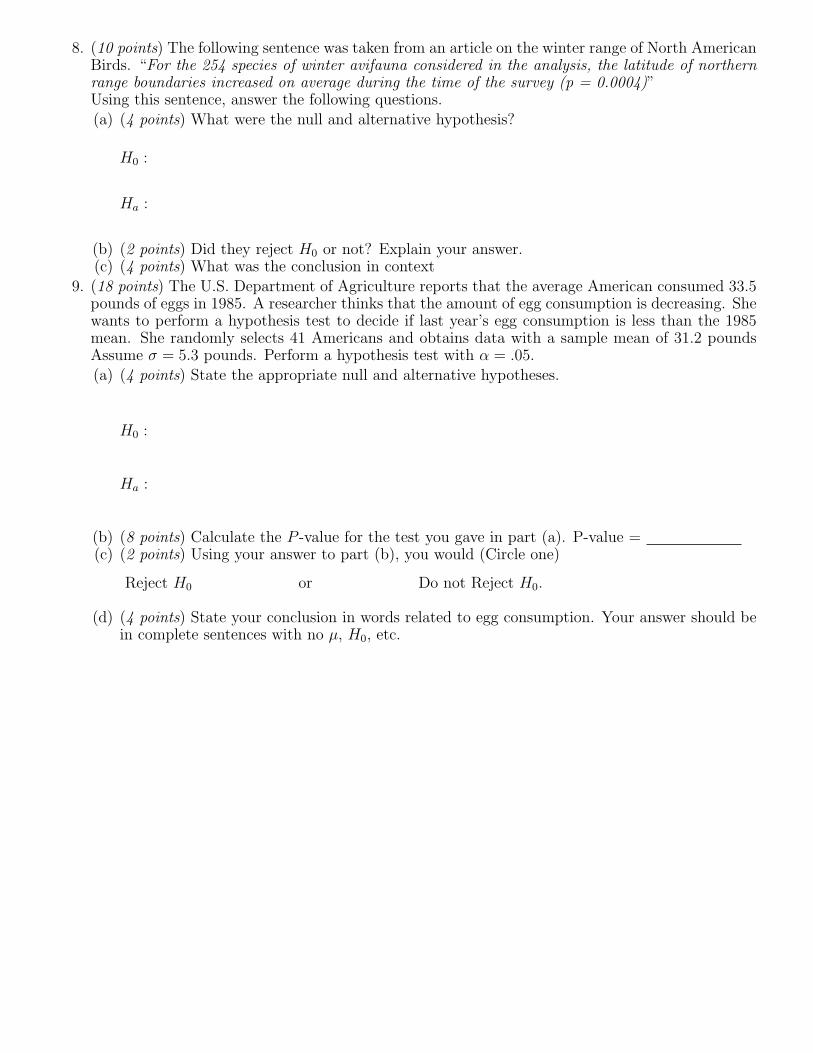
8. (10 points) The following sentence was taken from an article on the winter range of North AmericanBirds. “For the 254 species of winter avifauna considered in the analysis, the latitude of northernrange boundaries increased on average during the time of the survey (p = 0.0004)”Using this sentence, answer the following questions.(a) (4 points) What were the null and alternative hypothesis?
H0 :
Ha :
(b) (2 points) Did they reject H0 or not? Explain your answer.(c) (4 points) What was the conclusion in context
9. (18 points) The U.S. Department of Agriculture reports that the average American consumed 33.5pounds of eggs in 1985. A researcher thinks that the amount of egg consumption is decreasing. Shewants to perform a hypothesis test to decide if last year’s egg consumption is less than the 1985mean. She randomly selects 41 Americans and obtains data with a sample mean of 31.2 poundsAssume σ = 5.3 pounds. Perform a hypothesis test with α = .05.(a) (4 points) State the appropriate null and alternative hypotheses.
H0 :
Ha :
(b) (8 points) Calculate the P -value for the test you gave in part (a). P-value =(c) (2 points) Using your answer to part (b), you would (Circle one)
Reject H0 or Do not Reject H0.
(d) (4 points) State your conclusion in words related to egg consumption. Your answer should bein complete sentences with no µ, H0, etc.
10. (12 points) An hypothesis test will be performed considering the mean contents of cola bottles.The hypotheses are
H0 : µ = 300
Ha : µ < 300
Assume the population standard deviation is σ = 3.9. We will get a SRS of n = 45 bottles. Wewill use a 5% significance level. This problem has two steps. Use your answer to part (a) to dopart (b). Even if your answer to part (a) is incorrect, it is possible to get full credit for later parts.(a) We will reject H0 if x is . (in other words, find the critical value)
Your answer should give all of the possible values of x which will result in a conclusion to rejectH0. Give your answer as an inequality.It might be helpful to draw the H0 picture.
(b) Find the power of the test when µ = 298.1.It might be helpful to draw the Ha picture.
11. (16 points - 4 points for each part) During the Fall of 2000, my sections of Math 355 did a dataanalysis involving cans of Coke and Diet Coke. We obtained the cans from both Copps andCounty Market. This problem involves the mass of the empty Coke cans. The data indicate thatthe population of can masses is Normally distributed. In MINITAB, the variable names arecanmass-cmc The masses of the empty County Market Coke canscanmass-cc The masses of the empty Copps Coke cans
Descriptive Statistics: canmass-cc, canmass-cmc
Variable N Mean Median TrMean StDev SE Meancanmass-cmc 26 13.911 13.906 13.906 0.146 0.029canmass-cc 32 14.155 14.135 14.147 0.171 0.030
(a) Calculate a 95% confidence interval for the mean canmass for Coke cans from County Market(b) Calculate a 95% confidence interval for the mean canmass for Coke cans from Copps(c) Based on your answers to the above problems, is it reasonable to say that the population mean
can masses for Copps and County Market are different? Explain your answer.(d) In each of the two datasets there was an outlier which was removed before calculating the
means above. Explain some possible reasons why we would do this?
Math 355 - Fall 2011 - Quiz #1
Show ALL your work. Incorrect Solutions with no work will receive NO credit. Neatness counts!
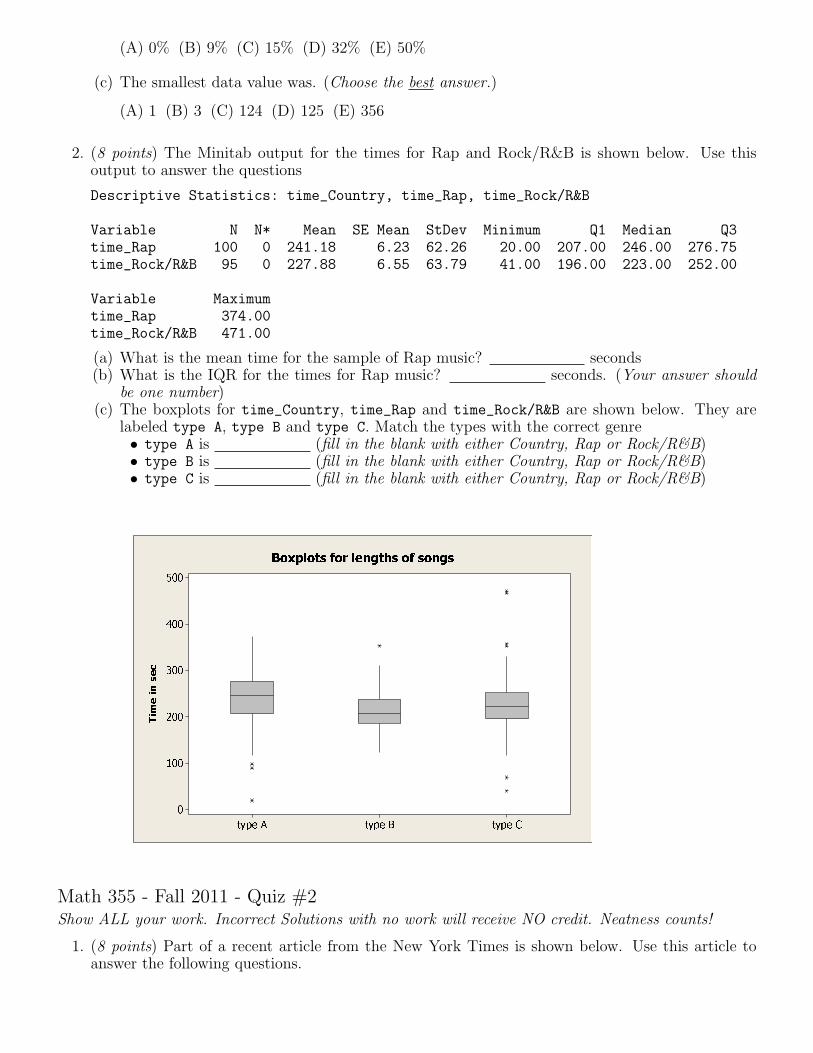
1. (7 points) In Spring 2007, my sections of Math 355 took a random sample of songs from current CDsand recorded the length of the song (in sec). We also recorded the songs as being either country,Rock/R&B or Rap. The data for the 100 Country songs was titled Time_Country in Minitab. Ahistogram for the Country songs is shown below.
(a) What is the mean time for the sample of Rap music? seconds(b) What is the IQR for the times for Rap music? seconds. (Your answer should
be one number)(c) The boxplots for time_Country, time_Rap and time_Rock/R&B are shown below. They are
labeled type A, type B and type C. Match the types with the correct genre• type A is (fill in the blank with either Country, Rap or Rock/R&B)• type B is (fill in the blank with either Country, Rap or Rock/R&B)• type C is (fill in the blank with either Country, Rap or Rock/R&B)
Time in sec type Ctype Btype A5004003002001000
Boxplots for lengths of songs
Math 355 - Fall 2011 - Quiz #2Show ALL your work. Incorrect Solutions with no work will receive NO credit. Neatness counts!
1. (8 points) Part of a recent article from the New York Times is shown below. Use this article toanswer the following questions.
(a) Use the bold text of the article to tell what x and y are in the context of Section 2.6.Select the ’arrow representation’ which best describes the association between x and y, ifnecessary, specify what z is.Explain your answer.
Even if you decided that this was causation, give a possible lurking variable that would helpexplain changes in y. Explain your answer.
(b) Is the x, y association that you identified in part (a) from an observational study or a designedexperiment? Explain your answer.
Envy May Bear Fruit, but It Also Has an AftertasteJohn Tierney Oct 11, 2011
Why envy? It seems to be the most useless of the deadlysins: excruciating to experience, shameful to admit, bereftof immediate pleasure or long-term benefits. To an evolu-tionary psychologist, theres a certain logic to seducing thyneighbors wife or stealing his goods, but whats the point ofmerely coveting them?
Philosophers have offered theories, but empirical evi-dence has been in short supply, maybe because envy is suchan uncomfortable topic for everyone, including psycholo-gists. Now, though, thanks to some experiments with en-vious students at Texas Christian University in Fort Worthand the University of Texas at Austin, we can see an upsideof coveting along with one new reason to have a command-ment against it.
The researchers were looking for quintessential envy,which is distinct from jealousy. Envy involves a longing forwhat you dont have, while jealousy is provoked by losingsomething to someone else. If you crave a wife like AngelinaJolie, youre envious of Brad Pitt; if youre upset about losingyour wife to him, youre jealous.
The psychologists in Texas began, mildly enough,with an experiment dredging up past feelings ofenvy. Some of the students were asked to writeabout occasions on which theyd envied a friend oracquaintance. Then these students, along with acontrol group not asked to recall envious experi-ences, read interviews with a couple of people whowere purportedly enrolled at their university. Inthese two interviews which were fictions concoctedby the researchers the respondents answered ques-tions about their studies and goals but didnt sayanything that would elicit envy.
Compared with the control group, the studentswho’d just finished describing their past envy spentmore time studying the interviews and were betterat recalling details about these two people. Merelyreliving their envy of past rivals apparently causedthem to pay more attention to current peers, eventhough there was nothing obviously threateningabout these two people. ...
2. (7 points) The goal of a nutritional study was to compare the caloric intake of adolescents livingin rural areas of the U.S. to the caloric intake of adolescents living in urban areas of the U.S. Arandom sample of ninth-grade students for one high school in a rural area was selected. Anotherrandom sample of ninth graders from one high school in an urban area was also selected. Eachstudent in each sample kept records of all the food he/she consumed in one day. The number ofcalories of food consumed per kilogram of body weight for each student was recorded.
(a) What was “treatment” for this investigation?
What were the experimental units/subjects?
What was the measurement/response variable?
(b) Obviously, this investigation would benefit from getting more data.Besides the fact that they should get more data, identify one ADDITIONAL major problemwith the design for this investigation.Describe an improvement to the design that would address the problem you identified.
Math 355 - Fall 2011 - Quiz #3
Show ALL your work. Incorrect Solutions with no work will receive NO credit. Neatness counts!
1. (15 points) During Fall 2005, students measured the rebound of tennis balls when dropped from 100 inches onto atile floor. I am leaving out some technical details, but for the purposes of this quiz, assume all measurements weremade to the nearest third of an inch. Assume that a random sample of 27 Penn balls was obtained and that σ = 2.1inches. Also assume that the distribution of rebound distances is Normal.
(a) (2 points) What is σx for a sample of size n = 27.(b) (4 points) The sample mean rebound distance was 54.772 inches.
Find a 97% confidence interval for µ.(c) (2 points) Which of the following is the best description of what µ is
i. µ is the mean rebound distance for all 27 Penn balls.ii. µ is the mean rebound distance for all Penn ballsiii. µ is in the interval calculated in part 1b.
(d) (2 points) The specifications for tennis balls require that the mean rebound distance be between 53 and 58inches. Using your answer to part 1b, is it reasonable to believe that the Penn balls meet the specifications?Explain your answer.
(e) (5 points) Using σ = 2.1 and a 97% confidence interval. Find the minimum sample size required to get a marginof error ≤ .31 inches.
Math 355 - Fall 2011 - Quiz #4
Show ALL your work. Incorrect Solutions with no work will receive NO credit. Neatness counts!
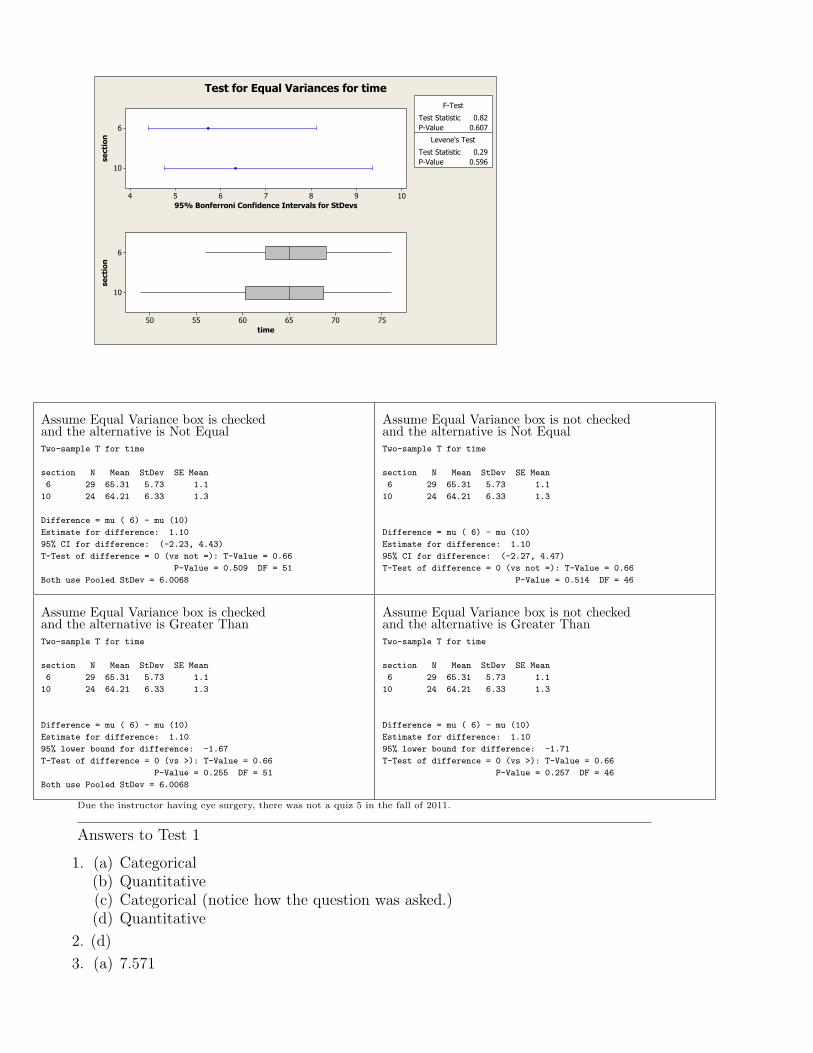
1. (15 pints) Students in Math 355, Section 10 (9 am) and Section 6 (1 pm) estimated the length of a minute. Eachstudent held a stopwatch upside-down, started it and then stopped it when they thought a minute had passed.The times were recorded. The main question for this ’research’ is whether students in section 10 are different fromstudents in section 6 with regard to the estimation of how long a minute is. Assume throughout that the dataare a random sample without outliers from the respective population and that the populations are both normallydistributed. MINITAB output is on the back. If you use it, circle the numbers that you use. The summary statisticsare below.
section N Mean StDev6 29 65.31 5.7310 24 64.21 6.33
(a) (5 points) Use a hypothesis test with α = .05 to determine whether the population variances are equal.i. State the appropriate null and alternative hypotheses.
ii. Find the P-value for this test. P-value = .
iii. Using your answer to part (a) part ii, you would (Circle one)
Reject H0 or Do not Reject H0.
iv. State your conclusion in words related to whether you should check the equal variances box. Your answershould be in complete sentences with no µ, H0, etc.
(b) (10 points) Use a hypothesis test with α = .05 to test whether the data indicate a difference in the mean times.i. State the appropriate null and alternative hypotheses.ii. Find the P-value for this test. P-value = .iii. Using your answer to part (b) part ii., you would (Circle one)
Reject H0 or Do not Reject H0.
iv. State your conclusion in words related to estimated times of minutes. Your answer should be in completesentences with no µ, H0, etc.
10
6
10987654
section
95% Bonferroni Confidence Intervals for StDevs
10
6
757065605550
section
time
Test Statistic 0.82
P-Value 0.607
Test Statistic 0.29
P-Value 0.596
F-Test
Levene's Test
Test for Equal Variances for time
Assume Equal Variance box is checkedand the alternative is Not EqualTwo-sample T for time
section N Mean StDev SE Mean
6 29 65.31 5.73 1.1
10 24 64.21 6.33 1.3
Difference = mu ( 6) - mu (10)
Estimate for difference: 1.10
95% CI for difference: (-2.23, 4.43)
T-Test of difference = 0 (vs not =): T-Value = 0.66
P-Value = 0.509 DF = 51
Both use Pooled StDev = 6.0068
Assume Equal Variance box is not checkedand the alternative is Not EqualTwo-sample T for time
section N Mean StDev SE Mean
6 29 65.31 5.73 1.1
10 24 64.21 6.33 1.3
Difference = mu ( 6) - mu (10)
Estimate for difference: 1.10
95% CI for difference: (-2.27, 4.47)
T-Test of difference = 0 (vs not =): T-Value = 0.66
P-Value = 0.514 DF = 46
Assume Equal Variance box is checkedand the alternative is Greater ThanTwo-sample T for time
section N Mean StDev SE Mean
6 29 65.31 5.73 1.1
10 24 64.21 6.33 1.3
Difference = mu ( 6) - mu (10)
Estimate for difference: 1.10
95% lower bound for difference: -1.67
T-Test of difference = 0 (vs >): T-Value = 0.66
P-Value = 0.255 DF = 51
Both use Pooled StDev = 6.0068
Assume Equal Variance box is not checkedand the alternative is Greater ThanTwo-sample T for time
section N Mean StDev SE Mean
6 29 65.31 5.73 1.1
10 24 64.21 6.33 1.3
Difference = mu ( 6) - mu (10)
Estimate for difference: 1.10
95% lower bound for difference: -1.71
T-Test of difference = 0 (vs >): T-Value = 0.66
P-Value = 0.257 DF = 46
Due the instructor having eye surgery, there was not a quiz 5 in the fall of 2011.
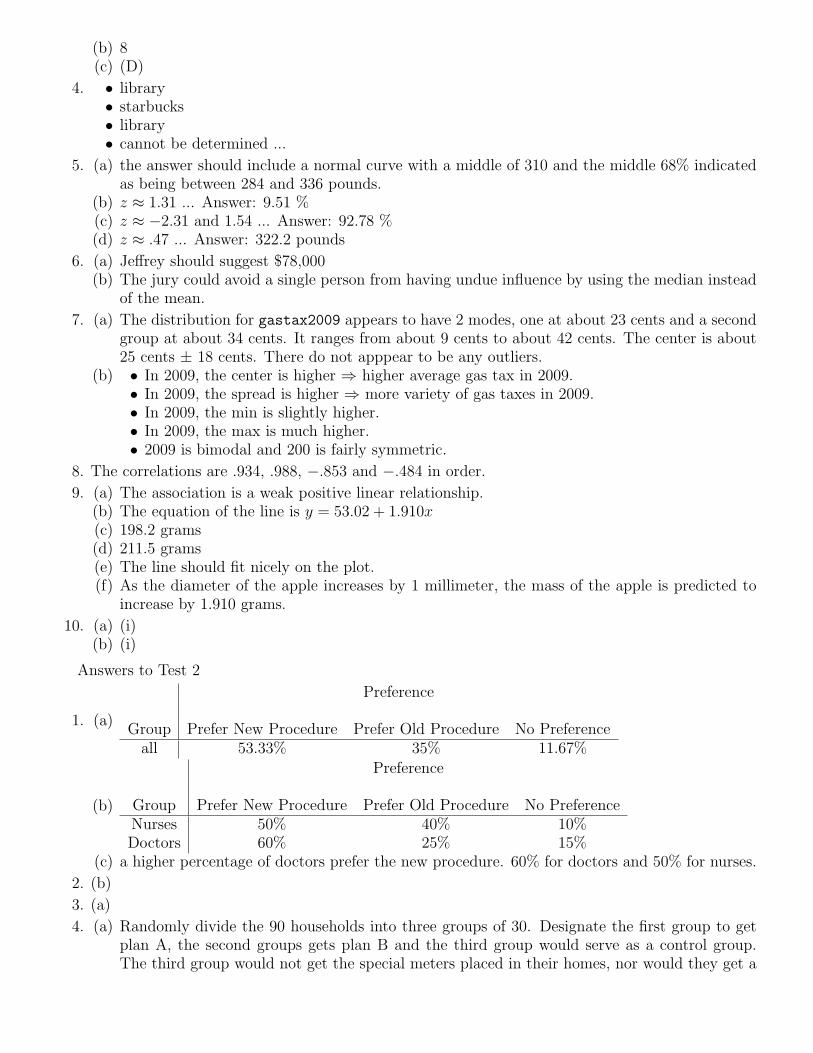
Answers to Test 1
1. (a) Categorical(b) Quantitative(c) Categorical (notice how the question was asked.)(d) Quantitative
2. (d)
3. (a) 7.571
(b) 8(c) (D)
4. • library• starbucks• library• cannot be determined ...
5. (a) the answer should include a normal curve with a middle of 310 and the middle 68% indicatedas being between 284 and 336 pounds.
(b) z ≈ 1.31 ... Answer: 9.51 %(c) z ≈ −2.31 and 1.54 ... Answer: 92.78 %(d) z ≈ .47 ... Answer: 322.2 pounds
6. (a) Jeffrey should suggest $78,000(b) The jury could avoid a single person from having undue influence by using the median instead
of the mean.
7. (a) The distribution for gastax2009 appears to have 2 modes, one at about 23 cents and a secondgroup at about 34 cents. It ranges from about 9 cents to about 42 cents. The center is about25 cents ± 18 cents. There do not apppear to be any outliers.
(b) • In 2009, the center is higher ⇒ higher average gas tax in 2009.• In 2009, the spread is higher ⇒ more variety of gas taxes in 2009.• In 2009, the min is slightly higher.• In 2009, the max is much higher.• 2009 is bimodal and 200 is fairly symmetric.
8. The correlations are .934, .988, −.853 and −.484 in order.
9. (a) The association is a weak positive linear relationship.(b) The equation of the line is y = 53.02 + 1.910x(c) 198.2 grams(d) 211.5 grams(e) The line should fit nicely on the plot.(f) As the diameter of the apple increases by 1 millimeter, the mass of the apple is predicted to
increase by 1.910 grams.
10. (a) (i)(b) (i)
Answers to Test 2
1. (a)
Preference
Group Prefer New Procedure Prefer Old Procedure No Preferenceall 53.33% 35% 11.67%
(b)
Preference
Group Prefer New Procedure Prefer Old Procedure No PreferenceNurses 50% 40% 10%Doctors 60% 25% 15%
(c) a higher percentage of doctors prefer the new procedure. 60% for doctors and 50% for nurses.
2. (b)
3. (a)
4. (a) Randomly divide the 90 households into three groups of 30. Designate the first group to getplan A, the second groups gets plan B and the third group would serve as a control group.The third group would not get the special meters placed in their homes, nor would they get a
chart. The treatment is whether they get Plan A, Plan B, or nothing. The experimental unitsare the households and the measurement variable is the electricity use for the household.
(b) No, a fake chart or false reading meteres might affect usage.(c) A control group is better because the study might reveal that both plan A and plan B reduced
energy usage. However, this reduction might simply be the result of milder weather this yearcompared to last year. Comparing to a control group (and last year) would help.
5. Diane is more likely to get 20% or fewer heads because she is flipping fewer times. The law of largenumbers says that the more times a person flips the closer she would come to 50% heads.
6. (a) The population is “families that live in Stevens Point.”(b) The sample is the 100 people that he talked with.(c) One sources of bias is that he only went to Target. Target might be a store people with larger
families shop.(d) One way to improve this data collection would be to go a variety of different types of stores.
For example, get 25 people each from 4 different grocery stores in town. Most families needgroceries, so this might be less biased.
7. (a)
8. (a) S = {H¯, H˙, H¸, H˛, H‚, H“, T¯, T˙, T¸, T˛, T‚, T“, }(b) A = the event that the coin is a Head, B = the event that the coin is a Tail.(c) C = the event that the coin is a Head, D = the event that the die is a ˙.
9. (a) .993(b) .5251
10. (a) .13(b) .87
11. (a) 18
(b) 1264
(c) 1056
Answers to Test 3
1. (a) Not binomial, if n = 60, then there could be more than 1 phoen call in a minute. Similarily ifn is any other number.
(b) This is binomial. There are 37 observations, each is either a seven or not (i.e. success is seven).The observations are independent and p is fixed ... and known p = .1
2. (a) µX =≈ 121.67(b) σX =≈ 5.174
3. (a) σx ≈ 1.039(b) .8078
4. (b)
5. (c)
6. Check “increase the sample size” and “decrease σ”
7. (a) 139.9 to 148.3(b) 4.186(c) 85
8. (a) H0: the lattitude of the northern range boundary did not change during the time of the surveyHa: the lattitude of the northern range boundary did change during the time of the survey
(b) They rejected H0, because the p-value was very small.(c) The lattitude of the northern range boundary increased during the time of the survey
9. (a) H0: µ = 33.5 pounds Ha: µ < 33.5 pounds where µ is the mean number of pounds of eggsconsumed by an American.
(d) Data indicate that the mean egg consumption of the average American has decreased since1985.
10. (a) Reject if x ≤ 299.0(b) Power = .9394
11. (a) For County Market the CI is 13.911± .05898 or (13.85 to 13.97)(b) For Copps the CI is 14.155± .06173 or (14.09 to 14.22)(c) It is reasonable to say that the average can masses are different because these two intervals do
not overlap(d) Outliers often dramically affect the calculation of the sample mean and the sample standard
deviation. This can give us inaccurate confidence intervals. This is why we should considerremoving outliers before doing the calculations for confidence intervals.