INCENTIVISING CLIMATE-SMART AGRICULTURE Alan Matthews Professor Emeritus of European Agricultural Policy Trinity College Dublin Presentation to the Institute for International and European Affairs 5 June 2015
Transcript
INCENTIVISING CLIMATE-SMART
AGRICULTURE
Alan Matthews
Professor Emeritus of European Agricultural Policy
Trinity College Dublin
Presentation to the Institute for International and European Affairs
agricultural productivity and incomes, adapting and
building resilience to climate change, and reducing
greenhouse gases emissions where possible
• (UN Climate Summit 2014).
• Today, will only talk about the first and last aspects and
will not discuss adaptation for lack of time
2
The issue
Don’t blame
me! I’m only
doing my best
to produce milk
and meat to
satisfy human
needs
… but she’s also producing greenhouse
gas emissions without realising it
4
Perceptions and cost
• Greenhouse gas emissions are a negative externality
• Causes unpriced damage
• But invisible, long-term, far-away, global
• Compare to water pollution
• Very difficult for farmers to comprehend (Bogue, 2013)
• But emissions are a real cost. Placing a value on carbon
is important to ensure effective incentives are in place to
tackle climate change
• Measured either by
• Social cost of carbon – the marginal damage cost of emissions
caused by emitting 1 additional unit of carbon to the atmosphere
• Carbon price - the marginal abatement cost to the state of meeting
targets set by international commitments
5
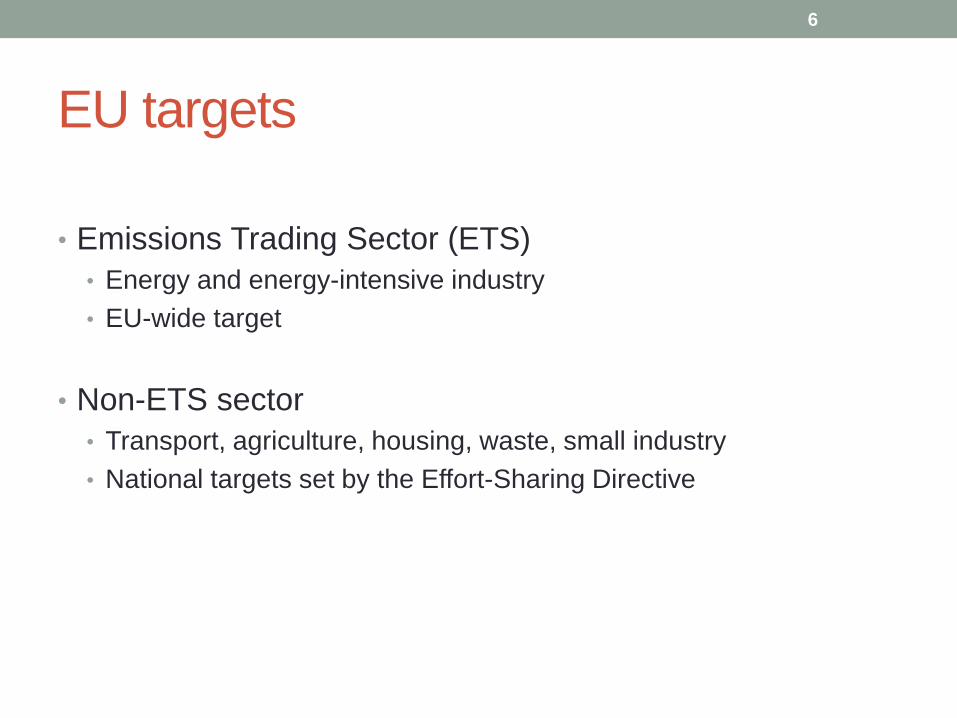
EU targets
• Emissions Trading Sector (ETS)
• Energy and energy-intensive industry
• EU-wide target
• Non-ETS sector
• Transport, agriculture, housing, waste, small industry
• National targets set by the Effort-Sharing Directive
6
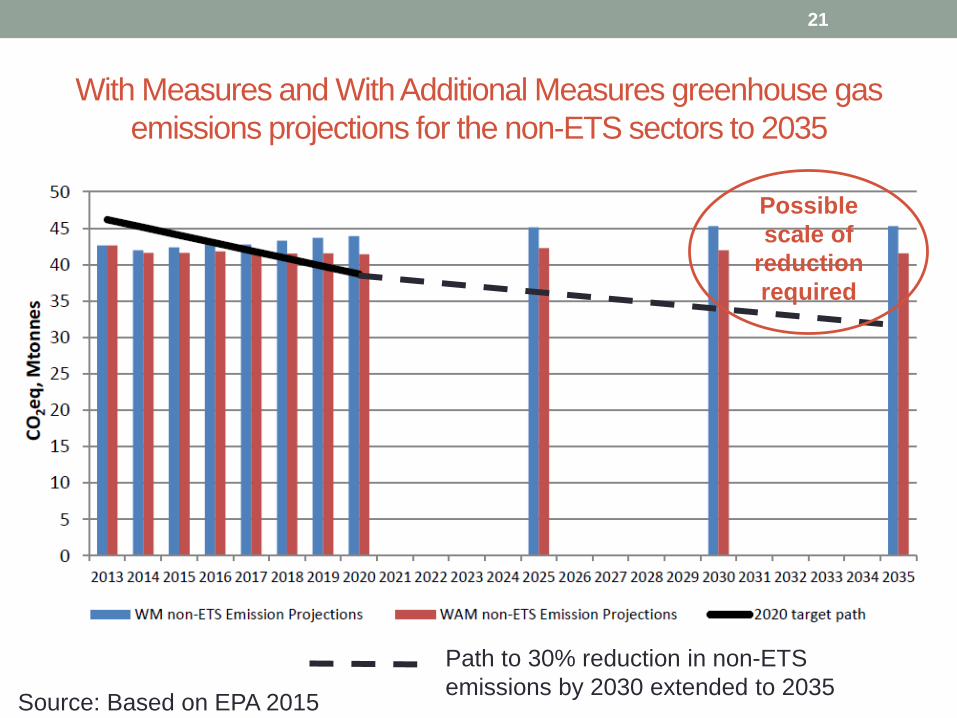
Target and flexibility mechanisms - 2020
• 2020 target
• Irish target is 20% reduction in non-ETS emissions by 2020 relative
to 2005 (10% average for EU)
• Flexibilities
• Annual targets, but banking and borrowing allowed across years
• Use of transfers from other Member States
• Limited use of international credits from project activities
• Land Use, Land Use Change and Forestry (LULUCF) not included
• Recognised that this target was relatively more stringent (implying
higher carbon price) in Ireland than in other MS
7
Target and flexibility mechanisms - 2030
• 2030 target • 30% EU-wide reduction in non-ETS emissions
• National targets to be distributed on basis of relative GDP per capita spanning from 0% to -40%, taking account of cost-effectiveness for countries with above-average GDP per capita.
• Coherence between EU’s food security and climate change objectives to be ensured
• Flexibilities • International offsets will not be counted
• Possibility of transfers between MS will be significantly enhanced
• Possibility to offset non-ETS emissions with ETS allowances mooted
• Policy proposal how to include (LULUCF) in the mitigation framework to be brought forward before 2020
8
Separate methane targets?
• EU Clean Air Programme
• Revision of the National Emissions Ceiling Directive 2013
• Establishes new national reduction commitments for
ammonia in 2020 and 2030 as well as for methane in
2030
• Proposed EU-wide methane reductions up to 30% in 2025
and 33% in 2030 compared with 2005, differentiated by
Member State
• Ireland’s proposed targets (-7% for both ammonia and
methane by 2030) the lowest for any MS
9
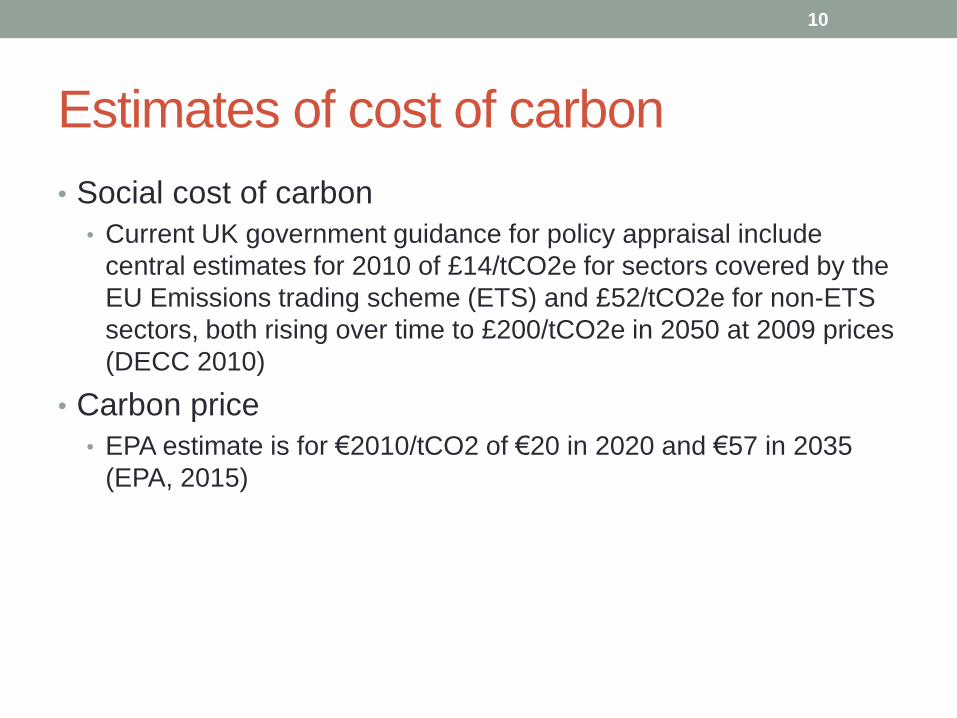
Estimates of cost of carbon
• Social cost of carbon
• Current UK government guidance for policy appraisal include
central estimates for 2010 of £14/tCO2e for sectors covered by the
EU Emissions trading scheme (ETS) and £52/tCO2e for non-ETS
sectors, both rising over time to £200/tCO2e in 2050 at 2009 prices
(DECC 2010)
• Carbon price
• EPA estimate is for €2010/tCO2 of €20 in 2020 and €57 in 2035
• No indicators or targets set for desired GHG reduction
35
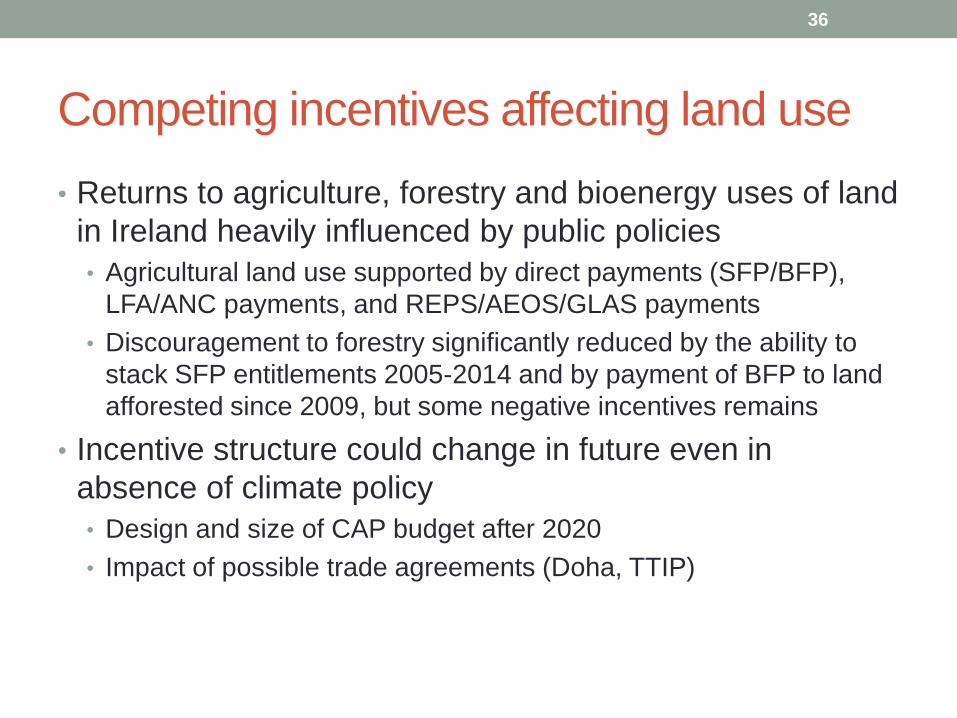
Competing incentives affecting land use
• Returns to agriculture, forestry and bioenergy uses of land
in Ireland heavily influenced by public policies
• Agricultural land use supported by direct payments (SFP/BFP),
LFA/ANC payments, and REPS/AEOS/GLAS payments
• Discouragement to forestry significantly reduced by the ability to
stack SFP entitlements 2005-2014 and by payment of BFP to land
afforested since 2009, but some negative incentives remains
• Incentive structure could change in future even in
absence of climate policy
• Design and size of CAP budget after 2020
• Impact of possible trade agreements (Doha, TTIP)
36
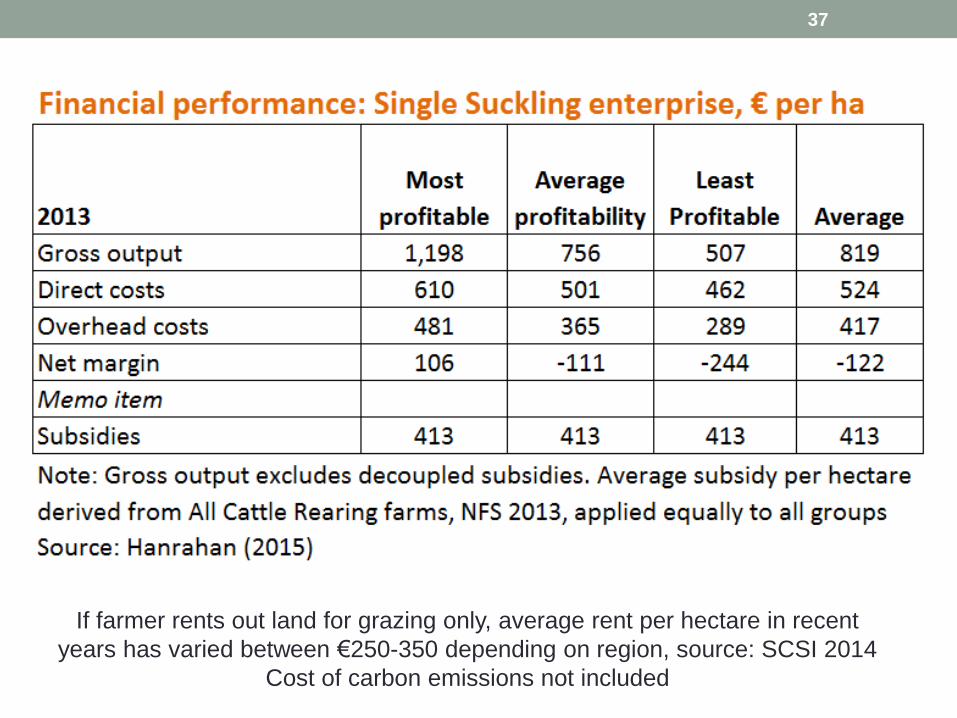
If farmer rents out land for grazing only, average rent per hectare in recent
years has varied between €250-350 depending on region, source: SCSI 2014
Cost of carbon emissions not included
37
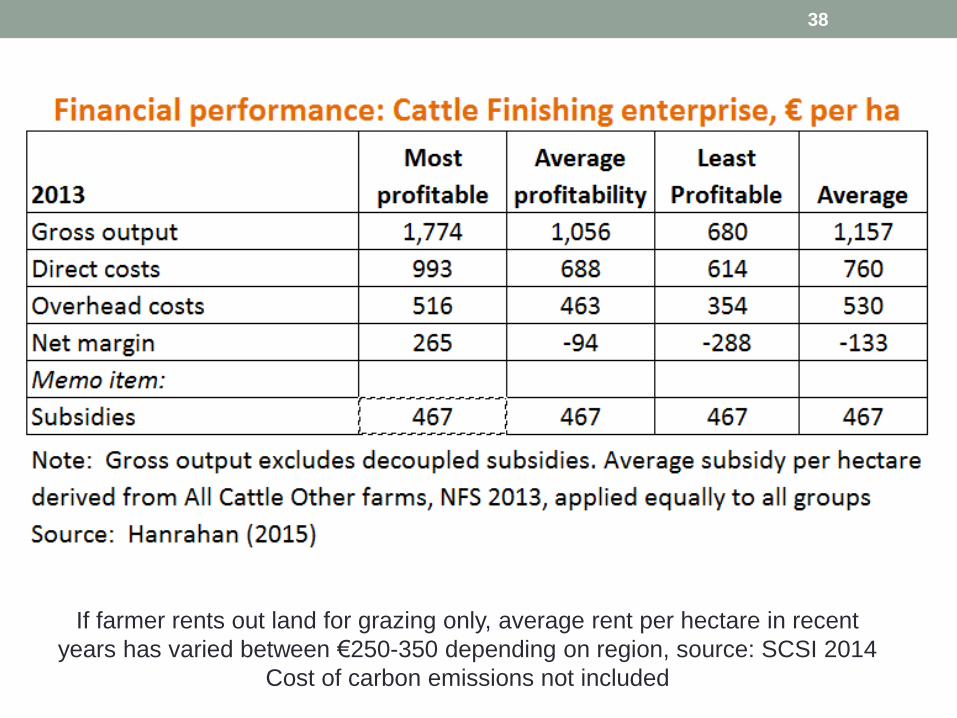
If farmer rents out land for grazing only, average rent per hectare in recent
years has varied between €250-350 depending on region, source: SCSI 2014
Cost of carbon emissions not included
38
Investment performance of afforestation with
alternative superseded agricultural enterprises.
39
Source: Breen, Clancy, Ryan and Wallace, 2010
Forestry (with grants) shows positive return relative to alternative
agricultural uses of that land, yet planting rates remain low
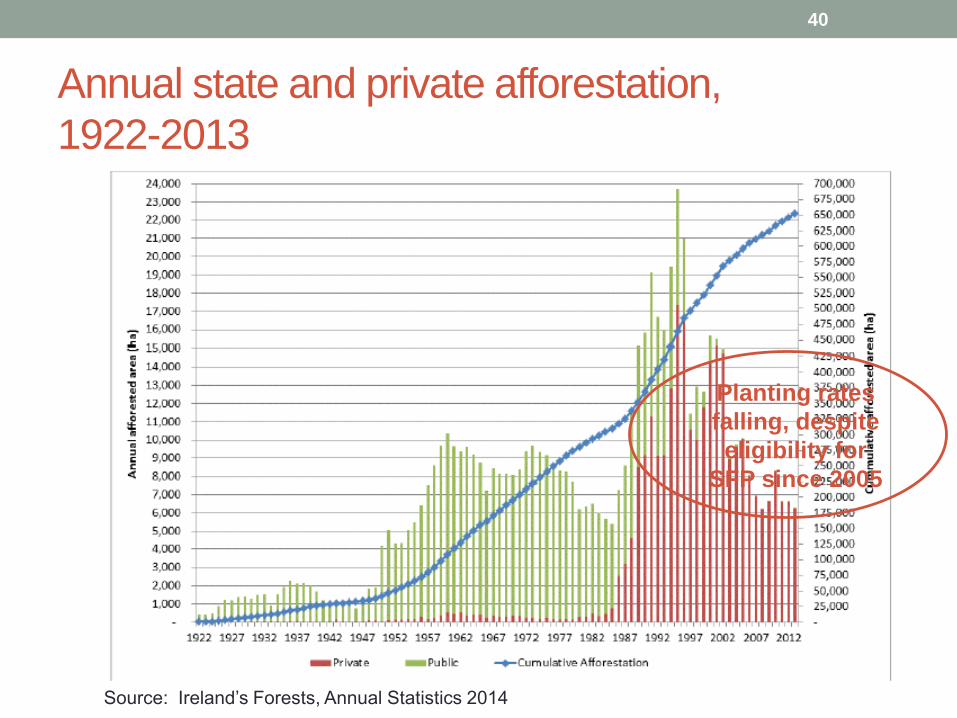
Annual state and private afforestation,
1922-2013
40
Source: Ireland’s Forests, Annual Statistics 2014
Planting rates
falling, despite
eligibility for
SFP since 2005
Planting rates
falling, despite
eligibility for
SFP since 2005
Assumptions 80% Sitka spruce Yield class 16, 20% beech Yield class 6 GPC 3 grant and premia rates, fencing grant excluded Preferential tax treatment (income from sales of timber exempt from tax) not taken into account 40 year planting cycle Carbon sequestration rates assumed averaged over cycle Sitka spruce 3.6tC/ha, beech 2.4tC/ha (Byrne and Black, 2003)
41
If we assume that state support for private forestry is justified solely
because of the carbon sequestered, the level of support seems more
than adequate. But forestry still competes on an unlevel playing field
because carbon emissions from alternative enterprises are not priced
Some conclusions
• Increased agricultural output should be encouraged,
provided all costs are fully accounted for.
• Other sectors in the non-ETS sector pay a carbon tax
(fuel, heating)
• Carbon values of forestry sequestration and bioenergy
are, at least implicitly, recognised….
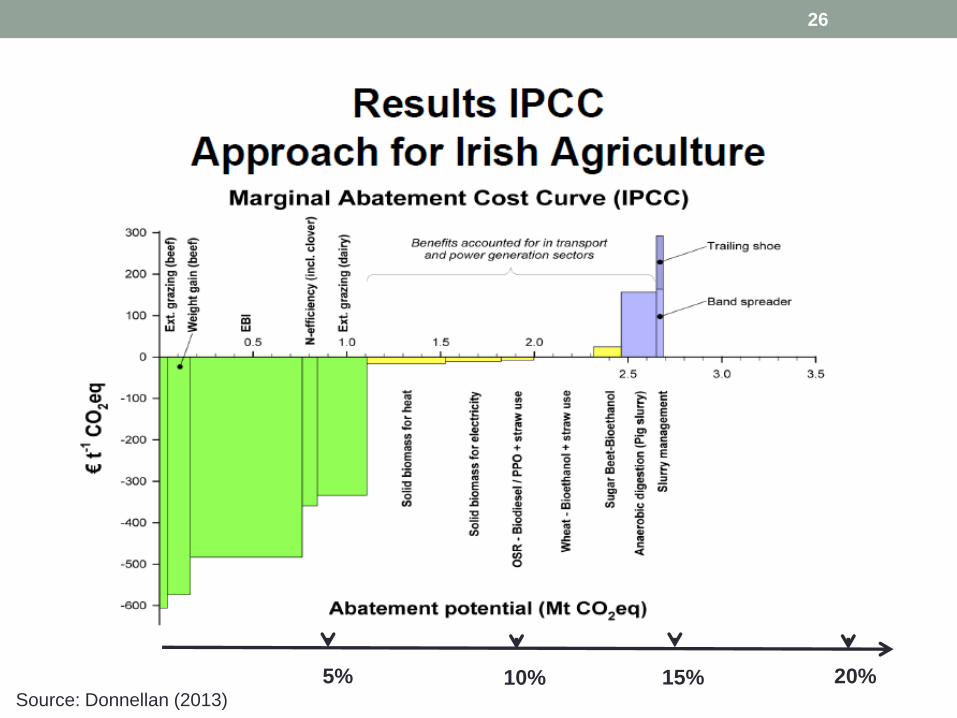
• … but carbon emissions from agricultural production are
given a free pass, despite the evidence of significant
abatement opportunities at negative cost to farmers
• In the context of a constraining ceiling for non-ETS
emissions, this is neither efficient nor sustainable
42
But jobs and carbon leakage?
• Jobs
• Pricing biological carbon emissions on the same basis as carbon
emissions in other sectors of Irish economy would encourage a
reallocation not a loss of jobs
• Revenue raised stays in the country, unlike purchase of carbon
permits from abroad
• Carbon leakage and competition
• Potentially to third countries or to EU countries where agriculture
has lower tax rate or remains untaxed – unlevel playing field
• Hugely desirable to get commitment for level playing field on
carbon pricing for agriculture throughout EU
• How to address unfair import competition will become clearer after
we see shape of Paris COP 2015 deal
43
The bottom line
• For the incentive effects of a carbon charge to be effective,
farmers need to get credit for the changes that they make
• A challenge for inventory acounting to capture relevant reductions
• If Ireland were the only country in the EU, or the world, to
properly price its biological carbon emissions, this would put
Irish agriculture at a large competitive disadvantage
• Possible solution is to proceed with introducing carbon charge
system but to introduce charge initially at a low rate until critical
mass of countries has caught up
• Under cap-and-trade system, existing emissions could be
grandfathered and charge applied to marginal quantities
• Acting first would be a credible supplement to Origin Green
claim that Ireland is world leader in sustainable agriculture
44
Plus €2
climate
charge
Picture credit: Lisa Alber http://lisaalber.com/books/novel-research/