NEWS RELEASE Methanex Corporation 1800 - 200 Burrard St. Vancouver, BC Canada V6C 3M1 Investor Relations: (604) 661-2600 http://www.methanex.com For immediate release METHANEX STARTS UP 1 MILLION TONNE GEISMAR 1 PLANT AND REPORTS HIGHER Q4 2014 EARNINGS JANUARY 28, 2015 For the fourth quarter of 2014, Methanex reported Adjusted EBITDA 1 of $150 million and Adjusted net income 1 of $80 million ($0.85 per share on a diluted basis 1 ). This compares with Adjusted EBITDA 1 of $137 million and Adjusted net income 1 of $66 million ($0.69 per share on a diluted basis 1 ) for the third quarter of 2014. For the year ended December 31, 2014, Methanex reported Adjusted EBITDA 1 of $702 million and Adjusted net income 1 of $397 million ($4.12 per share on a diluted basis 1 ). This compares with Adjusted EBITDA of $736 million and Adjusted net income 1 of $471 million ($4.88 per share on a diluted basis) for the year ended December 31, 2013. John Floren, President and CEO of Methanex commented, “We achieved solid results in Q4, with higher Adjusted EBITDA and earnings versus Q3. A steep drop in oil and related downstream product prices this quarter lowered the affordability for methanol into certain energy applications and this, along with strong industry supply, pressured global methanol pricing. We continue to see stable demand from chemical applications, and the recently lower methanol pricing has helped to restore the affordability of methanol for energy applications.” Mr. Floren added, “We announced earlier this week that our Geismar 1 plant has successfully started up on schedule and is producing methanol. This marks another key milestone in our 2013 commitment to grow our operating capacity by approximately three million tonnes over three years. We also continue to make excellent progress on the construction of our one million tonne Geismar 2 plant, and remain on target for methanol production in late Q1 2016.” "During the quarter, we returned over $100 million in cash to shareholders in the form of dividends and share repurchases, bringing total cash returned to shareholders in 2014 to just over $340 million. We announced today that we have increased our Normal Course Issuer Bid initiated on May 6, 2014 to allow for up to an incremental 3,751,519 common shares to be purchased, for a total of 8,577,716 common shares, or 10% of our public float.” “In Q4 we issued $600 million in new bonds, bringing our total cash on hand as at December 31, 2014 to over $900 million. With our cash on hand, undrawn credit facility, robust balance sheet, and strong future cash flow generation, we are well positioned to meet our financial commitments, invest to grow the Company and return excess cash to shareholders through dividends and our share buyback program.” A conference call is scheduled for January 29, 2015 at 12:00 noon ET (9:00 am PT) to review these fourth quarter results. To access the call, dial the conferencing operator ten minutes prior to the start of the call at (416) 340-8530, or toll free at (800) 769-8320. A playback version of the conference call will be available until February 19, 2015 at (905) 694-9451, or toll free at (800) 408-3053. The passcode for the playback version is 3241984. Presentation slides summarizing Q4-14 results and a simultaneous audio-only webcast of the conference call can be accessed from our website at www.methanex.com. The webcast will be available on the website for three weeks following the call. Methanex is a Vancouver-based, publicly traded company and is the world’s largest producer and supplier of methanol to major international markets. Methanex shares are listed for trading on the Toronto Stock Exchange in Canada under the trading symbol "MX" and on the NASDAQ Global Market in the United States under the trading symbol "MEOH".
Transcript
NEWS RELEASE
Methanex Corporation 1800 - 200 Burrard St.
Vancouver, BC Canada V6C 3M1 Investor Relations: (604) 661-2600
http://www.methanex.com
For immediate release
METHANEX STARTS UP 1 MILLION TONNE GEISMAR 1 PLANT AND REPORTS HIGHER Q4 2014 EARNINGS
JANUARY 28, 2015
For the fourth quarter of 2014, Methanex reported Adjusted EBITDA1 of $150 million and Adjusted net income1 of
$80 million ($0.85 per share on a diluted basis1). This compares with Adjusted EBITDA1 of $137 million and Adjusted net
income1 of $66 million ($0.69 per share on a diluted basis1) for the third quarter of 2014. For the year ended December 31,
2014, Methanex reported Adjusted EBITDA1 of $702 million and Adjusted net income1 of $397 million ($4.12 per share on
a diluted basis1). This compares with Adjusted EBITDA of $736 million and Adjusted net income1 of $471 million ($4.88
per share on a diluted basis) for the year ended December 31, 2013.
John Floren, President and CEO of Methanex commented, “We achieved solid results in Q4, with higher Adjusted EBITDA
and earnings versus Q3. A steep drop in oil and related downstream product prices this quarter lowered the affordability for
methanol into certain energy applications and this, along with strong industry supply, pressured global methanol pricing.
We continue to see stable demand from chemical applications, and the recently lower methanol pricing has helped to
restore the affordability of methanol for energy applications.”
Mr. Floren added, “We announced earlier this week that our Geismar 1 plant has successfully started up on schedule and is
producing methanol. This marks another key milestone in our 2013 commitment to grow our operating capacity by
approximately three million tonnes over three years. We also continue to make excellent progress on the construction of
our one million tonne Geismar 2 plant, and remain on target for methanol production in late Q1 2016.”
"During the quarter, we returned over $100 million in cash to shareholders in the form of dividends and share repurchases,
bringing total cash returned to shareholders in 2014 to just over $340 million. We announced today that we have increased
our Normal Course Issuer Bid initiated on May 6, 2014 to allow for up to an incremental 3,751,519 common shares to be
purchased, for a total of 8,577,716 common shares, or 10% of our public float.”
“In Q4 we issued $600 million in new bonds, bringing our total cash on hand as at December 31, 2014 to over
$900 million. With our cash on hand, undrawn credit facility, robust balance sheet, and strong future cash flow generation,
we are well positioned to meet our financial commitments, invest to grow the Company and return excess cash to
shareholders through dividends and our share buyback program.”
A conference call is scheduled for January 29, 2015 at 12:00 noon ET (9:00 am PT) to review these fourth quarter results.
To access the call, dial the conferencing operator ten minutes prior to the start of the call at (416) 340-8530, or toll free at
(800) 769-8320. A playback version of the conference call will be available until February 19, 2015 at (905) 694-9451, or
toll free at (800) 408-3053. The passcode for the playback version is 3241984. Presentation slides summarizing Q4-14
results and a simultaneous audio-only webcast of the conference call can be accessed from our website at
www.methanex.com. The webcast will be available on the website for three weeks following the call.
Methanex is a Vancouver-based, publicly traded company and is the world’s largest producer and supplier of methanol to
major international markets. Methanex shares are listed for trading on the Toronto Stock Exchange in Canada under the
trading symbol "MX" and on the NASDAQ Global Market in the United States under the trading symbol "MEOH".
This Fourth Quarter 2014 press release contains forward-looking statements with respect to us and the chemical industry.
Refer to Forward-Looking Information Warning in the attached Fourth Quarter 2014 Management’s Discussion and Analysis
for more information.
1 Adjusted EBITDA, Adjusted net income and Adjusted net income per common share are non-GAAP measures which do not have any standardized meaning prescribed by GAAP. These measures represent the amounts that are attributable to Methanex Corporation shareholders and are calculated by excluding the mark-to-market impact of share-based compensation as a result of changes in our share price and certain items considered by management to be non-operational. Refer to Additional Information - Supplemental Non-GAAP Measures on page 14 of the attached Interim Report for the three months ended December 31, 2014 for reconciliations to the most comparable GAAP measures.
Share Information Methanex Corporation’s common shares are listed for trading on the Toronto Stock Exchange under the symbol MX and on the Nasdaq Global Market under the symbol MEOH. Transfer Agents & Registrars CST Trust Company 320 Bay Street Toronto, Ontario Canada M5H 4A6 Toll free in North America: 1-800-387-0825
Investor Information All financial reports, news releases and corporate information can be accessed on our website at www.methanex.com. Contact Information Methanex Investor Relations 1800 - 200 Burrard Street Vancouver, BC Canada V6C 3M1 E-mail: [email protected] Methanex Toll-Free: 1-800-661-8851
At January 28, 2015 the Company had 91,814,390 common shares issued and outstanding and stock options exercisable for 1,443,001 additional common shares.
FOURTH QUARTER MANAGEMENT’S DISCUSSION AND ANALYSIS Except where otherwise noted, all currency amounts are stated in United States dollars.
FINANCIAL AND OPERATIONAL HIGHLIGHTS
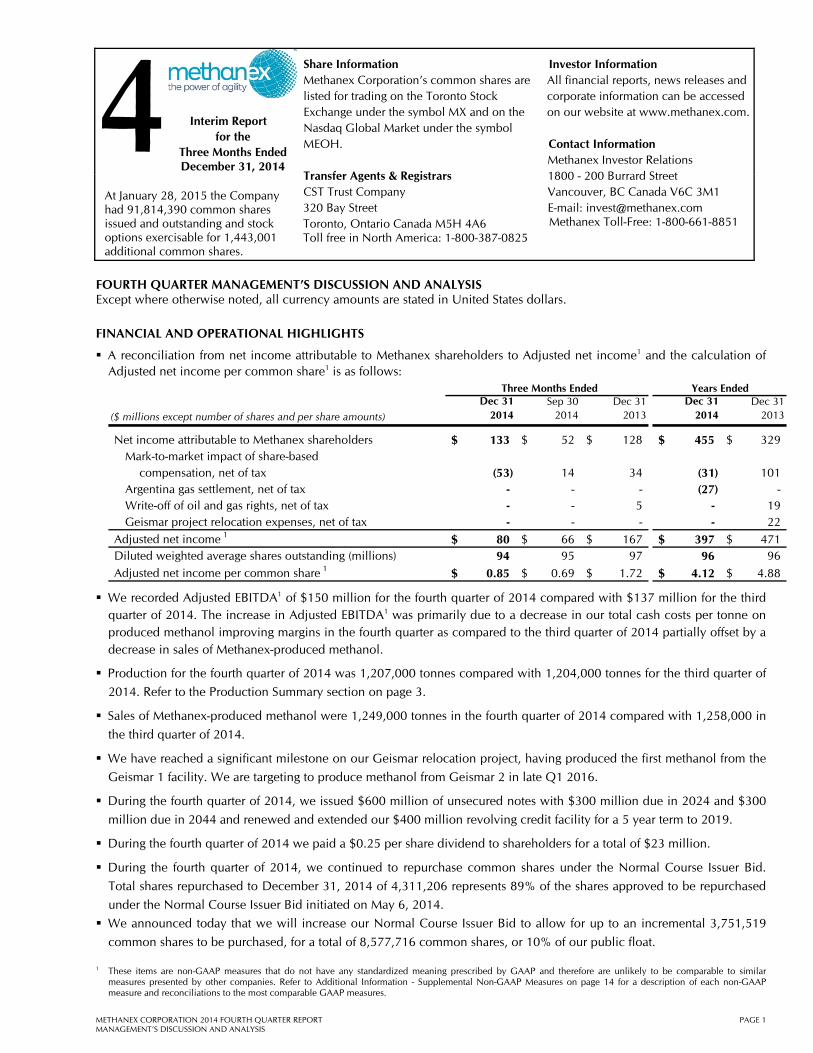
A reconciliation from net income attributable to Methanex shareholders to Adjusted net income1 and the calculation of Adjusted net income per common share1 is as follows:
Three Months Ended Years Ended
($ millions except number of shares and per share amounts)
Dec 312014
Sep 302014
Dec 31 2013
Dec 312014
Dec 31 2013
Net income attributable to Methanex shareholders 133$ 52$ 128$ 455$ 329$ Mark-to-market impact of share-based
compensation, net of tax (53) 14 34 (31) 101 Argentina gas settlement, net of tax - - - (27) - Write-off of oil and gas rights, net of tax - - 5 - 19 Geismar project relocation expenses, net of tax - - - - 22
Adjusted net income 1 80$ 66$ 167$ 397$ 471$ Diluted weighted average shares outstanding (millions) 94 95 97 96 96
Adjusted net income per common share 1 0.85$ 0.69$ 1.72$ 4.12$ 4.88$
We recorded Adjusted EBITDA1 of $150 million for the fourth quarter of 2014 compared with $137 million for the third quarter of 2014. The increase in Adjusted EBITDA1 was primarily due to a decrease in our total cash costs per tonne on produced methanol improving margins in the fourth quarter as compared to the third quarter of 2014 partially offset by a decrease in sales of Methanex-produced methanol.
Production for the fourth quarter of 2014 was 1,207,000 tonnes compared with 1,204,000 tonnes for the third quarter of
2014. Refer to the Production Summary section on page 3.
Sales of Methanex-produced methanol were 1,249,000 tonnes in the fourth quarter of 2014 compared with 1,258,000 in
the third quarter of 2014.
We have reached a significant milestone on our Geismar relocation project, having produced the first methanol from the
Geismar 1 facility. We are targeting to produce methanol from Geismar 2 in late Q1 2016.
During the fourth quarter of 2014, we issued $600 million of unsecured notes with $300 million due in 2024 and $300
million due in 2044 and renewed and extended our $400 million revolving credit facility for a 5 year term to 2019.
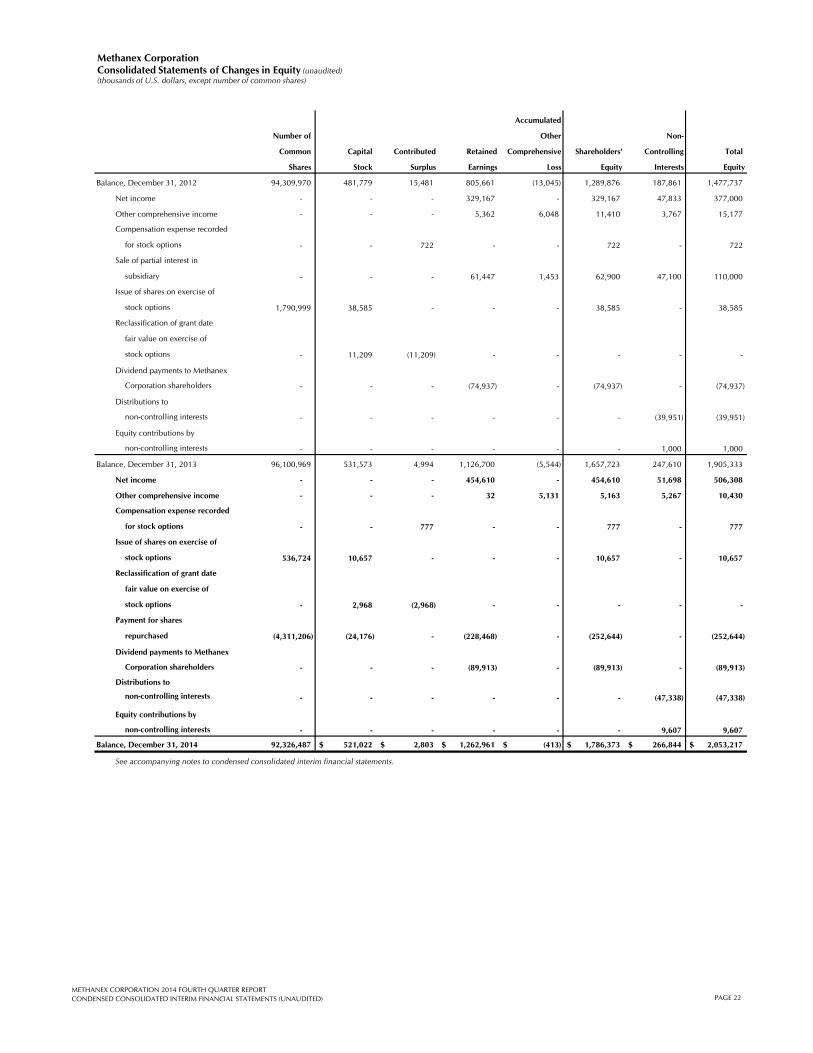
During the fourth quarter of 2014 we paid a $0.25 per share dividend to shareholders for a total of $23 million.
During the fourth quarter of 2014, we continued to repurchase common shares under the Normal Course Issuer Bid.
Total shares repurchased to December 31, 2014 of 4,311,206 represents 89% of the shares approved to be repurchased
under the Normal Course Issuer Bid initiated on May 6, 2014.
We announced today that we will increase our Normal Course Issuer Bid to allow for up to an incremental 3,751,519
common shares to be purchased, for a total of 8,577,716 common shares, or 10% of our public float.
1 These items are non-GAAP measures that do not have any standardized meaning prescribed by GAAP and therefore are unlikely to be comparable to similar measures presented by other companies. Refer to Additional Information - Supplemental Non-GAAP Measures on page 14 for a description of each non-GAAP measure and reconciliations to the most comparable GAAP measures.
Cash flows from operating activities 211 171 162 801 586
Adjusted net income (attributable to Methanex shareholders) 4 80 66 167 397 471
Net income attributable to Methanex shareholders 133 52 128 455 329
Adjusted net income per common share (attributable to
Methanex shareholders) 4 0.85 0.69 1.72 4.12 4.88
Basic net income per common share (attributable to Methanex shareholders) 1.43 0.55 1.33 4.79 3.46
Diluted net income per common share (attributable to Methanex shareholders) 1.11 0.54 1.32 4.55 3.41
Common share information (millions of shares):
Weighted average number of common shares 93 94 96 95 95
Diluted weighted average number of common shares 94 95 97 96 96
Number of common shares outstanding, end of period 92 94 96 92 96
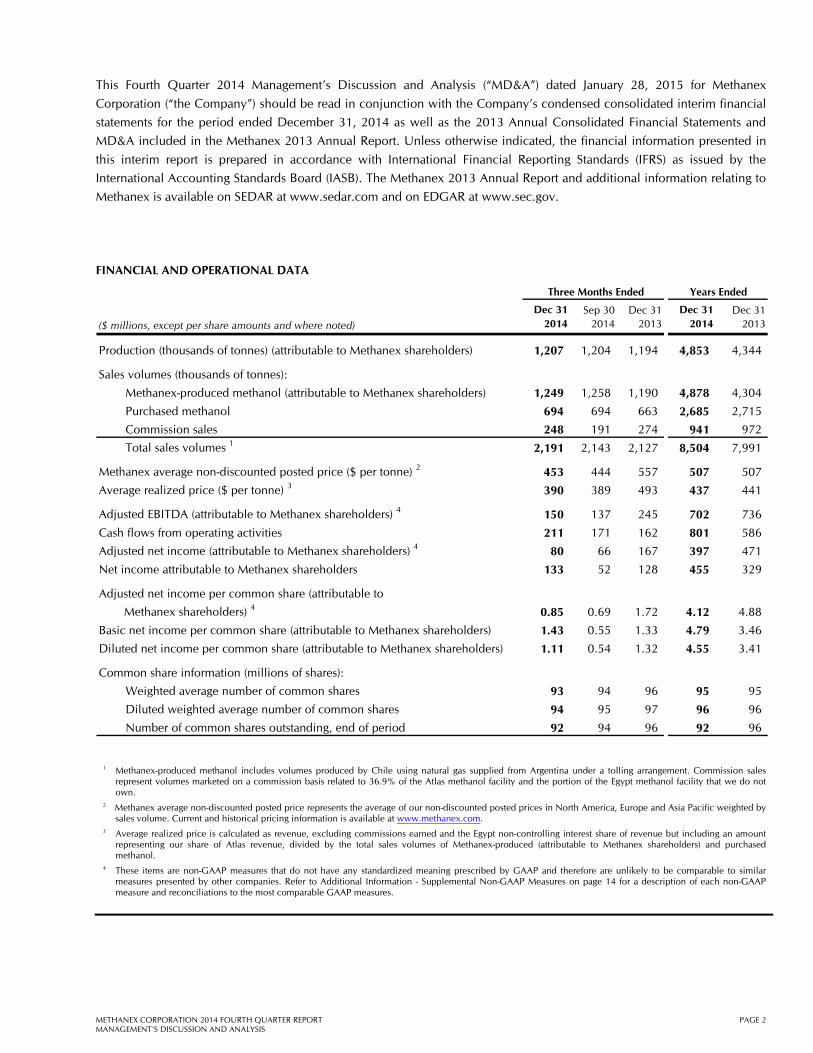
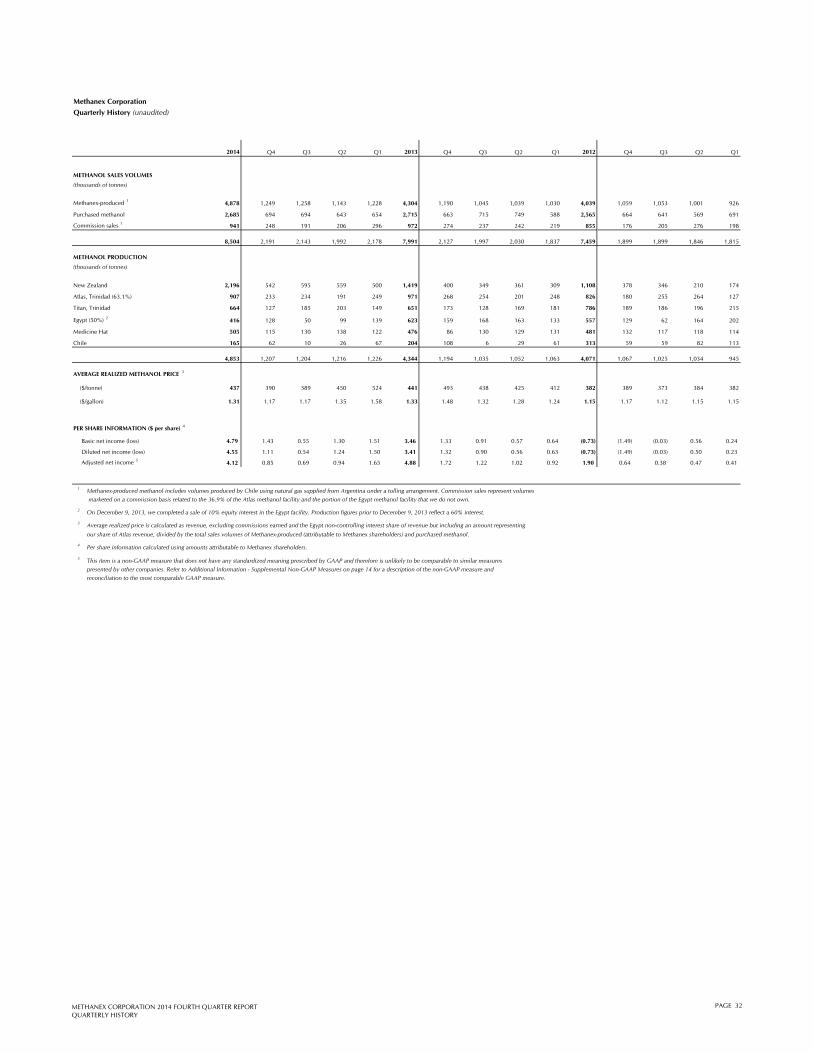
1 Methanex-produced methanol includes volumes produced by Chile using natural gas supplied from Argentina under a tolling arrangement. Commission sales represent volumes marketed on a commission basis related to 36.9% of the Atlas methanol facility and the portion of the Egypt methanol facility that we do not own.
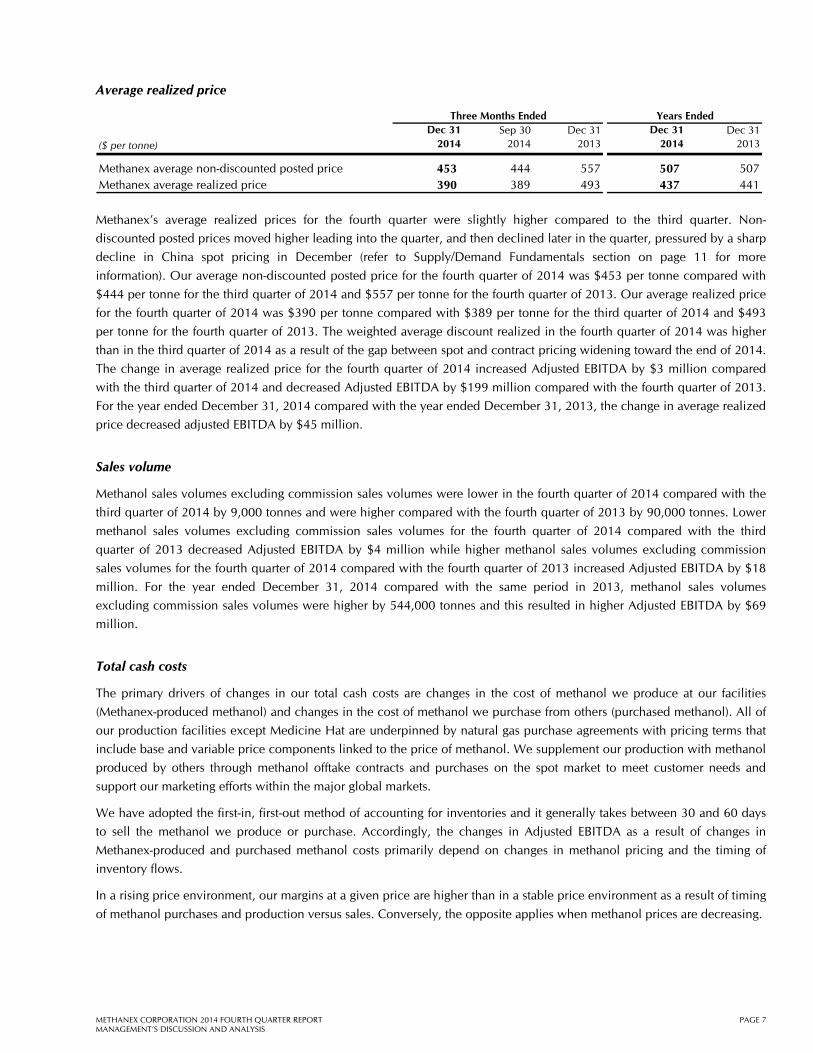
2 Methanex average non-discounted posted price represents the average of our non-discounted posted prices in North America, Europe and Asia Pacific weighted by sales volume. Current and historical pricing information is available at www.methanex.com.
3 Average realized price is calculated as revenue, excluding commissions earned and the Egypt non-controlling interest share of revenue but including an amount representing our share of Atlas revenue, divided by the total sales volumes of Methanex-produced (attributable to Methanex shareholders) and purchased methanol.
4 These items are non-GAAP measures that do not have any standardized meaning prescribed by GAAP and therefore are unlikely to be comparable to similar measures presented by other companies. Refer to Additional Information - Supplemental Non-GAAP Measures on page 14 for a description of each non-GAAP measure and reconciliations to the most comparable GAAP measures.
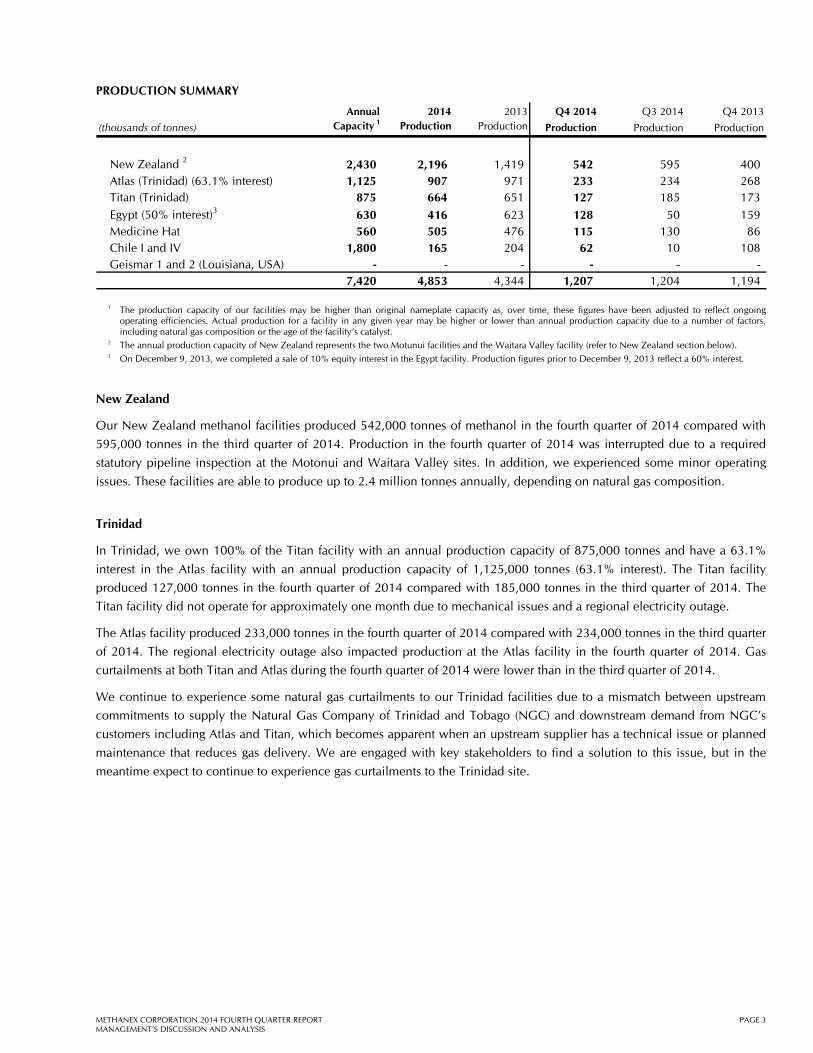
Egypt (50% interest)3 630 416 623 128 50 159 Medicine Hat 560 505 476 115 130 86 Chile I and IV 1,800 165 204 62 10 108 Geismar 1 and 2 (Louisiana, USA) - - - - - -
7,420 4,853 4,344 1,207 1,204 1,194
1 The production capacity of our facilities may be higher than original nameplate capacity as, over time, these figures have been adjusted to reflect ongoing operating efficiencies. Actual production for a facility in any given year may be higher or lower than annual production capacity due to a number of factors, including natural gas composition or the age of the facility’s catalyst.
2 The annual production capacity of New Zealand represents the two Motunui facilities and the Waitara Valley facility (refer to New Zealand section below). 3 On December 9, 2013, we completed a sale of 10% equity interest in the Egypt facility. Production figures prior to December 9, 2013 reflect a 60% interest.
New Zealand
Our New Zealand methanol facilities produced 542,000 tonnes of methanol in the fourth quarter of 2014 compared with
595,000 tonnes in the third quarter of 2014. Production in the fourth quarter of 2014 was interrupted due to a required
statutory pipeline inspection at the Motonui and Waitara Valley sites. In addition, we experienced some minor operating
issues. These facilities are able to produce up to 2.4 million tonnes annually, depending on natural gas composition.
Trinidad
In Trinidad, we own 100% of the Titan facility with an annual production capacity of 875,000 tonnes and have a 63.1%
interest in the Atlas facility with an annual production capacity of 1,125,000 tonnes (63.1% interest). The Titan facility
produced 127,000 tonnes in the fourth quarter of 2014 compared with 185,000 tonnes in the third quarter of 2014. The
Titan facility did not operate for approximately one month due to mechanical issues and a regional electricity outage.
The Atlas facility produced 233,000 tonnes in the fourth quarter of 2014 compared with 234,000 tonnes in the third quarter
of 2014. The regional electricity outage also impacted production at the Atlas facility in the fourth quarter of 2014. Gas
curtailments at both Titan and Atlas during the fourth quarter of 2014 were lower than in the third quarter of 2014.
We continue to experience some natural gas curtailments to our Trinidad facilities due to a mismatch between upstream
commitments to supply the Natural Gas Company of Trinidad and Tobago (NGC) and downstream demand from NGC’s
customers including Atlas and Titan, which becomes apparent when an upstream supplier has a technical issue or planned
maintenance that reduces gas delivery. We are engaged with key stakeholders to find a solution to this issue, but in the
meantime expect to continue to experience gas curtailments to the Trinidad site.
For the fourth quarter of 2014 we recorded Adjusted EBITDA of $150 million and Adjusted net income of $80 million
($0.85 per share on a diluted basis). This compares with Adjusted EBITDA of $137 million and Adjusted net income of $66
million ($0.69 per share on a diluted basis) for the third quarter of 2014.
For the fourth quarter of 2014, we reported net income attributable to Methanex shareholders of $133 million ($1.11 per
share on a diluted basis) compared with net income attributable to Methanex shareholders for the third quarter of 2014 of
$52 million ($0.54 income per share on a diluted basis).
We calculate Adjusted EBITDA and Adjusted net income by including amounts related to our equity share of the Atlas
(63.1% interest) and Egypt (50% interest) facilities and by excluding the mark-to-market impact of share-based
compensation as a result of changes in our share price and certain items which are considered by management to be non-
operational. Refer to Additional Information - Supplemental Non-GAAP Measures on page 14 for a further discussion on
how we calculate these measures. Our analysis of depreciation and amortization, finance costs, finance income and other
expenses and income taxes is consistent with the presentation of our consolidated statements of income and excludes
amounts related to Atlas.
A reconciliation from net income attributable to Methanex shareholders to Adjusted net income and the calculation of
Adjusted net income per common share is as follows: Three Months Ended Years Ended
($ millions except number of shares and per share amounts)
Dec 312014
Sep 302014
Dec 31 2013
Dec 312014
Dec 31 2013
Net income attributable to Methanex shareholders 133$ 52$ 128$ 455$ 329$ Mark-to-market impact of share-based
compensation, net of tax (53) 14 34 (31) 101 Argentina gas settlement, net of tax - - - (27) - Write-off of oil and gas rights, net of tax - - 5 - 19 Geismar project relocation expenses, net of tax - - - - 22
Adjusted net income 1 80$ 66$ 167$ 397$ 471$ Diluted weighted average shares outstanding (millions) 94 95 97 96 96
Adjusted net income per common share 1 0.85$ 0.69$ 1.72$ 4.12$ 4.88$ 1 These items are non-GAAP measures that do not have any standardized meaning prescribed by GAAP and therefore are unlikely to be comparable to similar
measures presented by other companies. Refer to Additional Information - Supplemental Non-GAAP Measures on page 14 for a description of each non-GAAP measure and reconciliations to the most comparable GAAP measures.
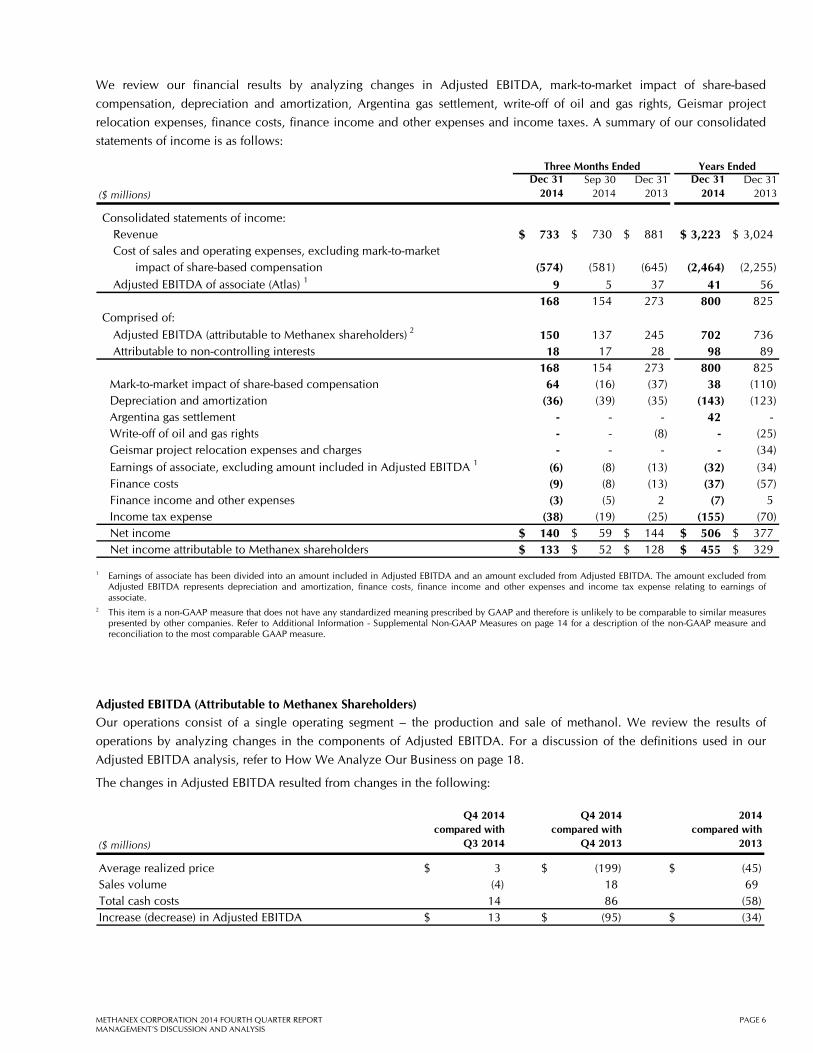
168 154 273 800 825 Mark-to-market impact of share-based compensation 64 (16) (37) 38 (110) Depreciation and amortization (36) (39) (35) (143) (123) Argentina gas settlement - - - 42 - Write-off of oil and gas rights - - (8) - (25) Geismar project relocation expenses and charges - - - - (34)
Earnings of associate, excluding amount included in Adjusted EBITDA 1 (6) (8) (13) (32) (34) Finance costs (9) (8) (13) (37) (57) Finance income and other expenses (3) (5) 2 (7) 5 Income tax expense (38) (19) (25) (155) (70) Net income 140$ 59$ 144$ 506$ 377$ Net income attributable to Methanex shareholders 133$ 52$ 128$ 455$ 329$
Three Months Ended
1 Earnings of associate has been divided into an amount included in Adjusted EBITDA and an amount excluded from Adjusted EBITDA. The amount excluded from
Adjusted EBITDA represents depreciation and amortization, finance costs, finance income and other expenses and income tax expense relating to earnings of associate.
2 This item is a non-GAAP measure that does not have any standardized meaning prescribed by GAAP and therefore is unlikely to be comparable to similar measures presented by other companies. Refer to Additional Information - Supplemental Non-GAAP Measures on page 14 for a description of the non-GAAP measure and reconciliation to the most comparable GAAP measure.
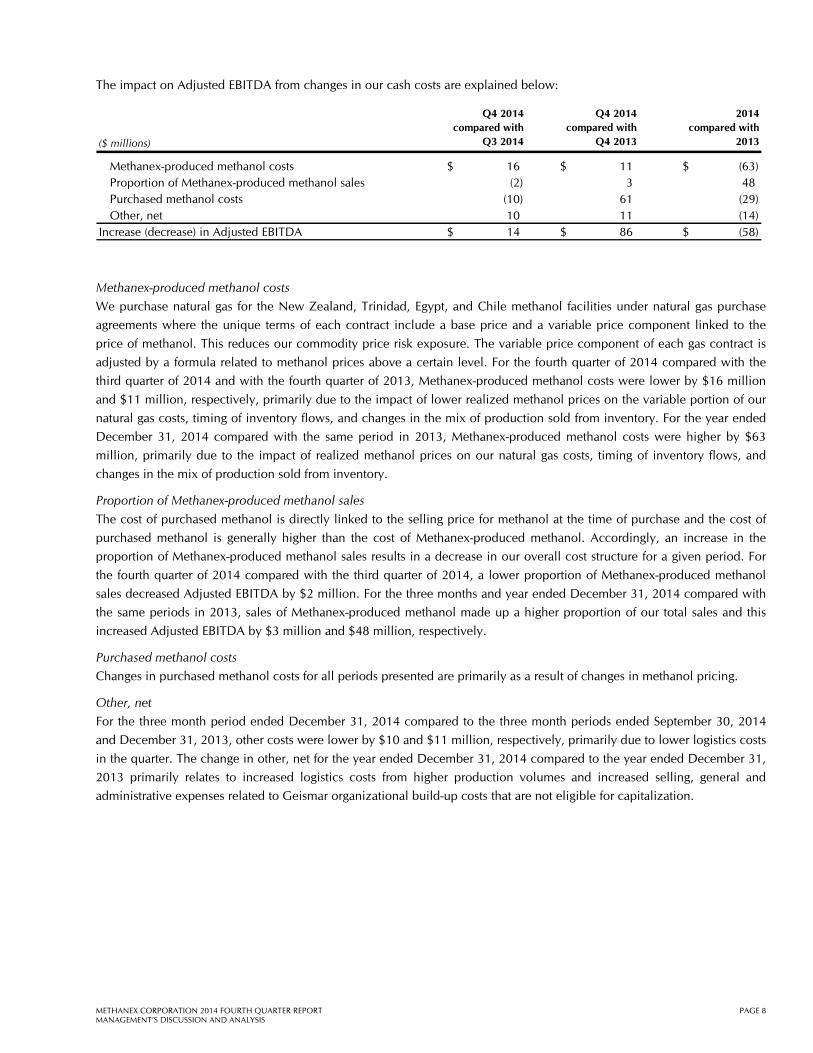
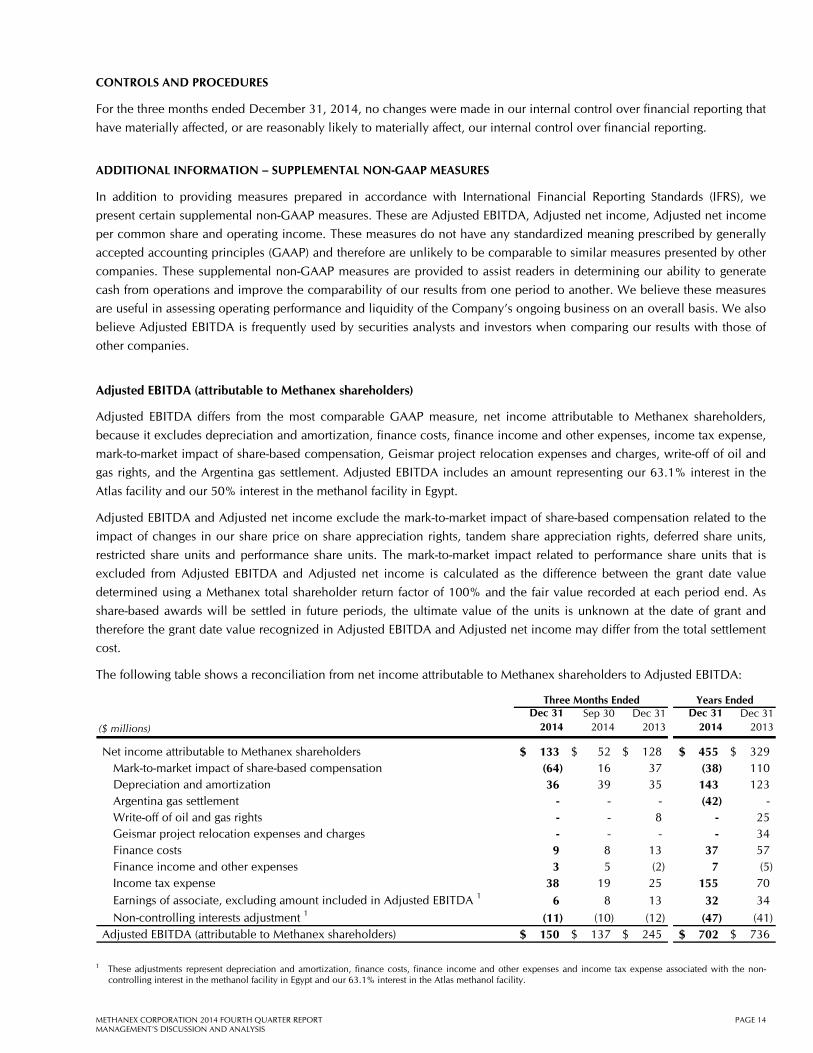
Adjusted EBITDA (Attributable to Methanex Shareholders) Our operations consist of a single operating segment – the production and sale of methanol. We review the results of
operations by analyzing changes in the components of Adjusted EBITDA. For a discussion of the definitions used in our
Adjusted EBITDA analysis, refer to How We Analyze Our Business on page 18.
The changes in Adjusted EBITDA resulted from changes in the following:
Finance income and other expenses (3) $ (5) $ 2 $ (7) $ 5 $
Three Months Ended
The change in finance income and other expenses for all periods presented was primarily due to the impact of changes in
foreign exchange rates.
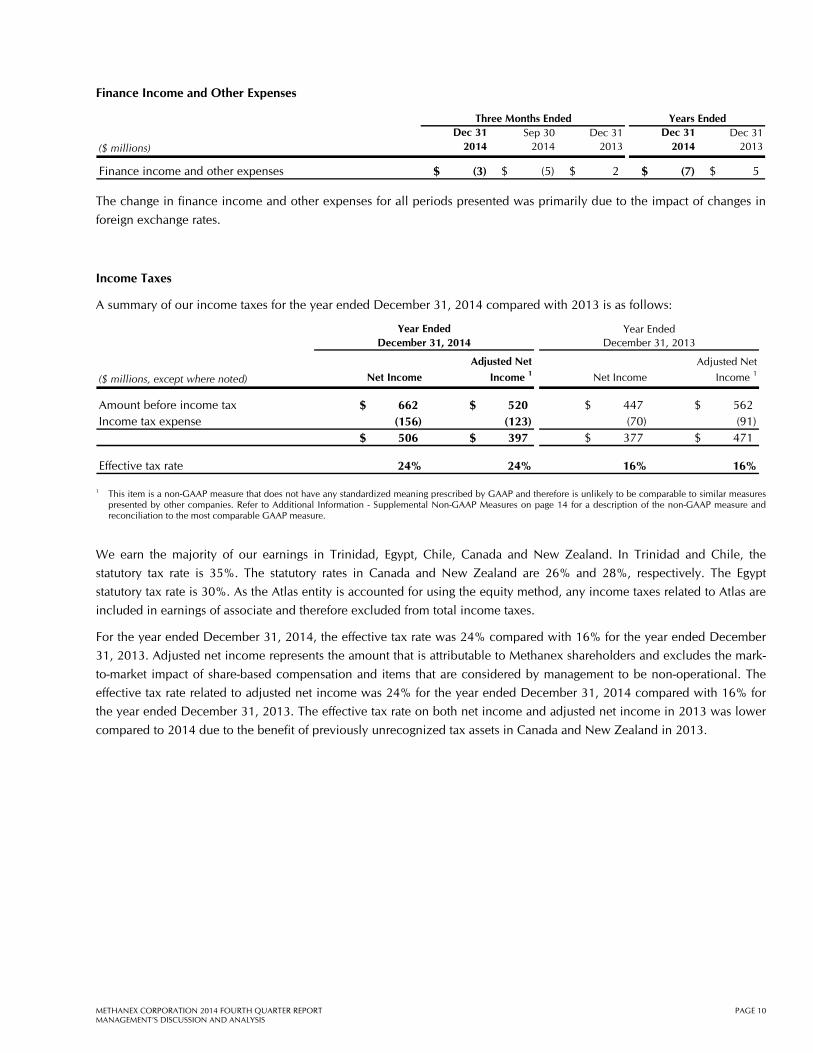
Income Taxes
A summary of our income taxes for the year ended December 31, 2014 compared with 2013 is as follows:
($ millions, except where noted) Net Income
Adjusted Net
Income 1 Net Income
Adjusted Net
Income 1
Amount before income tax 662 $ 520 $ 447 $ 562 $ Income tax expense (156) (123) (70) (91)
506 $ 397 $ 377 $ 471 $
Effective tax rate 24% 24% 16% 16%
Year Ended December 31, 2013
Year Ended December 31, 2014
1 This item is a non-GAAP measure that does not have any standardized meaning prescribed by GAAP and therefore is unlikely to be comparable to similar measures presented by other companies. Refer to Additional Information - Supplemental Non-GAAP Measures on page 14 for a description of the non-GAAP measure and reconciliation to the most comparable GAAP measure.
We earn the majority of our earnings in Trinidad, Egypt, Chile, Canada and New Zealand. In Trinidad and Chile, the
statutory tax rate is 35%. The statutory rates in Canada and New Zealand are 26% and 28%, respectively. The Egypt
statutory tax rate is 30%. As the Atlas entity is accounted for using the equity method, any income taxes related to Atlas are
included in earnings of associate and therefore excluded from total income taxes.
For the year ended December 31, 2014, the effective tax rate was 24% compared with 16% for the year ended December
31, 2013. Adjusted net income represents the amount that is attributable to Methanex shareholders and excludes the mark-
to-market impact of share-based compensation and items that are considered by management to be non-operational. The
effective tax rate related to adjusted net income was 24% for the year ended December 31, 2014 compared with 16% for
the year ended December 31, 2013. The effective tax rate on both net income and adjusted net income in 2013 was lower
compared to 2014 due to the benefit of previously unrecognized tax assets in Canada and New Zealand in 2013.
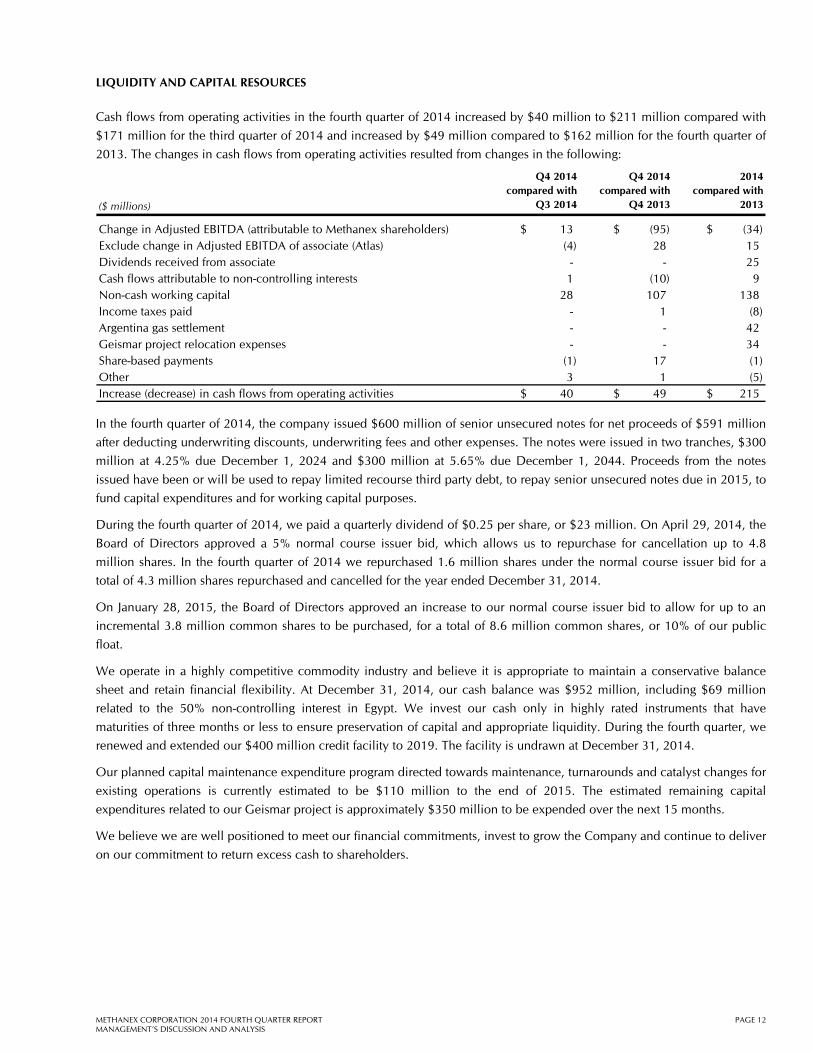
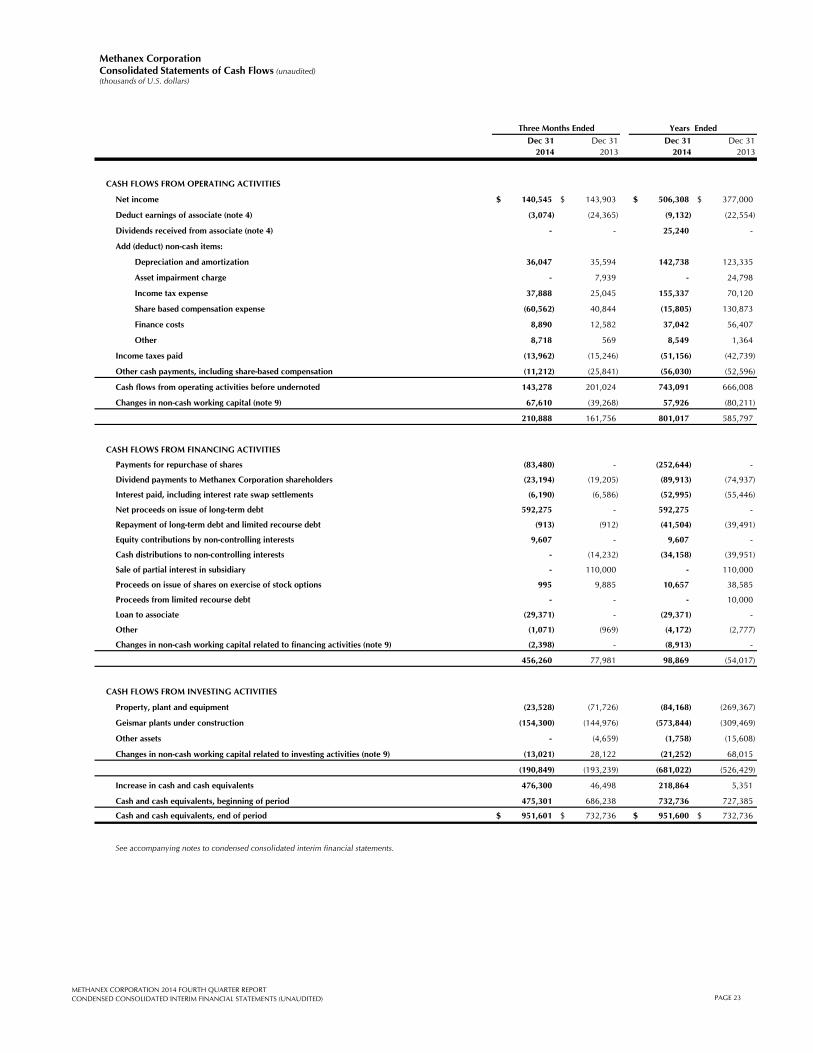
Cash flows from operating activities in the fourth quarter of 2014 increased by $40 million to $211 million compared with
$171 million for the third quarter of 2014 and increased by $49 million compared to $162 million for the fourth quarter of
2013. The changes in cash flows from operating activities resulted from changes in the following:
($ millions)
Q4 2014compared with
Q3 2014
Q4 2014compared with
Q4 2013
2014compared with
2013
Change in Adjusted EBITDA (attributable to Methanex shareholders) 13 $ (95) $ (34) $ Exclude change in Adjusted EBITDA of associate (Atlas) (4) 28 15 Dividends received from associate - - 25 Cash flows attributable to non-controlling interests 1 (10) 9 Non-cash working capital 28 107 138 Income taxes paid - 1 (8) Argentina gas settlement - - 42 Geismar project relocation expenses - - 34 Share-based payments (1) 17 (1) Other 3 1 (5) Increase (decrease) in cash flows from operating activities 40 $ 49 $ 215 $ In the fourth quarter of 2014, the company issued $600 million of senior unsecured notes for net proceeds of $591 million
after deducting underwriting discounts, underwriting fees and other expenses. The notes were issued in two tranches, $300
million at 4.25% due December 1, 2024 and $300 million at 5.65% due December 1, 2044. Proceeds from the notes
issued have been or will be used to repay limited recourse third party debt, to repay senior unsecured notes due in 2015, to
fund capital expenditures and for working capital purposes.
During the fourth quarter of 2014, we paid a quarterly dividend of $0.25 per share, or $23 million. On April 29, 2014, the
Board of Directors approved a 5% normal course issuer bid, which allows us to repurchase for cancellation up to 4.8
million shares. In the fourth quarter of 2014 we repurchased 1.6 million shares under the normal course issuer bid for a
total of 4.3 million shares repurchased and cancelled for the year ended December 31, 2014.
On January 28, 2015, the Board of Directors approved an increase to our normal course issuer bid to allow for up to an
incremental 3.8 million common shares to be purchased, for a total of 8.6 million common shares, or 10% of our public
float.
We operate in a highly competitive commodity industry and believe it is appropriate to maintain a conservative balance
sheet and retain financial flexibility. At December 31, 2014, our cash balance was $952 million, including $69 million
related to the 50% non-controlling interest in Egypt. We invest our cash only in highly rated instruments that have
maturities of three months or less to ensure preservation of capital and appropriate liquidity. During the fourth quarter, we
renewed and extended our $400 million credit facility to 2019. The facility is undrawn at December 31, 2014.
Our planned capital maintenance expenditure program directed towards maintenance, turnarounds and catalyst changes for
existing operations is currently estimated to be $110 million to the end of 2015. The estimated remaining capital
expenditures related to our Geismar project is approximately $350 million to be expended over the next 15 months.
We believe we are well positioned to meet our financial commitments, invest to grow the Company and continue to deliver
on our commitment to return excess cash to shareholders.
1 These adjustments represent depreciation and amortization, finance costs, finance income and other expenses and income tax expense associated with the non-controlling interest in the methanol facility in Egypt and our 63.1% interest in the Atlas methanol facility.
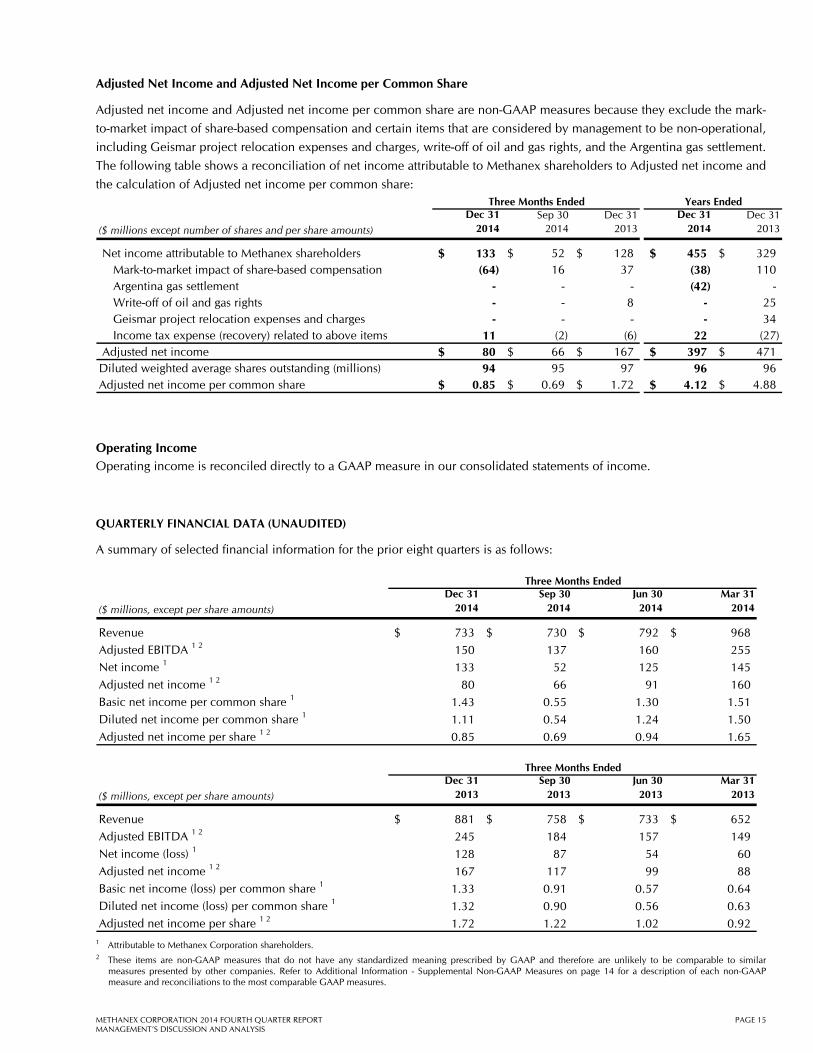
Adjusted Net Income and Adjusted Net Income per Common Share
Adjusted net income and Adjusted net income per common share are non-GAAP measures because they exclude the mark-
to-market impact of share-based compensation and certain items that are considered by management to be non-operational,
including Geismar project relocation expenses and charges, write-off of oil and gas rights, and the Argentina gas settlement.
The following table shows a reconciliation of net income attributable to Methanex shareholders to Adjusted net income and
the calculation of Adjusted net income per common share: Years Ended
($ millions except number of shares and per share amounts)
Dec 312014
Sep 302014
Dec 31 2013
Dec 312014
Dec 31 2013
Net income attributable to Methanex shareholders 133$ 52$ 128$ 455$ 329$ Mark-to-market impact of share-based compensation (64) 16 37 (38) 110 Argentina gas settlement - - - (42) - Write-off of oil and gas rights - - 8 - 25 Geismar project relocation expenses and charges - - - - 34 Income tax expense (recovery) related to above items 11 (2) (6) 22 (27)
Adjusted net income 80$ 66$ 167$ 397$ 471$ Diluted weighted average shares outstanding (millions) 94 95 97 96 96 Adjusted net income per common share 0.85$ 0.69$ 1.72$ 4.12$ 4.88$
Three Months Ended
Operating Income Operating income is reconciled directly to a GAAP measure in our consolidated statements of income.
QUARTERLY FINANCIAL DATA (UNAUDITED)
A summary of selected financial information for the prior eight quarters is as follows:
Three Months Ended
($ millions, except per share amounts)
Dec 312014
Sep 302014
Jun 302014
Mar 312014
Revenue 733$ 730$ 792$ 968$
Adjusted EBITDA 1 2 150 137 160 255 Net income 1 133 52 125 145
Adjusted net income 1 2 80 66 91 160
Basic net income per common share 1 1.43 0.55 1.30 1.51
Diluted net income per common share 1 1.11 0.54 1.24 1.50
Adjusted net income per share 1 2 0.85 0.69 0.94 1.65
Three Months Ended
($ millions, except per share amounts)
Dec 312013
Sep 302013
Jun 302013
Mar 312013
Revenue 881$ 758$ 733$ 652$
Adjusted EBITDA 1 2 245 184 157 149
Net income (loss) 1 128 87 54 60
Adjusted net income 1 2 167 117 99 88
Basic net income (loss) per common share 1 1.33 0.91 0.57 0.64
Diluted net income (loss) per common share 1 1.32 0.90 0.56 0.63
Adjusted net income per share 1 2 1.72 1.22 1.02 0.92
1 Attributable to Methanex Corporation shareholders. 2 These items are non-GAAP measures that do not have any standardized meaning prescribed by GAAP and therefore are unlikely to be comparable to similar
measures presented by other companies. Refer to Additional Information - Supplemental Non-GAAP Measures on page 14 for a description of each non-GAAP measure and reconciliations to the most comparable GAAP measures.
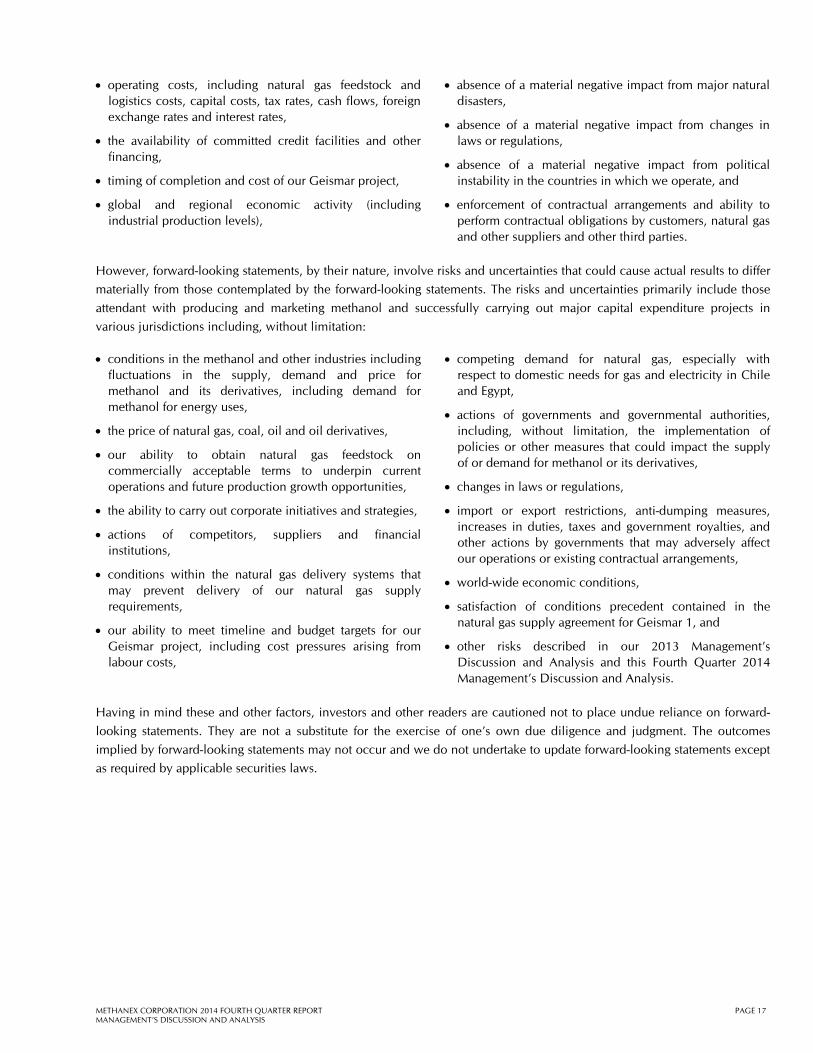
More particularly and without limitation, any statements regarding the following are forward-looking statements:
expected demand for methanol and its derivatives,
expected new methanol supply or restart of idled capacity and timing for start-up of the same,
expected shutdowns (either temporary or permanent) or restarts of existing methanol supply (including our own facilities), including, without limitation, the timing and length of planned maintenance outages,
expected methanol and energy prices,
expected levels of methanol purchases from traders or other third parties,
expected levels, timing and availability of economically priced natural gas supply to each of our plants,
capital committed by third parties towards future natural gas exploration and development in the vicinity of our plants,
our expected capital expenditures,
anticipated operating rates of our plants,
expected operating costs, including natural gas feedstock costs and logistics costs,
expected tax rates or resolutions to tax disputes,
expected cash flows, earnings capability and share price,
availability of committed credit facilities and other financing,
our ability to meet covenants or obtain or continue to obtain waivers associated with our long-term debt obligations, including, without limitation, the Egypt limited recourse debt facilities that have conditions associated with the payment of cash or other distributions and the finalization of certain land title registrations and related mortgages that require action by Egyptian governmental entities,
expected impact on our results of operations in Egypt or our financial condition as a consequence of civil unrest or actions taken or inaction by the Government of Egypt and its agencies,
our shareholder distribution strategy and anticipated distributions to shareholders,
commercial viability and timing of, or our ability to execute, future projects, plant restarts, capacity expansions, plant relocations, or other business initiatives or opportunities, including the planned relocation of idle Chile methanol plants to Geismar, Louisiana,
our financial strength and ability to meet future financial commitments,
expected global or regional economic activity (including industrial production levels),
expected outcomes of litigation or other disputes, claims and assessments, and
expected actions of governments, government agencies, gas suppliers, courts, tribunals or other third parties.
We believe that we have a reasonable basis for making such forward-looking statements. The forward-looking statements in
this document are based on our experience, our perception of trends, current conditions and expected future developments
as well as other factors. Certain material factors or assumptions were applied in drawing the conclusions or making the
forecasts or projections that are included in these forward-looking statements, including, without limitation, future
expectations and assumptions concerning the following:
the supply of, demand for and price of methanol, methanol derivatives, natural gas, coal, oil and oil derivatives,
our ability to procure natural gas feedstock on commercially acceptable terms,
operating rates of our facilities,
receipt or issuance of third-party consents or approvals, including, without limitation, governmental registrations of land title and related mortgages in Egypt and governmental approvals related to rights to purchase natural gas,
operating costs, including natural gas feedstock and logistics costs, capital costs, tax rates, cash flows, foreign exchange rates and interest rates,
the availability of committed credit facilities and other financing,
timing of completion and cost of our Geismar project,
global and regional economic activity (including industrial production levels),
absence of a material negative impact from major natural disasters,
absence of a material negative impact from changes in laws or regulations,
absence of a material negative impact from political instability in the countries in which we operate, and
enforcement of contractual arrangements and ability to perform contractual obligations by customers, natural gas and other suppliers and other third parties.
However, forward-looking statements, by their nature, involve risks and uncertainties that could cause actual results to differ
materially from those contemplated by the forward-looking statements. The risks and uncertainties primarily include those
attendant with producing and marketing methanol and successfully carrying out major capital expenditure projects in
various jurisdictions including, without limitation:
conditions in the methanol and other industries including fluctuations in the supply, demand and price for methanol and its derivatives, including demand for methanol for energy uses,
the price of natural gas, coal, oil and oil derivatives,
our ability to obtain natural gas feedstock on commercially acceptable terms to underpin current operations and future production growth opportunities,
the ability to carry out corporate initiatives and strategies,
actions of competitors, suppliers and financial institutions,
conditions within the natural gas delivery systems that may prevent delivery of our natural gas supply requirements,
our ability to meet timeline and budget targets for our Geismar project, including cost pressures arising from labour costs,
competing demand for natural gas, especially with respect to domestic needs for gas and electricity in Chile and Egypt,
actions of governments and governmental authorities, including, without limitation, the implementation of policies or other measures that could impact the supply of or demand for methanol or its derivatives,
changes in laws or regulations,
import or export restrictions, anti-dumping measures, increases in duties, taxes and government royalties, and other actions by governments that may adversely affect our operations or existing contractual arrangements,
world-wide economic conditions,
satisfaction of conditions precedent contained in the natural gas supply agreement for Geismar 1, and
other risks described in our 2013 Management’s Discussion and Analysis and this Fourth Quarter 2014 Management’s Discussion and Analysis.
Having in mind these and other factors, investors and other readers are cautioned not to place undue reliance on forward-
looking statements. They are not a substitute for the exercise of one’s own due diligence and judgment. The outcomes
implied by forward-looking statements may not occur and we do not undertake to update forward-looking statements except
Methanex Corporation Notes to Condensed Consolidated Interim Financial Statements (unaudited)
Except where otherwise noted, tabular dollar amounts are stated in thousands of U.S. dollars.
1. Basis of presentation:
Methanex Corporation (the Company) is an incorporated entity with corporate offices in Vancouver, Canada. The Company’s operations consist of the production and sale of methanol, a commodity chemical. The Company is the world’s largest producer and supplier of methanol to the major international markets of Asia Pacific, North America, Europe and South America.
These condensed consolidated interim financial statements are prepared in accordance with International Accounting Standards (IAS) 34, Interim Financial Reporting, as issued by the International Accounting Standards Board (IASB) on a basis consistent with those followed in the most recent annual consolidated financial statements.
These condensed consolidated interim financial statements do not include all of the information required for full annual financial statements and were approved and authorized for issue by the Audit, Finance & Risk Committee of the Board of Directors on January 28, 2015.
These condensed consolidated interim financial statements should be read in conjunction with the Company’s consolidated financial statements for the year ended December 31, 2013.
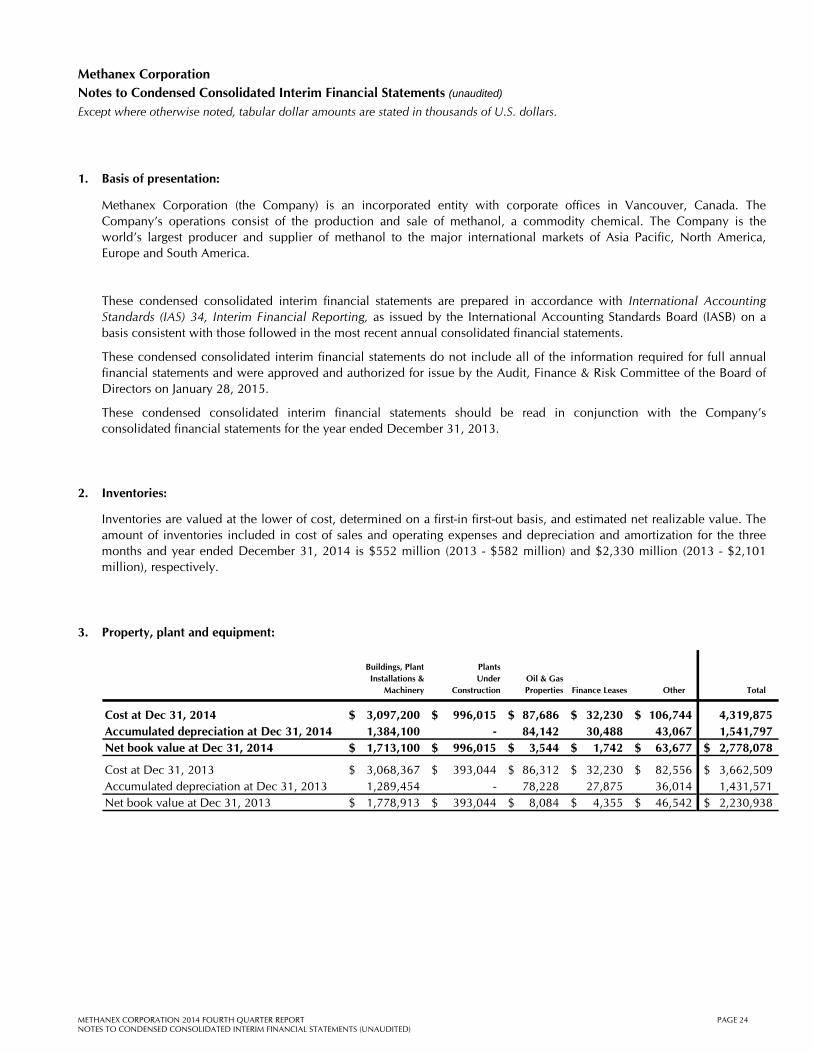
2. Inventories:
Inventories are valued at the lower of cost, determined on a first-in first-out basis, and estimated net realizable value. The amount of inventories included in cost of sales and operating expenses and depreciation and amortization for the three months and year ended December 31, 2014 is $552 million (2013 - $582 million) and $2,330 million (2013 - $2,101 million), respectively.
3. Property, plant and equipment:
Buildings, Plant Installations &
Machinery
PlantsUnder
Construction Oil & Gas Properties Finance Leases Other Total
Cost at Dec 31, 2014 3,097,200$ 996,015$ 87,686$ 32,230$ 106,744$ 4,319,875 Accumulated depreciation at Dec 31, 2014 1,384,100 - 84,142 30,488 43,067 1,541,797 Net book value at Dec 31, 2014 1,713,100$ 996,015$ 3,544$ 1,742$ 63,677$ 2,778,078$
Cost at Dec 31, 2013 3,068,367$ 393,044$ 86,312$ 32,230$ 82,556$ 3,662,509$ Accumulated depreciation at Dec 31, 2013 1,289,454 - 78,228 27,875 36,014 1,431,571 Net book value at Dec 31, 2013 1,778,913$ 393,044$ 8,084$ 4,355$ 46,542$ 2,230,938$
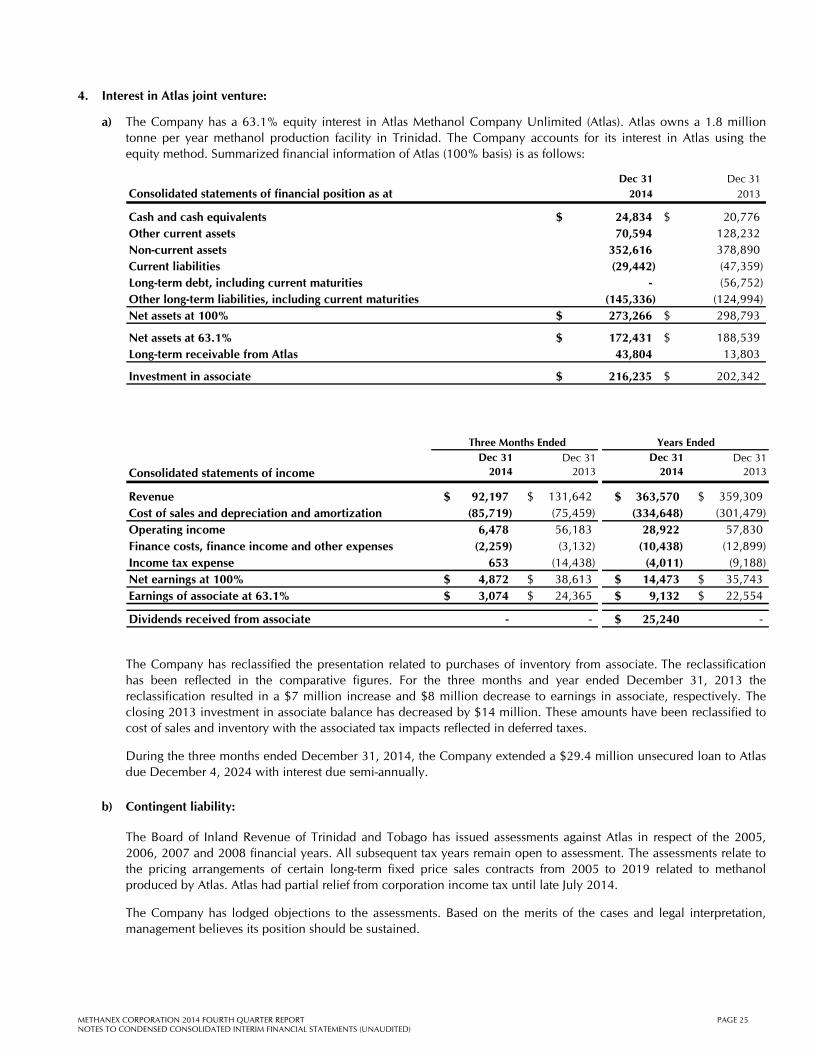
a) The Company has a 63.1% equity interest in Atlas Methanol Company Unlimited (Atlas). Atlas owns a 1.8 million tonne per year methanol production facility in Trinidad. The Company accounts for its interest in Atlas using the equity method. Summarized financial information of Atlas (100% basis) is as follows:
Dec 31 Dec 31Consolidated statements of financial position as at 2014 2013
Cash and cash equivalents 24,834$ 20,776$ Other current assets 70,594 128,232 Non-current assets 352,616 378,890 Current liabilities (29,442) (47,359) Long-term debt, including current maturities - (56,752) Other long-term liabilities, including current maturities (145,336) (124,994) Net assets at 100% 273,266$ 298,793$
Net assets at 63.1% 172,431$ 188,539$ Long-term receivable from Atlas 43,804 13,803
Investment in associate 216,235$ 202,342$
Three Months Ended Years Ended
Consolidated statements of incomeDec 31
2014Dec 31
2013Dec 31
2014Dec 31
2013
Revenue 92,197 $ 131,642 $ 363,570 $ 359,309 $ Cost of sales and depreciation and amortization (85,719) (75,459) (334,648) (301,479) Operating income 6,478 56,183 28,922 57,830 Finance costs, finance income and other expenses (2,259) (3,132) (10,438) (12,899) Income tax expense 653 (14,438) (4,011) (9,188) Net earnings at 100% 4,872 $ 38,613 $ 14,473 $ 35,743 $ Earnings of associate at 63.1% 3,074 $ 24,365 $ 9,132 $ 22,554 $
Dividends received from associate - - 25,240 $ -
The Company has reclassified the presentation related to purchases of inventory from associate. The reclassification has been reflected in the comparative figures. For the three months and year ended December 31, 2013 the reclassification resulted in a $7 million increase and $8 million decrease to earnings in associate, respectively. The closing 2013 investment in associate balance has decreased by $14 million. These amounts have been reclassified to cost of sales and inventory with the associated tax impacts reflected in deferred taxes.
During the three months ended December 31, 2014, the Company extended a $29.4 million unsecured loan to Atlas due December 4, 2024 with interest due semi-annually.
b) Contingent liability:
The Board of Inland Revenue of Trinidad and Tobago has issued assessments against Atlas in respect of the 2005, 2006, 2007 and 2008 financial years. All subsequent tax years remain open to assessment. The assessments relate to the pricing arrangements of certain long-term fixed price sales contracts from 2005 to 2019 related to methanol produced by Atlas. Atlas had partial relief from corporation income tax until late July 2014.
The Company has lodged objections to the assessments. Based on the merits of the cases and legal interpretation, management believes its position should be sustained.
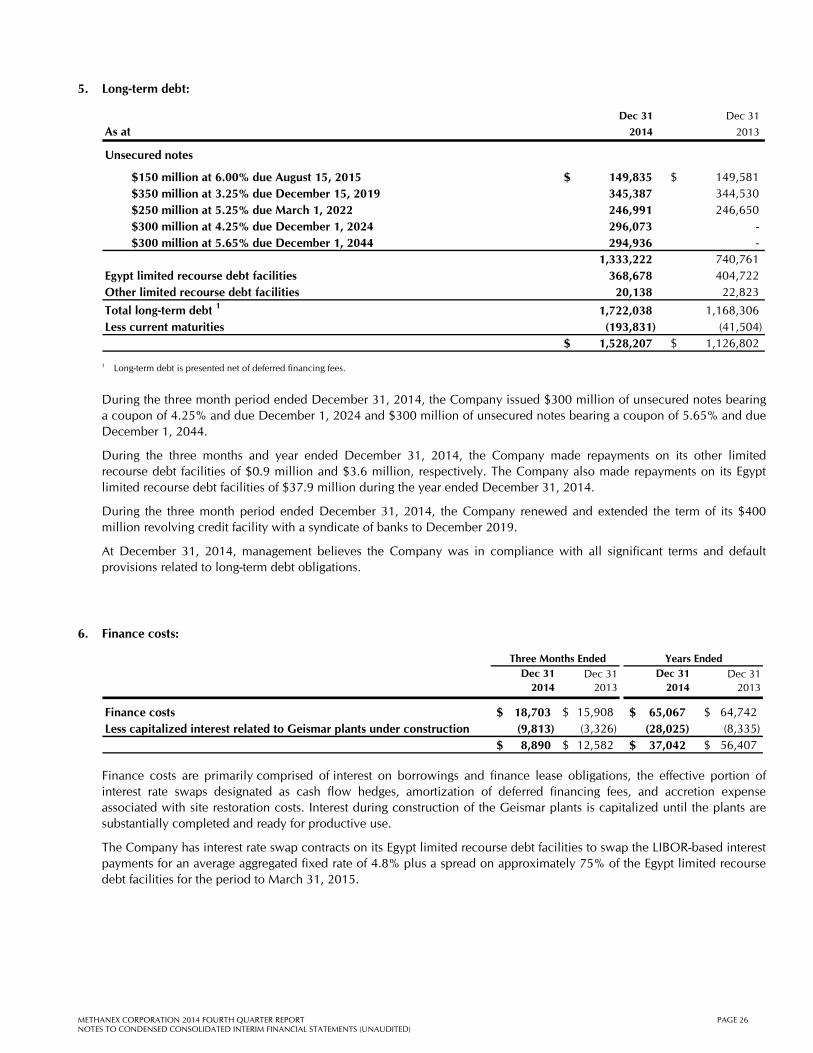
$150 million at 6.00% due August 15, 2015 149,835 $ 149,581 $ $350 million at 3.25% due December 15, 2019 345,387 344,530 $250 million at 5.25% due March 1, 2022 246,991 246,650 $300 million at 4.25% due December 1, 2024 296,073 - $300 million at 5.65% due December 1, 2044 294,936 -
Total long-term debt 1 1,722,038 1,168,306 Less current maturities (193,831) (41,504)
1,528,207 $ 1,126,802 $ 1 Long-term debt is presented net of deferred financing fees. During the three month period ended December 31, 2014, the Company issued $300 million of unsecured notes bearing a coupon of 4.25% and due December 1, 2024 and $300 million of unsecured notes bearing a coupon of 5.65% and due December 1, 2044.
During the three months and year ended December 31, 2014, the Company made repayments on its other limited recourse debt facilities of $0.9 million and $3.6 million, respectively. The Company also made repayments on its Egypt limited recourse debt facilities of $37.9 million during the year ended December 31, 2014.
During the three month period ended December 31, 2014, the Company renewed and extended the term of its $400 million revolving credit facility with a syndicate of banks to December 2019.
At December 31, 2014, management believes the Company was in compliance with all significant terms and default provisions related to long-term debt obligations.
6. Finance costs:
Three Months Ended Years EndedDec 31
2014Dec 31
2013Dec 31
2014Dec 31
2013
Finance costs 18,703$ 15,908$ 65,067$ 64,742 $ Less capitalized interest related to Geismar plants under construction (9,813) (3,326) (28,025) (8,335)
8,890$ 12,582$ 37,042$ 56,407 $
Finance costs are primarily comprised of interest on borrowings and finance lease obligations, the effective portion of interest rate swaps designated as cash flow hedges, amortization of deferred financing fees, and accretion expense associated with site restoration costs. Interest during construction of the Geismar plants is capitalized until the plants are substantially completed and ready for productive use.
The Company has interest rate swap contracts on its Egypt limited recourse debt facilities to swap the LIBOR-based interest payments for an average aggregated fixed rate of 4.8% plus a spread on approximately 75% of the Egypt limited recourse debt facilities for the period to March 31, 2015.
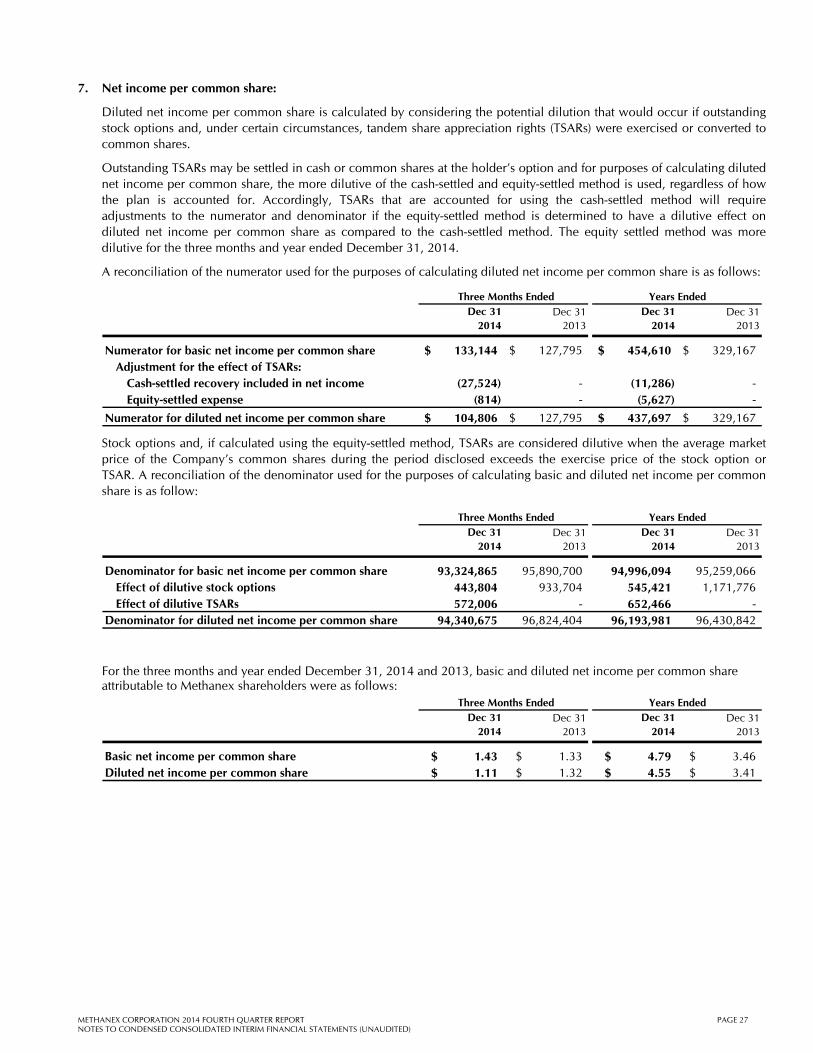
Diluted net income per common share is calculated by considering the potential dilution that would occur if outstanding stock options and, under certain circumstances, tandem share appreciation rights (TSARs) were exercised or converted to common shares.
Outstanding TSARs may be settled in cash or common shares at the holder’s option and for purposes of calculating diluted net income per common share, the more dilutive of the cash-settled and equity-settled method is used, regardless of how the plan is accounted for. Accordingly, TSARs that are accounted for using the cash-settled method will require adjustments to the numerator and denominator if the equity-settled method is determined to have a dilutive effect on diluted net income per common share as compared to the cash-settled method. The equity settled method was more dilutive for the three months and year ended December 31, 2014.
A reconciliation of the numerator used for the purposes of calculating diluted net income per common share is as follows:
Three Months Ended Years EndedDec 31
2014Dec 31
2013Dec 31
2014Dec 31
2013
Numerator for basic net income per common share 133,144$ 127,795$ 454,610$ 329,167$ Adjustment for the effect of TSARs:
Cash-settled recovery included in net income (27,524) - (11,286) - Equity-settled expense (814) - (5,627) -
Numerator for diluted net income per common share 104,806$ 127,795$ 437,697$ 329,167$
Stock options and, if calculated using the equity-settled method, TSARs are considered dilutive when the average market price of the Company’s common shares during the period disclosed exceeds the exercise price of the stock option or TSAR. A reconciliation of the denominator used for the purposes of calculating basic and diluted net income per common share is as follow:
Three Months Ended Years EndedDec 31
2014Dec 31
2013Dec 31
2014Dec 31
2013
Denominator for basic net income per common share 93,324,865 95,890,700 94,996,094 95,259,066 Effect of dilutive stock options 443,804 933,704 545,421 1,171,776 Effect of dilutive TSARs 572,006 - 652,466 -
Denominator for diluted net income per common share 94,340,675 96,824,404 96,193,981 96,430,842
For the three months and year ended December 31, 2014 and 2013, basic and diluted net income per common share attributable to Methanex shareholders were as follows:
Three Months Ended Years EndedDec 31
2014Dec 31
2013Dec 31
2014Dec 31
2013
Basic net income per common share 1.43 $ 1.33 $ 4.79 $ 3.46 $ Diluted net income per common share 1.11 $ 1.32 $ 4.55 $ 3.41 $
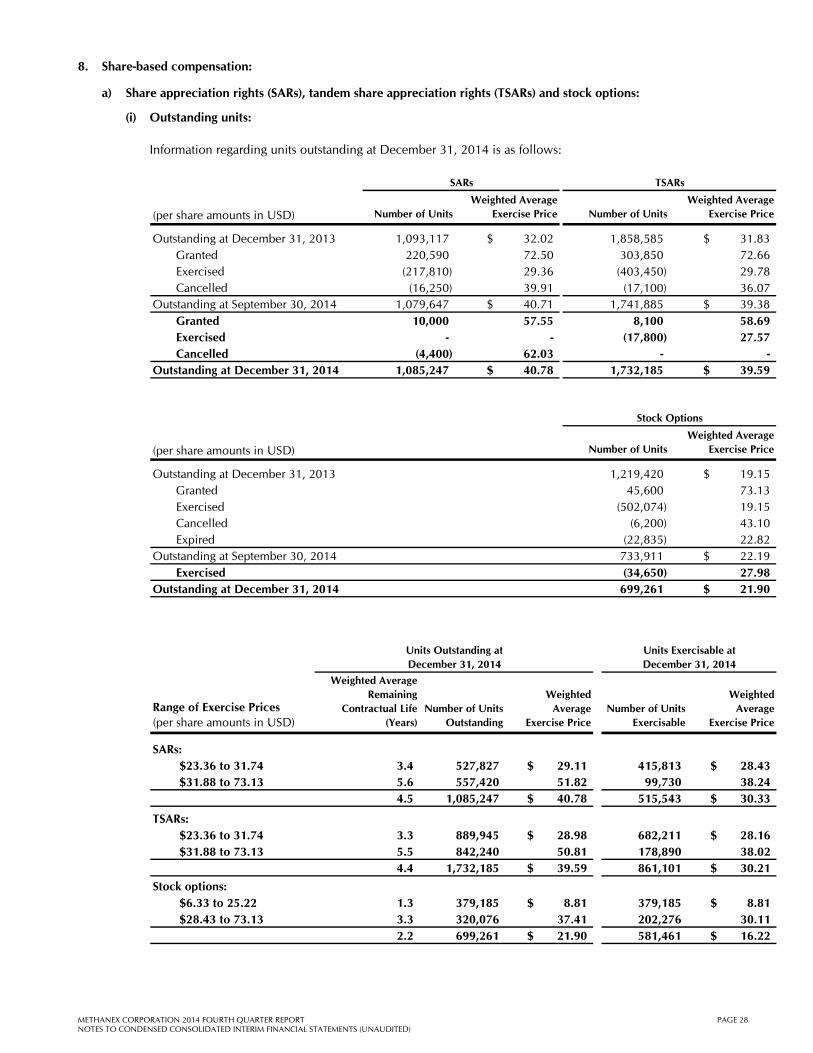
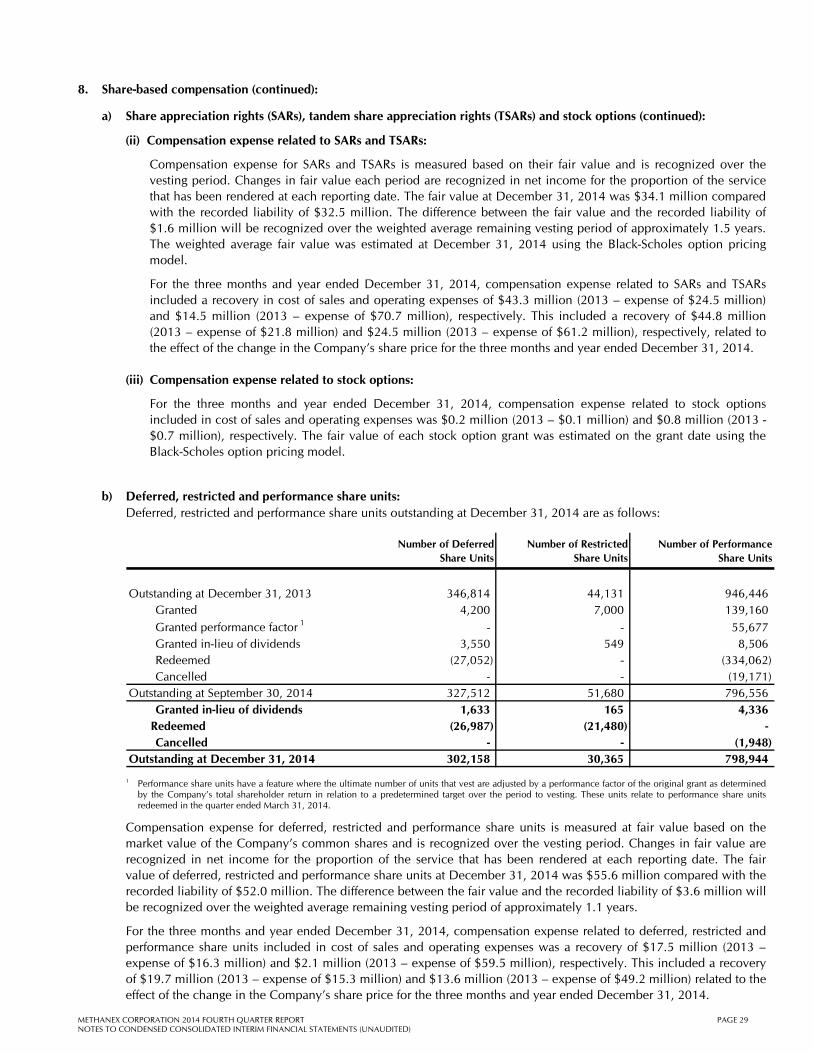
a) Share appreciation rights (SARs), tandem share appreciation rights (TSARs) and stock options (continued):
(ii) Compensation expense related to SARs and TSARs:
Compensation expense for SARs and TSARs is measured based on their fair value and is recognized over the vesting period. Changes in fair value each period are recognized in net income for the proportion of the service that has been rendered at each reporting date. The fair value at December 31, 2014 was $34.1 million compared with the recorded liability of $32.5 million. The difference between the fair value and the recorded liability of $1.6 million will be recognized over the weighted average remaining vesting period of approximately 1.5 years. The weighted average fair value was estimated at December 31, 2014 using the Black-Scholes option pricing model.
For the three months and year ended December 31, 2014, compensation expense related to SARs and TSARs included a recovery in cost of sales and operating expenses of $43.3 million (2013 – expense of $24.5 million) and $14.5 million (2013 – expense of $70.7 million), respectively. This included a recovery of $44.8 million (2013 – expense of $21.8 million) and $24.5 million (2013 – expense of $61.2 million), respectively, related to the effect of the change in the Company’s share price for the three months and year ended December 31, 2014.
(iii) Compensation expense related to stock options:
For the three months and year ended December 31, 2014, compensation expense related to stock options included in cost of sales and operating expenses was $0.2 million (2013 – $0.1 million) and $0.8 million (2013 - $0.7 million), respectively. The fair value of each stock option grant was estimated on the grant date using the Black-Scholes option pricing model.
b) Deferred, restricted and performance share units: Deferred, restricted and performance share units outstanding at December 31, 2014 are as follows:
Number of Deferred Share Units
Number of Restricted Share Units
Number of Performance Share Units
Outstanding at December 31, 2013 346,814 44,131 946,446 Granted 4,200 7,000 139,160
Granted performance factor 1 - - 55,677 Granted in-lieu of dividends 3,550 549 8,506 Redeemed (27,052) - (334,062) Cancelled - - (19,171) Outstanding at September 30, 2014 327,512 51,680 796,556 Granted in-lieu of dividends 1,633 165 4,336
Redeemed (26,987) (21,480) - Cancelled - - (1,948) Outstanding at December 31, 2014 302,158 30,365 798,944
1 Performance share units have a feature where the ultimate number of units that vest are adjusted by a performance factor of the original grant as determined
by the Company’s total shareholder return in relation to a predetermined target over the period to vesting. These units relate to performance share units redeemed in the quarter ended March 31, 2014.
Compensation expense for deferred, restricted and performance share units is measured at fair value based on the market value of the Company’s common shares and is recognized over the vesting period. Changes in fair value are recognized in net income for the proportion of the service that has been rendered at each reporting date. The fair value of deferred, restricted and performance share units at December 31, 2014 was $55.6 million compared with the recorded liability of $52.0 million. The difference between the fair value and the recorded liability of $3.6 million will be recognized over the weighted average remaining vesting period of approximately 1.1 years.
For the three months and year ended December 31, 2014, compensation expense related to deferred, restricted and performance share units included in cost of sales and operating expenses was a recovery of $17.5 million (2013 – expense of $16.3 million) and $2.1 million (2013 – expense of $59.5 million), respectively. This included a recovery of $19.7 million (2013 – expense of $15.3 million) and $13.6 million (2013 – expense of $49.2 million) related to the effect of the change in the Company’s share price for the three months and year ended December 31, 2014.
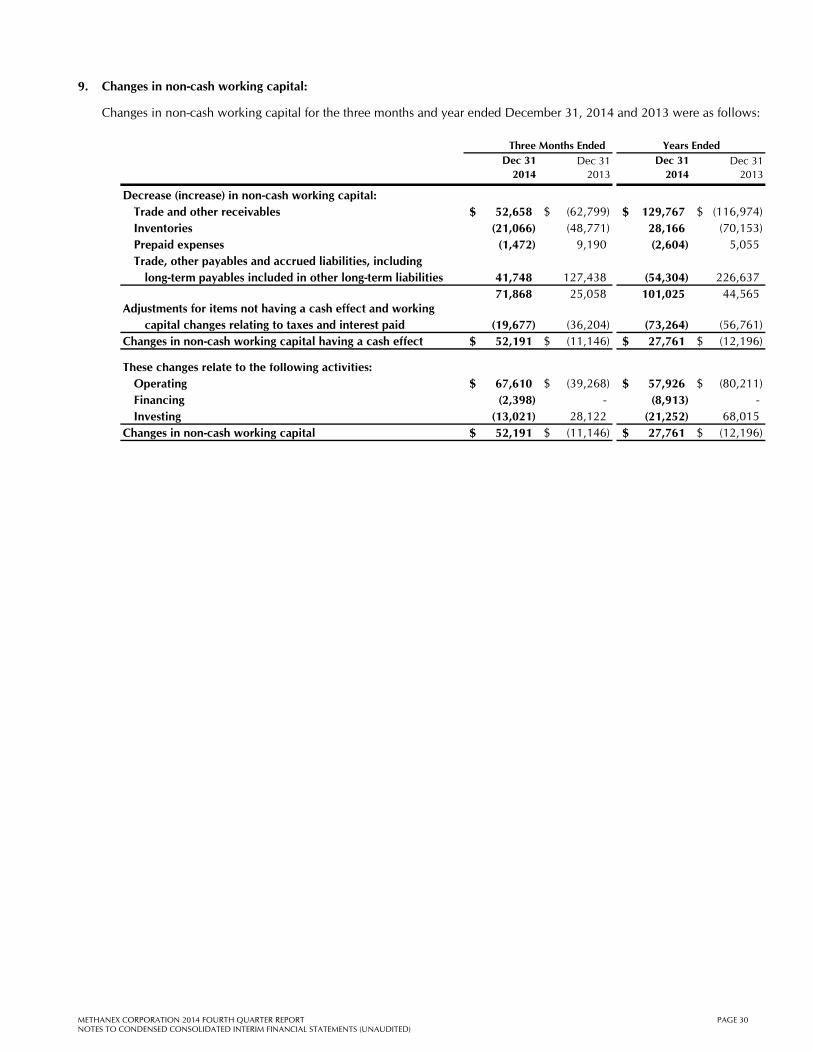
Changes in non-cash working capital for the three months and year ended December 31, 2014 and 2013 were as follows:
Three Months Ended Years EndedDec 31
2014Dec 31
2013Dec 31
2014Dec 31
2013
Decrease (increase) in non-cash working capital:Trade and other receivables 52,658$ (62,799)$ 129,767$ (116,974)$ Inventories (21,066) (48,771) 28,166 (70,153) Prepaid expenses (1,472) 9,190 (2,604) 5,055 Trade, other payables and accrued liabilities, including
long-term payables included in other long-term liabilities 41,748 127,438 (54,304) 226,637 71,868 25,058 101,025 44,565
Adjustments for items not having a cash effect and workingcapital changes relating to taxes and interest paid (19,677) (36,204) (73,264) (56,761)
Changes in non-cash working capital having a cash effect 52,191$ (11,146)$ 27,761$ (12,196)$
These changes relate to the following activities:Operating 67,610$ (39,268)$ 57,926$ (80,211)$ Financing (2,398) - (8,913) - Investing (13,021) 28,122 (21,252) 68,015
Changes in non-cash working capital 52,191$ (11,146)$ 27,761$ (12,196)$
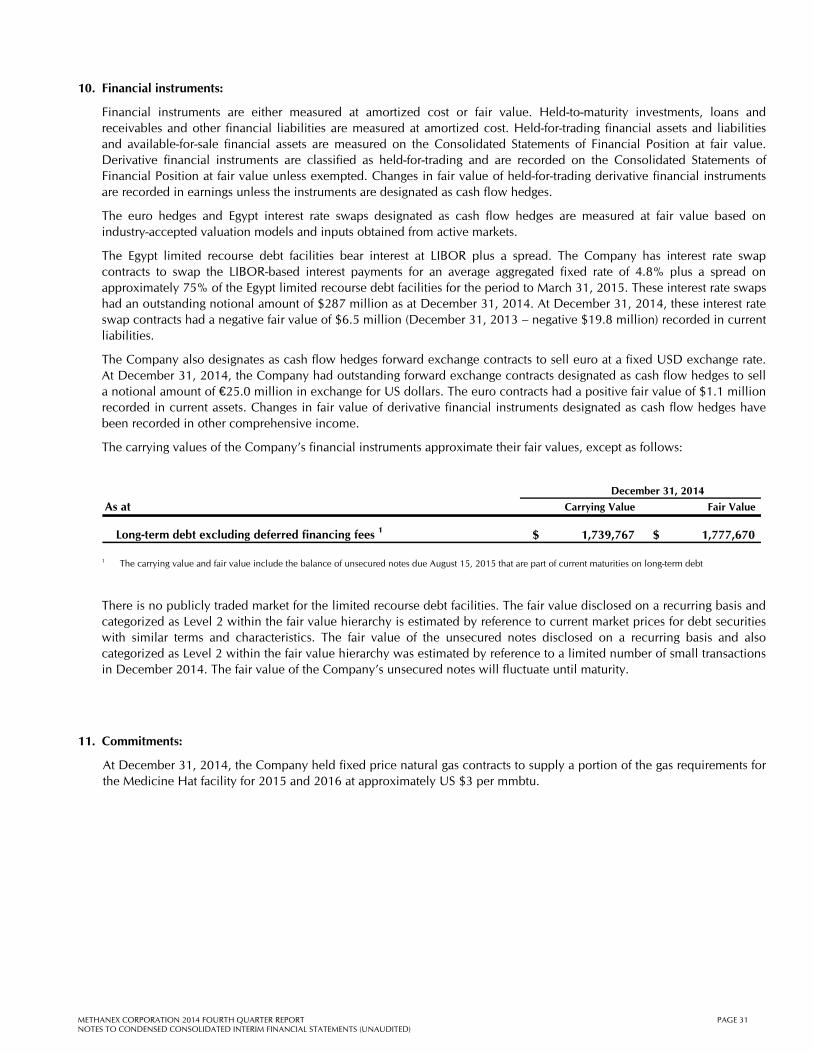
Financial instruments are either measured at amortized cost or fair value. Held-to-maturity investments, loans and receivables and other financial liabilities are measured at amortized cost. Held-for-trading financial assets and liabilities and available-for-sale financial assets are measured on the Consolidated Statements of Financial Position at fair value. Derivative financial instruments are classified as held-for-trading and are recorded on the Consolidated Statements of Financial Position at fair value unless exempted. Changes in fair value of held-for-trading derivative financial instruments are recorded in earnings unless the instruments are designated as cash flow hedges.
The euro hedges and Egypt interest rate swaps designated as cash flow hedges are measured at fair value based on industry-accepted valuation models and inputs obtained from active markets.
The Egypt limited recourse debt facilities bear interest at LIBOR plus a spread. The Company has interest rate swap contracts to swap the LIBOR-based interest payments for an average aggregated fixed rate of 4.8% plus a spread on approximately 75% of the Egypt limited recourse debt facilities for the period to March 31, 2015. These interest rate swaps had an outstanding notional amount of $287 million as at December 31, 2014. At December 31, 2014, these interest rate swap contracts had a negative fair value of $6.5 million (December 31, 2013 – negative $19.8 million) recorded in current liabilities.
The Company also designates as cash flow hedges forward exchange contracts to sell euro at a fixed USD exchange rate. At December 31, 2014, the Company had outstanding forward exchange contracts designated as cash flow hedges to sell a notional amount of €25.0 million in exchange for US dollars. The euro contracts had a positive fair value of $1.1 million recorded in current assets. Changes in fair value of derivative financial instruments designated as cash flow hedges have been recorded in other comprehensive income.
The carrying values of the Company’s financial instruments approximate their fair values, except as follows:
1 The carrying value and fair value include the balance of unsecured notes due August 15, 2015 that are part of current maturities on long-term debt
There is no publicly traded market for the limited recourse debt facilities. The fair value disclosed on a recurring basis and categorized as Level 2 within the fair value hierarchy is estimated by reference to current market prices for debt securities with similar terms and characteristics. The fair value of the unsecured notes disclosed on a recurring basis and also categorized as Level 2 within the fair value hierarchy was estimated by reference to a limited number of small transactions in December 2014. The fair value of the Company’s unsecured notes will fluctuate until maturity.
11. Commitments:
At December 31, 2014, the Company held fixed price natural gas contracts to supply a portion of the gas requirements for the Medicine Hat facility for 2015 and 2016 at approximately US $3 per mmbtu.
Basic net income (loss) 4.79 1.43 0.55 1.30 1.51 3.46 1.33 0.91 0.57 0.64 (0.73) (1.49) (0.03) 0.56 0.24
Diluted net income (loss) 4.55 1.11 0.54 1.24 1.50 3.41 1.32 0.90 0.56 0.63 (0.73) (1.49) (0.03) 0.50 0.23
Adjusted net income 5 4.12 0.85 0.69 0.94 1.65 4.88 1.72 1.22 1.02 0.92 1.90 0.64 0.38 0.47 0.41
1 Methanex-produced methanol includes volumes produced by Chile using natural gas supplied from Argentina under a tolling arrangement. Commission sales represent volumes
marketed on a commission basis related to the 36.9% of the Atlas methanol facility and the portion of the Egypt methanol facility that we do not own.
2 On December 9, 2013, we completed a sale of 10% equity interest in the Egypt facility. Production figures prior to December 9, 2013 reflect a 60% interest.
3 Average realized price is calculated as revenue, excluding commissions earned and the Egypt non-controlling interest share of revenue but including an amount representing
our share of Atlas revenue, divided by the total sales volumes of Methanex-produced (attributable to Methanex shareholders) and purchased methanol.
4 Per share information calculated using amounts attributable to Methanex shareholders.
5 This item is a non-GAAP measure that does not have any standardized meaning prescribed by GAAP and therefore is unlikely to be comparable to similar measures
presented by other companies. Refer to Additional Information - Supplemental Non-GAAP Measures on page 14 for a description of the non-GAAP measure and
reconciliation to the most comparable GAAP measure.
METHANEX CORPORATION 2014 FOURTH QUARTER REPORTQUARTERLY HISTORY