22
Measurement of Disability through Census National Experiences: INDIA Office of the Registrar General & Census Commissioner, India UN Expert Group Meeting, July 12-14, 2017

Measurement of Disability through Census
National Experiences: INDIA
Office of the Registrar General & Census Commissioner, India
UN Expert Group Meeting, July 12-14, 2017

Approaches adopted: Census 2011
• Disability question was a part of ‘Household Questionnaire’ in 2011.
• Asked of all persons in the Household.
• Enumerators were instructed to contact the disabled person in the
household besides the respondent to collect information
• All types of households (‘Normal’, ‘Institutional’ and ‘Houseless’ ) covered.
• Questions & Instructions on disability were finalized after:
• Field Trial of selected Questions including disability in selected area
• Extensive deliberation with civil society & nodal Ministry
• Pre-test of all census questions covering rural/urban samples in all
States

Approaches adopted: Census 2011
Outcome of Field Trial & Pre-test
• Along with question on type of disability, question on extent of
disability (Totally disabled - 1 / Partially disabled -2) was tested.
• Response on extent of disability was not encouraging, and
therefore dropped
Aspects considered in finalizing questions:
• Simple nomenclature of the types/categories of disability for
easy comprehension by both Enumerator & Respondent
• Relevance of data for the planners & policy makers
• Feasibility of canvassing the question
• To cover all types of disabilities as listed in the Persons with
Disabilities Act, 1995 and National Trust Act, 1999

Questions Canvassed in Census 2011
Codes
Filter question
9(a)
9(b)
9(c)
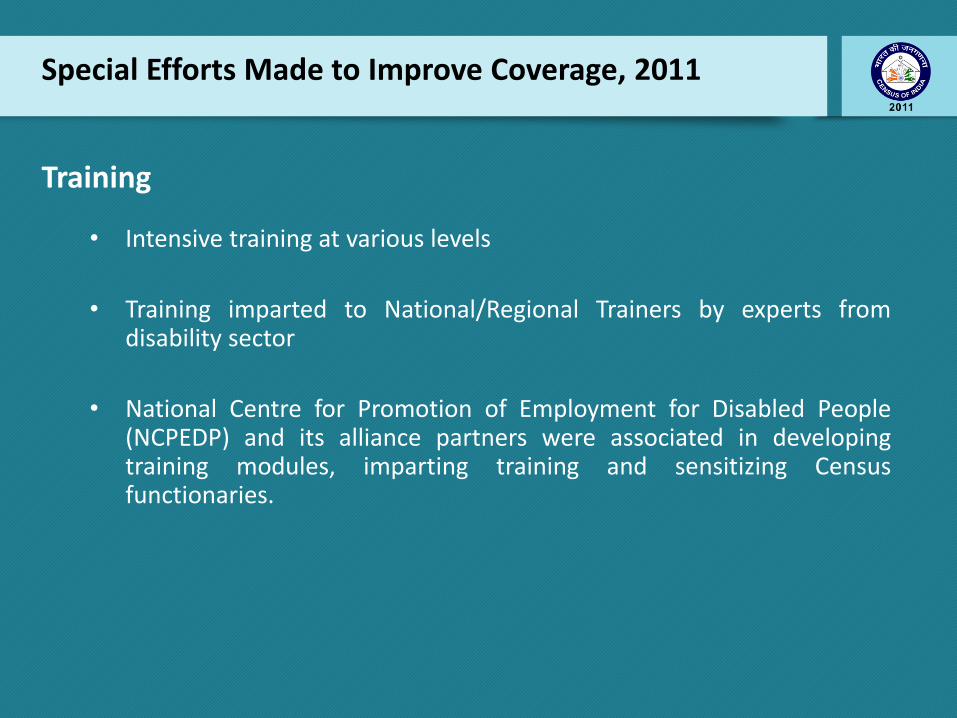
Special Efforts Made to Improve Coverage, 2011
Training
• Intensive training at various levels
• Training imparted to National/Regional Trainers by experts fromdisability sector
• National Centre for Promotion of Employment for Disabled People(NCPEDP) and its alliance partners were associated in developingtraining modules, imparting training and sensitizing Censusfunctionaries.

• Wide publicity through electronic and print media.
• Special Audio/ video/ E-learning modules/ Leaflets
• Seminars and workshops
• Banners and Posters
• Events like Auto Rickshaw rally, car rally, Cycle rally etc.
• Enumerators’ kit included a special flier on disability
Special Efforts Made to Improve Coverage 2011 (Contd.)
Publicity
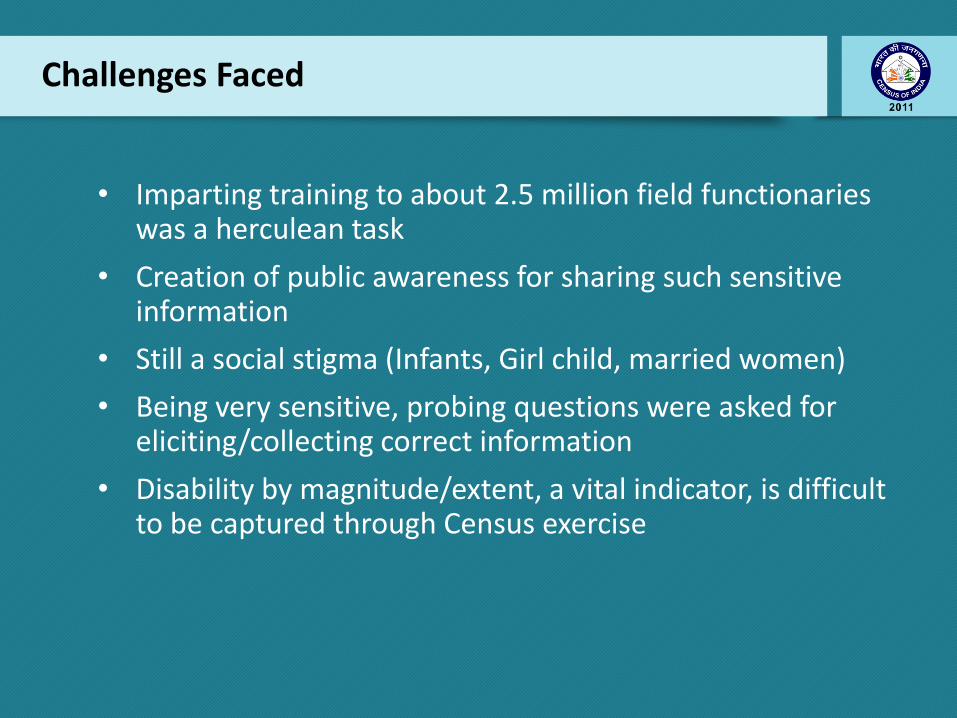
Challenges Faced
• Imparting training to about 2.5 million field functionaries was a herculean task
• Creation of public awareness for sharing such sensitive information
• Still a social stigma (Infants, Girl child, married women)
• Being very sensitive, probing questions were asked for eliciting/collecting correct information
• Disability by magnitude/extent, a vital indicator, is difficult to be captured through Census exercise

Lessons Learned 2011
• Positive impact noticed by associating concerned NGOs and civil societies for:• Deciding the questionnaire on disability
• Preparing instruction for enumerators
• Imparting training to field functionaries
• Creating public awareness
• Filter question for disability resulted in qualitative data
• A balanced publicity campaign to be resorted to

Data Highlights
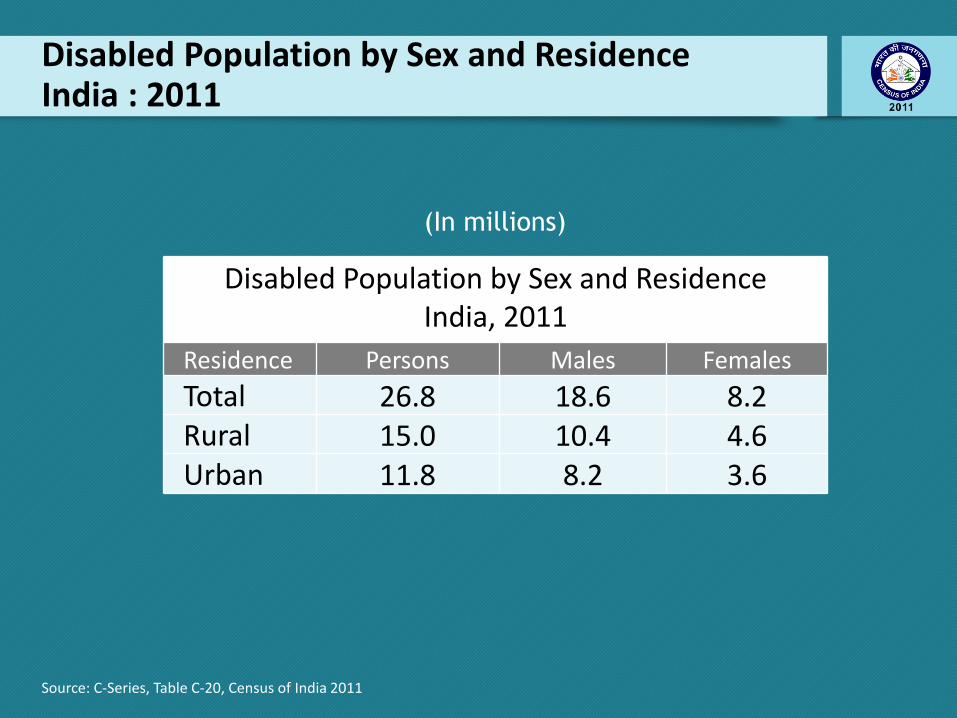
Disabled Population by Sex and ResidenceIndia : 2011
Source: C-Series, Table C-20, Census of India 2011
Disabled Population by Sex and ResidenceIndia, 2011
Residence Persons Males Females
Total 26.8 18.6 8.2Rural 15.0 10.4 4.6Urban 11.8 8.2 3.6
(In millions)

Disabled Population by Sex and ResidenceIndia : 2011
Source: C-Series, Table C-20, Census of India 2011
Percentage of Disabled to total population India, 2011
Residence Persons Males Females
Total 2.21 2.40 2.01
Rural 2.24 2.43 2.03
Urban 2.17 2.34 1.98
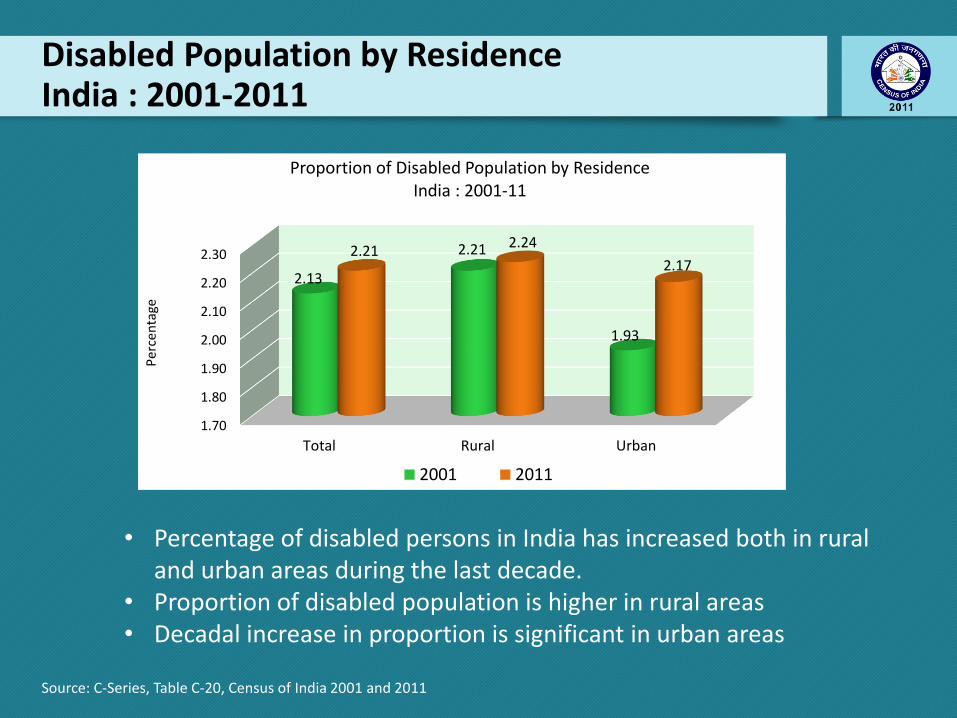
Disabled Population by ResidenceIndia : 2001-2011
1.70
1.80
1.90
2.00
2.10
2.20
2.30
Total Rural Urban
2.13
2.21
1.93
2.212.24
2.17
Per
cen
tage
Proportion of Disabled Population by ResidenceIndia : 2001-11
2001 2011
• Percentage of disabled persons in India has increased both in rural and urban areas during the last decade.
• Proportion of disabled population is higher in rural areas• Decadal increase in proportion is significant in urban areas
Source: C-Series, Table C-20, Census of India 2001 and 2011
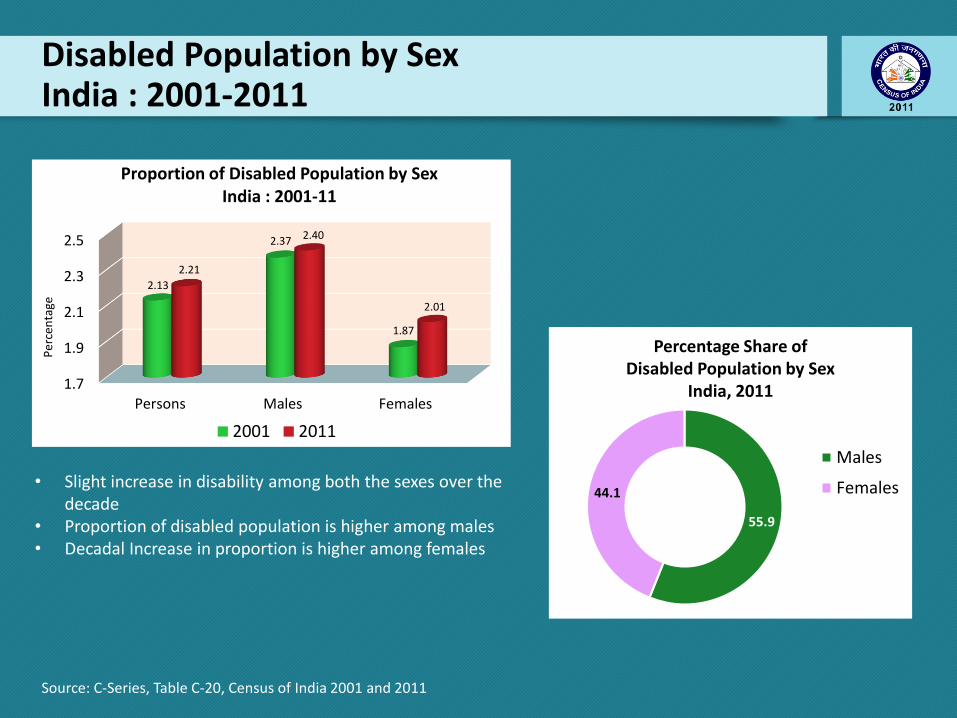
Disabled Population by Sex India : 2001-2011
• Slight increase in disability among both the sexes over the decade
• Proportion of disabled population is higher among males• Decadal Increase in proportion is higher among females
1.7
1.9
2.1
2.3
2.5
Persons Males Females
2.13
2.37
1.87
2.21
2.40
2.01
Per
cen
tage
Proportion of Disabled Population by SexIndia : 2001-11
2001 2011
55.9
44.1
Males
Females
Percentage Share of Disabled Population by Sex
India, 2011
Source: C-Series, Table C-20, Census of India 2001 and 2011
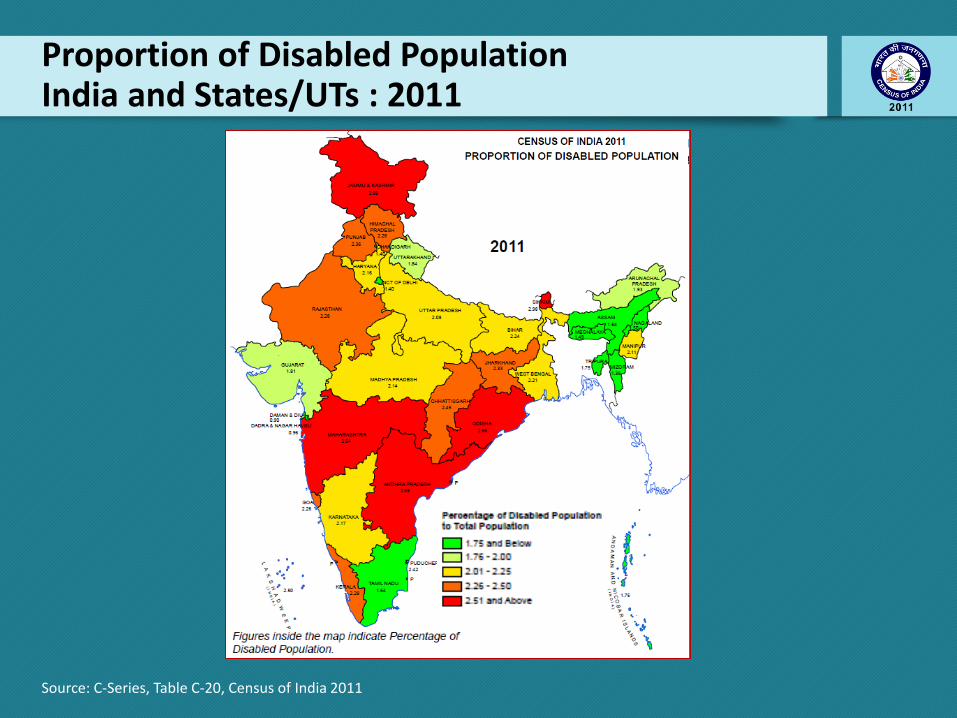
Proportion of Disabled PopulationIndia and States/UTs : 2011
Source: C-Series, Table C-20, Census of India 2011
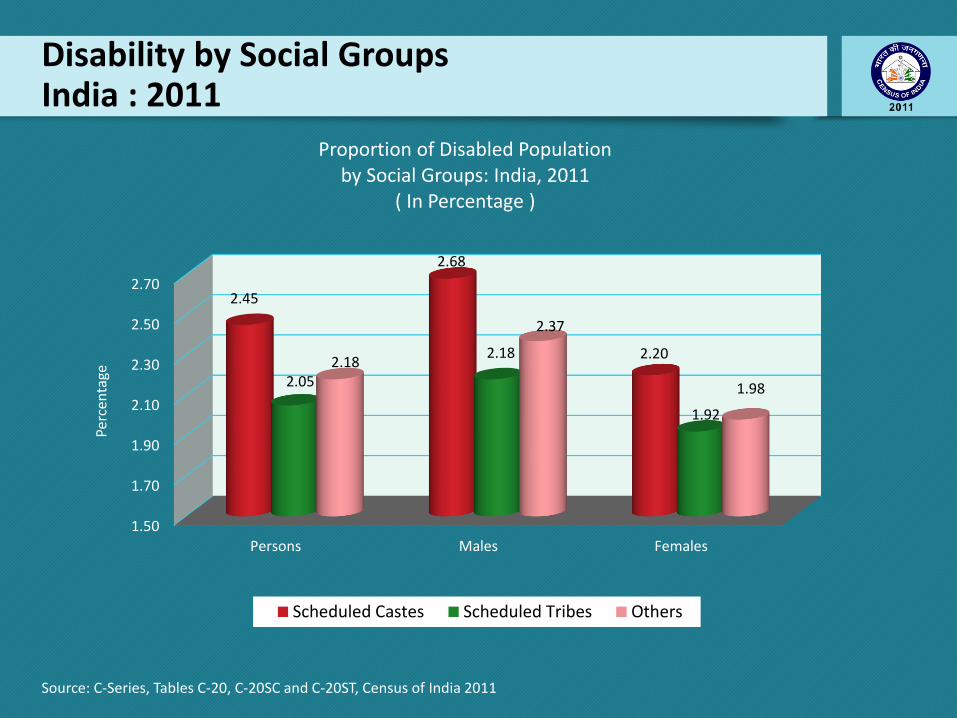
Disability by Social GroupsIndia : 2011
1.50
1.70
1.90
2.10
2.30
2.50
2.70
Persons Males Females
2.45
2.68
2.20
2.05
2.18
1.92
2.18
2.37
1.98
Perc
enta
ge
Proportion of Disabled Population by Social Groups: India, 2011
( In Percentage )
Scheduled Castes Scheduled Tribes Others
Source: C-Series, Tables C-20, C-20SC and C-20ST, Census of India 2011

Disabled Population by Type of Disability (%)India : 2011
Source: C-Series, Table C-20, Census of India 2011
Proportion of Disabled Population by Type of Disability
India : 2011
Type of Disability Persons Males Females
Total 100.0 100.0 100.0
In Seeing 18.8 17.6 20.2
In Hearing 18.9 17.9 20.2
In Speech 7.5 7.5 7.4
In Movement 20.3 22.5 17.5
Mental Retardation 5.6 5.8 5.4
Mental Illness 2.7 2.8 2.6
Any Other 18.4 18.2 18.6
Multiple Disability 7.9 7.8 8.1
( % )
In Seeing18.8
In Hearing18.9
In Speech7.5
In Movement
20.3
Mental Retardation
5.6
Mental Illness
2.7
Any Other18.4
Multiple Disability
7.9
Proportion of Disabled Population by Type of Disability
India : 2011(Persons)

Disabled Population by Age and SexIndia : 2011
Source: C-Series, Table C-20, Census of India 2011
Proportion of Disabled Population in the Respective Age Groups
India : 2011
Age Group Persons Males Females
All Ages 2.21 2.40 2.01
0-4 1.14 1.18 1.11
5-9 1.54 1.63 1.44
10-19 1.82 1.96 1.67
20-29 1.97 2.22 1.70
30-39 2.09 2.41 1.77
40-49 2.31 2.66 1.94
50-59 2.83 3.16 2.47
60-69 4.15 4.41 3.89
70-79 6.22 6.26 6.19
80-89 8.41 8.33 8.48
90+ 8.40 7.88 8.85
Age Not Stated 3.07 3.21 2.91
( % )
0.00 2.00 4.00 6.00 8.00 10.00
0-4
5-9
10-19
20-29
30-39
40-49
50-59
60-69
70-79
80-89
90+
1.14
1.54
1.82
1.97
2.09
2.31
2.83
4.15
6.22
8.41
8.40
Percentage
Age
Gro
up
Proportion of Disabled Population in the Respective Age Group
India, 2011

Source: C-Series, Table C-20, Census of India 2001, 2011
Proportion of Disabled Population in the respective age groups India : 2001-11
0.00
1.00
2.00
3.00
4.00
5.00
6.00
7.00
8.00
9.00
0-4 5-9 10-19 20-29 30-39 40-49 50-59 60-69 70-79 80+
Proportion of Disabled Population by Age GroupsIndia, 2001-11
2001 2011
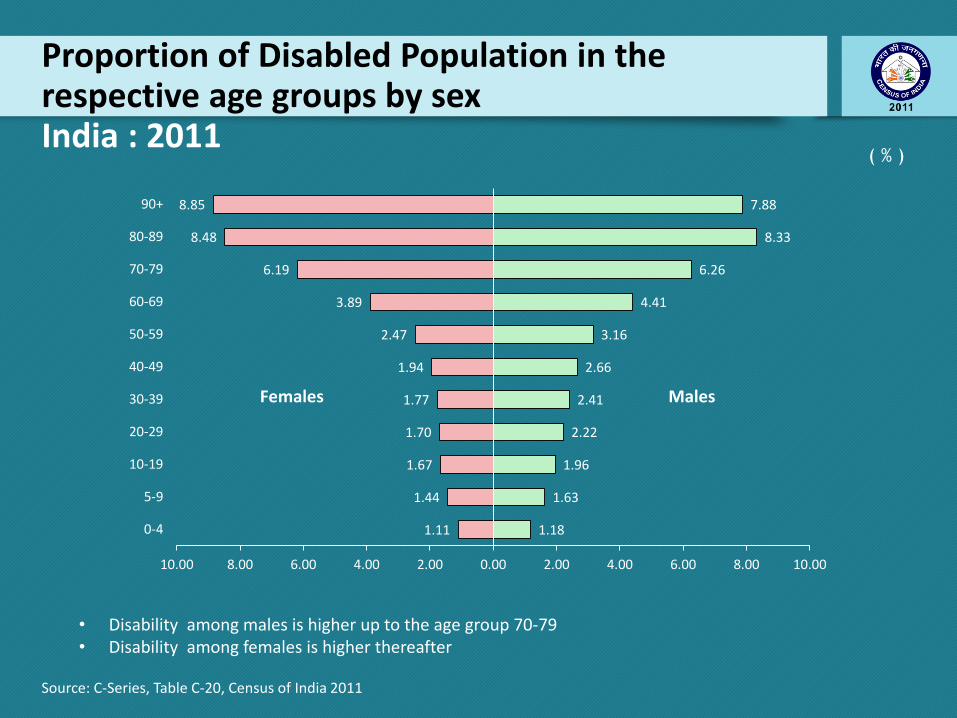
Proportion of Disabled Population in the respective age groups by sexIndia : 2011
Source: C-Series, Table C-20, Census of India 2011
( % )
• Disability among males is higher up to the age group 70-79• Disability among females is higher thereafter
1.11
1.44
1.67
1.70
1.77
1.94
2.47
3.89
6.19
8.48
8.85
1.18
1.63
1.96
2.22
2.41
2.66
3.16
4.41
6.26
8.33
7.88
10.00 8.00 6.00 4.00 2.00 0.00 2.00 4.00 6.00 8.00 10.00
0-4
5-9
10-19
20-29
30-39
40-49
50-59
60-69
70-79
80-89
90+
Females Males
Changes in Types of Disability After Census 2011
• Peoples With Disability Act (PWD) 1995 contained 7 types of
disability
• Rights of PWD Act (RPWD) 2016 now contains 21 types of disability
• More elaborate, inclusive and exhaustive
• Changes are under scrutiny for incorporation in forthcoming
Census 2021

Rights of PWD Act (RPWD) 2016
Type of Disability Type of Disability
A Physical B Intellectual
a Locomotor 11. Specific learning disability
1. Leprosy cured person 12. Autism spectrum disorder
2. Cerebral palsy C Mental
3. Dwarfism 13. Mental illness
4. Muscular dystrophy 14. Mental retardation
5. Acid attack victims D Disability caused due to neurological conditions and Blood disorder
b Visual 15. Multiple sclerosis
6. Blindness 16. Parkinson's disease
7. Low-vision 17. Haemophilia
c Hearing 18. Thalassemia
8. Deaf 19. Sickle sell disease
9. Hard of hearing E 20. Multiple
d 10. Speech & Language F 21. Any other

Thank YouWebsite: http://www.censusindia.gov.in


