1 Measurement of Elastic Modulus of PUNB Bonded Sand as a Function of Temperature J. Thole and C. Beckermann Dept. of Mechanical and Industrial Engineering, University of Iowa, Iowa City, Iowa 52242 Abstract Measurements of the elastic modulus of PUNB bonded silica sand are performed using a three-point bend test from room temperature to 500°C in a nitrogen atmosphere. The measurements are taken almost instantaneously during the heating of the specimen to capture the changes in the elastic modulus throughout the temperature range. It is found that for an intermediate heating rate of 8°C/min, the elastic modulus decreases steeply from a room temperature value of about 3,900 MPa to 600 MPa at 125°C. Between 125°C and 250°C, the elastic modulus is relatively constant. Above 250°C, it increases to 1,200 MPa at 280°C and then decreases again to 800 MPa at 350°C. Above 350°C, the elastic modulus increases linearly with temperature until it reaches 2,400 MPa at 500°C. At approximately 500°C, the strength of the bonded sand vanishes. At a given temperature above 125°C, the elastic modulus can vary by more than a factor of two depending on the heating rate. After prolonged holding at an elevated temperature, the elastic modulus attains a steady-state value that is equal to 2,000 MPa for temperatures between 125°C and 370°C, except at 300°C where it is 2,500 MPa. Upon cooling from a hold temperature above 125°C, the elastic modulus does not return to its original room temperature value. The retained room temperature elastic modulus is between 2,900 MPa and 3,400 MPa for hold temperatures between 125°C and 300°C, and 1,400 MPa for a hold temperature of 370°C. It is also found that the addition of black iron oxide has no effect on the elastic modulus, whereas solvent removal before a test increases the stiffness of the bonded sand at temperatures below 150°C. Additional experiments are needed to investigate in more detail the elastic modulus variation during cooling as well as for higher heating rates. 1. Introduction Casting simulation software has recently made some progress in the area of prediction of stresses and distortion. However, significant gaps exist in the knowledge of the mechanical properties of the metal and mold materials. Monroe et al. [1] found that the predicted stresses and distortions in steel casting are particularly sensitive to the elastic modulus of the sand mold. The objective of the present study is to accurately measure the elastic modulus of phenolic urethane no-bake (PUNB) bonded sand as a function of temperature, in order to provide improved input data for stress simulations. Measurements of the elastic modulus of chemically bonded sand first appeared in the late 1950’s, where the effects of grip, shape and gauge length of tensile test specimens were investigated by Wallace and coworkers [2]. In a later study [3] employing a strain gauge, they verified that approximately the same value for the elastic modulus at room temperature is obtained when measured under compressive, tensile or bending loading. It was also found that for all loading methods, the bonded sand shows both elastic and brittle behavior. More recently, the elastic modulus of phenolic urethane cold-box (PUCB) bonded sand was measured at elevated temperatures using a three-point bend apparatus [4]. It was found in this
Transcript
1
Measurement of Elastic Modulus of PUNB Bonded Sand as a Function of Temperature
J. Thole and C. Beckermann
Dept. of Mechanical and Industrial Engineering, University of Iowa, Iowa City, Iowa 52242
Abstract Measurements of the elastic modulus of PUNB bonded silica sand are performed using a
three-point bend test from room temperature to 500°C in a nitrogen atmosphere. The measurements are taken almost instantaneously during the heating of the specimen to capture the changes in the elastic modulus throughout the temperature range. It is found that for an intermediate heating rate of 8°C/min, the elastic modulus decreases steeply from a room temperature value of about 3,900 MPa to 600 MPa at 125°C. Between 125°C and 250°C, the elastic modulus is relatively constant. Above 250°C, it increases to 1,200 MPa at 280°C and then decreases again to 800 MPa at 350°C. Above 350°C, the elastic modulus increases linearly with temperature until it reaches 2,400 MPa at 500°C. At approximately 500°C, the strength of the bonded sand vanishes. At a given temperature above 125°C, the elastic modulus can vary by more than a factor of two depending on the heating rate. After prolonged holding at an elevated temperature, the elastic modulus attains a steady-state value that is equal to 2,000 MPa for temperatures between 125°C and 370°C, except at 300°C where it is 2,500 MPa. Upon cooling from a hold temperature above 125°C, the elastic modulus does not return to its original room temperature value. The retained room temperature elastic modulus is between 2,900 MPa and 3,400 MPa for hold temperatures between 125°C and 300°C, and 1,400 MPa for a hold temperature of 370°C. It is also found that the addition of black iron oxide has no effect on the elastic modulus, whereas solvent removal before a test increases the stiffness of the bonded sand at temperatures below 150°C. Additional experiments are needed to investigate in more detail the elastic modulus variation during cooling as well as for higher heating rates.
1. Introduction Casting simulation software has recently made some progress in the area of prediction of
stresses and distortion. However, significant gaps exist in the knowledge of the mechanical properties of the metal and mold materials. Monroe et al. [1] found that the predicted stresses and distortions in steel casting are particularly sensitive to the elastic modulus of the sand mold. The objective of the present study is to accurately measure the elastic modulus of phenolic urethane no-bake (PUNB) bonded sand as a function of temperature, in order to provide improved input data for stress simulations.
Measurements of the elastic modulus of chemically bonded sand first appeared in the late 1950’s, where the effects of grip, shape and gauge length of tensile test specimens were investigated by Wallace and coworkers [2]. In a later study [3] employing a strain gauge, they verified that approximately the same value for the elastic modulus at room temperature is obtained when measured under compressive, tensile or bending loading. It was also found that for all loading methods, the bonded sand shows both elastic and brittle behavior.
More recently, the elastic modulus of phenolic urethane cold-box (PUCB) bonded sand was measured at elevated temperatures using a three-point bend apparatus [4]. It was found in this
becker
Text Box
Thole, J., and Beckermann, C., “Measurement of Elastic Modulus of PUNB Bonded Sand as a Function of Temperature,” in Proceedings of the 63rd SFSA Technical and Operating Conference, Paper No. 4.7, Steel Founders' Society of America, Chicago, IL, 2009.
2
study that the elastic modulus decreases from about 4,300 MPa at room temperature to 2,200 MPa at 200°C. Above 200°C, the elastic modulus was observed to remain constant, except for a temporary re-stiffening to 3,000 MPa at 300°C. At 400°C, another increase to 3,000 MPa was measured. Very recently, Thiel [5] performed elevated temperature elastic modulus measurements of chemically bonded sand using a tensile testing machine with an extensometer and an elongated dog-bone test specimen. The results were in approximate agreement with those of Reference [4]. In both References [4] and [5], the bonded sand specimens were heated in an oven (in an inert atmosphere) to the desired test temperature, and the elastic modulus measurements were performed well after the specimens reached a uniform and constant temperature. The effect of heating rate was not investigated. In Reference [4], the measurements were performed inside of the oven, whereas in Reference [5] the specimens were removed from the oven before testing. In both references, the elastic modulus was measured at no more than ten discrete temperatures. Furthermore, the variation of the elastic modulus during cooling from an elevated temperature was not investigated.
In the present study, measurements are performed of the elastic modulus of PUNB bonded sand that is typical of steel casting molds. The experimental setup is similar to the one used in Reference [4] and uses a three-point bend apparatus [6, 7]. The specimens are tested inside an oven in an inert atmosphere. Unlike in the previous studies, the present setup allows for elastic modulus measurements to be performed almost instantaneously. Hence, an almost continuous variation of the elastic modulus with temperature can be obtained. The effect of different heating rates is also investigated. Figure 1 shows the results of a solidification simulation of a large 3 in thick steel casting section with a 3 in thick mold. It can be seen that within a distance of 1 in from the mold-metal interface, the temperatures in the mold reach values higher than 1,000°C (Figure 1a) and the heating rates are above 50°C/min (Figure 1b). Such high heating rates are difficult to achieve in an oven. In addition, a reasonably sized specimen would not be isothermal when heated at such high rates. However, at distances greater than 1 in from the mold-metal interface the heating rates are much lower, while the mold temperatures still reach values above 400°C. Between 1.5 in to 3 in from the mold-metal interface, the mold heating rates vary from about 20°C/min to 5°C/min. Heating rates of that order of magnitude are utilized in the present measurements. Figure 1 also shows that after the initial heating, the mold cools down again. The cooling rates are much lower in magnitude than the heating rates. They decrease from about 1°C/min to 0.2°C/min with increasing distance from the mold-metal interface (Figure 1b). During the time period when the temperatures in the mold decrease, the mold can still have a strong effect on casting distortion [1]. Thus, the behavior of the elastic modulus during cooling, after heating to a certain temperature, is also investigated in the present study. In particular, it is of interest to understand if the elastic modulus takes on the same values during cooling as during heating and if the original room temperature value is recovered at the completion of cooling. Finally, the effects of the solvent and black iron oxide in the binder on the elastic modulus are investigated.
The specimen preparation and the experimental setup are described in the next section. The results of the present study are presented in Section 3, and the conclusions are summarized in Section 4.
3
(a) Predicted temperatures in the mold.
Elapsed Time, t [min]
Tem
pera
ture
,T[°
C]
0 300 600 900 12000
500
1000
1500Casting Section Thickness = 3"
Mold Thickness = 3"Steel
0.5"
0.9"
1.5"
2.1"
2.7"
Distance from Mold-Metal Interface
Distance From Mold-Metal Interface [in]
Hea
ting
Rat
e[°
C/m
in]
Coo
ling
Rat
e[°
C/m
in]
0 0.5 1 1.5 2 2.5 310-1
100
101
102
10-1
100
101
102
Casting Section Thickness = 3"Mold Thickness = 3"
(b) Predicted heating and cooling rates in the mold.
Figure 1: Predicted temperatures and heating/cooling rates during casting of a three inch thick steel section surrounded by a three inch thick sand mold.
4
2. Experiments The following sub-sections describe the preparation of the test specimens and the design of
the experimental setup. Then, a brief validation of the present tests is presented in which the elastic modulus of ASTM 304 stainless steel is measured at room and elevated temperatures. Finally, an error analysis is presented. 2.1 Specimen Preparation
The test specimens were prepared from silica lake sand, with a grain fineness number of 55 (IC55), and a phenolic urethane no-bake (PUNB) binder system with black iron oxide (BIO). As shown in Figure 2, a nine screen test was run to verify the grain fineness number and measure the size distribution of the sand grains. Other specimen characteristics are summarized in Table 1. The values for the binder percentage, binder ratio, catalyst percentage and additives were obtained by polling seven steel foundries and taking the average of their responses. The porosity of the specimens was measured using a standard immersion test.
The specimens were prepared by first mixing the black iron oxide into the sand using a kitchen-aid mixer to ensure a uniform distribution. Then, the binder was added according to a procedure recommended by the binder manufacturer. Part 1 and the catalyst were added to the sand, mixed for 45 seconds, and then tossed to bring the sand from the bottom to the top. The batch was mixed for another 45 seconds and tossed again. After the second toss, part 2 was
Sieve Size
Ret
aine
don
Scre
en[%
]
0 50 100 150 200 250 3000
5
10
15
20
25
30
35
IC55 distribution9 screen test
GFN = 55.56
Figure 2: Nine screen sieve test performed on a 50 gram sample of IC55 silica lake sand.
5
Table 1: Characteristics of the PUNB bonded sand specimens used in the elastic modulus measurements.
Sand Type IC55 round grain silica lake sand Binder Pepset x1000, x2000
Catalyst Pepset 3500 Binder Percentage 1.25% by total weight
Binder Ratio 60:40 Catalyst Percentage 8% of binder weight
Additives 3% black iron oxide by total weight Specimen Porosity, 𝜙𝜙� ± 1σ [%] 32.8 ± 0.9
added to the batch and mixed for another 45 seconds, which was followed by a third and final toss. The batch was mixed for a final 45 seconds before depositing it into the dump box. The sand-binder mixture was then rammed by hand into the pattern, while striving to achieve a uniform density, and allowed to set in the pattern before stripping. The specimens were stripped when the compacted sand withstood 20 psi of compressive stress without visible deformation [7]. The dump box was capable of making six specimens with a 25.4 mm (1 in) square cross-section and a 228.8 mm (9 in) length. The specimens were allowed to cure for at least 24 hours before testing. A photograph of a test specimen is shown in Figure 3.
228.6 mm (9 in)
25.4 mm (1 in)
25.4 mm (1 in)
228.6 mm (9 in)
25.4 mm (1 in)
25.4 mm (1 in)
Figure 3: Photograph of a three-point bend specimen containing 1.25% binder by total weight at a 60:40 ratio of part 1 to part 2, and 3% black iron oxide.
6
2.2 Experimental Setup
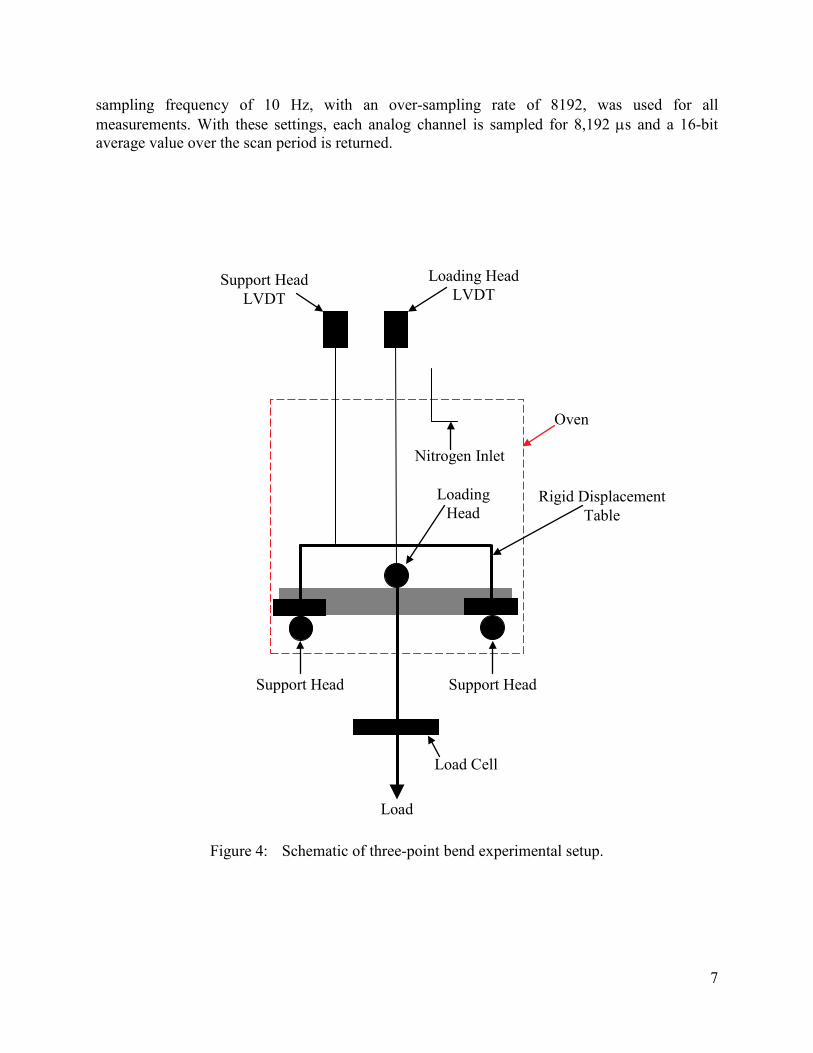
A schematic of the three-point bend apparatus is shown in Figure 4. Photographs of various aspects of the experimental setup are provided in Figures 5 to 7. The three-point bend apparatus was placed inside a model OH-O1O-F1_CO-12-12-18 Thermcraft oven capable of reaching 538°C (1,000°F) (Figure 5). The oven was purged of oxygen using nitrogen from a tank at a flow rate of 60 m3/min. The temperature of the oven was controlled using a 2216 Eurotherm model 1D1-16-230 control system. This system controls the temperature using a 230V, 3000W heating coil at 14.6 Amps. A cooling system, consisting of copper tubing through which cold water was circulated, was added to the oven to cool the system after a test at elevated temperature. The use of a separate cooling system allows the specimen to cool in an oxygen-free environment over a range of cooling rates.
The three-point bend test fixture was designed to follow ASTM Standard D5934 [7], a method for measuring the elastic modulus of thermoplastics and thermosetting plastics. The support and loading heads were made from 12.54 mm (0.5 in) diameter cylindrical steel bars. The bars provide enough surface area to prevent any indentation caused by the loading or support heads. The support heads were welded to a base plate to ensure a constant support span of 190.56 mm (7.5 in) (Figure 6). This distance between the supports results in an overhang of the specimens that is sufficient to avoid slipping. The loading head was aligned using a guide that was welded to the base plate (Figure 6). The guide ensures consistent placement of the loading head in order to reduce variability in the elastic modulus measurements.
Specimen deflection was measured using two Omega LD610-5 linear variable differential transformers (LVDTs). The LVDTs were located outside the oven by suspending them from a ladder stand (Figure 5). Glass silica rods were used to extend the LVDT probes into the oven through a port hole located above the fixture. The port hole was insulated with fiberglass to protect the LVDTs from the oven when operated at high temperatures. One probe was situated on a table that straddles the specimen and rests on the support heads (Figure 6). This LVDT measured the displacement of the support heads. The loading head probe passed through a hole in the table and a tube that was welded to a small plate which, in turn, was placed on the loading head (Figure 6). This prevents the loading head probe from “walking” off the loading head and rendering the test invalid.
The specimen was loaded using a cantilever system located beneath the oven (Figure 7). The loading head was connected to the cantilever system using a series of mechanical connections exiting the oven through a port hole located directly beneath the test fixture. Between the port hole and the cantilever system, a load cell (Omega LC703-50) was installed to measure the applied force. The cantilever system consisted of a wooden board that was connected by a hinge to the table on which the oven rested. A hanging mass at the opposite end of the hinge provided the loading force for the system. The load was controlled with an eye and hook turnbuckle that supported the cantilever (Figure 7). Using a simple wrench, the load could be increased and decreased in a rapid fashion.
Two Type K thermocouples were used to measure the surface and center temperature of a separate “dummy” specimen located at the same elevation in the oven as the test specimen. A dummy specimen was used in order to keep the test specimen free of any modifications.
All devices were powered using an Elenco Precision Deluxe model XP-620 regulated power supply. The data was collected using a 16-bit IOtech 3005 Personal DAQ system connected to a laptop via USB. The software DasyLab was used to control the data acquisition system. A
7
sampling frequency of 10 Hz, with an over-sampling rate of 8192, was used for all measurements. With these settings, each analog channel is sampled for 8,192 µs and a 16-bit average value over the scan period is returned.
Support Head LVDT
Loading Head LVDT
Oven
Rigid Displacement Table
Loading Head
Support Head
Load Cell
Support Head
Load
Nitrogen Inlet
Figure 4: Schematic of three-point bend experimental setup.
8
Loading Head LVDT
Rigid LVDT
Copper Cooling Coil
Rigid Displacement Table
Loading Head LVDT Probe Boot
Loading Head
Supporting Head
To Load Cell
Test Specimen
Figure 6: Photograph of the three-point bend fixture with a specimen inserted.
Oven Controller
LVDTs
Nitrogen Inlet
Cold Water Supply
Oven
Loading Apparatus
Test Specimen
Power Supply
Figure 5: Photograph of the entire experimental setup.
9
The specimen deflection, D, was obtained by taking the difference between the displacements measured by the loading head and support head displacement LVDTs. The load cell was carefully calibrated to measure the loading force, F. With this data, the stress σ, strain ε, and elastic modulus E, were calculated from the following three-point bend equations [7]:
(1)
and
(2)
thus
==
DF
bdLE 3
3
4εσ (3)
where L is the support span, b is the specimen width as viewed by the loading head, and d is the specimen depth as viewed by the loading head.
223bdFL
=σ
2
6LDd
=ε
Loading Hook
Eye and Hook Turnbuckle
Cantilever Hinge
Load Cell
To Test Specimen
Figure 7: Photograph of the cantilever loading apparatus located underneath the oven.
10
2.3
In order to validate the present experimental setup and measurement procedures, at both room temperature and elevated temperatures, tests were performed using a material with a well-known elastic modulus. The material chosen was ASTM 304 stainless steel. Figure 8 compares the present elastic modulus measurements with the measurements of Sakumoto et al. [9]. Good agreement can be observed at both room temperature and 400°C.
Validation
2.4
A simple root-sum-squares (RSS) error analysis was performed to estimate the error in the present elastic modulus measurements. Table 2 shows the sources of error in the individual measurements for a room temperature example. For the specimen deflection and the loading force, only the largest measured values (in the elastic regime) are listed. Table 3 shows the resulting ranges and errors in the elastic modulus. It can be seen that the measurement of the specimen deflection is the single largest source of error. The specimen width measurement is also a relatively large source of error, which can be attributed to the roughness of the top surface of the bonded sand specimens. Overall, the error in the present room temperature elastic modulus measurement is estimated to be ±1.5%. A similar accuracy can be expected at elevated temperatures.
Error Analysis
Specimen Temperature, T [°C]
Elas
ticM
odul
us,E
[GPa
]
0 100 200 300 400 500150
160
170
180
190
200
210
Present Data
Sakumoto et al., 1996
Sakumoto et al., 1996 (High Strength)
Figure 8: Comparison of present measurements of the elastic modulus of ASTM 304 stainless steel as a function of temperature with data from Sakumoto et al. [9].
11
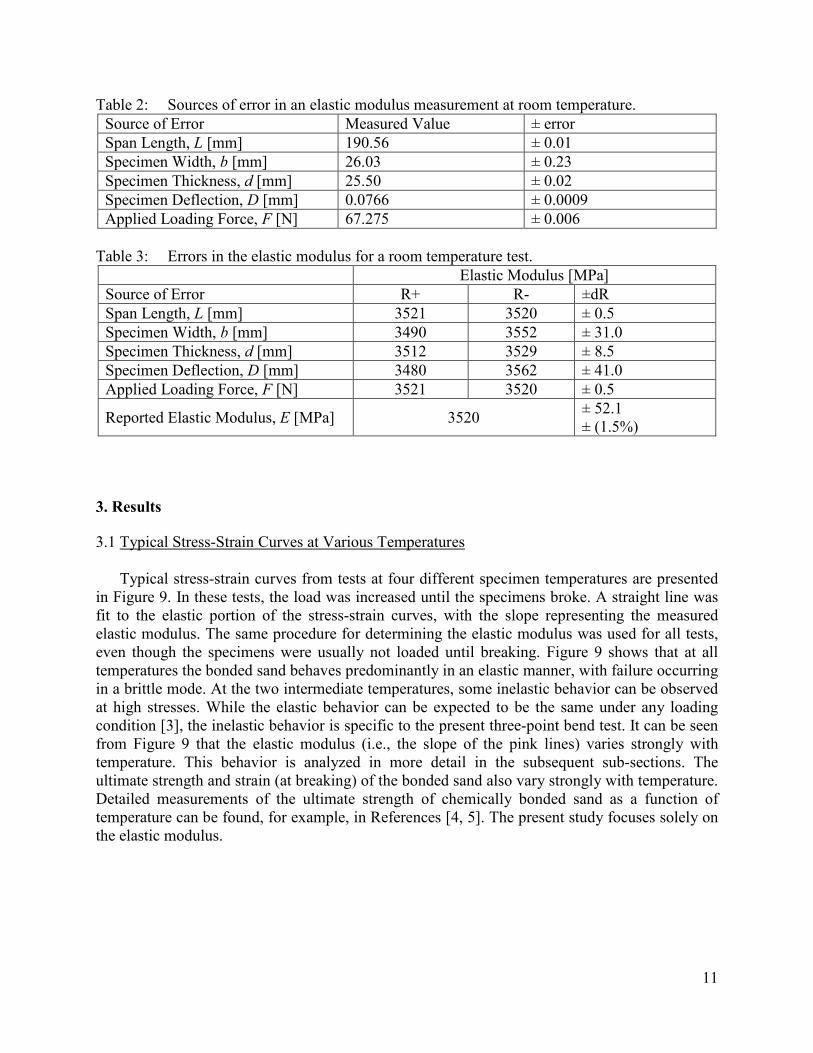
Table 2: Sources of error in an elastic modulus measurement at room temperature. Source of Error Measured Value ± error Span Length, L [mm] 190.56 ± 0.01 Specimen Width, b [mm] 26.03 ± 0.23 Specimen Thickness, d [mm] 25.50 ± 0.02 Specimen Deflection, D [mm] 0.0766 ± 0.0009 Applied Loading Force, F [N] 67.275 ± 0.006
Table 3: Errors in the elastic modulus for a room temperature test.
Elastic Modulus [MPa] Source of Error R+ R- ±dR Span Length, L [mm] 3521 3520 ± 0.5 Specimen Width, b [mm] 3490 3552 ± 31.0 Specimen Thickness, d [mm] 3512 3529 ± 8.5 Specimen Deflection, D [mm] 3480 3562 ± 41.0 Applied Loading Force, F [N] 3521 3520 ± 0.5
Reported Elastic Modulus, E [MPa] 3520 ± 52.1 ± (1.5%)
3. Results
3.1 Typical Stress-Strain Curves at Various Temperatures
Typical stress-strain curves from tests at four different specimen temperatures are presented in Figure 9. In these tests, the load was increased until the specimens broke. A straight line was fit to the elastic portion of the stress-strain curves, with the slope representing the measured elastic modulus. The same procedure for determining the elastic modulus was used for all tests, even though the specimens were usually not loaded until breaking. Figure 9 shows that at all temperatures the bonded sand behaves predominantly in an elastic manner, with failure occurring in a brittle mode. At the two intermediate temperatures, some inelastic behavior can be observed at high stresses. While the elastic behavior can be expected to be the same under any loading condition [3], the inelastic behavior is specific to the present three-point bend test. It can be seen from Figure 9 that the elastic modulus (i.e., the slope of the pink lines) varies strongly with temperature. This behavior is analyzed in more detail in the subsequent sub-sections. The ultimate strength and strain (at breaking) of the bonded sand also vary strongly with temperature. Detailed measurements of the ultimate strength of chemically bonded sand as a function of temperature can be found, for example, in References [4, 5]. The present study focuses solely on the elastic modulus.
12
3.2 Elastic Modulus Variation at a 8°C/min Heating Rate
Numerous tests were performed for an average heating rate of 8°C/min. As indicated in Figure 1b by a dashed line, this heating rate is typical for locations in the mold that are between 1 in and 3 in away from the mold-metal interface. Figure 10 shows the elastic modulus measurements as a function of time for a typical test. Superimposed on this data are the measured specimen temperatures. It can be seen that the center and surface temperatures are always within 10°C of each other. The specimen was heated to about 500°C; at this temperature the strength of the specimen approached zero and no elastic modulus measurements could be performed at higher temperatures. As can be seen from the slope of the temperature curves, the heating rate is not completely constant, but varies by less than ±2°C/min during the test. There are approximately 80 elastic modulus measurements plotted in Figure 10, implying that approximately one measurement was performed per minute. This results in an almost continuous variation of the elastic modulus with temperature.
Figure 11 shows elastic modulus measurements for six different specimens that were all heated at a rate of 8±1.7°C/min. Here, the elastic modulus is plotted directly against the measured temperature. Three of specimens contained black iron oxide and three did not. It can be seen that there is no discernable difference in the elastic modulus between the two types of specimens. This indicates that the addition of black iron oxide has no effect on the elastic
Stre
ss, σ
[MPa
]
Strain, ε [-]
Figure 9: Typical stress-strain curves at four different temperatures. For these tests, the specimens were loaded until breaking. The straight lines represent best fits to the
data in the elastic regime.
0 0.0005 0.001 0.0015 0.002 0.00250
0.5
1
1.5
2
(3)
(1)
(2)
(4)
2173450(4)1151350(3)282180(2)340325(1)[MPa] C][ ET °
13
Figure 11: Measured elastic modulus as a function of temperature for an average heating rate of 8°C/min. The red line represents a 13-point moving average for six specimens.
Specimen Temperature, T [°C]
Elas
ticM
odul
us,E
[MPa
]
0 100 200 300 400 5000
1000
2000
3000
4000
5000
0
1000
2000
3000
4000
5000
8 ± 1.7 °C/min Heating Rate3% BIO SpecimensNo BIO Specimens
13-point Moving Average
1σ
__ERT
Figure 10: Measured elastic modulus and temperatures as a function of time for a typical test with an average heating rate of 8°C/min.
Elapsed Time, t [min]
Elas
ticM
odul
us,E
[MPa
]
Spec
imen
Tem
pera
ture
,T[°
C]
0 30 60 900
1000
2000
3000
4000
5000
0
100
200
300
400
500E, 3% BIO Specimen Center Temperature Surface Temperature
8 °C/min Heating Rate
14
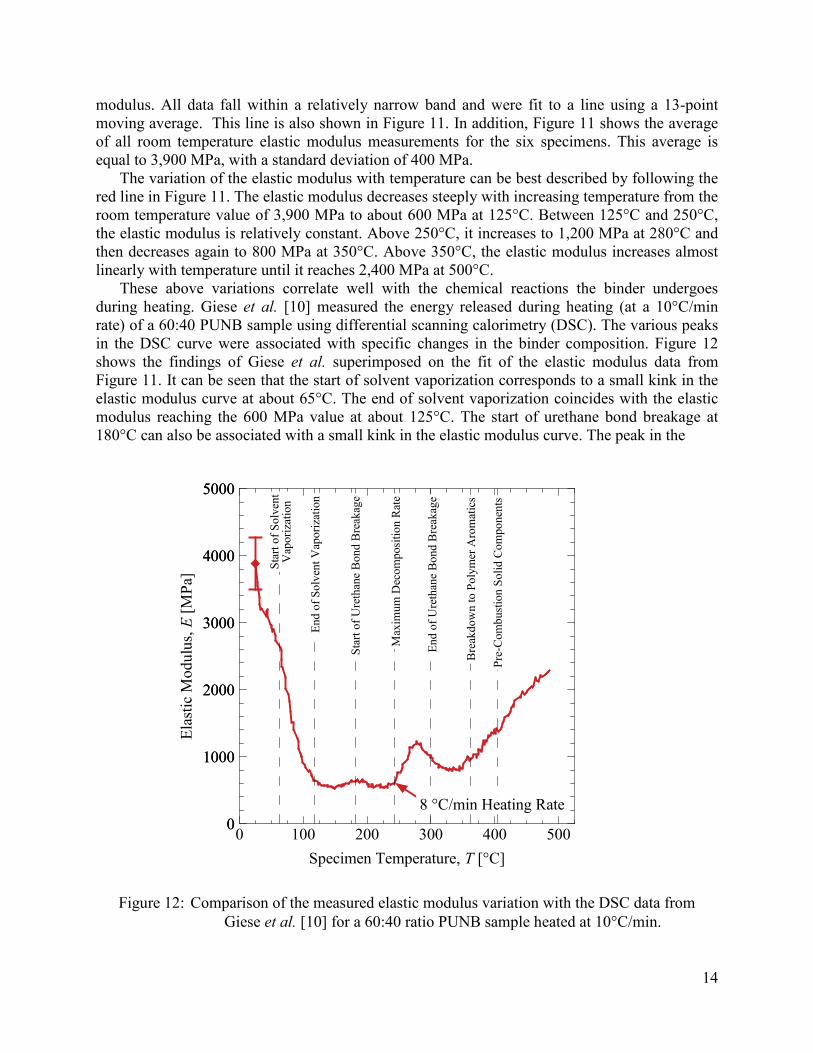
modulus. All data fall within a relatively narrow band and were fit to a line using a 13-point moving average. This line is also shown in Figure 11. In addition, Figure 11 shows the average of all room temperature elastic modulus measurements for the six specimens. This average is equal to 3,900 MPa, with a standard deviation of 400 MPa.
The variation of the elastic modulus with temperature can be best described by following the red line in Figure 11. The elastic modulus decreases steeply with increasing temperature from the room temperature value of 3,900 MPa to about 600 MPa at 125°C. Between 125°C and 250°C, the elastic modulus is relatively constant. Above 250°C, it increases to 1,200 MPa at 280°C and then decreases again to 800 MPa at 350°C. Above 350°C, the elastic modulus increases almost linearly with temperature until it reaches 2,400 MPa at 500°C.
These above variations correlate well with the chemical reactions the binder undergoes during heating. Giese et al. [10] measured the energy released during heating (at a 10°C/min rate) of a 60:40 PUNB sample using differential scanning calorimetry (DSC). The various peaks in the DSC curve were associated with specific changes in the binder composition. Figure 12 shows the findings of Giese et al. superimposed on the fit of the elastic modulus data from Figure 11. It can be seen that the start of solvent vaporization corresponds to a small kink in the elastic modulus curve at about 65°C. The end of solvent vaporization coincides with the elastic modulus reaching the 600 MPa value at about 125°C. The start of urethane bond breakage at 180°C can also be associated with a small kink in the elastic modulus curve. The peak in the
Specimen Temperature, T [°C]
Elas
ticM
odul
us,E
[MPa
]
0 100 200 300 400 5000
1000
2000
3000
4000
5000
0
1000
2000
3000
4000
5000
8 °C/min Heating Rate
Star
tofS
olve
ntV
apor
izat
ion
End
ofSo
lven
tVap
oriz
atio
n
Star
tofU
reth
ane
Bon
dB
reak
age
Max
imum
Dec
ompo
sitio
nR
ate
End
ofU
reth
ane
Bon
dB
reak
age
Bre
akdo
wn
toPo
lym
erA
rom
atic
s
Pre-
Com
bust
ion
Solid
Com
pone
nts
Figure 12: Comparison of the measured elastic modulus variation with the DSC data from Giese et al. [10] for a 60:40 ratio PUNB sample heated at 10°C/min.
15
elastic modulus around 280°C coincides with the maximum decomposition rate and the end of urethane bond breakage. Most importantly, the linear increase in the elastic modulus above 350°C can be associated with the breakdown of the binder to polymer aromatics. 3.3 Effect of Solvent
The results shown in Figure 12 indicate that the solvent in the binder may have an effect on the elastic modulus. Therefore, additional tests were performed where the solvent was removed from the specimens prior to testing by heating them to 140°C and allowing them to cool down to room temperature again. The results of two such tests (at a 8°C/min heating rate) are shown in Figure 13 and compared to the fit of the elastic modulus data from Figure 11 (without solvent removal). Despite the scatter in the data, it can be seen that the solvent has an effect on the elastic modulus at temperatures below about 150°C. While the room temperature elastic modulus is approximately the same with and without solvent, the elastic modulus between 50°C and 150°C is generally higher with than without solvent removal. The differences can be as large as a factor of two. However, at temperatures above 150°C, Figure 13 shows that the elastic modulus of the specimens with the solvent removed follows the same variation with temperature as the fit of the elastic modulus data from the six original specimens where the solvent was not removed.
Figure 13: Comparison of the elastic modulus variation with temperature for specimens with and without the solvent removed.
Specimen Temperature, T [°C]
Elas
ticM
odul
us,E
[MPa
]
0 100 200 300 400 5000
1000
2000
3000
4000
5000
Solvent Removed Before Testby Heating to 140°C
8 °C/min Heating Rate
Specimens Contain Solvent
16
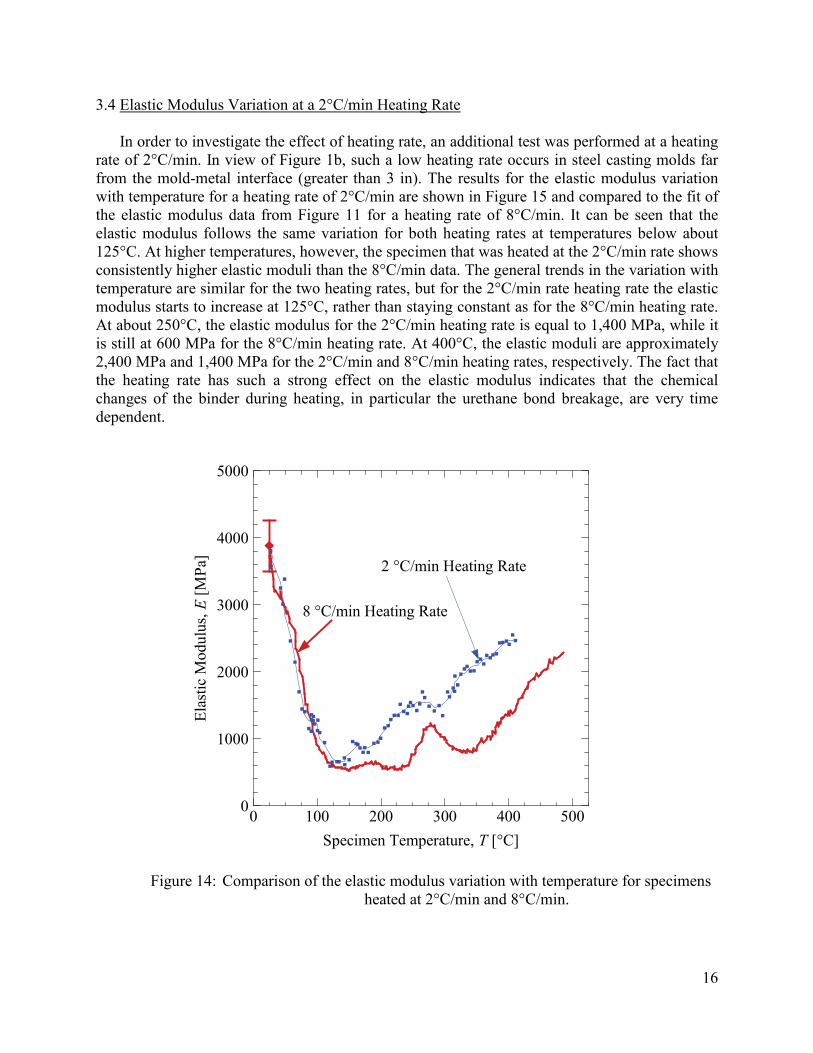
3.4 Elastic Modulus Variation at a 2°C/min Heating Rate
In order to investigate the effect of heating rate, an additional test was performed at a heating rate of 2°C/min. In view of Figure 1b, such a low heating rate occurs in steel casting molds far from the mold-metal interface (greater than 3 in). The results for the elastic modulus variation with temperature for a heating rate of 2°C/min are shown in Figure 15 and compared to the fit of the elastic modulus data from Figure 11 for a heating rate of 8°C/min. It can be seen that the elastic modulus follows the same variation for both heating rates at temperatures below about 125°C. At higher temperatures, however, the specimen that was heated at the 2°C/min rate shows consistently higher elastic moduli than the 8°C/min data. The general trends in the variation with temperature are similar for the two heating rates, but for the 2°C/min rate heating rate the elastic modulus starts to increase at 125°C, rather than staying constant as for the 8°C/min heating rate. At about 250°C, the elastic modulus for the 2°C/min heating rate is equal to 1,400 MPa, while it is still at 600 MPa for the 8°C/min heating rate. At 400°C, the elastic moduli are approximately 2,400 MPa and 1,400 MPa for the 2°C/min and 8°C/min heating rates, respectively. The fact that the heating rate has such a strong effect on the elastic modulus indicates that the chemical changes of the binder during heating, in particular the urethane bond breakage, are very time dependent.
Specimen Temperature, T [°C]
Elas
ticM
odul
us,E
[MPa
]
0 100 200 300 400 5000
1000
2000
3000
4000
5000
2 °C/min Heating Rate
8 °C/min Heating Rate
Figure 14: Comparison of the elastic modulus variation with temperature for specimens heated at 2°C/min and 8°C/min.
17
3.5 Elastic Modulus during Holding at Elevated Temperatures
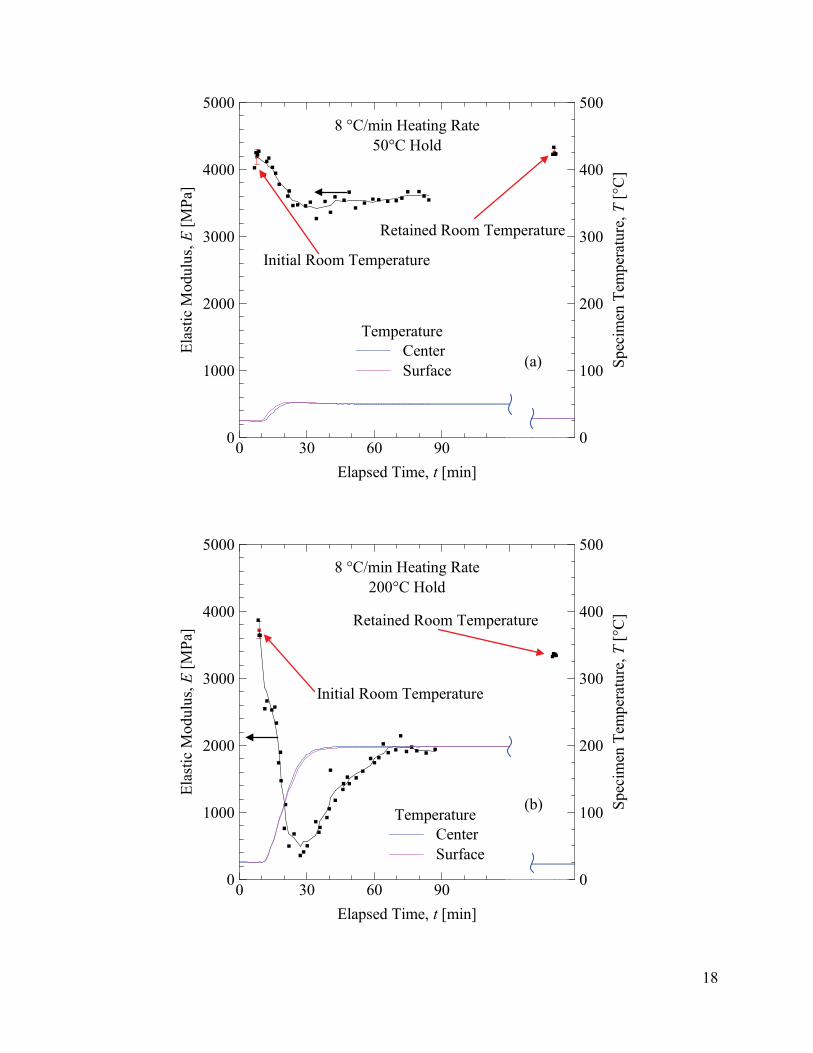
The strong dependence of the elastic modulus on the heating rate observed in Figure 14 raises the question what the elastic modulus variation is for an infinitely slow heating rate. Does the elastic modulus at a given temperature above 150°C continue to increase with decreasing heating rate? In order to investigate this issue, a special set of experiments was conducted where a specimen was heated (at approximately 8°C/min) to a pre-selected “hold” temperature and then held at this temperature for a time sufficient for the elastic modulus to attain a constant “steady-state” value. Representative results are shown in Figure 15 for four different hold temperatures: (a) 50°C, (b) 200°C, (c) 300°C, and (d) 370°C. In each of the graphs, the measured elastic modulus and temperature are plotted as a function of time. It can be seen that during the heating period, the elastic modulus varies in a similar fashion as already discussed in connection with Figure 10. However, during holding of the specimen at a given temperature, the elastic modulus can be seen to continue to change with time, except for the experiment with the lowest holding temperature (50°C, Figure 15a). For the higher three hold temperatures, the elastic modulus always increases during the holding period, until the constant steady-state value is achieved.
The constant steady-state values for the elastic modulus measured in the present set of experiments are plotted as a function of the hold temperature in Figure 16. For comparison, the elastic modulus variations with temperature for the 2°C/min and 8°C/min heating rates from Figure 14 are shown as well. It can be seen that the steady-state value for the elastic modulus for a hold temperature of 50°C is close to the instantaneous value measured in the continuous heating experiments. This is expected since below 125°C, the heating rate does not appear to have an influence on the elastic modulus. For all hold temperatures between 125°C and 370°C, the steady-state elastic modulus is equal to about 2,000 MPa, except at 300°C where it is 2,500 MPa. Except for the value at 370°C, these steady-state values are much higher than the instantaneous values measured during the continuous heating experiments. At 370°C, the steady-state value approaches the instantaneous value measured for the 2°C/min heating rate.
It should also be noted that the steady-state elastic moduli measured in the present set of experiments are in close agreement with those measured in References [4, 5]. This can be expected because the specimens in the experiments of References [4, 5] were indeed held at elevated temperatures for some time before the elastic modulus measurement was performed. 3.6 Retained Room Temperature Elastic Modulus After Holding at an Elevated Temperature
After the specimens of Section 3.5 were held at an elevated temperature for a long period of time, the power to the oven was shut off and the cooling system was activated. The oven was allowed to cool until the specimens were back at room temperature. Then, measurements of the retained room temperature elastic modulus were performed for each specimen. The results of these measurements are shown in Figure 15 and also plotted as a function of the elevated hold temperature prior to cooling in Figure 17. Figure 17 shows that for a hold temperature of 50°C the specimen fully recovers its initial room temperature stiffness.
However, for hold temperatures between 125°C and 370°C, the retained elastic modulus at room temperature is much lower than the initial room temperature value before any heating. This reduction in the room temperature elastic modulus indicates permanent degradation of the binder when heated to temperatures above 125°C. Such a permanent degradation can be expected since the binder undergoes irreversible chemical reactions during heating. For hold temperatures
18
Elapsed Time, t [min]
Elas
ticM
odul
us,E
[MPa
]
Spec
imen
Tem
pera
ture
,T[°
C]
0 30 60 90 1200
1000
2000
3000
4000
5000
0
100
200
300
400
500
Elapsed Time, t [min]
Elas
ticM
odul
us,E
[MPa
]
Spec
imen
Tem
pera
ture
,T[°
C]
0 30 60 90 1200
1000
2000
3000
4000
5000
0
100
200
300
400
500
Initial Room Temperature
Retained Room Temperature
CenterSurface
Temperature
(a)
Initial Room Temperature
Retained Room Temperature
8 °C/min Heating Rate200°C Hold
CenterSurface
Temperature (b)
8 °C/min Heating Rate50°C Hold
19
Figure 15: Elastic modulus variation during heating and holding at an elevated temperature until a constant steady-state value is attained. The holding temperatures are (a)
50°C, (b) 200°C, (c) 300°C, and (d) 370°C. The figures also show the measured retained elastic modulus after cooling to room temperature.
Elapsed Time, t [min]
Elas
ticM
odul
us,E
[MPa
]
Spec
imen
Tem
pera
ture
,T[°
C]
0 30 60 90 1200
1000
2000
3000
4000
5000
0
100
200
300
400
500
Elapsed Time, t [min]
Elas
ticM
odul
us,E
[MPa
]
Spec
imen
Tem
pera
ture
,T[°
C]
0 30 60 90 1200
1000
2000
3000
4000
5000
0
100
200
300
400
500
Initial Room Temperature
Retained Room Temperature
CenterSurface
Temperature (c)
Initial Room Temperature
Retained Room Temperature
8 °C/min Heating Rate
370°C Hold
CenterSurface
Temperature (d)
8 °C/min Heating Rate300°C Hold
20
between 125°C and 300°C, the urethane bonds break (Figure 12), and the retained room temperature elastic modulus is between 2,900 MPa and 3,400 MPa. These values should be compared to an average initial room temperature elastic modulus of 3,900 MPa. They are, however, higher than the steady state elastic moduli measured at the hold temperature (~2000 MPa, Figure 16), indicating that the specimens regain some stiffness upon cooling.
For the highest hold temperature of 370°C in Figure 17, a much stronger degradation of the room temperature elastic modulus can be observed. At this hold temperature, the retained room temperature elastic modulus is equal to about 1,400 MPa, compared to 3,900 MPa before heating. This stronger degradation can be expected because at about 350°C the binder starts to break down to polymer aromatics (Figure 12). A comparison of Figures 16 and 17 shows that even for the 370°C hold temperature the bonded sand retains most of its stiffness upon cooling to room temperature. Additional experiments, especially at higher hold temperatures, are needed to fully understand the variation of the elastic modulus during cooling.
Figure 16: Steady-state elastic modulus as a function of the hold temperature. The variations for the 2°C/min and 8°C/min heating rates are included for comparison.
Specimen Temperature, T [°C]
Elas
ticM
odul
us,E
[MPa
]
0 100 200 300 400 5000
1000
2000
3000
4000
5000Hold (Steady State Value)Instantaneous, 8 °C/minInstantaneous, 2 °C/min
21
4. Conclusions
The present three-point bend elastic modulus measurements for PUNB bonded sand reveal a complex behavior during heating and cooling. Previous studies have only reported the steady-state elastic moduli after extended holding of the bonded sand at elevated temperatures. The present measurements indicate that, for temperatures above 125°C, the variation of the elastic modulus with temperature is a strong function of the heating rate. Upon cooling, the permanent degradation of the binder prevents the bonded sand from regaining its original stiffness.
Before the present data can be used in stress simulations of a casting process, additional experiments are needed for more heating and cooling rates. In particular, the variations in the elastic modulus for the high heating rates that occur within 1 in of the mold-metal interface (> 50°C/min) have not at all been investigated in the present study. Measurements at such high heating rates are not possible using the present experimental setup, because the oven is not capable of achieving such heating rates and the specimen temperature would be highly non-uniform. It is possible that ultrasonic, indentation, or other unconventional techniques for the measurement of the elastic modulus are suitable for bonded sand heated at high rates.
Figure 17: Retained room temperature elastic modulus as a function of the hold temperature prior to cooling.
Roo
mTe
mpe
ratu
reR
etai
ned
Elas
ticM
odul
us,E
[MPa
]
0 100 200 300 400 5000
1000
2000
3000
4000
5000
6 Specimens
Elevated Hold Temperature Prior to Coolingto Room Temperature [°C]
22
Acknowledgements
This article is based upon work supported by the U.S. Department of Energy under Award No. DE-FC36-04GO14230. The authors would like to thank the Steel Founders’ Society of America for their support of this work. The authors would also like to express their gratitude to Mr. Jerry Thiel and staff of the University of Northern Iowa for their help with making the dump box and test specimens, and to Prof. Colby Swan of the University of Iowa for the use of lab space and equipment.
References
1. Monroe, C.A., Beckermann, C., and Klinkhammer, J., "Simulation of Deformation and Hot Tear Formation Using a Visco-Plastic Model with Damage," in Modeling of Casting, Welding, and Advanced Solidification Processes - XII, eds. S.L. Cockcroft and D.M. Maijer, TMS, Warrendale, PA, 2009, pp. 313-320.
2. P.J. Ahearn, F. Quigley, J.I. Bluhm, and J.F. Wallace, “Some Considerations On The Tensile And Transverse Strength Testing Of Shell Mold And Core Sands,” AFS Transactions, vol. 64, 1956, pp. 125-132.
3. F. Quigley, P.J. Ahearn, and J.F. Wallace, “Influence Of Various Bonding Materials On Stress-Strain Characteristics Of Bonded Sands,” AFS Transactions, vol. 65, 1957, pp 319-322.
4. “Final Report,” Arbeitsgemeinschaft Industrieller Forschungsvereinigungen Otto von Guericke, e.V. (AiF), 2008.
5. J. Thiel, “High Temperature Physical Properties of Chemically Bonded Sands Provide Insight into Core Distortion,” Proc. 62nd SFSA Technical and Operating Conference, Chicago, Illinois, December 2008.
6. ASTM Standard C1211, 2002 (2008), “Standard Test Method for Flexural Strength of Advanced Ceramics at Elevated Temperatures,” ASTM International, West Conshohocken, PA, 2008, DOI: 10.1520/C1211-02R08, www.astm.org.
7. ASTM Standard D5934, 2002 “Standard Test Method for Determination of Modulus of Elasticity for Rigid and Semi-Rigid Plastic Specimens by Controlled Rate of Loading Using Three-Point Bending,” ASTM International, West Conshohocken, PA, 2002, DOI: 10.1520/D5934-02, www.astm.org.
8. R.L. Naro and J.F. Hart, “Phenolic Urethane No-Bake Binders: Ten Years of Progress,” AFS Transactions, vol. 88, 1980, pp 57-66.
9. Y. Sakumoto, T. Nakazato, and A. Matsuzaki, “High-Temperature Properties of Stainless Steel for Building Structures,” Journal of Structural Engineering, vol. 122, n 4, pp. 399-406, April 1996.
10. S.R. Giese, S.C. Roorda, and M.A. Patterson, “Thermal Analysis of Phenolic Urethane Binder and Correlated Properties,” AFS Transactions, vol. 117, 2009, Paper# 09-112.