By Theresa Heredia and Gillian Sutherland, Freestone Vineyards, 1625 Freestone Flat Road, Freestone, CA 95472 and Christopher Motta and Anita Kant, MDS Analytical Technologies (US) Inc., 1311 Orleans Drive, Sunnyvale, CA 94089. INTRODUCTION: Measurement of tannin, iron-reactive phenolics, anthocyanin and polymeric pigment in red wine is an important part of quality control in the wine industry. Precise and reliable measurement of phenolic compounds in wine is critical for making decisions during fermentation, maceration, pressing and blending. Harbertson et al. developed a comprehensive red wine phenolics assay in 2003. 1 Traditionally this assay is performed using a cuvette-based UV-vis spectrophotometer. It is a time-consuming and laborious process of reading individual samples in separate cuvettes, recording the results, and analyzing the data. Identifying the need for a rapid and cost-effective way of performing the SPECTRAMAX APPLICATION NOTE #17 assay, Heredia et al. adapted the assay for a microplate platform. This approach increases the throughput with respect to labor, time and sample volume. The assay widens the capacity to monitor the fermentations for extraction of phenolic compounds in an average-sized winery. Here we describe the use of MDS Analytical Technologies’ SpectraMax ® Plus 384 microplate reader and SoftMax ® Pro software to efficiently collect and analyze the data for this assay. Some of the unique features of the SpectraMax Plus 384 absorbance microplate reader are: > Wavelength range: 190–1000 nm in 1-nm increments > Dual monochromator-based optics eliminate the need for filters (Figure 1) > Read speed: 96 wells: 9 Seconds 384 wells: 29 Seconds > Temperature: 4°C above ambient to 45°C > Cuvette port: Holds standard cuvettes and 12 x 75 mm test tubes > OD range: 0–4 OD Red wine phenolic assay The Adams/Harbertson assay uses spectrophotometry, protein precipitation and bisulfite-bleaching techniques to measure red wine phenolics. PathCheck ® Sensor The PathCheck ® Sensor is a patented feature from MDS Analytical Technologies that measures the optical pathlength of samples in microplate wells. It is an innovative way of normalizing the absorbance reading in a microplate well to that of a 1-cm cuvette. The Beer-Lambert Law states that Absorbance = E * C * L where E = absorptivity (extinction coefficient) C = concentration L = pathlength now part of MDS Analytical Technologies Measurement of Phenolic Compounds in Red Wines Using the SpectraMax ® Plus 384 Microplate Reader monochromator monochromator SpectraMax Plus 384 only elliptical input mirror flash lamp blocking filters measuring photodetector beam splitter 96- or 384-well microplate elliptical mirror concave holographic grating input slit reference photodetector 9-channel optic fibers measuring photodetector beam splitter cuvette elliptical mirror reference photodetector SpectraMax ® Plus 384 Optics (Figure 1)
Transcript
By Theresa Heredia and Gillian Sutherland, Freestone Vineyards, 1625 Freestone Flat Road, Freestone, CA 95472 and Christopher Motta and Anita Kant, MDS Analytical Technologies (US) Inc., 1311 Orleans Drive, Sunnyvale, CA 94089.
IntroductIon:
Measurement of tannin, iron-reactive phenolics, anthocyanin and polymeric pigment in red wine is an important part of quality control in the wine industry. Precise and reliable measurement of phenolic compounds in wine is critical for making decisions during fermentation, maceration, pressing and blending. Harbertson et al. developed a comprehensive red wine phenolics assay in 2003.1 Traditionally this assay is performed using a cuvette-based UV-vis spectrophotometer. It is a time-consuming and laborious process of reading individual samples in separate cuvettes, recording the results, and analyzing the data. Identifying the need for a rapid and cost-effective way of performing the
SpectraMax applIcatIon note #17
assay, Heredia et al. adapted the assay for a microplate platform. This approach increases the throughput with respect to labor, time and sample volume. The assay widens the capacity to monitor the fermentations for extraction of phenolic compounds in an average-sized winery. Here we describe the use of MDS Analytical Technologies’ SpectraMax® Plus384 microplate reader and SoftMax® Pro software to efficiently collect and analyze the data for this assay.
Some of the unique features of the SpectraMax Plus384 absorbance microplate reader are: > Wavelength range: 190–1000 nm in 1-nm
increments
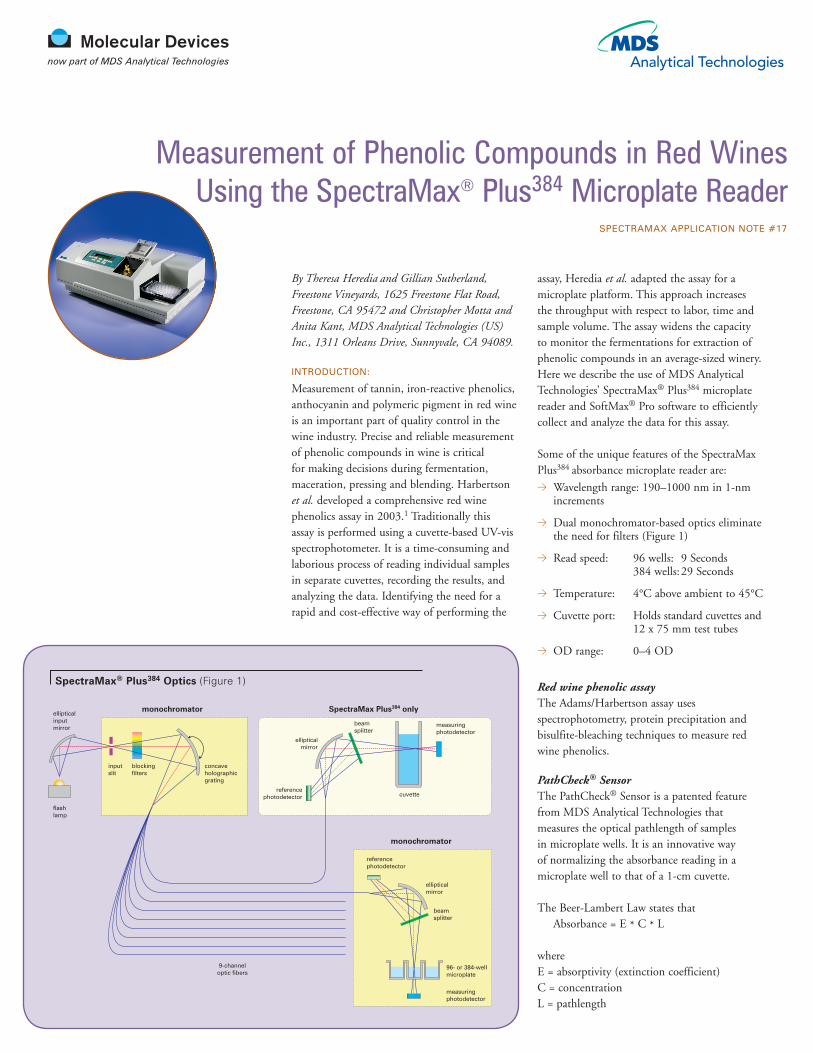
> Dual monochromator-based optics eliminate the need for filters (Figure 1)
> Cuvette port: Holds standard cuvettes and 12 x 75 mm test tubes
> OD range: 0–4 OD
Red wine phenolic assayThe Adams/Harbertson assay uses spectrophotometry, protein precipitation and bisulfite-bleaching techniques to measure red wine phenolics.
PathCheck® SensorThe PathCheck® Sensor is a patented feature from MDS Analytical Technologies that measures the optical pathlength of samples in microplate wells. It is an innovative way of normalizing the absorbance reading in a microplate well to that of a 1-cm cuvette.
The Beer-Lambert Law states that Absorbance = E * C * L
where E = absorptivity (extinction coefficient) C = concentration L = pathlength
now part of MDS Analytical Technologies
Measurement of Phenolic Compounds in Red Wines Using the SpectraMax® Plus384 Microplate Reader
monochromator
monochromator
SpectraMax Plus384 onlyellipticalinputmirror
flashlamp
blockingfilters
measuringphotodetector
beamsplitter
96- or 384-wellmicroplate
ellipticalmirror
concaveholographicgrating
inputslit
referencephotodetector
9-channeloptic fibers
measuringphotodetector
beamsplitter
cuvette
ellipticalmirror
referencephotodetector
SpectraMax® Plus384 Optics (Figure 1)
In the case of a cuvette, the optical path is horizontal. Hence the pathlength is fixed and is equal to 1 cm. But in the case of a microplate, the optical path is vertical. So, the pathlength depends on the volume of the sample. (See Figure 2.) The PathCheck Sensor corrects for the discrepancy.
SoftMax® Pro SoftwareSoftMax® Pro software controls the instrument, collects the data, and provides complete data analysis. Customized protocols with appropriate instrument settings and calculations can be pre-written and saved. The end user can conveniently open a pre-configured protocol and obtain complete results and analysis with no protocol setup time.
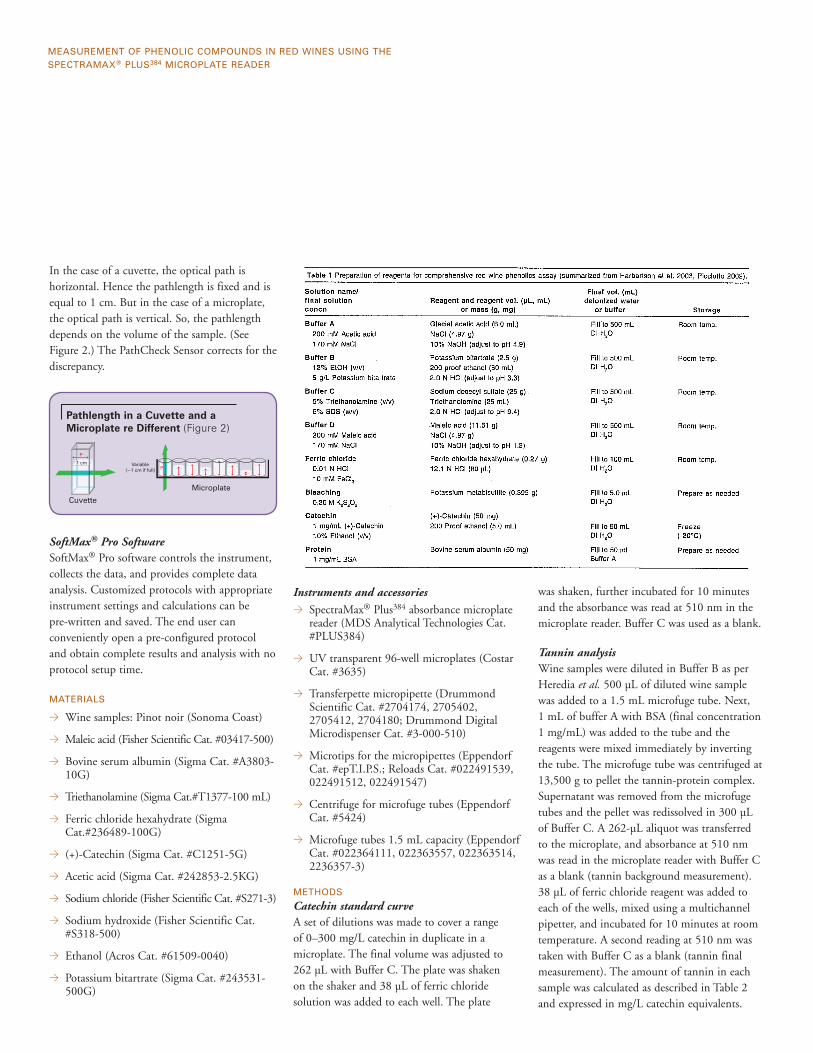
Catechin standard curveA set of dilutions was made to cover a range of 0–300 mg/L catechin in duplicate in a microplate. The final volume was adjusted to 262 µL with Buffer C. The plate was shaken on the shaker and 38 µL of ferric chloride solution was added to each well. The plate
was shaken, further incubated for 10 minutes and the absorbance was read at 510 nm in the microplate reader. Buffer C was used as a blank.
Tannin analysisWine samples were diluted in Buffer B as per Heredia et al. 500 µL of diluted wine sample was added to a 1.5 mL microfuge tube. Next, 1 mL of buffer A with BSA (final concentration 1 mg/mL) was added to the tube and the reagents were mixed immediately by inverting the tube. The microfuge tube was centrifuged at 13,500 g to pellet the tannin-protein complex. Supernatant was removed from the microfuge tubes and the pellet was redissolved in 300 µL of Buffer C. A 262-µL aliquot was transferred to the microplate, and absorbance at 510 nm was read in the microplate reader with Buffer C as a blank (tannin background measurement). 38 µL of ferric chloride reagent was added to each of the wells, mixed using a multichannel pipetter, and incubated for 10 minutes at room temperature. A second reading at 510 nm was taken with Buffer C as a blank (tannin final measurement). The amount of tannin in each sample was calculated as described in Table 2 and expressed in mg/L catechin equivalents.
Pathlength in a Cuvette and a Microplate re Different (Figure 2)
Microplate
Variable(~1 cm if full)
1 cm
Cuvette
P
P
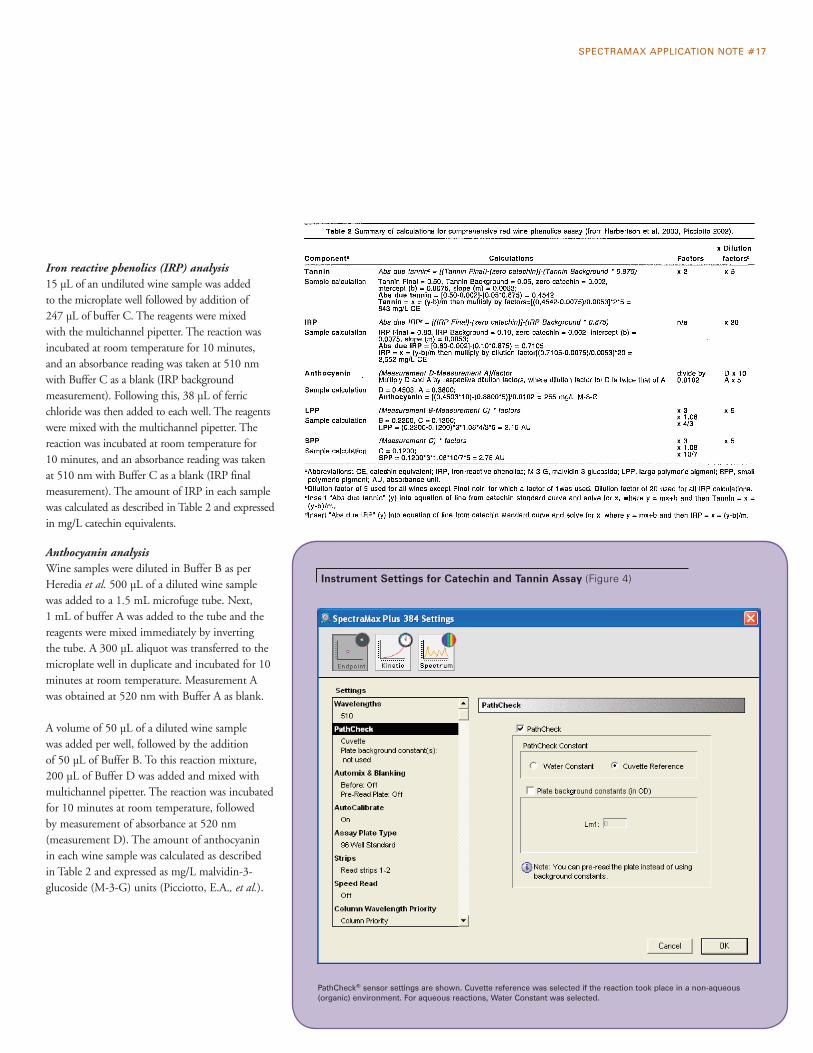
Instrument Settings for Catechin and Tannin Assay (Figure 4)
pathcheck® sensor settings are shown. cuvette reference was selected if the reaction took place in a non-aqueous (organic) environment. For aqueous reactions, Water constant was selected.
SpectraMax applIcatIon note #17
Iron reactive phenolics (IRP) analysis15 µL of an undiluted wine sample was added to the microplate well followed by addition of 247 µL of buffer C. The reagents were mixed with the multichannel pipetter. The reaction was incubated at room temperature for 10 minutes, and an absorbance reading was taken at 510 nm with Buffer C as a blank (IRP background measurement). Following this, 38 µL of ferric chloride was then added to each well. The reagents were mixed with the multichannel pipetter. The reaction was incubated at room temperature for 10 minutes, and an absorbance reading was taken at 510 nm with Buffer C as a blank (IRP final measurement). The amount of IRP in each sample was calculated as described in Table 2 and expressed in mg/L catechin equivalents.
Anthocyanin analysisWine samples were diluted in Buffer B as per Heredia et al. 500 µL of a diluted wine sample was added to a 1.5 mL microfuge tube. Next, 1 mL of buffer A was added to the tube and the reagents were mixed immediately by inverting the tube. A 300 µL aliquot was transferred to the microplate well in duplicate and incubated for 10 minutes at room temperature. Measurement A was obtained at 520 nm with Buffer A as blank.
A volume of 50 µL of a diluted wine sample was added per well, followed by the addition of 50 µL of Buffer B. To this reaction mixture, 200 µL of Buffer D was added and mixed with multichannel pipetter. The reaction was incubated for 10 minutes at room temperature, followed by measurement of absorbance at 520 nm (measurement D). The amount of anthocyanin in each wine sample was calculated as described in Table 2 and expressed as mg/L malvidin-3-glucoside (M-3-G) units (Picciotto, E.A., et al.).
Instrument setupThe instrument was programmed through the SoftMax® Pro software. The settings were fed in the plate section of the software. (See Figure 4.)
Step 1. The reading type was endpoint.
Step 2. The wavelength was set at 510 nm (for tannin, catechin and iron-reactive phenolics) or at 520 nm (for the measurements A, B, C, D) by typing the appropriate number in the wavelength option.
Step 3. “PathCheck” option was selected. If the reaction took place in an aqueous environment, the option for Water Constant was selected, and the software used the constant included in the firmware. If the reaction took place in non-aqueous environment, the option for cuvette reference was selected. During this reading, a cuvette filled with the organic buffer was inserted in the cuvette port. The instrument took the reading from the cuvette and used it to correct the pathlength.
Step 4. Automixing was not selected.
Step 5. With autocalibration, the instrument calibrated itself for the selected wavelength.
Step 6. Appropriate plate format and wells to be read were selected.
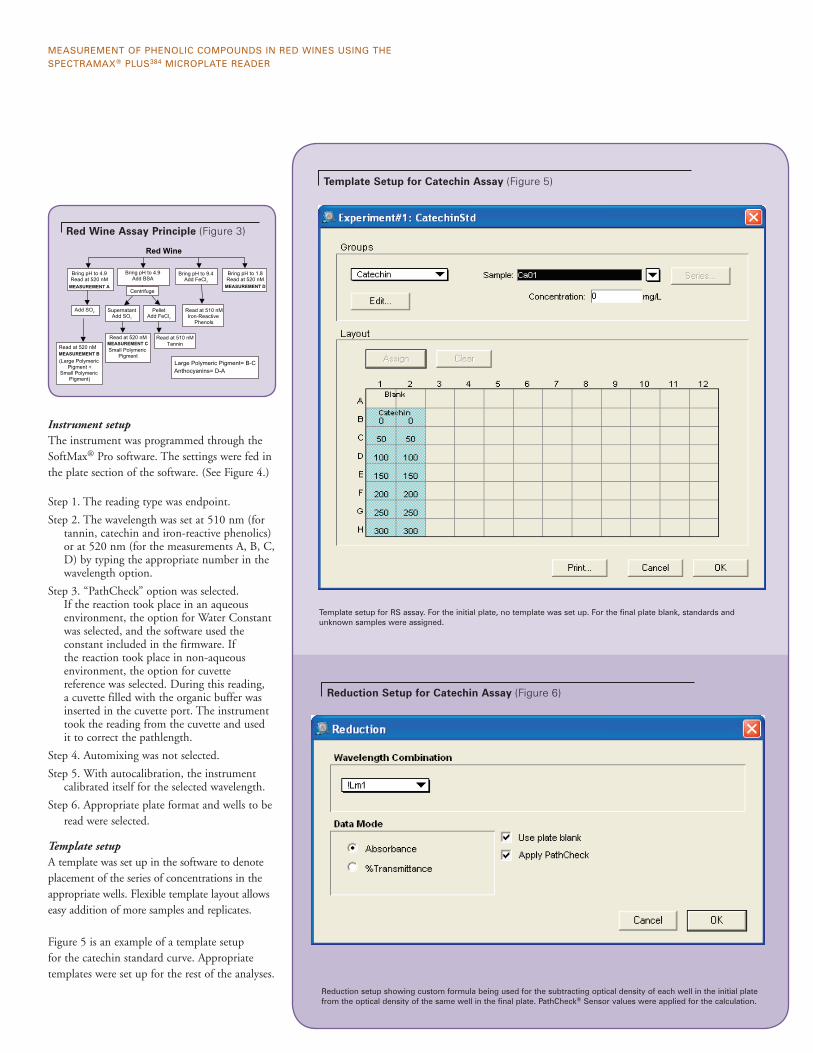
Template setupA template was set up in the software to denote placement of the series of concentrations in the appropriate wells. Flexible template layout allows easy addition of more samples and replicates.
Figure 5 is an example of a template setup for the catechin standard curve. Appropriate templates were set up for the rest of the analyses.
Template Setup for Catechin Assay (Figure 5)
Reduction Setup for Catechin Assay (Figure 6)
template setup for rS assay. For the initial plate, no template was set up. For the final plate blank, standards and unknown samples were assigned.
reduction setup showing custom formula being used for the subtracting optical density of each well in the initial plate from the optical density of the same well in the final plate. pathcheck® Sensor values were applied for the calculation.
MeaSureMent oF phenolIc coMpoundS In red WIneS uSIng the SpectraMax® pluS384 MIcroplate reader
Red Wine Assay Principle (Figure 3)
Bring pH to 4.9 Read at 520 nM
MEASUREMENT A
Add SO2
Read at 520 nMMEASUREMENT B
(Large Polymeric Pigment +
Small Polymeric Pigment)
Bring pH to 4.9 Add BSA
Bring pH to 9.4 Add FeCl3
Bring pH to 1.8 Read at 520 nM
MEASUREMENT D
Read at 510 nM
Iron-Reactive Phenols
Supernatant Add SO2
Pellet Add FeCl3
Read at 510 nMTannin
Read at 520 nM MEASUREMENT C
Small Polymeric Pigment
Large Polymeric Pigment= B-C
Anthocyanins= D-A
Red Wine
Centrifuge
reSultS
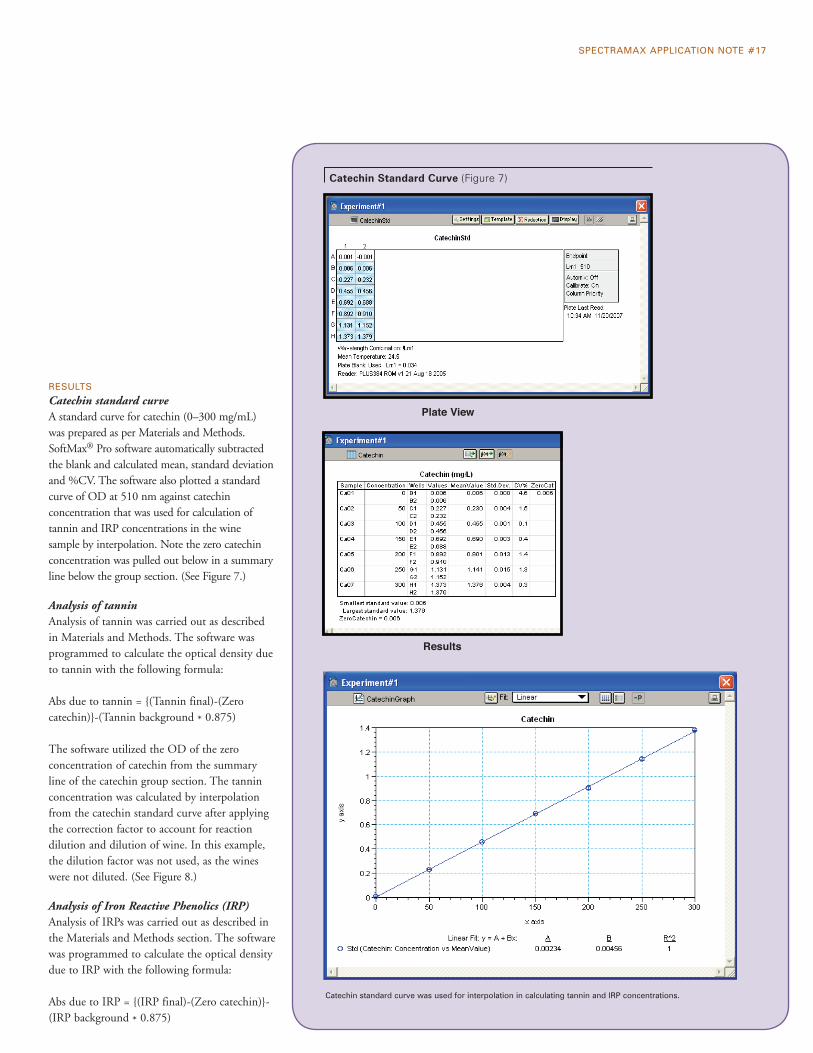
Catechin standard curveA standard curve for catechin (0–300 mg/mL) was prepared as per Materials and Methods. SoftMax® Pro software automatically subtracted the blank and calculated mean, standard deviation and %CV. The software also plotted a standard curve of OD at 510 nm against catechin concentration that was used for calculation of tannin and IRP concentrations in the wine sample by interpolation. Note the zero catechin concentration was pulled out below in a summary line below the group section. (See Figure 7.)
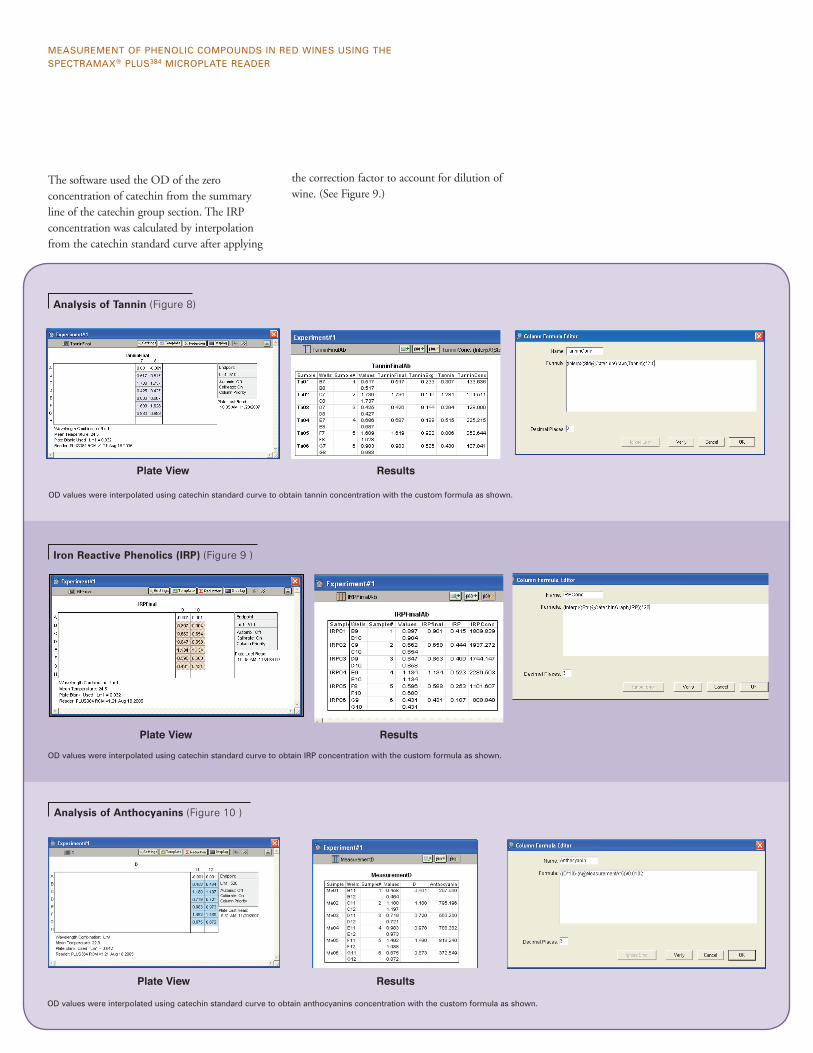
Analysis of tanninAnalysis of tannin was carried out as described in Materials and Methods. The software was programmed to calculate the optical density due to tannin with the following formula:
Abs due to tannin = {(Tannin final)-(Zero catechin)}-(Tannin background * 0.875)
The software utilized the OD of the zero concentration of catechin from the summary line of the catechin group section. The tannin concentration was calculated by interpolation from the catechin standard curve after applying the correction factor to account for reaction dilution and dilution of wine. In this example, the dilution factor was not used, as the wines were not diluted. (See Figure 8.)
Analysis of Iron Reactive Phenolics (IRP)Analysis of IRPs was carried out as described in the Materials and Methods section. The software was programmed to calculate the optical density due to IRP with the following formula:
Abs due to IRP = {(IRP final)-(Zero catechin)}-(IRP background * 0.875)
Catechin Standard Curve (Figure 7)
catechin standard curve was used for interpolation in calculating tannin and Irp concentrations.
Results
Plate View
SpectraMax applIcatIon note #17
The software used the OD of the zero concentration of catechin from the summary line of the catechin group section. The IRP concentration was calculated by interpolation from the catechin standard curve after applying
Analysis of Anthocyanins (Figure 10 )
Iron Reactive Phenolics (IRP) (Figure 9 )
od values were interpolated using catechin standard curve to obtain Irp concentration with the custom formula as shown.
od values were interpolated using catechin standard curve to obtain tannin concentration with the custom formula as shown.
od values were interpolated using catechin standard curve to obtain anthocyanins concentration with the custom formula as shown.
Analysis of Tannin (Figure 8)
MeaSureMent oF phenolIc coMpoundS In red WIneS uSIng the SpectraMax® pluS384 MIcroplate reader
Results
Results
Results
Plate View
Plate View
Plate View
the correction factor to account for dilution of wine. (See Figure 9.)
Analysis of anthocyaninsAnalysis of anthocyanins was carried out as described in Materials and Methods. The software was programmed to calculate the concentration of anthocyanins with the following formula:
((Measurement D*10)-(Measurement A*5))/0.0102
Here, numbers 10 and 5 represent the respective dilution factors, and 0.0102 is the conversion factor needed to express the anthocyanin concentration in malvidin-3-glucoside (M-3-G) units (Picciotto, E.A. et al.). (See Figure 10.)
concluSIonS
> The SpectraMax® Plus384 absorbance microplate reader from MDS Analytical Technologies is a good choice for running red wine phenolics assay described by Heredia et al. in a 96-well microplate.
> Other suitable microplate readers with absorbance detection mode from MDS Analytical Technologies include SpectraMax M2/M2e and SpectraMax M5/M5e readers.
> Using the microplate format is both cost- and time-effective.
> The tunability and PathCheck® Sensor features of the SpectraMax® Plus384 microplate reader aid in achieving higher precision and accuracy.
> SoftMax® Pro software is a convenient tool for analysis and calculation of complicated and large data sets. It offers pre-written, ready-to-use protocols, custom formulas, and appropriate graphing options.
SaleS oFFIceS
United States & CanadaMdS analytical technologies (uS) Inc. tel. +1-800-635-5577 Fax +1-408-747-3601
BrazilMolecular devices Brazil tel. +55-11-3616-6607 Fax +55-11-3616-6607
> For increased throughput requirements, MDS Analytical Technologies’ StakMax® microplate handling system integrates with SpectraMax® readers and enables automated processing of batches of 20, 40, or 50 microplates.
reFerenceS
1. Harbertson J F et al.; (2002) Am J Enol Vitic 53: 54-59.
2. Harbertson J F et al.; (2003) Am J Enol Vitic 54: 301-306.
3. Harbertson J F et al.; (2004) Am J Enol Vitic 55: 295A.
4. Heredia T M et al.; (2006) Am J Enol Vitic 57: 497-502.
5. Picciotto E A et al.; (2002) Thesis, University of California, Davis.