74
1 Q01122 Project Title: Measurement of theobromine content in cocoa for determining cocoa solids content in chocolate and chocolate products August 2011

1
Q01122 Project Title: Measurement of theobromine content in cocoa for determining cocoa solids content in chocolate and chocolate products August 2011

2
Executive Summary Cocoa and chocolate products are a multi million pound industry in the UK and throughout Europe. More chocolate is consumed in Europe than any other continent of the world. The amount of cocoa present in chocolate products is generally regarded as a guide to quality and attempts to quantify it accurately by analysis has been going on for over 100 years. The labelling and composition of chocolate products are controlled by the Cocoa and Chocolate Products (England) Regulations 2003 which implement the EC Directive 2000/36/EC. Identical provisions for labelling and composition are included in parallel regulations across the U.K. The regulations specify a range of reserved descriptions for chocolate products which have minimum requirements for levels of cocoa solids (and milk solids) to be present. The measurement of cocoa solids in chocolate products has been carried out routinely by manufacturers and enforcement laboratories for many years. Over time the methods used have changed and been improved upon, but all of the methods have been based upon measurement of the naturally occurring alkaloids, theobromine and caffeine, present in cocoa. Direct measurement of alkaloid content enables the determination of total non-fat cocoa solids. In the last 50 years little systematic work has been done to establish whether the level of alkaloids has changed as a result of different methods of production or environmental factors. The main objectives of the project were to optimise the method for theobromine determination, and apply the method to analyse the theobromine content, over a two year period, of around 200 samples of cocoa from around the world. The extended time period of analysis was to take account of seasonal variations in growing conditions and possible natural changes in alkaloid levels. A conversion factor could then be calculated from the average theobromine levels in cocoa, and compared with previously established factors to find out whether the levels of alkaloids have changed over the years. At the start of the project, a ring trial between five different European labs was carried out to assess the comparability in the results for alkaloids and fat in six samples of cocoa liquor obtained when different analytical methods were used. The results of the ring trial showed that the methodology proposed by Durham for measurement of alkaloids was fit for purpose. The levels of moisture in samples, as measured using Karl Fischer analysis, were also found to be variable and so corrections to alkaloid levels were made to take account of this. The fat content of the samples was also measured and the alkaloid levels calculated on the dry fat free part of the cocoa liquor. The results showed that the levels of theobromine present were found to be generally lower than those found in survey work carried out over the last 50 years. This could be due to a combination of factors, including changes in the cocoa varieties being grown and an increase in use of hybrid varieties of cocoa that are hardy and high yielding, as well as changes in climate and cultivation methods. It must also be recognised that whilst in the past, analysts were probably measuring total alkaloids accurately; it was not always clear from the lack of detail in the references what measurements were being performed. Furthermore, the results indicate that the

3
conversion factor, calculated from theobromine content in the 200 samples of cocoa liquor, is higher than the factor currently used by enforcement laboratories to calculate the dry fat free cocoa solids. The mean theobromine content of the cocoa liquor samples tested was 24,572 mg/kg which provided a conversion factor of 40.7. The conversion factor multiplied by the percentage of theobromine in the sample gives an indication of dry fat free cocoa solids in the food. The standard deviation of the results from 191 samples was 3,470 mg/kg and the range was 19803 – 39,168 mg/kg. This indicated that considerable caution must be taken when reporting on cocoa content of foods when the composition of the original cocoa liquor is unknown. Enforcement organisations will generally take the statistical variation of the results into account when reporting on predicted composition. Indication of adverse results on samples usually leads to further investigation of further samples and / or the source of raw materials used. Where the source of cocoa is known, it would be more appropriate to use a factor obtained for that geographical area. Persistent low results on a food would give cause for concern. A comparison of the cocoa solids content calculated using the new factor of 40.7 and the current factor of 35.9 was carried out. It was found that the current factor gave lower results for cocoa solids than with the new calculated factor. The new factor also gave results closer to the expected amount than the current conversion factor, i.e. the calculation of cocoa levels in the controlled samples of manufactured chocolate were generally in better agreement with predictions using the new factor than with the current factor. Where total alkaloids are measured instead of theobromine alone a factor of 36.1 is proposed. The manufacture of chocolate takes place by blending ingredients including cocoa liquor, sugar and flavourings. In some cases cocoa powder is added as well as additional cocoa fat, milk solids or vegetable fats. To validate the results of the cocoa liquor samples and determine the fitness for purpose of the new calculated factors, tests were carried out to measure the levels of alkaloids and fat in twenty samples of both the cocoa liquor and the finished chocolate made from the liquors. The results from the liquor were used to calculate the amount of dry fat free cocoa present in the chocolate. These results were compared with the amounts declared to be present. In general there was good agreement between the calculated amounts of cocoa liquor present and the actual declared amounts. All of the in-house quality control checks carried out during the lifetime of the project were satisfactory. The paper has been extensively peer reviewed and the data and method were considered robust and fit for purpose. The method will be available to download through the Public Analyst journal website, http://www.apajournal.org.uk/index.html

4
Contents Glossary and Definitions ..........................................................................................5
Introduction ................................................................................................................7
Aims and Objectives ........................................................................................7
Background .....................................................................................................8
Legislation ........................................................................................................8
Cocoa Cultivation .............................................................................................8
The Chocolate Manufacturing Process ............................................................9
Compounds of Interest ...................................................................................11
Literature Review ......................................................................................................11
Historical Methods of Analysis ........................................................................11
Previously Reported Levels of Alkaloids .........................................................13
Project Approach ............................................................................................15
Collaborators ............................................................................................................16
Cocoa Sampling ........................................................................................................16
Ring Trial Protocol ....................................................................................................17
Analysis of chocolate ....................................................................................22
Effect of varieties ..........................................................................................22
Total nitrogen ................................................................................................23
Conclusion ...............................................................................................................23
Acknowledgements .................................................................................................25
References ...............................................................................................................26
Appendix 1 – Results of ring trial ..............................................................................27
Appendix 2 – VEMS Method for additives and flavourings ...................................29
Appendix 3 – CIRAD Statistical information on purines content of cocoa ..............41
Appendix 4 – Results of analysis on 191 samples of cocoa liquor .........................43
Appendix 5 – Laboratory AQC ...............................................................................55
Appendix 6 – Comparison alkaloids in cocoa liquor and chocolate samples ............58
Appendix 7 – SOP for analysis of theobromine in chocolate and chocolate products61
Appendix 8 – Reference method for quantification of cocoa butter equivalents........ 72
Appendix 9 – Total nitrogen in cocoa liquor .........................................................73

5
Glossary
AOAC Association of official analytical chemists
APA Association of Public Analysts
AQC Analytical quality control
BC Barry Callebaut
CI Confidence interval, at 95% level
CIRAD Centre de coopération internationale en recherche agronomique pour le développement
DAD Diode array detector
DFFC Dry fat free cocoa
FSA Food Standards Agency
HPLC High pressure liquid chromatography
IOCCC International office of cocoa and chocolate and sugar confectionery
IQ Koln Institut für Qualitätsförderung
JAOAC Journal of Official Analytical Chemists
JAPA Journal of Association of Public Analysts
KF Karl Fischer
LCI LebensmittelchemischeIsn Istitut
LOD Limit of detection
sd Standard deviation
UV Ultra violet
VEMS Validated Enforcement Methods
Definitions Chocolate
The product obtained from cocoa products and sugars which contains not less than 35 per cent total dry cocoa solids, including not less than 18 per cent cocoa butter and not less than 14 per cent of dry non-fat cocoa solids.
Cocoa beans The seeds of the cacao tree (theobroma cacao) fermented and dried.
Cocoa liquor (or mass) Cocoa nib reduced to a paste by a mechanical process without losing any of its natural fat content.
Cocoa powder or cocoa The product obtained by converting into powder cocoa beans which have been cleaned, shelled and roasted, and which contains not less than 20 per cent cocoa butter, calculated according to the weight of the dry matter, and not more than 9 per cent water.
Milk chocolate
The product obtained from cocoa products, sugars and milk or milk products
which contain:
not less than 20 per cent total dry cocoa solids;

6
not less than 20 per cent dry milk solids obtained by partly or
wholly dehydrating whole milk, semi-skimmed or skimmed milk,
cream, or from partly or wholly dehydrated cream, butter or milk
fat;
not less than 2.5 per cent dry non-fat cocoa solids;
not less than 5 per cent milk fat;
not less than 25 per cent total fat (cocoa butter and milk fat). Nib
Cocoa beans, roasted or unroasted, when cleaned, shelled and having a maximum residue of 5% shell or germ and a maximum content of 10% ash – these percentages to be based upon the weight of dry defatted matter.
Kibbled The process of coarse grinding of a material such as cocoa nib
7
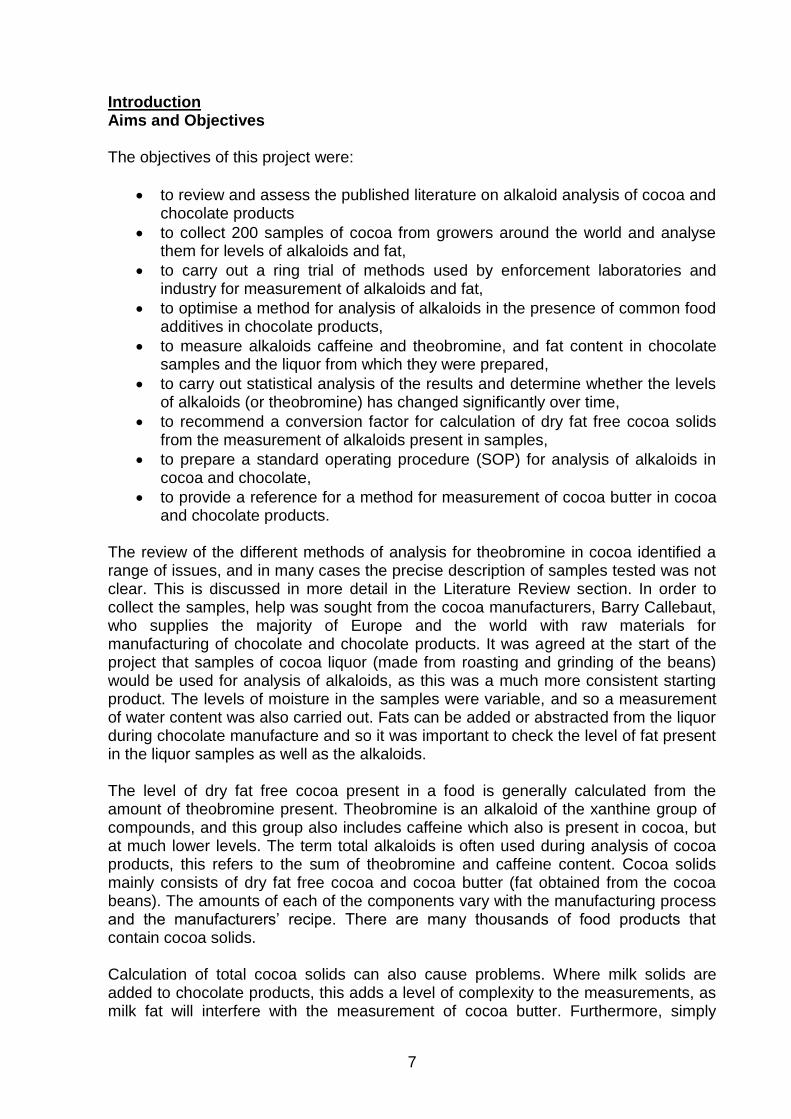
Introduction Aims and Objectives The objectives of this project were:
to review and assess the published literature on alkaloid analysis of cocoa and chocolate products
to collect 200 samples of cocoa from growers around the world and analyse them for levels of alkaloids and fat,
to carry out a ring trial of methods used by enforcement laboratories and industry for measurement of alkaloids and fat,
to optimise a method for analysis of alkaloids in the presence of common food additives in chocolate products,
to measure alkaloids caffeine and theobromine, and fat content in chocolate samples and the liquor from which they were prepared,
to carry out statistical analysis of the results and determine whether the levels of alkaloids (or theobromine) has changed significantly over time,
to recommend a conversion factor for calculation of dry fat free cocoa solids from the measurement of alkaloids present in samples,
to prepare a standard operating procedure (SOP) for analysis of alkaloids in cocoa and chocolate,
to provide a reference for a method for measurement of cocoa butter in cocoa and chocolate products.
The review of the different methods of analysis for theobromine in cocoa identified a range of issues, and in many cases the precise description of samples tested was not clear. This is discussed in more detail in the Literature Review section. In order to collect the samples, help was sought from the cocoa manufacturers, Barry Callebaut, who supplies the majority of Europe and the world with raw materials for manufacturing of chocolate and chocolate products. It was agreed at the start of the project that samples of cocoa liquor (made from roasting and grinding of the beans) would be used for analysis of alkaloids, as this was a much more consistent starting product. The levels of moisture in the samples were variable, and so a measurement of water content was also carried out. Fats can be added or abstracted from the liquor during chocolate manufacture and so it was important to check the level of fat present in the liquor samples as well as the alkaloids. The level of dry fat free cocoa present in a food is generally calculated from the amount of theobromine present. Theobromine is an alkaloid of the xanthine group of compounds, and this group also includes caffeine which also is present in cocoa, but at much lower levels. The term total alkaloids is often used during analysis of cocoa products, this refers to the sum of theobromine and caffeine content. Cocoa solids mainly consists of dry fat free cocoa and cocoa butter (fat obtained from the cocoa beans). The amounts of each of the components vary with the manufacturing process and the manufacturers‟ recipe. There are many thousands of food products that contain cocoa solids. Calculation of total cocoa solids can also cause problems. Where milk solids are added to chocolate products, this adds a level of complexity to the measurements, as milk fat will interfere with the measurement of cocoa butter. Furthermore, simply

8
adding the fat-free dry cocoa and total fat together is not recommended as there is often more than one source of fat present. Vegetable fats, milk and lecithin are routinely added to many products, and these would need to be estimated before calculation of total cocoa solids can be made. A method was sourced, published by M. Buchgraber and S Androni, that has attempted to overcome the problem. This method was published in the report EUR 22666 EN by European Commission, Directorate-General Joint Research Centre, Institute for Reference Materials, Geel, Belgium. Background Legislation The labelling and composition of chocolate products are controlled by the Cocoa and Chocolate Products (England) Regulations 2003 which implement the EC Directive 2000/36/EC. Identical provisions for labelling and composition are included in parallel regulations across the U.K. The regulations specify a range of reserved descriptions for chocolate products which have minimum requirements for levels of cocoa solids (and milk solids) to be present. The specific names used to describe a range of cocoa and chocolate products are known as reserved descriptions. These chocolate products must carry labelling that declares the percentage of cocoa solids and, where appropriate, milk solids in the final food. Many methods have been used by enforcement laboratories over the last 100 years to check the accuracy of the declarations, and these were reviewed as part of this project. The conversion factor used to determine dry fat-free cocoa solids have also changed over the years. There is a need to review and update the factors, in order to have more accurate picture of the levels of the alkaloid marker, theobromine, in chocolate today. As a result of the experimental work described below, we propose a new modified approach to the measurement of dry cocoa solids content, and recommend a conversion factor calculated from these. Cocoa Cultivation Cocoa is the dried and partially fermented fatty seed of the cacao tree, Theobroma cacao. The seeds grow in pods generally 15 to 20cm long with a thick leathery outer skin. Each pod is filled with sweet pulp enclosing 30-50 large almond shaped beans, which are usually deep purple but can be white, pink or violet depending on the variety, and about 3cm in length. When the pods ripen (changing from a green to yellow colour or from red to orange depending on the variety) they are harvested. Harvesting occurs twice a year. The pods then are opened and the beans extracted with the pulp. The beans and pulp are heaped under banana leaves or placed in fermentation boxes for four to seven days. During this time the pulp ferments and liquefies, and a complex series of chemical reactions leads to the development of flavour pre-cursors which will give rise to the chocolate aromas during roasting. The liquefied pulp (sweating) drains away, leaving the fermented beans. The beans then are dried by the sunshine (or artificially) by spreading out and raking regularly to mix the product. The final moisture content is about 8 per cent.

9
Cocoa trees only grow successfully within a narrow latitude of the equator, with the majority of world production occurring in western Africa. The major producers in Africa are Ivory Coast, Ghana and Nigeria. Other producing areas are Indonesia, Brazil, Cameroon and Ecuador. There are three main „types‟ of cocoa; Forastero, Criollo and Trinitario. The Forastero variety accounts for most of the production, particularly in West Africa. Criollo and Trinitario type cocoas are often lower yielding and/or more difficult to cultivate but they are grown for their specialty flavour characteristics, for example in some regions of South and Central America, the Caribbean, Java and Papua New Guinea. Trinatario is a hybrid of the other two types, and carries varying characteristics of each type. The Chocolate Manufacturing Process The manufacturing process involves roasting the beans at a temperature up to 140°C where the moisture content is at least halved. The seed coat (shell) is partially loosened and then removed by winnowing. The roasted nib is ground into a semi-plastic substance known as the „cocoa liquor‟ or „cocoa mass‟. At this stage the product contains around 50% cocoa butter. The liquor is often “alkalised” which involves heating with a solution of potassium or calcium carbonate (1%). This is known as the Dutch process. The majority of the remaining moisture is removed by heating to 110°C. The resulting product then is pressed to remove some of the cocoa butter and then pulverised into cocoa powder. The removal of the cocoa butter is necessary as the resultant slurry is too rich and fat separation occurs. The higher the remaining fat content, the darker the colour of the powder. The project leader organised a visit to the research laboratories and manufacturing plant of Barry Callebaut (BC) in Brussels, to see the manufacturing process, from beans to the packaged chocolate product. The details of the project were also discussed with BC representatives during the visit, as BC would be supplying the cocoa liquor samples for the project. BC manufacture around 1000 tonnes of chocolate per day and are one of 3 major cocoa producers in Europe. They also supply cocoa to many of the major chocolate manufacturers around the world. Cocoa beans are delivered to the factory in large sacks from the plantations. They are often blended followed by roasting and winnowing before the roasted nibs are milled in a rotary grinder. The friction produced is sufficient to melt the cocoa fat and liquefy the product to produce cocoa liquor (also known as cocoa mass). The raw ingredients used to make chocolate are cocoa and sugar. Milk solids are added if the final product is milk chocolate. Flavourings and emulsifiers are often added as minor ingredients. The cocoa liquor is pressed to extract cocoa butter leaving a solid residue called press cake. Press cake is usually kibbled (broken or coarsely ground) to produce cocoa powder. The retained cocoa powder can be mixed with liquor and blended with varying amounts of cocoa fat and other ingredients to produce the different types of chocolate. Typical recipes are: Plain Dark Chocolate 70% cocoa solids (cocoa liquor and cocoa butter),

10
29% sugar, vegetable lecithin as emulsifier and vanilla (vanillin) to flavour. Milk Chocolate 40% cocoa solids (cocoa liquor and cocoa mass), 37% sugar, 20% whole milk powder, lactose, vegetable lecithin as emulsifier and vanilla (or vanillin) as flavouring. White Chocolate 49% sugar, 33% cocoa butter, 18% whole dried milk and whey powder, vegetable lecithin and vanilla. Different manufacturers use different variations of the above formulas. Conching The blended ingredients go through a grinding and refining process involving heavy rollers. This grinds down and blends the particles to a smooth paste and improves the texture. This is followed by conching. A conch is a container in which the refined and blended chocolate mass is continually kneaded and further smoothed. The frictional heat produced by this process keeps the chocolate liquid and eliminates acetic odours. The length of time given to the conching process determines the final smoothness and quality of chocolate. After the process is completed the chocolate is stored in heated tanks at about 46°C, ready for the final process. Tempering Cocoa butter exhibits up to 6 different crystal structures. The chocolate must go through a very precise cycle of heating and cooling to encourage the stable crystal formation needed to produce the desirable properties for nice tasting chocolate. One method is to use melted chocolate at about 46°C, cool to between 29-31°C and warm up again to between 30-32°C. It then can be held 'in temper' at this temperature until needed. The chocolate now is ready for use as couverture, for coating chocolates, chocolate biscuits and other coated products. Alternatively, it is poured into moulds and cooled for sale as the finished product such as solid chocolate bars. Every time it is allowed to harden and is re-melted it will have to be re-tempered again. Well tempered chocolate has a shiny gloss, a good snap and a smooth tender melt on the tongue, coating the palate with long lasting flavour.
11
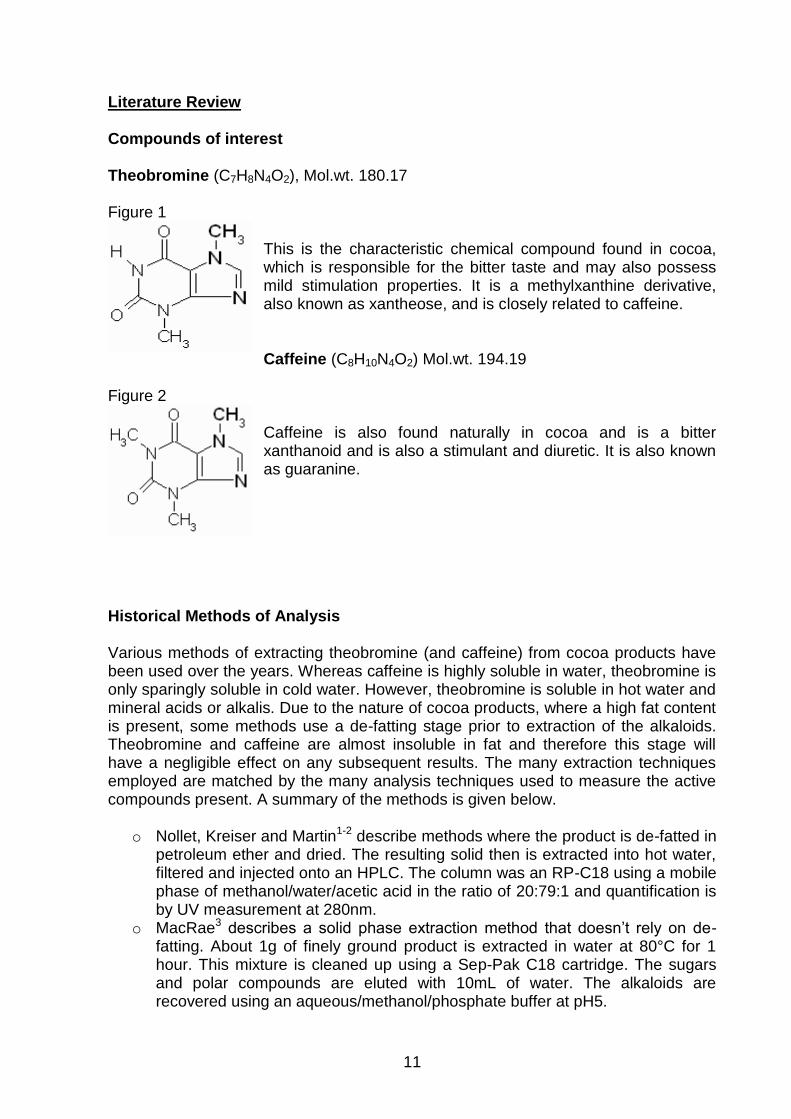
Literature Review Compounds of interest Theobromine (C7H8N4O2), Mol.wt. 180.17 Figure 1
This is the characteristic chemical compound found in cocoa, which is responsible for the bitter taste and may also possess mild stimulation properties. It is a methylxanthine derivative, also known as xantheose, and is closely related to caffeine. Caffeine (C8H10N4O2) Mol.wt. 194.19
Figure 2
Caffeine is also found naturally in cocoa and is a bitter xanthanoid and is also a stimulant and diuretic. It is also known as guaranine.
Historical Methods of Analysis Various methods of extracting theobromine (and caffeine) from cocoa products have been used over the years. Whereas caffeine is highly soluble in water, theobromine is only sparingly soluble in cold water. However, theobromine is soluble in hot water and mineral acids or alkalis. Due to the nature of cocoa products, where a high fat content is present, some methods use a de-fatting stage prior to extraction of the alkaloids. Theobromine and caffeine are almost insoluble in fat and therefore this stage will have a negligible effect on any subsequent results. The many extraction techniques employed are matched by the many analysis techniques used to measure the active compounds present. A summary of the methods is given below.
o Nollet, Kreiser and Martin1-2 describe methods where the product is de-fatted in petroleum ether and dried. The resulting solid then is extracted into hot water, filtered and injected onto an HPLC. The column was an RP-C18 using a mobile phase of methanol/water/acetic acid in the ratio of 20:79:1 and quantification is by UV measurement at 280nm.
o MacRae3 describes a solid phase extraction method that doesn‟t rely on de-fatting. About 1g of finely ground product is extracted in water at 80°C for 1 hour. This mixture is cleaned up using a Sep-Pak C18 cartridge. The sugars and polar compounds are eluted with 10mL of water. The alkaloids are recovered using an aqueous/methanol/phosphate buffer at pH5.

12
o Pearson4 describes a method where 2g of sample is weighed into a 500mL bottle and 270mL of chloroform added followed by 10mL of 10% ammonia solution. The mixture is stoppered and shaken for 5 minutes. Then, 12g of anhydrous sodium sulphate is added and the mixture shaken and allowed to stand overnight. The mixture is filtered and washed with 100mL of chloroform. The solvent is removed and the residue dried. To the residue, 50mL of water is added and boiled. The mixture is cooled and 1-2 drops of 0.1mol sodium hydroxide added to neutralise, using phenol red as indicator and 20mL of 0.1M silver nitrate added. The final mixture is titrated with 0.1M sodium hydroxide. The amount of theobromine present is calculated by using 1mL sodium hydroxide = 18.0mg theobromine.
o The AOAC method5 involves weighing up to 4.5g of sample into a Teflon tube. The fat then is extracted using 2 portions of 30mL petroleum ether and centrifuging at 2000rpm for 10 minutes. The solvent is decanted and the tube dried. The residue is transferred to a 250mL conical flask with approximately 95mL of water. This then is heated at 100°C for 25 minutes and cooled. The mixture is transferred to a centrifuge tube and centrifuged for 5 minutes at 2000 rpm. The supernatant liquid then is ready for HPLC analysis. This method requires weights to be recorded at each step.
o AOAC has also published other methods.7,8 These describe extraction using water and acetic acid, hot water and sulphuric acid and a further method for extraction from cocoa using solvent to de-fat followed by hot water alone.
o Davirieux6 et al uses near-infrared spectrometry as a method for the determination of theobromine and caffeine. This is a rapid non-destructive method used to assess cocoa quality.
o Historically methods published in the Analyst 9,10 describe using chloroform in an alkaline mixture, evaporation and determination of total nitrogen, as well as a conversion of theobromine to caffeine, and analysis of the resulting total alkaloids.
o A further method published in the Analyst describes using a treatment of the chloroform extract with silver nitrate followed by titration11.
o APA journal published a method (Chapman, Fogden and Urry, 1963)12 which involves the measurement of total alkaloids by UV spectroscopy after adsorption onto Fuller‟s earth. The latter separates the active components from the food matrix
o A method by Palson et al13 uses several water extractions in an ultrasonic bath. The volumes of water uses were very large. This method is generally used to produce alkaloid free cocoa.
o A method by Bigalli et al14 recommended a relatively low temperature water extraction (45-55°C) followed by one or more extractions in water at 90-105°C. This method uses large amounts of sample and large volumes of water. As above, this was mainly for the removal of theobromine from cocoa to produce alkaloid free cocoa.
o The OICC15 procedure uses boiling water and clarification of the resulting mixture with lead acetate. The excess acetate is removed and spectrophotometric measurements taken at 245, 272 and 306nm.
o A method carried out by NIST16 involves melting the chocolate and adding β-hydroxyethyltheophylline as an internal standard. The sample is then de-fatted using hexane and dried under nitrogen. The sample is extracted into water using sonication and then filtered. This is then analysed using HPLC on a C18

13
column using isocratic elution with a mix of acetonitrile/water and acetic acid. The absorbances were measured at 274nm.
o The method currently used within many public analyst enforcement laboratories has been published in the VEMS catalogue of methods.17 This uses an homogenised sample which is boiled gently in dilute hydrochloric acid. The mixture is cooled and mixed with Carrez clearing reagents. The mixture then is filtered prior to analysis on the HPLC using an RP 18e column at 40°C. Caffeine and theobromine are measured at 205nm.
Samples of chocolate can be either ground or melted before analysis, results in Table 1 show there is no difference between these preparation procedures. These results corroborate information provided by NIST and are published in AOAC method 970.20.
Previously Reported Levels of Alkaloids in Cocoa and Related Products Historically, there have been many reported values for theobromine and total alkaloid (i.e. caffeine and theobromine) levels in dry fat free cocoa, cocoa powder, cocoa residue, and cocoa nib. The resulting % theobromine or % total alkaloids were found to vary depending on what was actually being tested and whether caffeine was incorporated into the measurement of alkaloids. The first report looking at this topic was published in The Analyst in 1894 by Kunze 32. A digestion of cocoa with acid was carried out, followed by precipitation of the alkaloids and proteins, before separating the alkaloids with barium hydroxide. The alkaloids were extracted with chloroform, and the residue from evaporation analysed for total nitrogen. In 1921 Wadsworth analysed cocoa nib and cocoa powder by first mixing with water then extraction with tetrachlorethane. Alkaloids were precipitated with ether and total nitrogen determined. Results were quoted as 2.2 - 3.9% in cocoa nib and 3.0 - 3.6 in cocoa powder. Taking the mean of this range would equate to factors of 32.8 and 30.3. In 1935 Moir and Hinks reviewed previous methods and developed a new method for cocoa nib. Samples were digested with ethanol and magnesium oxide, clarified with ferrocyanide reagents and filtered. Total alkaloids were determined on the filtered material by measuring total nitrogen. The average found was 3.10% in the dry fat free cocoa. This would equate to a conversion factor of 32.3 In 1950 Holmes extracted cocoa residue (after defatting) by mixing with hot water and magnesium oxide 3 times, treating with lead acetate and filtering each time. The filtrate is extracted with chloroform, and evaporated to dryness. The theobromine content is determined on the residue using silver nitrate method. The mean of ten results was 3.11% theobromine. This would equate to a conversion factor of 32.2. In 1953 Gerritsma and Koers 27 made minor modifications to the extraction method of Holmes and quoted theobromine contents in cocoa powder residues as having a range of 1.50 – 3.12% and a mean of 2.54%, equating to a conversion factor 39.4

14
In 1963 a new method by Chapman and Fogden used hot water extraction, clarification with potassium ferrocyanide / zinc acetate, and filtration and adsorption of the alkaloids onto fullers earth to extract the alkaloids, and analyse by UV spectroscopy. Three samples of commercial cocoa and three samples of retail cocoa were analysed, results ranged from 2.73 – 3.25%, mean 3.0%. This would equate to a conversion factor of 33.3. The variety, geography and type of bean all contribute to differing factors. Pusey18 has reported a mean level of 3.48% theobromine in dry fat free cocoa solids. However, the calculated range was 2.57-5.26%. Figures quoted in Pearson‟s Chemical Analysis of Foods 8th Edition: 19 Min Max Ave Theobromine % Cocoa nib 0.8 1.3 1.0 Cocoa shell 0.2 0.9 0.5 Commercial Cocoa 0.8 1.6 1.2 Caffeine % Cocoa nib 0.1 0.7 0.4 Cocoa shell 0.04 0.3 0.16 Commercial Cocoa 0.04 0.3 0.2 In 1967 Hadorn and Kleinert 28 quoted theobromine contents in various blends as having a range of 2.95 – 3.22% mean 3.09%, giving a conversion factor of 32.4. In 1997 Matissek 29 proposed that on fat free dry nibs the theobromine content was 2.85 – 3.63 and caffeine as 0.05 – 0.60%. Analysis of theobromine by HPLC. Using the theobromine content this would equate to a conversion factor of 30.9. Tables published by the German Confectionery Industry 30 were based on a breakdown of geographical contents based on dry, defatted, fermented nib, and is given below. Theobromine% Caffeine% Ivory Coast 2.64-3.14 0.20-0.35 Ghana 2.65-3.21 0.21-0.29 Nigeria 2.65-3.44 0.10-0.28 Indonesia 1.83-3.12 0.21-0.83 Malaysia 2.32 0.29 Papua New Guinea 1.93-2.47 0.38-0.56 Cameroon 3.48 0.15 Ecuador 2.04-3.40 0.22-0.78 Venezuela 2.43-2.87 0.63-0.80 The range of theobromine values were found to be very variable for the nib samples tested, perhaps suggesting that geographical origin is an important factor in determining the alkaloid levels in cocoa. The ICCO 20 quotes chocolate liquor as having 1.22% theobromine and 1.89 – 2.69% in cocoa with cocoa butter containing 0.008% theobromine. Caffeine also is present

15
and the level is dependent on the degree of fermentation and the type of cocoa beans. The caffeine content was found to vary between 0.1-0.5%.
Personal correspondence supplied by Alan Turner, expert consultant to the chocolate industry, suggested that a conversion factor of 38 should be used when analysing theobromine alone. Project approach In this project, the samples tested were cocoa liquor (mass), prepared from beans obtained from different parts of the world. The current methodology was an in-house modification of the method by Chapman and Fogden (1963), with final analysis by HPLC for quantification of theobromine and caffeine separately. To test the difference between the current methodologies versus old methodology, a ring trial was carried out between four laboratories. Two of the laboratories used the classical UV method (Chapman and Fogden), while results from the other laboratories were obtained using HPLC. Some Public analyst laboratories measure total alkaloids and use the factor from Chapman and Fogden (33.3). The factor used in Durham (35.9) was derived from this by correcting for measurement of theobromine alone rather than total alkaloids in the 1980‟s. The original data is no longer available in the laboratory as records were destroyed. The literature review has highlighted several key issues to consider when comparing the historical data and the results reported in this project. Firstly, the samples tested in the past were not described very clearly; cocoa, cocoa residue, cocoa nib or cocoa powders were descriptions commonly used. A preliminary study will be carried out to examine the difference in alkaloid levels between cocoa nib and cocoa liquor to address this issue. Furthermore, the sample size tended to be quite small, and in many cases only 10 or less samples were analysed. This is not a statistically robust number with which to compare our results. The research described here will involve analysis of a large number of cocoa samples, from around the world collected over different growing seasons, to get a representative collection of data of the chocolate sold in the UK, The review also highlighted the limitations of comparing historical data, which used different methods of analysis and factor calculations (e.g. using nitrogen content), to the data produced in this report, which specifically measures theobromine content. One therefore has to bear in mind all these issues when comparing the old and new factors.

16
Methodology
Collaboration on the Project A vital part of this project was to obtain samples of cocoa from different parts of the world and consider whether different varieties of cocoa bean contained different levels of theobromine. It was also important to assess whether samples could be obtained from different growing seasons. Arrangements were made with Barry Callebaut (BC), the major cocoa grinder in Europe to collaborate with the contractor on the project. A visit was organised to the factory in Belgium for 30th April 2008 which was attended by the Project Leader, and Senior Analyst. The Project Officer from the Food Standards Agency (FSA) also attended this meeting. At the meeting it was agreed that BC would contact other cocoa grinders in Europe to request their cooperation in obtaining sufficient samples for the project and request their participation in a ring trial of methods currently used by the different companies and the Project Leaders‟ enforcement lab in the UK. The cocoa grinders ADM and Cargil agreed to provide samples in addition to those from BC and ensured the success of the project. Cocoa Sampling It was agreed with Barry Callebaut that the best samples to test would be the cocoa liquors rather than the nibs, as the latter were considered to produce more variable results. In addition, the industry uses the results from analysis of the liquor for their quality control checks on the product label declarations. Cocoa nib is the remaining part of the cocoa bean, often referred to as the kernel, once the husk has been removed after roasting. Cocoa liquor is prepared by finely grinding cocoa nibs, and typically contains between 50 percent and 60 percent by weight of cocoa fat. To check the difference between the two sample types, a small number of cocoa nibs were requested from BC. The ten cocoa nibs were prepared in-house, and analysed for moisture, fat, caffeine and theobromine content, and the factor calculated. BC made arrangements for 200 samples of cocoa liquor to be sent to the contract laboratory for analysis. There are two cocoa crops each year, one of these is considered the main crop, producing the highest yields and the other the minor crop. It was agreed to analyse cocoa from main and minor crops as follows: a. 152 samples from the main crop b. 48 samples from the minor crop About 200g was considered to be a representative sample of liquor and all samples would be labelled with the origin and an indication of whether it was main or minor crop. It was planned that each of these groups would consist of (pure) geographical origin samples the proportions of which would mimic, as much as possible, the market. These samples would then be grouped together, for the analysis of the data, into four

17
global regions - West Africa, Pacific, Caribbean, and South America. The results were not as straight forward to evaluate because of the blending of beans from main and minor crops during the manufacturing process. All samples were stored at ambient temperature. Chocolate Sampling In order to determine whether there were any effects on theobromine recovery from the final chocolate products five samples of chocolate at five different concentrations would be made up at BC (giving a total of 25 chocolate samples). Samples of both cocoa liquor, used to make up the chocolates, and the finished chocolate samples (min 400g) were to be sent to the contract laboratory for analysis. The five concentrations would range from 15/20% to 85% cocoa solids. In the end, 20 samples chocolate and cocoa liquors were supplied; however 6 of these were not made from cocoa liquor alone, as they had varying amounts of cocoa powder added. The composition of the cocoa powders was not available, nor were there any samples for testing. Therefore 14 samples of chocolate and corresponding cocoa liquors were used for comparisons. The final amounts of cocoa solids in the samples of chocolate varied from 7-70%. Ring Trial The cocoa manufacturer Barry Callebaut (BC) organised and distributed six homogenised cocoa liquor samples to each of the laboratories: BC, Durham, ADM and Cargill. The samples were analysed for fat, caffeine and theobromine, using the laboratories‟ own routine methods for extraction and analysis of the analytes. An added advantage of the laboratories using their own methods was that there would be an extensive range of experience available for the various tests. In order to make sure that laboratories were measuring accurately it was agreed that NIST Standard Reference Material 2384 (baking chocolate) be analysed alongside samples. This standard had certified reference values for theobromine and caffeine. The reference values are shown in Table 1. The results obtained from the four laboratories were compared. This part of the project was carried out first to ensure consistency in the results for the different methods used. After the initial results were obtained an additional laboratory, Institut für Qualitätsförderung (IQ Koln), which specialised in chocolate and cocoa analysis,
requested for samples to analyse in their laboratories. They analysed all samples using both UV (using the official IOCCC method) and HPLC analysis. These results are summarised in Appendix 1 (Tables 1, 1(a) and 1(b)), together with the initial ring trial results from June 2008 and the statistical analysis data. Contractors Method The Project Leader provided BC with a copy of a method used currently for measuring additives and flavourings in foods by HPLC, a copy is shown in Appendix 2. The method was suitable for routine measurement caffeine and theobromine in foods. The proposed approach was to modify the method and create an SOP which was a simplified version of this general method.
18
The routine additives method in use at the Project laboratory, DCC/F/0358, was modified slightly to improve separation of theobromine and caffeine from other additives that are permitted to be present in cocoa and chocolate products. This ensured that the main analytes of interest were separated from permitted sweeteners, preservatives and flavourings. Minor changes were made to the HPLC operating conditions to achieve this. Moisture levels were found to vary between different samples of cocoa liquor; results were corrected for moisture content to determine the true levels of theobromine and caffeine in the dry liquor. Moisture was measured using the standard Karl Fischer technique. The final SOP, as detailed in Appendix 7, was used in the ring trial alongside other methods currently in use by cocoa manufacturers‟ own laboratories to measure levels of theobromine, caffeine and fat present in cocoa liquor samples. Historical Data In addition to the literature review of historical alkaloids data, additional information was identified from two different sources through private correspondence; Reinhard Matissek (LCI, Germany), and Emile Cros (CIRAD, France). Research data from both sources seemed to indicate that the levels of alkaloids in cocoa varied, depending on influencing factors such as geographical origin and genotype of the cocoa, as well as cultivation and manufacturing conditions. It was decided that the data would not be added to the authentic data set obtained in this project, as the information was considered to be too old in the case of the Matissek review. The CIRAD data, presented in figures 4 and 5 (Appendix 3), showed a correlation in the theobromine/caffeine ratios between five different cocoa types (three single genotypes and two hybrid varieties). However, the information could not be incorporated into this project, because the research is still ongoing, and the results did not incorporate % fat calculations, as carried out in this project. The influence of variety on theobromine levels was investigated, and is discussed in the Results and Discussion section in this report. Calculation of conversion factor to determine cocoa solids content A conversion factor of 33.3 has been used by enforcement laboratories in the UK for many years to calculate the amount of dry fat free cocoa present in cocoa and chocolate products. Traditionally the factor was derived from the accepted average level of total alkaloids (theobromine and caffeine) present in cocoa. As outlined in the objectives, the aim is to recommend a new factor, taking into account theobromine and caffeine levels in cocoa today, compared with levels evaluated 50 years ago to give the current factors. The main problem in this project has been identifying what form of cocoa was used to measure this as some publications refer to analysis of cocoa powder, some to cocoa nib and others simply to cocoa. These descriptions have been inadequate for today‟s needs and so the current factor is in need of further definition. The work carried out in this project refers to the measurement of the levels of theobromine and caffeine, in prepared liquor samples obtained by grinding the roasted nibs. This approach was ratified by the collaborators from the commercial research laboratories as the best approach to ensure the authenticity of the results. Results obtained for theobromine and caffeine in liquor samples at the point of production are used to calculate the cocoa solids going into the foods. This in turn determines the declarations made on the labels.

19
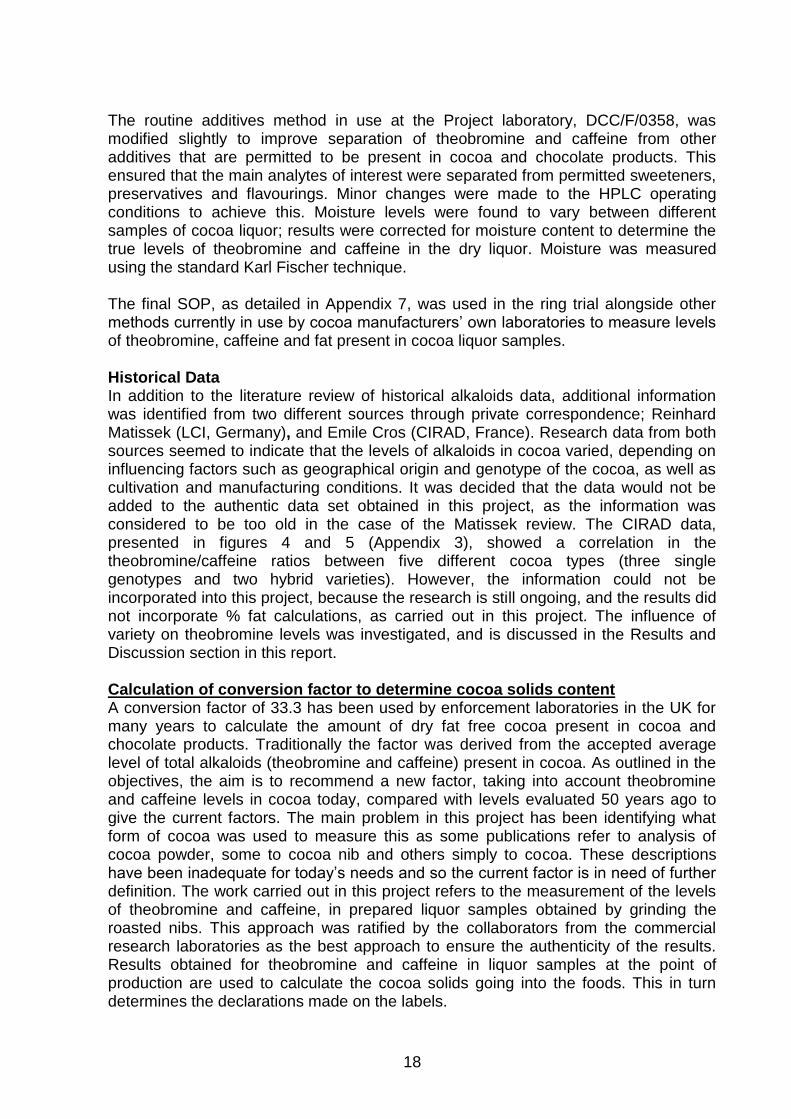
The current factors have been calculated using the formulas below. (1) Factor from theobromine 100 x 104 = 35.9
Mean theobromine (mg/kg)
(2) % dry fat free cocoa = theobromine content (%) x 35.9
(3) Factor from total alkaloids 100 x 104 = 33.3 Mean total alkaloids (mg/kg)
(4) % dry fat free cocoa = total alkaloids content (%) x 33.3 Results and discussion Ring Trial The aim of the ring trial was to assess the robustness of the contract laboratory‟s method against other established methods for extraction and analysis of alkaloids in cocoa. It was agreed from the outset that it would be most appropriate to seek participation from the laboratories in the three major European cocoa production companies, BC, ADM and Cargill, which routinely carry out the analysis of the chocolate as part of the manufacturing process. Each laboratory used their own methods for analysis of six cocoa liquor samples (melted and grated) from different regions of the world (Table 1). One of the manufacturing laboratories (lab 3) used a method for total alkaloids by UV spectroscopy while the other three used HPLC to separate and quantify theobromine and caffeine separately. The outcome of the ring trial is detailed in Table 1, 1(a) and 1(b) of Appendix 1. The results for theobromine and total alkaloids on each of the 6 cocoa liquor samples were in close agreement. In the case of theobromine all of the results were within 12% of the robust mean and within 6% of the robust mean in the case of caffeine. Therefore the methods could be regarded as sufficiently robust to proceed. After testing had been completed, an additional research laboratory, IQ Koln, submitted results from the analysis of the six cocoa liquor samples using both classical UV and HPLC methods. Their results of analysis showed that all six of the samples fell within the range of results reported by the other laboratories. It was observed that the set of results for the theobromine analysis were not as statistically similar as for the results for caffeine and fat levels. This was due to the low level of caffeine in the samples compared to the theobromine content. Overall, it can be concluded that the contract laboratory method for extraction and measurement of alkaloids using HPLC, was fit for purpose, and produced equivalent results when compared to the other four labs. The results for fat analysis also showed good correlation between all laboratories. In order to ensure accuracy of the measurements for theobromine and caffeine, the laboratories taking part in the ring trial all analysed the same standard reference

20
material and the results were compared with the certified values for NIST Standard Reference Material 2384 (baking chocolate). Again there was good agreement with the certified values which were supplied with the reference material. A summary of ring trial results and statistical analysis is shown in Tables 1, 1(a) and 1(b) in Appendix 1. Optimum sample type (Cocoa Nib Analysis) Results of the analysis of the six cocoa nib samples (which were the beans prior to roasting and grinding), as shown in Table 3, indicated a wide variation in alkaloid levels. This confirmed trade colleagues‟ recommendations to assess cocoa liquor samples, which were regarded as a more reliable sample type for determining theobromine levels in cocoa. The nib samples were prepared by blending in a coffee grinder prior to analysis. Cocoa sample analysis The samples of cocoa liquor were analysed in batches, as received from BC over a period of two years. This was to ensure that beans from different growing seasons were included and also to collect a good population of samples from different continents. A total of 191 samples of cocoa liquor were analysed. The results obtained are summarised in Table 2 in Appendix 4. The results of laboratory AQC are summarised in Appendix 5. The AQC duplicate samples were generated and analysed randomly at a rate of 10% of the population or one with every batch where less than 10 were analysed. No data has been excluded and information from the AQC showed that the analysis was accurate and the information being collected was valid. The results from the liquor analyses indicated that there was no clear link between alkaloid levels in the samples and the growing area or season in which they were harvested. There was some evidence of correlation of results when separated into different continents (Appendix 4 Figures 6-9). Moisture content analysis In order to calculate dry fat-free cocoa solids content it was necessary to measure the water content in the samples of liquor. The liquor samples were analysed by the Karl Fischer method, following an initial investigation which found this method to be more accurate in determining water content compared to oven drying. Comparison of methods in seven different cocoa liquor samples showed an average difference of 0.35%, with oven drying producing consistently higher results due to volatiles being removed from the samples as well as water. For this project, water analysis by Karl Fischer was used to ensure an accurate database of reference values. The results are incorporated into the final calculation of the factors in Appendix 4. Statistical analysis The project work was carried out mainly for the benefit of enforcement laboratories though it was necessary to work closely with producers in Europe. Research has showed that over 80% of chocolate made for the EU market is sourced from Africa. However, blending does occur at the grinding stage so a mixture could well be present in the finished products.

21
Enforcement laboratories will generally not know the precise origin of the cocoa used in the manufacture of the chocolate product. As a first action, it is recommended to use the results from this project to calculate an average conversion factor that will be used to calculate dry fat free cocoa. In some cases premium chocolate declares the country of origin in the name of the food, eg Venezuela, Ecuador or Papua New Guinea. In these circumstances enforcement laboratories can take account of different results obtained from those continents and use a conversion factor that‟s more appropriate than an average factor. All of the samples of cocoa liquor provided for analysis were assumed to be genuine and arising from the location indicated by the suppliers. For this reason it was deemed that no results could be excluded in the calculation of statistical data. For the purposes of enforcement a simple statistical analysis approach was taken where an overall average factor was calculated. This was supported by calculation of range and standard deviation. Further calculations were done to assess the confidence intervals of the data. The results showed that whilst there was a fairly wide range between maximum and minimum figures, they were close to a normal distribution, Appendix 4, Figure 10. The chart in Figure 11 shows the relationships between the theobromine and caffeine contents which can vary depending upon the fermentation and production processes. Summary of Cocoa Liquor Results
Mean Theobromine content 24,572 mg/kg (n=191) Standard deviation 2,900 mg/kg Confidence interval (95%) 24,161 – 24,988 mg/kg Confidence interval (99%) 24,031 – 25,118 mg/kg Range 17,700 – 31,329 mg/kg Mean Caffeine content 3,165 mg/kg (n=191) Standard deviation 1,268 mg/kg Confidence interval (95%) 2,980 – 3,341 mg/kg Confidence interval (99%) 2,923 – 3,397 mg/kg Range 1,262 – 8,742 mg/kg Mean Total alkaloids content 27,737 mg/kg (n=191) Standard deviation 3,470 mg/kg Confidence interval (95%) 27,240 – 28,229 mg/kg Confidence interval (99%) 27,085 – 28,384 mg/kg Range 19,803 – 39,168 mg/kg
Conversion factor As discussed previously, the conversion factor will vary depending upon whether the laboratory measures theobromine or total alkaloids. For this reason factors have been calculated for both instances. The factors have been amended from those specified in equations (1)-(4).

22
(5) Factor from theobromine 100 x 104 = 40.7 Mean theobromine (mg/kg) (6) % dry fat free cocoa = theobromine content (%) x 40.7 (7) Factor from total alkaloids 100 x 104 = 36.1 Mean total alkaloids (mg/kg) (8) % dry fat free cocoa = total alkaloids content (%) x 36.1
For the purposes of enforcement the confidence interval will always be taken into consideration when considering whether to report against a declaration of cocoa solids. The range of factors calculated from the confidence intervals are Theobromine (95%) 40.0 – 41.4 Theobromine (99%) 39.8 – 41.6 Total Alkaloids (95%) 35.4 – 36.7 Total Alkaloids (99%) 35.2 – 36.9 The factor currently used for conversion of theobromine to dry fat free cocoa solids is 35.9. This replaced the previous factor of 33.3, which was calculated around 50 years ago from average content of total alkaloids, analysed using UV spectrometry. Therefore it can be concluded that on average the amount of theobromine observed has changed and now appears to be naturally present at lower levels. Analysis of Chocolate Samples The aim of this exercise was to firstly assess whether there were any effects on theobromine recovery from chocolate, and secondly to compare the current factor (35.9) against the new calculated factor (40.7), and assess which gave the closest results for dry fat-free cocoa solids content to the levels declared by BC, who prepared the chocolate samples. Each of the chocolate samples was made from corresponding cocoa liquors (paired results in the table). The total dry fat free cocoa was calculated from the total theobromine content of the chocolate divided by the total theobromine content of the dry cocoa liquor. The total cocoa solids were then calculated by adding the total fat in the chocolate. This will be reliable unless non-cocoa fat is present and corrections must be allowed for. DFFC = total theobromine in sample / theobromine in dry fat free cocoa liquor x 100 The results are shown in Table 5 of Appendix 6 and it was clear that there was good correlation between the theoretical amount of cocoa liquor present and the amount calculated from analysis. There was a small but consistent positive bias on the amount found compared to the declaration of 2-3%. It was clear from the results that the fat present in the chocolate was not only from the cocoa liquor added but was supplemented, presumably by other cocoa fat to obtain a product with the acceptable properties.

23
As outlined in the methodology section, 20 different samples of chocolate products with known levels of cocoa were analysed blind, alongside the corresponding cocoa liquors that were used in their manufacture. The results are shown in Table 6 of Appendix 4. Calculations were carried out for cocoa content from measurements of theobromine levels in the cocoa liquors and the chocolate products and these were compared with declared values and with results that would have been reported using the current and new conversion factors. i.e. dry fat free theobromine in the sample / dry fat free theobromine in liquor x 100, and dry fat free theobromine in sample x 35.9, and dry fat free theobromine in sample x 40.7, and dry fat free theobromine in sample x (40.7 + 5), and dry fat free theobromine in sample x 40.7 – 5). Following analysis it was established that six of the chocolate samples had additional ingredients present, including cocoa powder that would interfere with the interpretation of the results. The results from these samples were excluded from the exercise. This came to light only when sample details were checked. In 18 cases out of 20 the new factor gave better results than the current factor for the cocoa liquor (which should give 100% as it is all cocoa). In comparing results for the chocolate products the new factor gave results closer to the expected amount in 17 cases out of 20. Cocoa contents varied from 7 – 70%. These results are detailed in Table 6. In practice Public Analysts would rely upon the factor to calculate the amount of dry fat free cocoa in a food from theobromine. It has been shown that using the new factor, results were found to be closer to the declared amount added. However, the difficulties in interpretation of results based upon average factors needs to be considered, and the Public Analyst will take these limitations into account in the reporting of samples. Allowances for natural variation and statistical errors are a normal part of the interpretation and adverse reports will generally not be issued if there is sufficient doubt over the results. In many cases further investigations are recommended where manufacturers are requested to provide evidence of compliance testing in support of a defence. The investigating officer will decide in consultation with the Public Analyst whether the defence is sufficient evidence of the facts. Effect of variety on results A growing number of cocoa and chocolate products are now being marketed as high quality, speciality products, being derived from named varieties of cocoa bean. These are generally made from the high quality Criollo bean. Other quality products are made using the variety Trinatario which is a hybrid of the Criollo and Forestero beans. The cocoa liquor samples analysed during the course of this project were not identified as belonging to any particular variety of bean. Consideration was therefore given to the possibility that the levels of theobromine and caffeine were different in the different varieties of bean. Discussions with colleagues working with plantations in St Lucia and Trinidad showed that it would be difficult to obtain pure genotype samples for the analysis of alkaloids. Specialist varieties of cocoa bean are sometimes grown in part of the plantation that also grows other varieties. Cross fertilisation of varieties

24
through pollen transfer is a recognised problem. Trinatario was originally a distinct hybrid of Criollo and Forestero but now, through years of cross pollination it contains varying amounts of genetic information from both plants. There is therefore a likelihood that samples obtained from adjacent trees could contain different amounts of genetic traits that would affect any interpretation of results. It was finally concluded that without genetic information on the beans used to manufacture the cocoa liquor any results obtained using this approach could be heavily flawed. Genetic analysis was outside the scope of this project. Information from Matissek, shown in Appendix 3 demonstrates that there is likely to be varying amounts of alkaloids in the different varieties and that there are overlaps where genetic changes may have occurred. Measurement of total nitrogen The early research which provided the basis for the current factor involved extraction of total alkaloids, after precipitation of interfering substances and analysis of total nitrogen using the Kjeldahl method9,23,32. In order to compare the new factor calculated in this project, and the current factor, it was agreed to carry out analysis for total nitrogen on 24 liquor samples taken at random from the collection. The results of this analysis showed that there was no correlation between total nitrogen and theobromine content due to interference from proteins and other nitrogen containing compounds naturally present. The results are shown in Appendix 9. Due to the time limitation of the project, it was not possible to carry out a more comprehensive examination into this issue. Conclusions The project contains a summary of a literature review of methods for analysing cocoa and chocolate. Samples for testing were obtained from the three main cocoa producers in Europe. Analysis was carried out for theobromine, caffeine, fat and moisture. These were used to calculate a conversion factor for reporting dry fat free cocoa in cocoa and chocolate products for the purposes of food enforcement. Results of analysis from 191 cocoa liquor samples from a variety of sources around the world showed that the amounts of alkaloids present were generally lower than results in previous reports published over the last 100 years. The overall average conversion factor for theobromine content to dry fat free cocoa solids was found to be 40.7, and if total alkaloids are measured the average conversion factor was 36.1. There was some correlation seen in the theobromine levels from cocoa of different geographical origin, by both country and continent. Conversion factors for different countries may therefore be assigned to enable more accurate DFFC content to be calculated. However, this would be more difficult to calculate in some samples due to the unknown origin of the cocoa used, and also may not be relevant in cases of production of bulk chocolate where cocoa beans of different origin is mixed. The use of theobromine and total alkaloids for calculation of dry fat free cocoa in chocolate samples both gave results that were fit for purpose and in general agreement with the declarations given by the manufacturer providing the samples. It is therefore concluded that it makes no difference as to whether calculations are made from theobromine or total alkaloid measurements, as long as the relevant factor is used.

25
The standard operating procedure in Appendix 7 may be used to measure theobromine and caffeine by HPLC, and use the results used to calculate dry fat free cocoa in foods. It has been shown that no additives that are permitted to be present in cocoa and chocolate products will interfere with the chromatography using the method as described. The addition of cocoa fat, and other vegetable fats to liquor in the manufacture of cocoa and chocolate products should be recognised. A reference method is available for measurement of cocoa butter equivalents in cocoa and chocolate products31. The method will allow the analyst to estimate amounts of non-cocoa fats present. These non-cocoa fats must not be included in the calculation of total cocoa solids, and so it is strongly recommended that fat, and cocoa fat are measured alongside alkaloids in the final calculation of DFFC. Public Analysts in the UK and other food enforcement analysts should take note of the findings in this report. The proposed method of testing has been shown to give results for theobromine and total alkaloids that are in close agreement with other routine methods currently in use by cocoa manufacturers. A collaborative trial has not been commissioned and this should be considered as possible future work. Acknowledgements ADM for provision of authentic samples of cocoa liquor and participation in the ring trial Alan Turner, consultant to the chocolate industry for providing historical information Barry Callebaut for provision of authentic samples of cocoa liquor, chocolate and participation in the ring trial Cargil for provision of authentic samples of cocoa liquor and participation in the ring trial CIRAD for advice on interpretation of results particularly in relation to genotypes Cocoa Research Association Ltd for advice on technical details Food Standards Agency for the funding of this project

26
References 1. Food Analysis by HPLC Leo ML Nollet p657. 2. Kreiser and Martin JAOAC 1978 61 1424. 3. HPLC in Food Analysis R. MacRae 2nd Edition p226. 4. The Chemical Analysis of Foods D.Pearson 7th Edition p282-88. 5. Official Methods of Analysis of AOAC International 16th Edition Volume II 31 p16-17. 6. Davirieux, F. Assemat, S. Boulanger, R. Cros, E. (CIRAD-CP) International Conference on Near Infra Red Spectroscopy 12, 2005. 7. AOAC 936.18 Method I. 8. AOAC 936.18 Method II. 9. Moir, D. & Hinks, E Analyst 1935 60, 439. 10. Harral, J.C. Analyst 1940 65, 408. 11. Gerritsma, K.W. Koers, J. 1953 Analyst 78, 201. 12. Chapman, W.B. Fogden, S. Urry, S. JAPA 1963 1, 59. 13. Palson et al. (Nestec) United States Patent Number 5139799, Aug 1992. 14. Bigalli et al. (Hershey) United States Patent Number 4755391, July 1988. 15. International Office of Cocoa and Chocolate. 16. National Institute of Standards & Technology, Standard Reference Material® 2384, Baking Chocolate. 17. VEMS 0358. 18. Pusey, M.S. The Analyst, 1977 102 (1219), 697. 19. Egan, H. Kirk, R.S. Sawyer, R. Pearson‟s Chemical Analysis of Foods 8th Edition. 20. The International Cocoa Organization. www.internationalcocoaorganisation.com/questions 21. Wikipedia – The free internet search encyclopaedia. http://en.wikipedia.org/wiki/theobromine 22. The Journal of Food Science 49 (1) 302-303. 23. R.V.Wadsworth The Analyst 1921, 46, 32. 24. K.E.Holmes The Analyst 1950 75, 457. 25. M.J.Ellis LRSC Dissertation, RSC, 1981. 26. D.D.Moir & E.Hinks The Analyst 1935 60, 439. 27. K.W.Gerritsma & J.Koers The Analyst 1953 78, 201. 28. H.Hadorn & J.Kleinert Rev.Int.Choc. 1967 22, 310. 29. R.Matissek Z Lebensm Unters Forsch A (1997) 205: 175-184 30. Association of the German Confectionery Industry BDSI Cocoa Atlas 2002 31. BS ISO 11053 2009: Vegetable fats and oils. Determination of cocoa butter equivalents in milk chocolate 32. Kunze, W.E. The Analyst 1894 11, 194

27
APPENDIX 1 SUMMARY OF RING TRIAL DATA Table 1 - Ring Trial Data
SUMMARY OF RESULTS FROM THE RING TRIAL (JUNE 2008)
ORIGIN SAMPLE LABREF THEOBROMINE CAFFEINE TOTAL ALKALOID FAT
Durham Lab 2
Lab 3
Lab 4 Durham
Lab 2
Lab 3
Lab 4 Durham
Lab 2
Lab 3
Lab 4 Durham Lab 2 Lab 3 Lab 4
VENEZUELA 20090187 A 1.18 1.17 - 1.22 0.26 0.27 - 0.24 1.45 1.44 1.54 1.46 50.5 50.82 50.47 50.64
B 1.18 1.26 - 1.26 0.26 0.29 - 0.25 1.44 1.55 1.57 1.51 50.3 51.15 50.45 50.94
PAPUA NEW GUINEA
20090188 A 1.04 1.07 - 1.10 0.15 0.16 - 0.14 1.19 1.23 1.30 1.24 51.3 52.83 52.05 52.67
B 1.02 1.11 - 1.05 0.15 0.16 - 0.13 1.16 1.27 1.31 1.18 51.0 52.84 52.03 52.32
ECUADOR 20090189 A 1.15 1.18 - 1.20 0.19 0.21 - 0.19 1.35 1.39 1.44 1.39 51.5 52.38 51.77 52.09
B 1.15 1.27 - 1.21 0.19 0.22 - 0.18 1.34 1.49 1.43 1.39 51.4 52.35 51.72 51.91
SAN TOME 20090190 A 1.19 1.23 - 1.25 0.10 0.11 - 0.10 1.30 1.34 1.40 1.35 50.0 50.12 50.73 47.94
B 1.17 1.39 - 1.25 0.10 0.12 - 0.10 1.27 1.51 1.41 1.35 50.0 50.53 50.76 47.61
MADAGASCAR 20090191 A 1.12 1.15 - 1.18 0.16 0.18 - 0.15 1.28 1.33 1.41 1.33 51.6 52.33 51.68 51.67
B 1.11 1.23 - 1.15 0.16 0.18 - 0.15 1.27 1.41 1.41 1.30 51.6 52.13 51.43 51.72
TANZANIA 20090192 A 1.20 1.29 - 1.20 0.16 0.17 - 0.13 1.36 1.46 1.48 1.33 56.0 55.94 55.06 55.87
B 1.16 1.26 - 1.22 0.15 0.17 - 0.13 1.32 1.43 1.49 1.35 55.9 56.36 55.56 55.74
NIST 2384 MELTED A 1.11 0.11 1.22 50.4
GRATED B 1.10 0.11 1.21 50.6
Reference values for NIST CRM 2384 NOTE: Lab 3 measured total alkaloids by spectrophotometric method
Theobromine % 1.16 ± 0.11
Caffeine % 0.106 ± 0.05
Fat (Extractable) % 51.4 ± 1.10

28
Table 1(a) Statistical analysis of ring trial data
ORIGIN THEOBROMINE CAFFEINE TOTAL ALKALOID FAT
Max Min Ave Max Min Ave Max Min Ave Max Min Ave
VENEZUELA 1.26 1.17 1.21 0.29 0.24 0.26 1.57 1.44 1.49 51.15 50.30 50.69
PAPUA NEW GUINEA
1.11 1.02 1.06 0.16 0.13 0.15 1.31 1.16 1.23 52.84 51.00 52.20
ECUADOR 1.27 1.15 1.19 0.22 0.18 0.20 1.49 1.34 1.40 52.38 51.40 51.91
SAN TOME 1.39 1.17 1.25 0.12 0.10 0.11 1.51 1.27 1.36 50.76 47.61 49.32
MADAGASCAR 1.23 1.11 1.16 0.18 0.15 0.16 1.41 1.27 1.34 52.33 51.43 51.76
TANZANIA 1.29 1.16 1.22 0.17 0.13 0.15 1.49 1.32 1.39 56.36 55.06 55.80
Table 1(b) Further Ring Trial Data Results from IQ Koln
ORIGIN THEOBROMINE CAFFEINE Caffeine + Theobromine TOTAL ALKALOID FAT
VENEZUELA 1.201 0.259 1.460 1.527 48.73
1.197 0.261 1.458 1.536 48.98
PAPUA NEW GUINEA 1.034 0.146 1.180 1.241 52.30
1.036 0.147 1.183 1.282 52.49
ECUADOR 1.172 0.191 1.363 1.442 51.47
1.179 0.191 1.370 1.443 51.73
SAN TOME 1.183 0.100 1.283 1.419 50.19
1.188 0.106 1.294 1.425 49.97
MADAGASCAR 1.121 0.158 1.279 1.381 51.36
1.129 0.154 1.283 1.385 51.48
TANZANIA 1.212 0.144 1.356 1.442 55.66
1.213 0.147 1.360 1.443 55.35

29
APPENDIX 2 DCC/F/0358 THE DETERMINATION OF ADDITIVES AND FLAVOURINGS IN FOODS BY HIGH PERFORMANCE LIQUID CHROMATOGRAPHY (GENERAL METHOD) 1. SCOPE AND FIELD OF APPLICATION
This method describes a procedure for the determination of artificial sweeteners, preservatives and flavourings in soft drinks, cakes and confectionery, as well as caffeine and theobromine in chocolate and chocolate products.
2. DEFINITION For the purpose of this method, the additives and flavourings content of
foods and drinks are those extracted and determined under the conditions specified.
3. PRINCIPLE The analytes are extracted by the appropriate method: (a) soft drinks are analysed directly after appropriate dilutions; (b) foods are acidified and extracted with an aqueous methanol solution; (c) chocolate products are extracted with dilute acid. After filtration the additive and/or flavouring content of the solution is
determined by HPLC. 4. HEALTH & SAFETY 4.1 EYE PROTECTION SHOULD NORMALLY BE WORN AT ALL
TIMES. 4.2 METHANOL IS HIGHLY FLAMMABLE AND TOXIC BY INHALATION
OR IF SWALLOWED. KEEP CONTAINER TIGHTLY CLOSED. AVOID CONTACT WITH SKIN. KEEP AWAY FROM SOURCES OF IGNITION. USE ONLY IN A DESIGNATED FLAME FREE AREA.
4.3 ACETONITRILE IS HIGHLY FLAMMABLE AND TOXIC BY
INHALATION, IN CONTACT WITH SKIN AND IF SWALLOWED. KEEP AWAY FROM SOURCES OF IGNITION. TAKE OFF IMMEDIATELY ANY CONTAMINATED CLOTHING. IF YOU FEEL UNWELL, SEEK MEDICAL ADVICE. USE ONLY IN A DESIGNATED FLAME FREE AREA.

30
4.4 CAFFEINE IS TOXIC IF SWALLOWED. AVOID CONTACT WITH SKIN AND EYES. IF YOU FEEL UNWELL, SEEK MEDICAL ADVICE.
4.5 QUININE SULPHATE IS TOXIC IF SWALLOWED. AVOID
CONTACT WITH SKIN AND EYES. IF YOU FEEL UNWELL, SEEK MEDICAL ADVICE.
5. PRE-TRAINING REQUIREMENTS 5.1 Use of analytical balance. 5.2 Use of volumetric glassware. 5.3 Use of pH meter. 5.4 Use of filtration apparatus. 5.5 Use of HPLC system. 6. REAGENTS 6.1 Analytical Reagent (AR) grade reagents are suitable unless otherwise
stated. Water should be deionised, distilled or of similar quality. 6.2 Methanol, HPLC grade. 6.3 Acetonitrile, HPLC grade. Degas and filter through a 0.45 µm organic
filter. 6.4 Sodium dihydrogen orthophosphate. 6.5 Caffeine. 6.6 Acesulfame K. 6.7 Aspartame. 6.8 Benzoic acid. 6.9 Sorbic acid. 6.10 Saccharin. 6.11 Theobromine. 6.12 Quinine sulphate. 6.13 Methylparaben (Methyl 4-Hydroxybenzoate).

31
6.14 Ethylparaben (Ethyl 4-Hydroxybenzoate). 6.15 Propylparaben (Propyl 4-Hydroxybenzoate) 6.16 Hydrochloric acid (S.G. 1.18). 6.17 Sodium hydroxide. 6.18 0.1mol/L sodium hydroxide. Weigh 4.0g of sodium hydroxide (6.17)
and dissolve in water, allow to cool, and dilute to 1 litre. 6.19 Phosphate buffer. Accurately weigh 3.12g of sodium dihydrogen
orthophosphate (6.4) and make up to 1 litre with water. Adjust to Ph 5.0 with 0.1mol/L sodium hydroxide (6.18). Filter through a 0.45 µm filter (7.3)
6.20 50Ml/100Ml methanol. Dilute equal volumes of methanol (6.2) and
water as required. 6.21 3mol/L Hydrochloric acid. Add 267Ml of hydrochloric acid (6.16) to
water and dilute to 1 litre. 6.22 0.5mol/L Hydrochloric acid. Add 44.5Ml of hydrochloric acid (6.16) to
water and dilute to 1 litre. 6.23 Stock standard additive and flavouring solutions (Shelf life 3 months,
except sorbic acid and aspartame – prepare fresh when needed). 6.23.1 Caffeine 1000mg/L. Weigh 0.5g, accurate to 0.001g, of
caffeine (6.5). Transfer quantitatively into a 500Ml volumetric flask with water. Dissolve in water, dilute to volume with water and mix.
6.23.2 Acesulfame K 1000mg/L. Weigh 0.5g, accurate to 0.001g, of
acesulfame K (6.6). Transfer quantitatively into a 500Ml volumetric flask with water. Dissolve in water, dilute to volume with water and mix.
6.23.3 Aspartame 5000mg/L. Weigh 0.5g, accurate to 0.001g, of
aspartame (6.7). Transfer quantitatively into a 100Ml volumetric flask with water. Dissolve in water, dilute to volume with water and mix.
6.23.4 Saccharin 1000mg/L. Weigh 0.5g, accurate to 0.001g, of
saccharin (6.10). Transfer quantitatively into a 500Ml volumetric flask with water. Dissolve in water, dilute to volume with water and mix.
6.23.5 Quinine sulphate 1000mg/L. Weigh 0.5g, accurate to 0.001g,
of quinine sulphate (6.12) into a 100Ml beaker, dissolve in

32
water with heating, cool and transfer quantitatively into a 500Ml volumetric flask with water. Dilute to volume with water and mix.
6.23.6 Theobromine 500mg/L. Weigh 0.25g, accurate to 0.001g, of
theobromine (6.11) into a 400Ml beaker, dissolve in boiling water, cool and transfer quantitatively into a 500Ml volumetric flask with water. Dilute to volume with water and mix.
6.23.7 Benzoic acid 1000mg/L. Weigh 0.5g, accurate to 0.001g, of benzoic acid (6.8) into a 100Ml beaker, dissolve in about 50Ml of methanol (6.2) transfer quantitatively to a 500Ml volumetric flask with methanol and dilute to volume with water and mix.
6.23.8 Sorbic acid 1000mg/L. Weigh 0.5g, accurate to 0.001g, of
sorbic acid (6.9) into a 100Ml beaker, dissolve in about 50Ml of methanol (6.2), transfer quantitatively to a 500Ml volumetric flask with methanol and dilute to volume with water and mix.
6.23.9 Mixed Paraben standard 1000mg/L. Weigh 0.5g, accurate to
0.001g, of each Parabens (6.13, 6.14, 6.15,) into separate 100Ml beakers, dissolve each in about 50Ml of methanol (6.2), transfer quantitatively to a 500Ml volumetric flask with methanol and dilute to volume with water and mix.
6.24 Working standard solutions Using pipettes measure 1.0, 2.5, 5.0 and 10.0Ml (2, 5, 10 and 20Ml of
theobromine) of each stock standard required, into separate 100mL volumetric flasks, dilute to volume with water and mix. This gives working standard solutions of concentrations 10, 25, 50 and 100mg/L of each additive except aspartame (50, 125, 250 and 500mg/L). Working standard solutions should be prepared fresh on the day of use.
6.25 Stock standard control solutions STANDARD MATERIAL USED TO PREPARE STANDARD
CONTROL SOLUTIONS MUST BE FROM A DIFFERENT COMMERCIAL SOURCE TO THOSE USED TO PREPARE STANDARD CALIBRATION SOLUTIONS.
6.25.1 Caffeine 10,000mg/L. Weigh 0.5g accurate to 0.001g of
caffeine. Transfer quantitatively to a 50mL volumetric flask with 20mL of methanol and dissolve. Dilute to volume with water and mix.
6.25.2 Acesulfame K 10,000mg/L. Weigh 0.5g accurate to 0.001g of
acesulfame K. Transfer quantitatively to a 50mL volumetric

33
flask with 20mL of methanol and dissolve. Dilute to volume with water and mix.
6.25.3 Benzoic Acid 10,000mg/L. Weigh 0.5g accurate to 0.001g of
benzoic acid. Transfer quantitatively to a 50mL volumetric flask with 20mL of methanol and dissolve. Dilute to volume with water and mix.
The shelf life of these solutions is 3 months when stored at 5°C.
6.26 Working standard control solution Using a pipette, measure 2.5Ml of each stock standard control
solution (6.25.1, 6.25.2 and 6.25.3) into the same 250Ml volumetric flask, dilute to volume with water and mix.
This gives a mixed, working standard control solution containing
100mg/L of each additive. The working standard control solution should be prepared fresh on
the day of use. 6.27 Zinc acetate dihydrate. 6.28 Glacial acetic acid. 6.29 Potassium ferrocyanide trihydrate. 6.30 Clearing reagents 1 and 2 1. Dissolve 21.9g, accurate to 0.1g, zinc acetate dihydrate (6.27)
in water containing 3g of glacial acetic acid (6.28) and make up to 100mL with water.
2. Dissolve 10.6g, accurate to 0.1g, potassium ferrocyanide
trihydrate (6.29) in water and make up to 100mL with water. 7. APPARATUS 7.1 Normal laboratory glassware and apparatus. 7.2 Analytical balance of appropriate accuracy as specified. 7.3 0.45µm disposable syringe filters or 0.45µm sample filter kit (millipore
or equivalent). 7.4 Solvent filter system with 0.45µm membrane filters. 7.5 Ultra sonic bath.

34
7.6 High Performance Liquid Chromatography (HPLC) system ideally with Diode Array Detector and integrating device which allows the measurement of peak heights or areas.
7.7 Glass microfibre filters, at least 1.6 µm GFA or equivalent. 7.8 HPLC Chromatographic column such as Merck Lichrocart Purospher
RP-18e, 5µm, 250 x 4mm, fitted with a Purospher RP-18e, 5µm 4 x 4mm guard column, equivalent columns may be used, provided they give satisfactory resolutions.
The following HPLC conditions have been found to be suitable. The conditions can be modified if necessary to achieve suitable resolution of the additives and flavourings of interest.
Mobile phase A (6.3), Mobile phase B (6.19)
Gradient time (min)
Mobile Phase A (%)
Mobile Phase B (%)
0 8.0 92.0 5.00 10.0 90.0 22.50 19.3 80.7 30.00 21.5 78.5 35.00 45.0 55.0 40.00 45.0 55.0 40.01 8.0 92.0 45.00 8.0 92.0
Flow rate: 1.0Ml/min Injection volume: 5µL Column Temperature: 40°C Detector Wavelengths: 205nm for theobromine, saccharin, benzoic
acid, caffeine and aspartame 231nm for acesulfame K and quinine sulphate 256nm for sorbic acid and parabens It is suggested that to help maintain column efficiency, it is flushed
with a mixture of water, acetonitrile (about 50:50) for about 30 minutes prior to instrument shutdown. Column performance will be maintained through use of a guard column.
8. PROCEDURE Preparation of the test sample 8.1 Soft drinks. 8.1.1 Degas, if necessary, by sonication in an ultrasonic bath (7.5)
for 5 minutes or by filtration. Dilute if necessary, with water so

35
that the sample test solution is within the range of working standards (6.24).
8.2 Foods – blend or homogenise to make a homogenous sample. 8.2.1 Weigh 9 – 10g, accurate to 0.001g, of sample into a 100Ml
beaker and mix with 5Ml of 3mol/L hydrochloric acid (6.21). (If problems are encountered filtering the sample (8.2.4) take 5g).
8.2.2 Add about 50Ml of 50Ml/100Ml methanol (6.20), mix and
transfer quantitatively to a 100Ml volumetric flask. Dilute to volume with 50Ml/100Ml methanol.
8.2.3 Shake for 1 minute. 8.2.4 Filter the solution through a filter paper (7.7) then through a
0.45µm syringe filter (7.3). 8.3 Chocolate and chocolate products (for theobromine analysis) (grate or
blend if necessary). 8.3.1 Weigh about 1g, accurate to 0.001g, of dark chocolate, 2 – 3g
of milk chocolate or 3g cake into a 100Ml beaker. 8.3.2 Add 25Ml of water and 2Ml of 0.5mol/L hydrochloric acid (6.22)
and mix. 8.3.3 Bring to the boil on a hotplate and then transfer the beaker to a
water bath for 15 minutes. 8.3.4 Transfer the solution to a 50Ml volumetric flask and allow to
cool. 8.3.5 Add 1Ml of each clearing reagent (6.28), make to volume with
water and mix. 8.3.6 Allow the solution to stand for about 30 minutes and then filter
through a filter paper (7.7) and a syringe filter (7.3). 8.4 Chromatography
Set up the HPLC system (7.6) according to the manufacturers
instructions. The instrument must be fitted with a suitable column (7.8). The operating conditions must be adjusted so as to achieve sufficient separation of the additives of interest to enable identification. The specific operating conditions are detailed in Appendix 1.
Typical chromatographic separations are shown in Figure 3 at the end
of this method.

36
8.5 Inject a suitable volume e.g. 5µL of the test solution and run the chromatographic separation.
8.6 Determine the peak areas (by electronic integration) at the
appropriate wavelength (see 7.8.1). If a diode array detector is not available then separate runs at each wavelength may be required.
8.7 Preparation of calibration curve. 8.7.1 Successively analyse each working standard solution (6.24)
according to 8.5 to 8.6. 8.7.2 Plot a calibration curve of analyte concentration against peak
area for each analyte of interest. 8.7.3 When fresh stock standards are prepared a new calibration
curve is analysed. 8.8 Calibration check. 8.8.1 Provided that the calibration curve (8.7.2) is linear and the
HPLC conditions remain ostensibly unaltered, a single working standard solution of each analyte may be used to check the calibration curve.
8.8.2 Analyse working standard 50mg/L according to 8.5 to 8.6.
Carry out a duplicate injection of the working standard solution. 8.8.3 The calibration check standard is deemed satisfactory if the
mean concentration is within ±5% of the expected value (i.e. 50mg/L) when extrapolated from the stored calibration graph.
8.8.4 If the calibration check standard meets the requirements (8.8.3)
then the stored calibration graph may be used to calculate the analyte concentration. Otherwise a fresh stock standard must be prepared.
9. CALCULATION 9.1 If a calibration curve is used, determine the concentration © of each
analyte in the test solution directly from the calibration graph.
9.2 If a diode array detector is available, the identity of sample peaks can be confirmed if necessary.
9.3 The concentration of each analyte in the sample, expressed in mg/L
or mg/kg, may be calculated according to the following formula: Analyte in the sample (mg/L or mg/kg) = C x V m
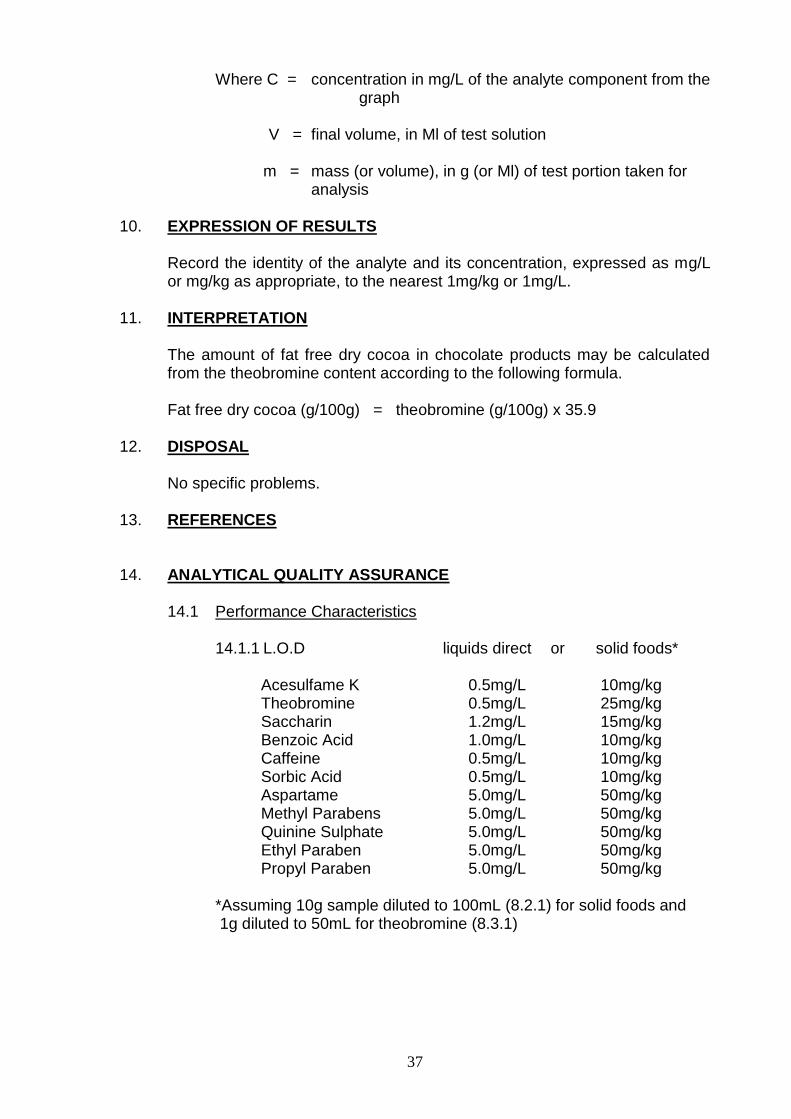
37
Where C = concentration in mg/L of the analyte component from the graph V = final volume, in Ml of test solution m = mass (or volume), in g (or Ml) of test portion taken for analysis 10. EXPRESSION OF RESULTS Record the identity of the analyte and its concentration, expressed as mg/L
or mg/kg as appropriate, to the nearest 1mg/kg or 1mg/L. 11. INTERPRETATION The amount of fat free dry cocoa in chocolate products may be calculated
from the theobromine content according to the following formula. Fat free dry cocoa (g/100g) = theobromine (g/100g) x 35.9 12. DISPOSAL No specific problems. 13. REFERENCES 14. ANALYTICAL QUALITY ASSURANCE 14.1 Performance Characteristics 14.1.1 L.O.D liquids direct or solid foods* Acesulfame K 0.5mg/L 10mg/kg Theobromine 0.5mg/L 25mg/kg Saccharin 1.2mg/L 15mg/kg Benzoic Acid 1.0mg/L 10mg/kg Caffeine 0.5mg/L 10mg/kg Sorbic Acid 0.5mg/L 10mg/kg Aspartame 5.0mg/L 50mg/kg Methyl Parabens 5.0mg/L 50mg/kg Quinine Sulphate 5.0mg/L 50mg/kg Ethyl Paraben 5.0mg/L 50mg/kg Propyl Paraben 5.0mg/L 50mg/kg *Assuming 10g sample diluted to 100mL (8.2.1) for solid foods and 1g diluted to 50mL for theobromine (8.3.1)

38
14.1.2 Bias
Recovery Recovery Mean Standard Deviation Foods Drinks Foods Drinks Acesulfame K 101.5% 105.5% 3.6% 3.7% Theobromine 99.2% - 2.8% - Saccharin 99.8% 100.7% 4.0% 1.6% Benzoic Acid - 98.9% - 1.7% Caffeine - 104.3% - 3.3% Sorbic Acid 95.8% 92.1% 6.4% 8.4% Aspartame 94.0% 99.7% 4.4% 2.9% Methyl Paraben 94.6% - 5.7% - Quinine Sulphate - 101.9% - 9.5% Ethyl Paraben 92.7% - 8.9% - Propyl Paraben 91.0% - 10.6% - (Soft drinks spiked at a level of 50mg/L except aspartame
250mg/L). Foods spiked at a level 25mg/L except Aspartame 100mg/L. Theobromine spiked at a level of 50mg/L in chocolate)
14.1.3 Precision Absolute difference Standard Deviation Foods Drinks (mg/kg) (mg/L) Acesulfame K 4.8 1.4 (10 samples in the (15 samples in the range 89 to 100) range 25 to 100)
Theobromine 31.6 - (10 samples in the range 823 to 3117) Saccharin 4.4 1.1 (10 samples in the (15 samples in the range 76 to 530) range 43 to 183)
Benzoic Acid - 2.4 (18 samples in the range 78 to 138) Caffeine - 1.2 (14 samples in the range 12 to 91)
Sorbic Acid 7.0 0.8 (10 samples in the (7 samples in the range 132 to 1189) range 100 to 189)

39
Aspartame 8.6 1.9 (12 samples in the (10 samples in the range 60 to 400) range 25 to 1362)
Methyl Paraben 6.1 (10 samples in the range 368 to 896)
Quinine Sulphate - 1.7 (14 samples in the range 38.0 to 82)
Ethyl Paraben 4.6 (10 samples in the range 369 to 876)
Propyl Paraben 6.0 (10 samples in the range 340 to 834)
14.2 Internal Quality Control 14.2.1 Instrument Calibration : Refer to instrument manual. 14.2.2 Blank determination : Take an appropriate blank
through the procedure. 14.2.3 Standard Control : Each batch of samples
should include analysis of an in-house standard control material.
14.2.4 Repeatability Check : At least every tenth sample
should be analysed in duplicate and the difference between the results should conform to the performance characteristics.

40
Figure 3 Chromatogram of Food Additives
min5 10 15 20 25 30 35 40
mAU
0
100
200
300
400
DAD1 A, Sig=205,12 Ref=450,100 (L:\2\DATA\0358\BW081103.D)
T
heo
bro
min
e
S
ac
ch
arin
T
heo
ph
yllin
e
B
en
zo
ic
A
cid
C
affe
in
e
A
sp
arta
me
M
eth
yl P
ara
be
n
E
th
yl P
ara
rb
en
P
ro
pyl P
arab
en
DAD1 B, Sig=231,12 Ref=450,100 (L:\2\DATA\0358\BW081103.D) A
ce
su
lfam
e K
V
an
illin
E
th
yl V
an
illin
Q
uin
in
e S
ulp
ha
te
DAD1 C, Sig=256,20 Ref=450,100 (L:\2\DATA\0358\BW081103.D)
S
orb
ic
A
cid

41
INFORMATION FROM MATTISEK’S RESEARCH FOR CIRAD ON PURINE CONTENTS OF COCOA APPENDIX 3 Figure 4 Genotypes of Pure and Hybrid Origin
0,0
0,1
0,2
0,3
0,4
0,5
0,6
0,7
0,8
0,0 2,0 4,0 6,0 8,0 10,0 12,0 14,0 16,0 18,0
Theobromine / Caffeine ratio
Ca
ffe
ine
(%
)
Criollo V Forastero CI Forastero T Trinitario T Trinitario V

42
Figure 5 Genotypes of Pure Origin
0,0
0,1
0,2
0,3
0,4
0,5
0,6
0,7
0,8
0,9
0,0 2,0 4,0 6,0 8,0 10,0 12,0 14,0
Theobromine / caffeine ratio
Ca
ffe
ine
(%
)
Criollo
Trinitario
Forastero

43 of 74
APPENDIX 4 Table 2 Cocoa Liquor Results Summary of the results of analysis on 191 samples of cocoa liquor obtained from a range of countries worldwide.
Country Moisture
KF Fat Caffeine Theobromine
Total Alkaloids
Caffeine on Dry Fat Free
Matter
Theobromine on Dry Fat Free Matter
Total Alkaloids on Dry Fat Free Matter
Factor (Theobromine)
Factor (Total Alkaloids)
% % mg/kg mg/kg mg/kg mg/kg mg/kg mg/kg
BOLIVIA 2.20 54.80 1,756 10,377 12,133 4,084 24,133 28,216 41.44 35.44
BOLIVIA 1.80 53.80 2,002 11,246 13,248 4,509 25,329 29,838 39.48 33.51
BOLIVIA 2.10 53.90 1,514 11,469 12,983 3,441 26,066 29,507 38.36 33.89
BRAZIL 3.30 42.80 2,279 11,793 14,072 4,228 21,879 26,108 45.71 38.30
BRAZIL 3.40 49.70 4,100 14,270 18,370 8,742 30,426 39,168 32.87 25.53
CAMEROON 1.60 51.90 1,094 10,584 11,678 2,353 22,761 25,114 43.93 39.82
COLUMBIA 3.00 55.40 1,918 10,359 12,277 4,611 24,901 29,512 40.16 33.88
COLUMBIA 3.10 58.60 2,300 11,094 13,394 6,005 28,966 34,971 34.52 28.59
CONGO 1.10 53.80 776 11,085 11,861 1,721 24,579 26,299 40.69 38.02
COSTA RICA 1.10 58.50 1,853 9,416 11,269 4,587 23,307 27,894 42.91 35.85
DOMINICAN REPUBLIC 1.40 54.80 1,198 11,619 12,817 2,735 26,527 29,263 37.70 34.17
DOMINICAN REPUBLIC 1.20 52.50 1,674 12,820 14,494 3,616 27,689 31,305 36.12 31.94
ECUADOR 1.20 52.50 1,687 10,581 12,268 3,644 22,853 26,497 43.76 37.74
ECUADOR 1.20 50.70 1,531 11,041 12,572 3,183 22,954 26,137 43.56 38.26
ECUADOR 1.30 51.30 1,681 11,170 12,851 3,546 23,565 27,112 42.44 36.88
ECUADOR 0.90 55.20 2,177 10,583 12,760 4,959 24,107 29,066 41.48 34.40
ECUADOR 1.20 54.40 2,020 10,786 12,806 4,550 24,293 28,842 41.16 34.67
ECUADOR 1.00 51.80 1,749 11,491 13,240 3,706 24,345 28,051 41.08 35.65
ECUADOR 1.00 52.40 1,207 11,382 12,589 2,590 24,425 27,015 40.94 37.02
ECUADOR 1.60 51.80 1,962 11,459 13,421 4,210 24,590 28,800 40.67 34.72
ECUADOR 2.10 51.00 2,067 11,539 13,606 4,407 24,603 29,011 40.64 34.47
ECUADOR 1.30 50.80 1,893 11,793 13,686 3,952 24,620 28,572 40.62 35.00
ECUADOR 1.10 52.40 1,812 11,452 13,264 3,897 24,628 28,525 40.60 35.06
ECUADOR 0.60 54.70 2,021 11,012 13,033 4,521 24,635 29,157 40.59 34.30
ECUADOR 0.90 57.40 3,636 10,298 13,934 8,719 24,695 33,415 40.49 29.93
ECUADOR 1.40 51.30 1,906 11,699 13,605 4,030 24,734 28,763 40.43 34.77
ECUADOR 3.50 50.30 2,086 11,557 13,643 4,515 25,015 29,530 39.98 33.86
ECUADOR 1.80 50.90 1,864 11,861 13,725 3,941 25,076 29,017 39.88 34.46

44 of 74
ECUADOR 2.90 51.50 1,950 11,548 13,498 4,276 25,325 29,601 39.49 33.78
ECUADOR 1.10 53.30 2,032 11,616 13,648 4,456 25,474 29,930 39.26 33.41
ECUADOR 1.30 55.80 1,277 10,941 12,218 2,977 25,503 28,480 39.21 35.11
ECUADOR 4.20 49.50 2,120 11,934 14,054 4,579 25,775 30,354 38.80 32.94
ECUADOR 1.00 54.40 2,109 11,573 13,682 4,729 25,948 30,677 38.54 32.60
ECUADOR 1.40 53.40 1,976 11,759 13,735 4,372 26,015 30,387 38.44 32.91
ECUADOR 1.30 55.40 2,507 11,415 13,922 5,790 26,363 32,152 37.93 31.10
ECUADOR 1.20 55.10 2,418 12,000 14,418 5,533 27,460 32,993 36.42 30.31
EQUADOR 3.50 50.20 1,727 9,046 10,773 3,730 19,538 23,268 51.18 42.98
GHANA 1.30 53.30 947 10,784 11,731 2,086 23,753 25,839 42.10 38.70
GHANA 0.80 52.80 1,004 11,067 12,071 2,164 23,851 26,015 41.93 38.44
GHANA 1.00 53.80 1,017 10,844 11,861 2,250 23,991 26,241 41.68 38.11
GHANA 1.00 54.30 1,007 10,800 11,807 2,253 24,161 26,414 41.39 37.86
GHANA 1.20 53.70 967 10,991 11,958 2,144 24,370 26,514 41.03 37.72
GHANA 0.70 53.70 1,072 11,130 12,202 2,351 24,408 26,759 40.97 37.37
GHANA 3.20 55.20 989 10,887 11,876 2,377 26,171 28,548 38.21 35.03
GHANA 3.30 54.60 754 11,386 12,140 1,791 27,045 28,836 36.98 34.68
GRENADA 1.30 52.50 1,950 10,271 12,221 4,221 22,232 26,452 44.98 37.80
HAITI 1.40 53.70 1,830 11,674 13,504 4,076 26,000 30,076 38.46 33.25
HAITI 0.80 52.00 1,904 13,468 15,372 4,034 28,534 32,568 35.05 30.71
HAITI 0.90 53.90 1,944 13,153 15,097 4,301 29,100 33,400 34.36 29.94
HAITI 2.80 53.40 1,473 13,697 15,170 3,363 31,272 34,635 31.98 28.87
INDIA 3.30 53.50 1,348 12,375 13,723 3,120 28,646 31,766 34.91 31.48
INDONESIA 1.70 53.30 2,398 10,779 13,177 5,329 23,953 29,282 41.75 34.15
INDONESIA 2.00 53.00 2,380 11,071 13,451 5,289 24,602 29,891 40.65 33.45
IVORY COAST 2.10 50.60 807 8,560 9,367 1,706 18,097 19,803 55.26 50.50
IVORY COAST 1.00 51.10 840 8,831 9,671 1,754 18,436 20,190 54.24 49.53
IVORY COAST 1.90 53.10 802 8,374 9,176 1,782 18,609 20,391 53.74 49.04
IVORY COAST 2.00 52.80 836 8,513 9,349 1,850 18,834 20,684 53.10 48.35
IVORY COAST 1.00 48.90 921 9,463 10,384 1,838 18,888 20,727 52.94 48.25
IVORY COAST 2.30 53.30 742 8,458 9,200 1,671 19,050 20,721 52.49 48.26
IVORY COAST 0.90 47.70 841 9,820 10,661 1,636 19,105 20,741 52.34 48.21
IVORY COAST 2.60 52.50 839 8,698 9,537 1,869 19,372 21,241 51.62 47.08
IVORY COAST 2.40 53.30 834 8,791 9,625 1,883 19,844 21,727 50.39 46.03
IVORY COAST 2.10 53.40 790 8,881 9,671 1,775 19,957 21,733 50.11 46.01
IVORY COAST 2.50 53.00 794 8,902 9,696 1,784 20,004 21,789 49.99 45.90
IVORY COAST 2.20 51.90 829 9,240 10,069 1,806 20,131 21,937 49.68 45.59
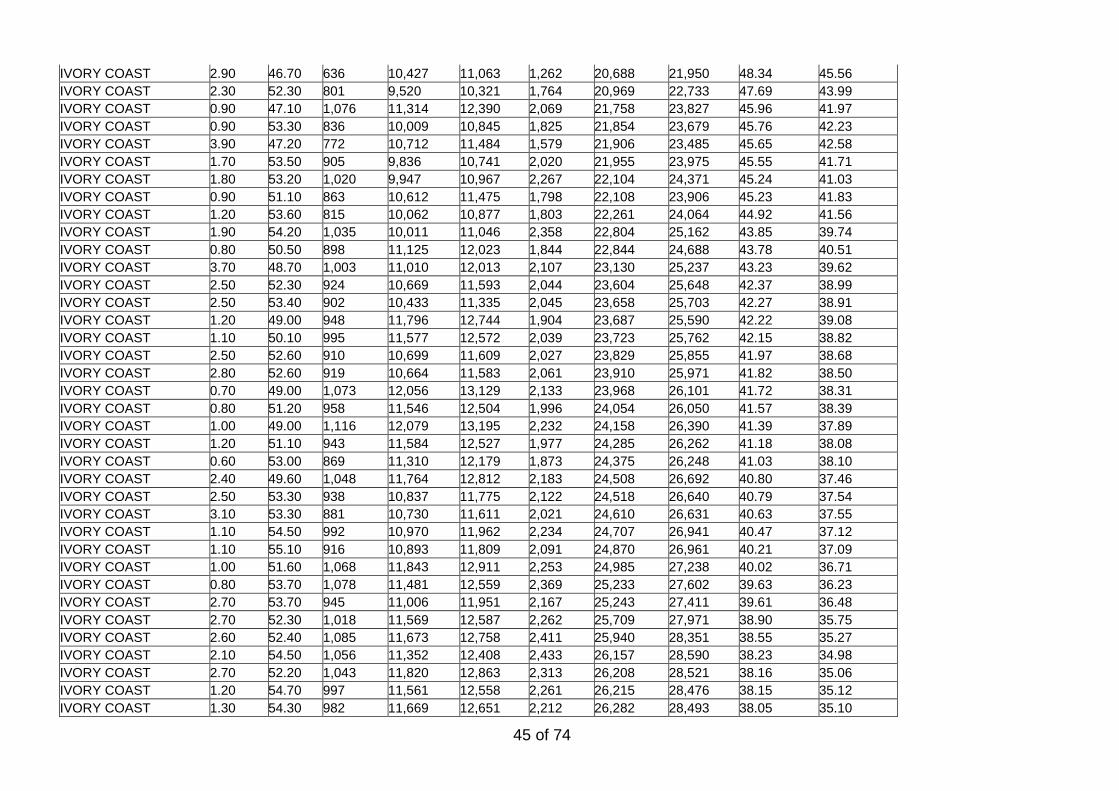
45 of 74
IVORY COAST 2.90 46.70 636 10,427 11,063 1,262 20,688 21,950 48.34 45.56
IVORY COAST 2.30 52.30 801 9,520 10,321 1,764 20,969 22,733 47.69 43.99
IVORY COAST 0.90 47.10 1,076 11,314 12,390 2,069 21,758 23,827 45.96 41.97
IVORY COAST 0.90 53.30 836 10,009 10,845 1,825 21,854 23,679 45.76 42.23
IVORY COAST 3.90 47.20 772 10,712 11,484 1,579 21,906 23,485 45.65 42.58
IVORY COAST 1.70 53.50 905 9,836 10,741 2,020 21,955 23,975 45.55 41.71
IVORY COAST 1.80 53.20 1,020 9,947 10,967 2,267 22,104 24,371 45.24 41.03
IVORY COAST 0.90 51.10 863 10,612 11,475 1,798 22,108 23,906 45.23 41.83
IVORY COAST 1.20 53.60 815 10,062 10,877 1,803 22,261 24,064 44.92 41.56
IVORY COAST 1.90 54.20 1,035 10,011 11,046 2,358 22,804 25,162 43.85 39.74
IVORY COAST 0.80 50.50 898 11,125 12,023 1,844 22,844 24,688 43.78 40.51
IVORY COAST 3.70 48.70 1,003 11,010 12,013 2,107 23,130 25,237 43.23 39.62
IVORY COAST 2.50 52.30 924 10,669 11,593 2,044 23,604 25,648 42.37 38.99
IVORY COAST 2.50 53.40 902 10,433 11,335 2,045 23,658 25,703 42.27 38.91
IVORY COAST 1.20 49.00 948 11,796 12,744 1,904 23,687 25,590 42.22 39.08
IVORY COAST 1.10 50.10 995 11,577 12,572 2,039 23,723 25,762 42.15 38.82
IVORY COAST 2.50 52.60 910 10,699 11,609 2,027 23,829 25,855 41.97 38.68
IVORY COAST 2.80 52.60 919 10,664 11,583 2,061 23,910 25,971 41.82 38.50
IVORY COAST 0.70 49.00 1,073 12,056 13,129 2,133 23,968 26,101 41.72 38.31
IVORY COAST 0.80 51.20 958 11,546 12,504 1,996 24,054 26,050 41.57 38.39
IVORY COAST 1.00 49.00 1,116 12,079 13,195 2,232 24,158 26,390 41.39 37.89
IVORY COAST 1.20 51.10 943 11,584 12,527 1,977 24,285 26,262 41.18 38.08
IVORY COAST 0.60 53.00 869 11,310 12,179 1,873 24,375 26,248 41.03 38.10
IVORY COAST 2.40 49.60 1,048 11,764 12,812 2,183 24,508 26,692 40.80 37.46
IVORY COAST 2.50 53.30 938 10,837 11,775 2,122 24,518 26,640 40.79 37.54
IVORY COAST 3.10 53.30 881 10,730 11,611 2,021 24,610 26,631 40.63 37.55
IVORY COAST 1.10 54.50 992 10,970 11,962 2,234 24,707 26,941 40.47 37.12
IVORY COAST 1.10 55.10 916 10,893 11,809 2,091 24,870 26,961 40.21 37.09
IVORY COAST 1.00 51.60 1,068 11,843 12,911 2,253 24,985 27,238 40.02 36.71
IVORY COAST 0.80 53.70 1,078 11,481 12,559 2,369 25,233 27,602 39.63 36.23
IVORY COAST 2.70 53.70 945 11,006 11,951 2,167 25,243 27,411 39.61 36.48
IVORY COAST 2.70 52.30 1,018 11,569 12,587 2,262 25,709 27,971 38.90 35.75
IVORY COAST 2.60 52.40 1,085 11,673 12,758 2,411 25,940 28,351 38.55 35.27
IVORY COAST 2.10 54.50 1,056 11,352 12,408 2,433 26,157 28,590 38.23 34.98
IVORY COAST 2.70 52.20 1,043 11,820 12,863 2,313 26,208 28,521 38.16 35.06
IVORY COAST 1.20 54.70 997 11,561 12,558 2,261 26,215 28,476 38.15 35.12
IVORY COAST 1.30 54.30 982 11,669 12,651 2,212 26,282 28,493 38.05 35.10

46 of 74
IVORY COAST 1.20 54.60 998 11,617 12,615 2,258 26,283 28,541 38.05 35.04
IVORY COAST 3.10 55.20 831 11,058 11,889 1,993 26,518 28,511 37.71 35.07
IVORY COAST 1.40 54.40 998 11,742 12,740 2,258 26,566 28,824 37.64 34.69
IVORY COAST 1.20 54.50 1,022 11,810 12,832 2,307 26,659 28,966 37.51 34.52
IVORY COAST 1.20 55.80 962 11,667 12,629 2,237 27,133 29,370 36.86 34.05
IVORY COAST 1.10 55.60 1,003 11,988 12,991 2,316 27,686 30,002 36.12 33.33
IVORY COAST 1.20 55.80 1,009 12,026 13,035 2,347 27,967 30,314 35.76 32.99
IVORY COAST 1.10 56.30 998 12,069 13,067 2,343 28,331 30,674 35.30 32.60
JAMAICA 3.40 53.60 1,668 11,046 12,714 3,879 25,688 29,567 38.93 33.82
JAMAICA 3.40 54.10 1,629 11,370 12,999 3,833 26,753 30,586 37.38 32.69
MADAGASCAR 0.70 49.90 1,804 8,913 10,717 3,652 18,043 21,694 55.42 46.09
MADAGASCAR 1.10 50.00 1,434 9,986 11,420 2,933 20,421 23,354 48.97 42.82
MADAGASCAR 1.60 50.30 1,620 10,599 12,219 3,368 22,035 25,403 45.38 39.36
MADAGASCAR 0.80 49.70 1,373 11,496 12,869 2,774 23,224 25,998 43.06 38.46
MADAGASCAR 1.30 53.10 1,752 10,592 12,344 3,842 23,228 27,070 43.05 36.94
MADAGASCAR 2.40 51.60 1,592 11,181 12,773 3,461 24,307 27,767 41.14 36.01
MADAGASCAR 1.10 52.60 1,238 11,697 12,935 2,674 25,263 27,937 39.58 35.79
MADAGASCAR 1.70 51.50 1,655 11,976 13,631 3,536 25,590 29,126 39.08 34.33
MEXICO 1.40 51.80 846 10,796 11,642 1,808 23,068 24,876 43.35 40.20
MEXICO 1.10 52.70 922 10,788 11,710 1,996 23,351 25,346 42.83 39.45
MEXICO 1.60 51.70 853 11,001 11,854 1,827 23,557 25,383 42.45 39.40
MEXICO 1.30 52.60 916 11,779 12,695 1,987 25,551 27,538 39.14 36.31
N/A 0.70 53.70 945 11,435 12,380 2,072 25,077 27,149 39.88 36.83
PAPUA NEW GUINEA 1.20 52.70 1,618 9,002 10,620 3,510 19,527 23,037 51.21 43.41
PAPUA NEW GUINEA 0.50 53.70 1,430 9,225 10,655 3,122 20,142 23,264 49.65 42.98
PAPUA NEW GUINEA 1.80 54.10 1,677 9,129 10,806 3,803 20,701 24,503 48.31 40.81
PAPUA NEW GUINEA 1.00 53.00 1,956 9,613 11,569 4,252 20,898 25,150 47.85 39.76
PAPUA NEW GUINEA 1.80 49.10 1,462 10,403 11,865 2,978 21,187 24,165 47.20 41.38
PAPUA NEW GUINEA 0.80 54.50 1,769 9,507 11,276 3,957 21,268 25,226 47.02 39.64
PAPUA NEW GUINEA 1.40 53.70 1,892 9,664 11,556 4,214 21,523 25,737 46.46 38.85
PAPUA NEW GUINEA 1.30 52.90 1,924 9,935 11,859 4,201 21,692 25,893 46.10 38.62
PAPUA NEW GUINEA 3.70 49.00 1,435 10,310 11,745 3,034 21,797 24,831 45.88 40.27
PAPUA NEW GUINEA 1.30 53.50 1,923 9,924 11,847 4,254 21,956 26,210 45.55 38.15
PAPUA NEW GUINEA 1.10 54.20 1,761 9,920 11,681 3,940 22,192 26,132 45.06 38.27
PAPUA NEW GUINEA 1.20 49.80 1,393 10,892 12,285 2,843 22,229 25,071 44.99 39.89
PAPUA NEW GUINEA 2.50 51.30 1,511 10,394 11,905 3,271 22,498 25,768 44.45 38.81
PAPUA NEW GUINEA 1.40 51.10 1,559 10,875 12,434 3,282 22,895 26,177 43.68 38.20

47 of 74
PAPUA NEW GUINEA 1.70 51.40 1,511 10,892 12,403 3,222 23,224 26,446 43.06 37.81
PAPUA NEW GUINEA 3.50 50.60 1,460 10,847 12,307 3,181 23,632 26,813 42.32 37.30
PERU 2.00 55.50 3,284 9,416 12,700 7,727 22,155 29,882 45.14 33.46
PERU 1.50 52.50 1,186 10,665 11,851 2,578 23,185 25,763 43.13 38.82
PERU 1.10 53.70 1,592 10,744 12,336 3,522 23,770 27,292 42.07 36.64
PERU 1.00 53.20 1,894 11,032 12,926 4,135 24,087 28,223 41.52 35.43
PERU 1.20 54.80 1,724 11,770 13,494 3,918 26,750 30,668 37.38 32.61
PERU 1.10 55.40 2,107 11,874 13,981 4,844 27,297 32,140 36.63 31.11
PERU 3.80 53.10 1,535 12,147 13,682 3,561 28,183 31,745 35.48 31.50
PERU 0.90 55.60 2,266 13,167 15,433 5,209 30,269 35,478 33.04 28.19
SAN TOME 2.60 50.00 1,041 11,913 12,954 2,196 25,133 27,329 39.79 36.59
SAO TOME 3.70 46.70 912 10,641 11,553 1,839 21,454 23,292 46.61 42.93
SAO TOME 1.40 52.00 708 11,917 12,625 1,519 25,573 27,092 39.10 36.91
SAO TOME 3.30 50.80 925 12,156 13,081 2,015 26,484 28,499 37.76 35.09
SAO TOME 1.00 55.80 715 11,470 12,185 1,655 26,551 28,206 37.66 35.45
ST DOMINGO 3.20 46.50 1,642 11,149 12,791 3,264 22,165 25,429 45.12 39.32
ST DOMINGO 3.30 46.80 2,002 12,847 14,849 4,012 25,745 29,758 38.84 33.60
ST DOMINGO 3.40 48.70 1,960 12,659 14,619 4,092 26,428 30,520 37.84 32.77
ST DOMINGO 3.00 53.60 2,061 12,791 14,852 4,749 29,472 34,221 33.93 29.22
ST.DOMINGO 3.20 55.50 1,705 12,070 13,775 4,128 29,225 33,354 34.22 29.98
ST.DOMINGO 3.10 55.10 1,824 12,784 14,608 4,364 30,584 34,947 32.70 28.61
ST.DOMINGO 3.30 54.70 2,068 12,954 15,022 4,924 30,843 35,767 32.42 27.96
ST.DOMINGO 3.00 54.50 1,728 13,132 14,860 4,066 30,899 34,965 32.36 28.60
ST.DOMINGO 3.00 54.70 1,615 13,076 14,691 3,818 30,913 34,730 32.35 28.79
TANZANIA 1.80 53.00 1,223 11,415 12,638 2,706 25,254 27,960 39.60 35.77
TANZANIA 1.20 54.30 1,412 11,258 12,670 3,173 25,299 28,472 39.53 35.12
TANZANIA 1.20 54.20 954 11,498 12,452 2,139 25,780 27,919 38.79 35.82
TANZANIA 1.00 56.40 1,221 11,055 12,276 2,866 25,951 28,817 38.53 34.70
TANZANIA 1.10 54.70 1,138 11,793 12,931 2,575 26,681 29,256 37.48 34.18
TANZANIA 3.60 53.90 1,059 11,576 12,635 2,492 27,238 29,729 36.71 33.64
TANZANIA 3.20 52.80 1,595 12,382 13,977 3,625 28,141 31,766 35.54 31.48
TANZANIA 3.30 53.80 1,123 12,150 13,273 2,618 28,322 30,939 35.31 32.32
TANZANIA 1.00 54.20 1,610 12,706 14,316 3,594 28,362 31,955 35.26 31.29
TANZANIA 2.60 56.00 1,562 12,050 13,612 3,773 29,106 32,879 34.36 30.41
TANZANIA 0.50 56.00 1,428 13,485 14,913 3,283 31,000 34,283 32.26 29.17
TOGO 0.70 52.70 1,025 11,998 13,023 2,200 25,747 27,946 38.84 35.78
UGANDA 3.20 53.30 1,197 11,603 12,800 2,752 26,674 29,425 37.49 33.98

48 of 74
UGANDA 2.80 55.80 1,119 12,379 13,498 2,703 29,901 32,604 33.44 30.67
UGANDA 3.10 55.50 1,142 12,515 13,657 2,758 30,229 32,988 33.08 30.31
UGANDA 3.10 56.20 1,120 12,751 13,871 2,752 31,329 34,081 31.92 29.34
UNITED STATES 0.90 55.50 1,468 11,563 13,031 3,367 26,521 29,888 37.71 33.46
UNITED STATES 0.80 55.50 1,771 11,623 13,394 4,053 26,597 30,650 37.60 32.63
UNITED STATES 0.90 55.80 1,594 11,575 13,169 3,681 26,732 30,413 37.41 32.88
UNITED STATES 1.00 54.50 1,482 12,105 13,587 3,330 27,202 30,533 36.76 32.75
VENEZUELA 1.30 49.00 1,882 8,797 10,679 3,787 17,700 21,487 56.50 46.54
VENEZUELA 1.40 49.80 2,302 10,764 13,066 4,717 22,057 26,775 45.34 37.35
VENEZUELA 1.90 53.80 1,376 10,384 11,760 3,106 23,440 26,546 42.66 37.67
VENEZUELA 1.60 52.80 1,928 10,895 12,823 4,228 23,893 28,121 41.85 35.56
VENEZUELA 1.00 50.80 2,170 11,701 13,871 4,502 24,276 28,778 41.19 34.75
VENEZUELA 1.50 51.50 2,650 11,589 14,239 5,638 24,657 30,296 40.56 33.01
VENEZUELA 2.30 53.30 1,467 10,963 12,430 3,304 24,691 27,995 40.50 35.72
VENEZUELA 2.70 50.50 2,622 11,849 14,471 5,603 25,318 30,921 39.50 32.34
Table 2(a) Statistical analysis of cocoa liquor results
Factors calculated from the average levels of alkaloids: Theobromine -
Mean Max Min 95% CI 99% CI
40.70 31.92 56.50 40.02 41.39 39.81 41.61
Total Alkaloids –
Mean Max Min 95% CI 99% CI
36.05 25.53 50.50 35.42 36.71 35.23 36.92
CI is the confidence interval of the results
Caffeine on Dry Fat Free Matter
Theobromine on Dry Fat Free Matter
Total Alkaloids on Dry Fat Free Matter
mg/kg mg/kg mg/kg
Mean 3,165 24,572 27,737
sd 1,268 2,900 3,470
max 8,742 31,329 39,168
min 1,262 17,700 19,803
CI 95% 3,341 24,988 28,229
2,980 24,161 27,240
CI 99% 3,397 25,118 28,384
2,923 24,031 27,085

49 of 74
Table 3 Cocoa Nib Analysis
Country Sample name Moisture KF
Fat Caffeine Theobromine Total Alkaloids
Caffeine on Dry Fat Free Matter
Theobromine on Dry Fat Free Matter
Total Alkaloids on Dry Fat Free Matter
Factor (Theobromine)
Factor (Total Alkaloids
% % mg/kg mg/kg mg/kg mg/kg mg/kg mg/kg
TANZANIA COCOA BEANS 3: TANZANIA, MAIN CROP 2009, PROD.DATE: 04-12-09
1.30 52.00 1315 13158 14473 2816 28176 30991 35.5 32.27
N/A
COCOA BEANS 1:50% IVORY COAST, 50% CAMEROEN, MAIN CROP 2009, PROD.DATE: 06-12-09
1.80 52.80 909 10842 11751 2002 23881 25883 41.9 38.64
TOGO COCOA BEANS 4: TOGO, MAIN CROP 2009, PROD.DATE: 06-12-09
1.40 48.80 959 11575 12534 1926 23243 25169 43.0 39.73
HAITI COCOA BEANS: NO.24 – SAINT DOMINQUE
2.30 39.90 2144 12869 15013 3709 22265 25974 44.9 38.50
GHANA COCOA BEANS 2: GHANA, MAIN CROP 2009, PROD.DATE: 04-12-09
1.30 51.40 1004 10355 11359 2123 21892 24015 45.7 41.64
TANZANIA COCOA BEANS: NO.23 – TANZANIA
2.90 38.40 1084 12608 13692 1847 21479 23325 46.6 42.87
TANZANIA COCOA BEANS: NO.26 – TANZANIA
3.30 42.90 1290 10464 11754 2398 19450 21848 51.4 45.77
PAPUA NEW GUINEA
COCOA BEANS: NO.25 – PAPUA NEW GUINEA
2.50 40.70 1783 9572 11355 3139 16852 19991 59.3 50.02
PAPUA NEW GUINEA
COCOA BEANS: NO.27 – PAPUA NEW GUINEA
3.30 42.40 1884 7687 9571 3470 14157 17626 70.6 56.73
VENEZUELA COCOA BEANS: NO.22 – VENEZUELA
3.00 34.80 2024 7617 9641 3254 12246 15500 81.7 64.52

50 of 74
Graphical Representation of Results Only countries where 4 or more results have been obtained are included in the chart. Figure 6 Conversion factor from theobromine by country
Factor (Theobromine)
0.00
10.00
20.00
30.00
40.00
50.00
60.00
Ecu
ador
Gha
na
Ivory Coa
st
Mad
aga
scar
PNG
Per
u
Sao
Tome
St D
omingo
Tan
zania
Uga
nda
USA
Ven
ezue
la
Country
Mean
Facto
r (
+/-
sd
)
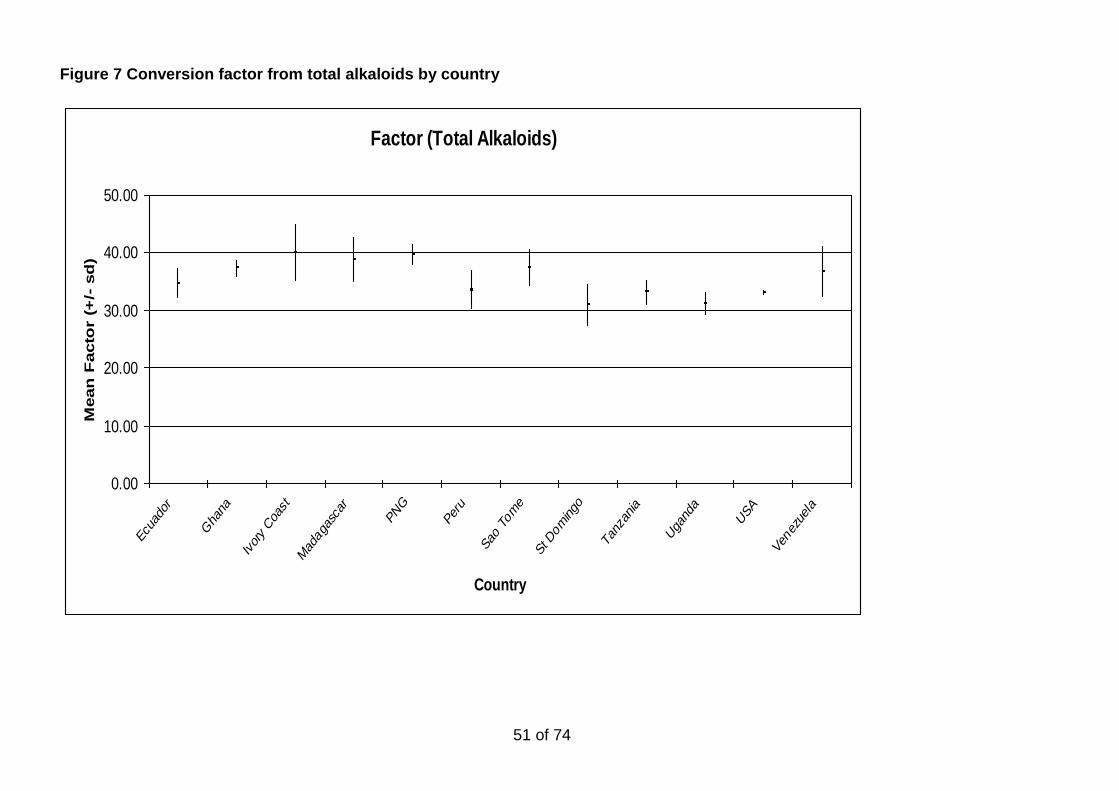
51 of 74
Figure 7 Conversion factor from total alkaloids by country
Factor (Total Alkaloids)
0.00
10.00
20.00
30.00
40.00
50.00
Ecu
ador
Gha
na
Ivory Coa
st
Mad
aga
scar
PNG
Per
u
Sao
Tome
St D
omingo
Tan
zania
Uga
nda
USA
Ven
ezue
la
Country
Mean
Facto
r (
+/-
sd
)

52 of 74
Figure 8 Conversion factor from theobromine by continent
Factor (Theobromine)
0.00
10.00
20.00
30.00
40.00
50.00
60.00
Africa Asia N. America S. America
Continent
Mean
Facto
r (+
/- s
d)
Summary
Factor (theobromine) Theobromine in DFFC (mg/kg)
Continent Samples (n) Mean CI (95%) Mean CI (95%)
Africa 97 41.9 40.8-43.0 24,255 23,660-24,851
South America 48 40.7 39.5-41.8 24,791 24,141-25,442
N. & Central America 27 37.6 36.0-39.2 26,887 25,784-27,990
Asia & Indonesia 19 45.1 43.3-46.8 22,345 21,383-23,308
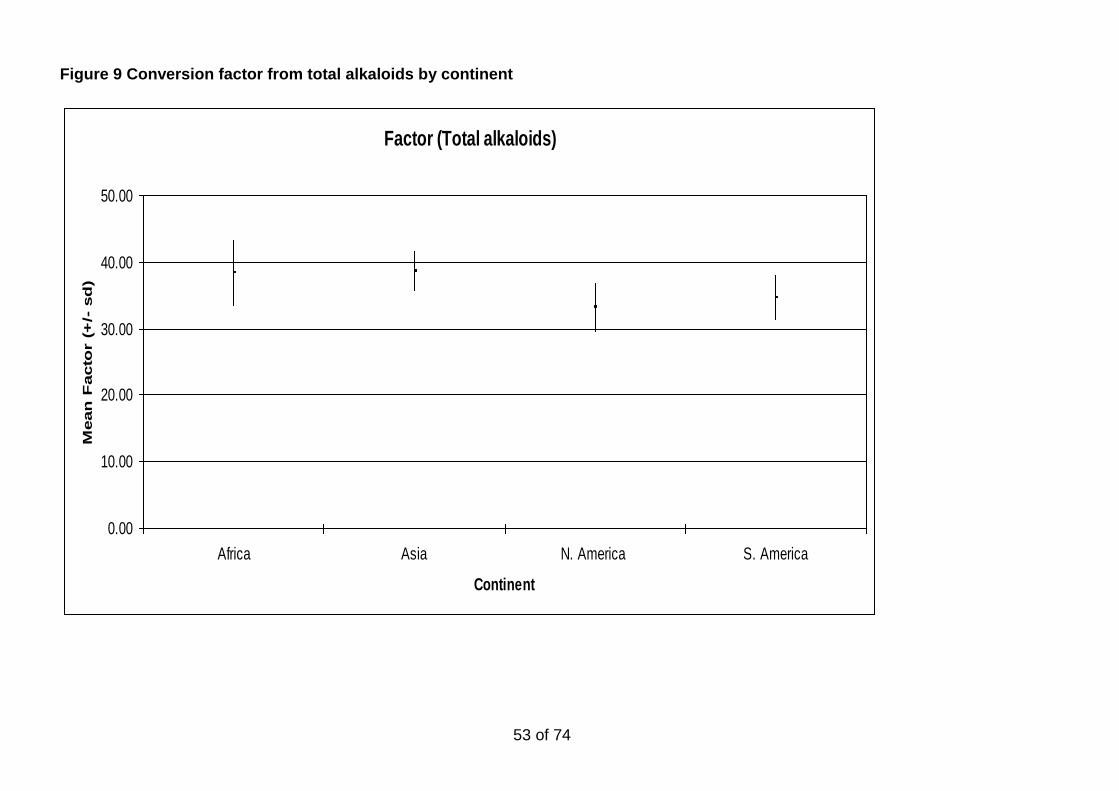
53 of 74
Figure 9 Conversion factor from total alkaloids by continent
Factor (Total alkaloids)
0.00
10.00
20.00
30.00
40.00
50.00
Africa Asia N. America S. America
Continent
Mean
Facto
r (
+/-
sd
)

54 of 74
Figure 10 Gaussian Plot of Results for Theobromine in Dry Fat Free Cocoa
Theobromine in DFFC frequency chart
0
5
10
15
20
25
30
35
1 2 3 4 5 6 7 8 9 10 11 12 13 14 15 16 17
Relative Theobromine Content
Fre
qu
en
cy

55 of 74
Figure 11 Ratio of Dry Fat Free Theobromine to Caffeine content of cocoa liquors by Country
Theobromine : Caffeine Ratios
0.00
2.00
4.00
6.00
8.00
10.00
12.00
14.00
16.00
18.00
BO
LIV
IA
CA
ME
RO
ON
DO
MIN
ICA
N
EC
UA
DO
R
EC
UA
DO
R
EC
UA
DO
R
EC
UA
DO
R
EC
UA
DO
R
GH
AN
A
GR
EN
AD
A
IND
IA
IVO
RY
CO
AS
T
IVO
RY
CO
AS
T
IVO
RY
CO
AS
T
IVO
RY
CO
AS
T
IVO
RY
CO
AS
T
IVO
RY
CO
AS
T
IVO
RY
CO
AS
T
IVO
RY
CO
AS
T
IVO
RY
CO
AS
T
IVO
RY
CO
AS
T
IVO
RY
CO
AS
T
JA
MA
ICA
MA
DA
GA
SC
AR
ME
XIC
O
PA
PU
A N
EW
GU
INE
A
PA
PU
A N
EW
GU
INE
A
PA
PU
A N
EW
GU
INE
A
PA
PU
A N
EW
GU
INE
A
PE
RU
SA
O T
OM
E
ST
DO
MIN
GO
ST
.DO
MIN
GO
TA
NZ
AN
IA
TA
NZ
AN
IA
UG
AN
DA
UN
ITE
D S
TA
TE
S
VE
NE
ZU
ELA
VE
NE
ZU
ELA
Country
Ra
tio

56 of 74
Table 4 Laboratory AQC APPENDIX 5 Samples - Fat LGC SAMPLE
AQC_NAME RESULT AQC RESULT STATUS TARGET_SD SAMPNUM
AQC DIFFERENCE 50.48 50.30 -0.19 OK 0.250 20090187 AQC_NAME RESULT STATUS TARGET TARGET_SD SAMPNUM
AQC DIFFERENCE 51.32 51.02 -0.30 OK 0.250 20090188 AQC STD LGCQC1003 29.67 OK 29.50 0.75 20090187
AQC DIFFERENCE 51.46 51.44 -0.02 OK 0.250 20090189 AQC STD LGCQC1003 29.73 OK 29.50 0.75 20090641
AQC DIFFERENCE 49.98 50.00 0.02 OK 0.250 20090190
AQC DIFFERENCE 51.64 51.58 -0.06 OK 0.250 20090191 NIST 2384
AQC DIFFERENCE 55.97 55.89 -0.07 OK 0.250 20090192 AQC_NAME RESULT STATUS TARGET TARGET_SD SAMPNUM
AQC DIFFERENCE 53.32 53.14 -0.19 OK 0.250 20090640 AQC STD NIST2384 50.41 OK 51.40 0.55 20090187
AQC DIFFERENCE 52.39 52.73 0.34 OK 0.250 20090768 AQC STD NIST2384 50.59 OK 51.40 0.55 20090188
AQC DIFFERENCE 53.38 53.38 0.00 OK 0.250 20090778 AQC STD NIST2384 51.65 OK 51.40 0.55 20090647
AQC DIFFERENCE 50.53 50.50 -0.02 OK 0.250 20090788 AQC STD NIST2384 51.84 OK 51.40 0.55 20090766
AQC DIFFERENCE 54.48 54.02 -0.46 OK 0.250 20090798 AQC STD NIST2384 52.23 OK 51.40 0.55 20090776
AQC DIFFERENCE 46.51 46.30 -0.21 OK 0.250 20091328 AQC STD NIST2384 51.20 OK 51.40 0.55 20090786
AQC DIFFERENCE 49.04 49.64 0.60 WARNING 0.250 20091338 AQC STD NIST2384 50.54 OK 51.40 0.55 20090796
AQC DIFFERENCE 36.22 35.74 -0.48 OK 0.250 20092032 AQC STD NIST2384 50.43 OK 51.40 0.55 20091326
AQC DIFFERENCE 55.62 55.50 -0.12 OK 0.250 20100082 AQC STD NIST2384 51.56 OK 51.40 0.55 20091346
AQC DIFFERENCE 55.06 54.99 -0.07 OK 0.250 20100092 AQC STD NIST2384 51.93 OK 51.40 0.55 20092032
AQC DIFFERENCE 50.02 49.92 -0.10 OK 0.250 20100259 AQC STD NIST2384 52.19 OK 51.40 0.55 20100075
AQC DIFFERENCE 53.38 53.26 -0.12 OK 0.250 20100265 AQC STD NIST2384 51.83 OK 51.40 0.55 20100085
AQC DIFFERENCE 50.32 50.47 0.15 OK 0.250 20100959 AQC STD NIST2384 52.53 WARNING 51.40 0.55 20100252
AQC DIFFERENCE 53.31 53.28 -0.03 OK 0.250 20100969 AQC STD NIST2384 51.32 OK 51.40 0.55 20100262
AQC DIFFERENCE 52.69 52.58 -0.11 OK 0.250 20101804 AQC STD NIST2384 51.72 OK 51.40 0.55 20100958
AQC DIFFERENCE 53.78 53.59 -0.19 OK 0.250 20101814 AQC STD NIST2384 51.75 OK 51.40 0.55 20100968
AQC DIFFERENCE 48.96 48.72 -0.25 OK 0.250 20101824 AQC STD NIST2384 52.04 OK 51.40 0.55 20101803
AQC DIFFERENCE 53.65 53.71 0.06 OK 0.250 20101834 AQC STD NIST2384 50.75 OK 51.40 0.55 20101813
AQC DIFFERENCE 53.31 53.30 -0.01 OK 0.250 20101844 AQC STD NIST2384 51.97 OK 51.40 0.55 20101823
AQC DIFFERENCE 33.65 33.49 -0.16 OK 0.250 20101897 AQC STD NIST2384 51.72 OK 51.40 0.55 20101833
AQC DIFFERENCE 35.95 36.25 0.30 OK 0.250 20101907 AQC STD NIST2384 51.60 OK 51.40 0.55 20101843
AQC DIFFERENCE 31.12 30.79 -0.33 OK 0.250 20101917 AQC STD NIST2384 52.03 OK 51.40 0.55 20101896
AQC DIFFERENCE 27.87 27.74 -0.13 OK 0.250 20101927 AQC STD NIST2384 50.33 OK 51.40 0.55 20101906
AQC DIFFERENCE 52.59 52.59 0.00 OK 0.250 20102078 AQC STD NIST2384 51.86 OK 51.40 0.55 20101916
AQC DIFFERENCE 55.61 55.56 -0.05 OK 0.250 20102088 AQC STD NIST2384 52.03 OK 51.40 0.55 20101926
Average -0.07 AQC STD NIST2384 51.96 OK 51.40 0.55 20102076
sd 0.22 AQC STD NIST2384 52.10 OK 51.40 0.55 20102086
Average 51.56
sd 0.64

57 of 74
Samples - Caffeine NIST STANDARD 2384
AQC_NAME RESULT AQC Rel % STATUS TARGET_SD SAMPNUM AQC_NAME RESULT STATUS TARGET TARGET_SD SAMPNUM
AQC DUPLICATE 2622 2607 -0.57 NO LIMIT 0.000 20090187 AQC STD NIST2384 1101.00 OK 1060 25 20090187
AQC DUPLICATE 1511 1474 -2.45 NO LIMIT 0.000 20090188 AQC STD NIST2384 1101.00 OK 1060 25 20090192
AQC DUPLICATE 1950 1933 -0.87 NO LIMIT 0.000 20090189 AQC STD NIST2384 1025.00 OK 1060 25 20090647
AQC DUPLICATE 1041 1028 -1.25 NO LIMIT 0.000 20090190 AQC STD NIST2384 1015.00 OK 1060 25 20090776
AQC DUPLICATE 1592 1608 1.01 NO LIMIT 0.000 20090191 AQC STD NIST2384 1017.00 OK 1060 25 20090786
AQC DUPLICATE 1562 1530 -2.05 NO LIMIT 0.000 20090192 AQC STD NIST2384 1053.00 OK 1060 25 20090796
AQC DUPLICATE 1535 1544 0.59 NO LIMIT 0.000 20090631 AQC STD NIST2384 1010.00 OK 1060 25 20090805
AQC DUPLICATE 1705 1721 0.94 NO LIMIT 0.000 20090647 AQC STD NIST2384 1068.00 OK 1060 25 20091346
AQC DUPLICATE 1043 1093 4.79 OK 3.000 20090766 AQC STD NIST2384 1076.00 OK 1060 25 20100075
AQC DUPLICATE 794 783 -1.39 OK 3.000 20090776 AQC STD NIST2384 1059.00 OK 1060 25 20100085
AQC DUPLICATE 829 843 1.69 OK 3.000 20090786 AQC STD NIST2384 1020.30 OK 1060 25 20100252
AQC DUPLICATE 1073 1074 0.09 OK 3.000 20090796 AQC STD NIST2384 1060.40 OK 1060 25 20100262
AQC DUPLICATE 815 824 1.10 OK 3.000 20090805 AQC STD NIST2384 1041.50 OK 1060 25 20100958
AQC DUPLICATE 1960 1993 1.68 OK 3.000 20091336 AQC STD NIST2384 1025.00 OK 1060 25 20100968
AQC DUPLICATE 1197 1104 -7.77 WARNING 3.000 20091346 AQC STD NIST2384 1020.00 OK 1060 25 20101803
AQC DUPLICATE 2266 2243 -1.02 OK 3.000 20100082 AQC STD NIST2384 1012.00 OK 1044 25 20101813
AQC DUPLICATE 2418 2470 2.15 OK 3.000 20100092 AQC STD NIST2384 1015.00 OK 1044 25 20101823
AQC DUPLICATE 1434 1444 0.66 OK 3.000 20100259 AQC STD NIST2384 1020.00 OK 1044 25 20101833
AQC DUPLICATE 1976 1974 -0.11 OK 3.000 20100265 AQC STD NIST2384 1049.00 OK 1044 25 20101843
AQC DUPLICATE 1620 1620 0.04 OK 3.000 20100959 AQC STD NIST2384 1035.00 OK 1044 25 20101896
AQC DUPLICATE 947 976 3.05 OK 3.000 20100969 AQC STD NIST2384 1079.00 OK 1044 25 20101906
AQC DUPLICATE 922 925 0.33 OK 3.000 20101804 AQC STD NIST2384 1043.00 OK 1044 25 20101916
AQC DUPLICATE 1189 1221 2.69 OK 3.000 20101823 AQC STD NIST2384 1025.00 OK 1044 25 20101926
AQC DUPLICATE 1923 1920 -0.16 OK 3.000 20101830 AQC STD NIST2384 1035.00 OK 1044 25 20102076
AQC DUPLICATE 1025 1024 -0.10 OK 3.000 20101842 AQC STD NIST2384 1047.00 OK 1044 25 20102086
AQC DUPLICATE 1064 1055 -0.85 OK 3.000 20101902 Average 1042.09
AQC DUPLICATE 962 985 2.39 OK 3.000 20101912 sd 26.9
AQC DUPLICATE 1012 1023 1.09 OK 3.000 20101922
AQC DUPLICATE 1070 1083 1.22 OK 3.000 20101932
AQC DUPLICATE 198 198 0.00 OK 3.000 20101933
AQC DUPLICATE 1009 1009 0.00 OK 3.000 20102086
Average 0.22
sd 2.14

58 of 74
Samples - Theobromine NIST 2384
AQC_NAME RESULT AQC Rel % STATUS TARGET_SD SAMPNUM AQC_NAME RESULT STATUS TARGET TARGET_SD SAMPNUM
AQC DUPLICATE 11849 11798 -0.43 NO LIMIT 0.00 20090187 AQC STD NIST2384 11053 OK 11600 550 20090187
AQC DUPLICATE 10394 10169 -2.16 NO LIMIT 0.00 20090188 AQC STD NIST2384 11033 OK 11600 550 20090192
AQC DUPLICATE 11548 11478 -0.61 NO LIMIT 0.00 20090189 AQC STD NIST2384 11553 OK 11600 550 20090647
AQC DUPLICATE 11913 11693 -1.85 NO LIMIT 0.00 20090190 AQC STD NIST2384 11107 OK 11600 550 20090776
AQC DUPLICATE 11181 11125 -0.50 NO LIMIT 0.00 20090191 AQC STD NIST2384 11339 OK 11600 550 20090786
AQC DUPLICATE 12050 11624 -3.54 NO LIMIT 0.00 20090192 AQC STD NIST2384 11495 OK 11600 550 20090796
AQC DUPLICATE 12147 12245 0.81 NO LIMIT 0.00 20090631 AQC STD NIST2384 10832 OK 11600 550 20090805
AQC DUPLICATE 12070 12151 0.67 NO LIMIT 0.00 20090647 AQC STD NIST2384 11537 OK 11600 550 20091346
AQC DUPLICATE 11820 12140 2.71 NO LIMIT 0.00 20090766 AQC STD NIST2384 11751 OK 11600 550 20100075
AQC DUPLICATE 8902 8866 -0.40 NO LIMIT 0.00 20090776 AQC STD NIST2384 11699 OK 11600 550 20100085
AQC DUPLICATE 9240 9291 0.55 NO LIMIT 0.00 20090786 AQC STD NIST2384 10738 OK 11600 550 20100252
AQC DUPLICATE 12056 11881 -1.45 NO LIMIT 0.00 20090796 AQC STD NIST2384 11041 OK 11600 550 20100262
AQC DUPLICATE 10062 10321 2.57 NO LIMIT 0.00 20090805 AQC STD NIST2384 10953 OK 11600 550 20100958
AQC DUPLICATE 12659 13113 3.59 NO LIMIT 0.00 20091336 AQC STD NIST2384 10918 OK 11600 550 20100968
AQC DUPLICATE 11603 11521 -0.71 NO LIMIT 0.00 20091346 AQC STD NIST2384 10888 OK 11235 350 20101803
AQC DUPLICATE 13167 12849 -2.42 OK 3.00 20100082 AQC STD NIST2384 10940 OK 11235 350 20101813
AQC DUPLICATE 12000 12096 0.80 OK 3.00 20100092 AQC STD NIST2384 10972 OK 11235 350 20101823
AQC DUPLICATE 9986 10065 0.79 OK 3.00 20100259 AQC STD NIST2384 11005 OK 11235 350 20101833
AQC DUPLICATE 11759 11681 -0.66 OK 3.00 20100265 AQC STD NIST2384 11048 OK 11235 350 20101843
AQC DUPLICATE 10599 10614 0.15 OK 3.00 20100959 AQC STD NIST2384 11362 OK 11235 350 20101896
AQC DUPLICATE 10784 11060 2.56 OK 3.00 20100969 AQC STD NIST2384 10960 OK 11235 350 20101906
AQC DUPLICATE 10989 10796 -1.76 OK 3.00 20101803 AQC STD NIST2384 10908 OK 11235 350 20101916
AQC DUPLICATE 10958 11055 0.89 OK 3.00 20101823 AQC STD NIST2384 11014 OK 11235 350 20101926
AQC DUPLICATE 9924 9848 -0.77 OK 3.00 20101830 AQC STD NIST2384 11489 OK 11235 350 20102076
AQC DUPLICATE 11998 11937 -0.51 OK 3.00 20101842 AQC STD NIST2384 11524 OK 11235 350 20102086
AQC DUPLICATE 11961 11812 -1.25 OK 3.00 20101902 Average 11166
AQC DUPLICATE 11156 11209 0.48 OK 3.00 20101912 sd 297
AQC DUPLICATE 11137 11144 0.06 OK 3.00 20101922
AQC DUPLICATE 11561 11515 -0.40 OK 3.00 20101932
AQC DUPLICATE 2084 2101 0.82 OK 3.00 20101933
AQC DUPLICATE 12026 12112 0.72 OK 3.00 20102086
Average -0.04
sd 1.57

59 of 74
APPENDIX 6 Table 5 Chocolate and Cocoa Liquor Results
Sample name Moisture KF
Fat Caffeine Theobromine Total Alkaloids
Caffeine in DFFC
Theobromine in DFFC
Total Alkaloids in DFFC
DFFC (Theobromine)
DFFC (Total Alkaloids)
Total Dry Cocoa Liquor
Declar-ation
% % mg/kg mg/kg mg/kg mg/kg mg/kg mg/kg % % % %
CHOCOLATE 6A: 09344-23/07 0.40 26.30 480 5076 5556 20.3 20.4 43.2 40.89
COCOA LIQUOR 6B: 09344-23/07 - AFRICA
1.30 52.80 1035 11484 12519 2255 25020 27275
CHOCOLATE 7A: 09346-24/04 1.20 36.00 221 1517 1738 7.4 7.4 14.8 12.02
COCOA LIQUOR 7B: 09346-24/04 - PAPUA NEW GUINEA
1.40 49.70 1355 10071 11426 2771 20595 23366
CHOCOLATE 8A: 09346-23/01 0.50 35.30 1143 7575 8718 35.9 35.7 71.9 68.7
COCOA LIQUOR 8B: 09346-23/01 - MADAGASCAR
1.20 50.40 1613 10222 11835 3333 21120 24452
CHOCOLATE 9A: 09348-24/05 0.60 30.70 180 1612 1792 6.5 6.6 14.4 10.68
COCOA LIQUOR 9B: 09348-24/05 - AFRICA
1.30 53.90 962 11156 12118 2147 24902 27049
CHOCOLATE 11A: 09348-24/04 0.90 38.60 250 2285 2535 8.9 9.1 20.1 17.09
COCOA LIQUOR 11B: 09348-24/04 - AFRICA
1.40 54.60 991 11256 12247 2252 25582 27834
CHOCOLATE 12A: 09349-22/05 1.10 31.10 214 2029 2243 8.1 8.2 18.2 14.94
COCOA LIQUOR 12B: 09349-22/05 - AFRICA
1.00 55.00 1006 11059 12065 2286 25134 27420
CHOCOLATE 13A: 09349-22/06 0.40 28.40 194 1719 1913 6.7 6.9 15.3 11.44
COCOA LIQUOR 13B: 09349-22/06 - AFRICA
1.00 55.00 1029 11221 12250 2339 25502 27841
CHOCOLATE 14A: 09349-24/07 0.80 31.20 190 1525 1715 6.0 6.2 13.8 10.91
COCOA LIQUOR 14B: 09349-24/07 - AFRICA
0.90 55.10 1012 11137 12149 2300 25311 27611
CHOCOLATE 15A: 09351-24/08 09352-24/01
0.40 34.10 241 2150 2391 8.8 8.9 19.7 17.23
COCOA LIQUOR 15B: 09351-24/08 09352-24/01 - AFRICA
1.00 54.70 1052 10829 11881 2375 24445 26819
CHOCOLATE 16A: 09351-22/08 0.20 28.10 173 1582 1755 6.5 6.6 14.5 11.44
COCOA LIQUOR 16B: 09351-22/08 - AFRICA
1.10 54.70 1042 10778 11820 2357 24385 26742
CHOCOLATE 17A: 09361-24/01 0.40 27.90 119 1163 1282 4.4 4.5 9.9 7.21

60 of 74
COCOA LIQUOR 17B: 09361-24/01 - AFRICA
1.10 54.90 1087 11525 12612 2470 26193 28664
CHOCOLATE 18A: 09361-24/05 0.60 28.30 198 2043 2241 7.8 7.8 17.3 15.09
COCOA LIQUOR 18B: 09361-24/05 - AFRICA
1.00 55.00 1084 11559 12643 2464 26270 28734
CHOCOLATE 19A: 09361-07/08 0.30 29.00 208 2137 2345 8.2 8.2 18.2 15.49
COCOA LIQUOR 19B: 09361-07/08 - AFRICA
1.00 54.90 1070 11561 12631 2426 26215 28642
CHOCOLATE 20A: 09361-24/0204 0.70 28.90 198 2084 2282 7.6 7.7 17.1 15.09
COCOA LIQUOR 20B: 09361-24/0204 - AFRICA
1.00 55.00 1038 12048 13086 2359 27382 29741

61 of 74
Table 6 DFFC - Comparison of results using current and proposed new factors
No Theobromine %
Declared DFFC %
DFFC (Liquor) %
DFFC (current factor) %
DFFC (new av factor) %
DFFC +1sd %
DFFC -1sd %
1 1972.435 7.08 8.3 7.0 8.1 7.2 9.2 Included 2.3% cocoa powder
1a 23870 85.3 97.4 86.8 111.0
2 5026 10.4 22 17.9 20.5 18.3 23.4
included 8% cocoa powder 10-12% fat
2a 22827 81.5 93.2 83.0 106.2
3 8511 45.07 33.3 30.4 34.7 31.0 39.6
included 3.63% cocoa powder 10-12% fat
3a 25588 91.4 104.4 93.0 119.0
4 14542 50.17 56.9 51.9 59.4 52.9 67.6
Included 13.49% cocoa powder 10-12% fat
4a 25558 91.3 104.3 92.9 118.9
5 14357 25.61 58.4 51.3 58.6 52.2 66.8
Included 21.51% cocoa powder 10-12% fat
5a 24605 87.9 100.4 89.5 114.4
6 6925 40.89 27.7 24.7 28.3 25.2 32.2
6a 25020 89.4 102.1 91.0 116.4
7 2416 12.02 11.7 8.6 9.9 8.8 11.2
7a 20595 73.6 84.1 74.9 95.8
8 11799 68.7 55.9 42.1 48.2 42.9 54.9
8a 21120 75.4 86.2 76.8 98.2
9 2346 10.68 9.4 8.4 9.6 8.5 10.9
+4.46% cocoa powder 10-12% fat
9a 24902 88.9 101.6 90.6 115.8
10 8812 41.18 35.4 31.5 36.0 32.0 41.0
10a 24914 89.0 101.7 90.6 115.9
11 3777 17.09 14.8 13.5 15.4 13.7 17.6
11a 25582 91.4 104.4 93.0 119.0
12 2993 14.94 11.9 10.7 12.2 10.9 13.9
12a 25134 89.8 102.6 91.4 116.9
13 2414 11.44 9.5 8.6 9.9 8.8 11.2
13a 25502 91.1 104.1 92.7 118.6
14 2243 10.91 8.9 8.0 9.2 8.2 10.4
14a 25311 90.4 103.3 92.0 117.7
15 3282 17.23 13.4 11.7 13.4 11.9 15.3
15a 24445 87.3 99.8 88.9 113.7
16 2206 11.44 9 7.9 9.0 8.0 10.3
16a 24385 87.1 99.5 88.7 113.4
17 1622 7.21 6.2 5.8 6.6 5.9 7.5
17a 26193 93.5 106.9 95.2 121.8
18 2873 15.09 10.9 10.3 11.7 10.4 13.4
18a 26270 93.8 107.2 95.5 122.2
19 3023 15.49 11.5 10.8 12.3 11.0 14.1
19a 26215 93.6 107.0 95.3 121.9
20 2960 15.09 10.8 10.6 12.1 10.8 13.8
20a 27382 97.8 111.8 99.6 127.4
a = liquor sample
Chocolate samples 1,2,3,4, 5 and 9 were not made from pure cocoa liquors

SOP Measurement of Total Alkaloids in Foods Containing Cocoa and Chocolate, Version 1.0
62 of 74
STANDARD OPERATING PROCEDURE (SOP) 003 APPENDIX 7 THE DETERMINATION OF THEOBROMINE AND CAFFEINE IN COCOA AND CHOCOLATE PRODUCTS BY HIGH PERFORMANCE LIQUID CHROMATOGRAPHY Version 1.0, December 2010 Prepared by Alan Richards, Durham Scientific Services (Durham County Council) and Brian Wailes, Durham Scientific Services (Durham County Council) Date November 2010 Approved by Authenticity Methodology Working Group (AMWG) Date 5 August 2011

SOP Measurement of Total Alkaloids in Foods Containing Cocoa and Chocolate, Version 1.0
63 of 74
CONTENTS Paragraph Page
1. Background ……………........................…………………………………….........63 2. Purpose ………………………………….......................…………………............63 3. Scope …………………………………………………….......................…............63 4. Principle of the method…………………………………………………….............63 5. Health and Safety …………………………….......................……………...........63 6. Reagents …………………………………………………….................................64 7. Apparatus ……………………………………………………................................66 8. Procedure ……………………………………………………................................67 9. Calculation …………………………………………………..................................68 10. Expression of Results ……………………………………..................................68 11. Interpretation ………………………………………………..................................68 12. Disposal ……………………………………………………..................................68 13. References ………………………………………………….................................69 14. Analytical Quality Assurance ……………………………...................................69 15. Internal Quality Control ...................................................................................69
SOP Appendix 1 ………………………………………………….........................71

SOP Measurement of Total Alkaloids in Foods Containing Cocoa and Chocolate, Version 1.0
64 of 74
THE DETERMINATION OF THEOBROMINE AND CAFFEINE IN DRY FAT FREE
COCOA AND CHOCOLATE PRODUCTS BY HIGH PERFORMANCE LIQUID CHROMATOGRAPHY
1. BACKGROUND Regulations are in force across Europe specifying minimum amounts of cocoa in a range of
products with reserved descriptions. The alkaloids theobromine and caffeine are naturally present in cocoa. Cocoa content of food has been measured over the last 50 years using a conversion factor calculated from analysis of alkaloids in genuine cocoa samples. Changes in production methods and climate may have resulted in significant changes in alkaloid levels in cocoa. The standard operating procedure was produced as part of FSA project Q01122. An updated conversion factor was calculated from 191 samples of cocoa liquor, analysed using the method provided in this protocol.
2. PURPOSE
There is a need to produce a method that can measure theobromine and caffeine levels quickly and accurately in a wide range of cocoa samples.
3. SCOPE
This method describes a procedure for the determination of caffeine and theobromine in chocolate and chocolate products including drinking chocolate, milk chocolate, plain chocolate, chocolate cake. A simple and rapid procedure for extraction of alkaloids and analysis by HPLC is described.
A separate method is available for the measurement of cocoa butter equivalents in milk
chocolate, which is necessary for the calculation of total cocoa solids in milk chocolate products.
4. PRINCIPLE OF THE METHOD
The alkaloids are extracted from cocoa and chocolate products with dilute acid. After
clarification and filtration the alkaloids in the solution are determined by HPLC. The following additives, which may interfere with the analysis of theobromine or caffeine if present in the food, are also extracted: saccharin, benzoic acid, aspartame, acesulfame K, quinine sulphate, sorbic acid, vanillin, ethyl vanillin and 3 parabens.
5. HEALTH & SAFETY
5.1 EYE PROTECTION SHOULD NORMALLY BE WORN AT ALL TIMES.
5.2 METHANOL IS HIGHLY FLAMMABLE AND TOXIC BY INHALATION OR IF SWALLOWED. KEEP CONTAINER TIGHTLY CLOSED. AVOID CONTACT WITH SKIN. KEEP AWAY FROM SOURCES OF IGNITION. USE ONLY IN A DESIGNATED FLAME FREE AREA.

SOP Measurement of Total Alkaloids in Foods Containing Cocoa and Chocolate, Version 1.0
65 of 74
5.3 ACETONITRILE IS HIGHLY FLAMMABLE AND TOXIC BY INHALATION, IN CONTACT WITH SKIN AND IF SWALLOWED. KEEP AWAY FROM SOURCES OF IGNITION. TAKE OFF IMMEDIATELY ANY CONTAMINATED CLOTHING. IF YOU FEEL UNWELL, SEEK MEDICAL ADVICE. USE ONLY IN A DESIGNATED FLAME FREE AREA.
5.4 CAFFEINE IS TOXIC IF SWALLOWED. AVOID CONTACT WITH SKIN AND EYES.
IF YOU FEEL UNWELL, SEEK MEDICAL ADVICE. 6. REAGENTS
6.1 Analytical Reagent (AR) grade reagents are suitable unless otherwise stated.
6.2 Water should be deionised, distilled or of similar quality.
6.3 Acetic acid, glacial.
6.4 Acetonitrile, HPLC grade. Degas and filter through a 0.45 µm organic filter. (Mobile
phase A for HPLC).
6.5 Caffeine.
6.6 Hydrochloric acid, 11mol/L
6.7 Methanol, HPLC grade.
6.8 Potassium ferrocyanide trihydrate.
6.9 Sodium dihydrogen orthophosphate.
6.10 Sodium hydroxide.
6.11 Theobromine.
6.12 Zinc acetate dihydrate.
6.13 Sodium hydroxide, 0.1mol/L. Weigh 4.0g of sodium hydroxide (5.10) and dissolve in water, allow to cool and dilute to 1 litre.
6.14 Phosphate buffer. Accurately weigh 3.12g of sodium dihydrogen orthophosphate
(6.9) and make up to 1 litre with water in a volumetric flask. Adjust to pH 5.0 with 0.1mol/L sodium hydroxide (6.13). Filter through a 0.45 µm filter (7.4). (Mobile phase B for HPLC).
6.15 Hydrochloric acid, 0.5mol/L. Add 44.5mL of hydrochloric acid (6.6) to water and
dilute to 1 litre in a volumetric flask.
6.16 Stock standard caffeine 1000mg/L. Weigh 0.5g, accurate to 0.001g, of caffeine (6.5). Transfer quantitatively into a 500mL volumetric flask with water. Dissolve in water, dilute to volume with water and mix by inversion 6 times.

SOP Measurement of Total Alkaloids in Foods Containing Cocoa and Chocolate, Version 1.0
66 of 74
6.17 Stock standard theobromine 500mg/L. Weigh 0.25g, accurate to 0.001g, of theobromine (6.11) into a 400mL beaker, dissolve in boiling water, cool and transfer quantitatively into a 500mL volumetric flask with water and mix by inversion 6 times.
6.18 Working standard solutions
Using pipettes measure 1.0, 2.5, 5.0 and 10.0mL of caffeine stock standard and 2, 5,
10 and 20mL of theobromine stock standard into a 100mL volumetric flask, dilute to volume with water and mix by inversion 3 times. This gives working standard solutions of concentrations 10, 25, 50 and 100mg/L of each additive. Working standard solutions should be prepared fresh on the day of use.
6.19 Stock standard control solutions
STANDARD MATERIAL USED TO PREPARE STANDARD CONTROL SOLUTIONS
MUST BE FROM A DIFFERENT COMMERCIAL SOURCE TO THOSE USED TO PREPARE STANDARD CALIBRATION SOLUTIONS.
6.19.1 Caffeine 10,000mg/L
Weigh 0.5g accurate to 0.001g of caffeine. Transfer quantitatively to a
50mL volumetric flask with 20mL of methanol and dissolve. Dilute to volume with water and mix by inversion 6 times.
6.19.2 Theobromine 10,000mg/L
Weigh 0.5g accurate to 0.001g of theobromine. Transfer quantitatively to a 50mL volumetric flask with 20mL of methanol and dissolve. Dilute to volume with water and mix by inversion 6 times. The shelf life of these solutions is 3 months when stored at 5°C.
6.20 Working standard control solution
Using a pipette, measure 2.5mL of each stock standard control solution into a 250mL volumetric flask, dilute to volume with water and mix by inversion 6 times. This gives a mixed, working standard control solution containing 100mg/L of each alkaloid. The working standard control solution should be prepared fresh on the day of use.
6.21 Clearing reagents 1 and 2
1. Dissolve 21.9g, accurate to 0.1g, zinc acetate dihydrate (6.12) in water containing
3g of acetic acid (6.3) and make up to 100mL with water.
2. Dissolve 10.6g, accurate to 0.1g, potassium ferrocyanide trihydrate (6.8) in water and make up to 100mL with water.

SOP Measurement of Total Alkaloids in Foods Containing Cocoa and Chocolate, Version 1.0
67 of 74
7. APPARATUS
7.1. Normal laboratory glassware and apparatus.
7.2. Analytical balance of appropriate accuracy as specified.
7.3. 0.45µm disposable syringe filters or 0.45µm sample filter kit (Millipore or equivalent).
7.4. Solvent filter system with 0.45µm membrane filters.
7.5. Ultrasonic bath.
7.6. High Performance Liquid Chromatography (HPLC) system ideally with Diode Array Detector and integrating device which allows the measurement of peak heights or areas.
7.7. Glass microfibre filters, at least 1.6 µm (GFA or equivalent).
7.8. HPLC Chromatographic column such as Merck Lichrocart Purospher RP-18e, 5µm,
250 x 4mm, fitted with a Purospher RP-18e, 5µm 4 x 4mm guard column. Equivalent columns may be used provided they give satisfactory resolutions.
7.8.1. The following HPLC conditions have been found to be suitable. The
conditions can be modified if necessary to achieve suitable resolution of the additives and flavourings of interest.
Mobile phase A (6.4), Mobile phase B (6.14)
Gradient time (min)
Mobile Phase A (%)
Mobile Phase B (%)
0 8.0 92.0 5.00 10.0 90.0 22.50 19.3 80.7 30.00 21.5 78.5 35.00 45.0 55.0 40.00 45.0 55.0 40.01 8.0 92.0 45.00 8.0 92.0
Flow rate: 1.0mL/min Injection volume: 5µL Column Temperature: 40°C Detector Wavelengths: 205nm for theobromine, saccharin, benzoic acid, caffeine
and aspartame 231nm for acesulfame K and quinine sulphate 256nm for sorbic acid and parabens It is suggested that to help maintain column efficiency, it is flushed with a mixture of
water and acetonitrile (about 50:50) for about 30 minutes prior to instrument shutdown. Column performance will be maintained through use of a guard column.

SOP Measurement of Total Alkaloids in Foods Containing Cocoa and Chocolate, Version 1.0
68 of 74
8. PROCEDURE
8.1. Chocolate and chocolate products grate, melt or blend if necessary.
8.1.1. Weigh about 1g, accurate to 0.001g, of dark chocolate, 2 - 3g of milk chocolate or 3g cake into a 100mL beaker.
8.1.2. Add 25mL of water and 2mL of 0.5mol/L hydrochloric acid (6.15) and mix by
inversion 3 times.
8.1.3. Bring to the boil on a hotplate and then transfer the beaker to a boiling water bath for 15 minutes.
8.1.4. Transfer the solution to a 50mL volumetric flask and allow to cool.
8.1.5. Add 1mL of each clearing reagent (6.21), make to volume with water and mix
by inversion 3 times.
8.1.6. Allow the solution to stand for about 30 minutes and then filter through a filter paper (7.7), rejecting the first 5mL and then through a syringe filter (7.3) for HPLC analysis. The filtration rate depends upon the amount of precipitated solids present. Solutions are stable for at least 24 hours.
8.2. Chromatography
Setup the HPLC system (7.6) according to the manufacturer‟s instructions. The instrument must be fitted with a suitable column (7.8). The operating conditions must be adjusted so as to achieve sufficient separation of the additives of interest to enable identification. Typical chromatographic separations are shown in Appendix 1.
8.3. Inject a suitable volume e.g. 5µL of the test solution and run the chromatographic
separation. 8.4. Determine the peak areas (by electronic integration) at the appropriate wavelength (see
7.8.1). If a diode array detector is not available then separate runs at each wavelength may be required.
8.5. Preparation of calibration curve.
8.5.1. Successively analyse each working standard solution (6.18) according to steps 8.3 - 8.4.
8.5.2. Plot a calibration curve of analyte concentration against peak area for each
analyte of interest.
8.5.3. When fresh stock standards are prepared a new calibration curve is analysed.
8.6. Calibration check.

SOP Measurement of Total Alkaloids in Foods Containing Cocoa and Chocolate, Version 1.0
69 of 74
8.6.1. Provided that the calibration curve is linear and the HPLC conditions remain ostensibly unaltered, a single working standard solution of each analyte may be used to check the calibration curve.
8.6.2. Analyse working standard 50mg/L according to steps 8.3 – 8.4. Carry out a
duplicate injection of the working standard solution.
8.6.3. The calibration check standard is deemed satisfactory if the mean
concentration is within ±5% of the expected value (i.e. 50mg/L) when extrapolated from the stored calibration graph.
8.6.4. If the calibration check standard meets the requirements then the stored
calibration graph may be used to calculate the analyte concentration. Otherwise a fresh stock standard must be prepared.
9. CALCULATION
9.1. If a calibration curve is used, determine the concentration (C) of each analyte in the test solution directly from the calibration graph.
9.2. If a diode array detector is available, the identity of sample peaks can be confirmed if
necessary.
9.3. The concentration of each analyte in the sample, expressed in mg/L or mg/kg, may be calculated according to the following formula:
Analyte in the sample (mg/L or mg/kg) = C x V m Where C = concentration in mg/L of the analyte component from the graph V = final volume, in mL of test solution m = mass (or volume), in g (or mL) of test portion taken for analysis 10. EXPRESSION OF RESULTS Record the identity of the analyte and its concentration, expressed as mg/L or mg/kg as
appropriate, to the nearest 1mg/kg or 1mg/L. 11. INTERPRETATION The amount of fat free dry cocoa in chocolate products may be calculated from the
theobromine content according to the following formula. Fat free dry cocoa (g/100g) = theobromine (g/100g) x 40.7 12. DISPOSAL

SOP Measurement of Total Alkaloids in Foods Containing Cocoa and Chocolate, Version 1.0
70 of 74
No specific problems. 13. REFERENCES
Validated Enforcement Method VEMS 0358 – Determination of additives and flavourings in food by HPLC, APA Publication for internal use IRRM Report Detection and Quantification of Cocoa Butter Equivalents in Milk chocolate, EUR 22666 EN, M. Buchgrabber, S. Androni 31
14. ANALYTICAL QUALITY ASSURANCE
14.1. Performance Characteristics
14.1.1. L.O.D liquids direct or solid foods* Theobromine 0.5mg/L 25mg/kg Caffeine 0.5mg/L 10mg/kg *Assuming 1g diluted to 50mL for theobromine (8.3.1)
14.1.2. Bias Recovery Recovery Mean Standard Deviation Foods Drinks Foods Drinks Theobromine 99.2% - 2.8% - Caffeine - 104.3% - 3.3% Theobromine spiked at a level of 50mg/L in chocolate)
14.1.3. Precision Absolute difference Standard Deviation
Foods Drinks (mg/kg) (mg/L) Theobromine 31.6 - (10 samples in the range 823 to 3117) Caffeine - 1.2 (14 samples in the range 12 to 91) 15. Internal Quality Control
15.1. Instrument Calibration :Refer to instrument manual. 15.2. Blank determination :Take an appropriate blank through the
procedure.
15.3. Standard Control :Each batch of samples should include analysis of an in-house standard control material.

SOP Measurement of Total Alkaloids in Foods Containing Cocoa and Chocolate, Version 1.0
71 of 74
Repeatability Check: At least every tenth sample should be analysed in
duplicate and the difference between the results should conform to the performance characteristics in the laboratory.

SOP Measurement of Total Alkaloids in Foods Containing Cocoa and Chocolate, Version 1.0
72 of 74
min5 10 15 20 25 30 35 40
mAU
0
100
200
300
400
DAD1 A, Sig=205,12 Ref=450,100 (L:\2\DATA\0358\BW081103.D)
T
heo
bro
min
e
S
ac
ch
arin
T
heo
ph
yllin
e
B
en
zo
ic
A
cid
C
affe
in
e
A
sp
arta
me
M
eth
yl P
ara
be
n
E
th
yl P
ara
rb
en
P
ro
pyl P
arab
en
DAD1 B, Sig=231,12 Ref=450,100 (L:\2\DATA\0358\BW081103.D) A
ce
su
lfam
e K
V
an
illin
E
th
yl V
an
illin
Q
uin
in
e S
ulp
ha
te
DAD1 C, Sig=256,20 Ref=450,100 (L:\2\DATA\0358\BW081103.D)
S
orb
ic
A
cid
SOP Appendix 1

SOP Measurement of Total Alkaloids in Foods Containing Cocoa and Chocolate, Version 1.0
73 of 74
APPENDIX 8 Detection and Quantification of Cocoa Butter Equivalents in Milk Chocolate Milk chocolate is permitted to contain small amounts of fat other than cocoa butter. A method has been validated and published by Dr Manuela Buchgraber31, [email protected] in 2007 working at Institute of Reference Materials and Measurements in Geel, Belgium. The SOP was published and presented by Manuela at meeting at LGC workshop. The basis of the method is a simple solvent extraction to remove triglycerides which are analysed by capillary gas chromatography. The results are entered into a custom spreadsheet and the presence of non-cocoa triglycerides are identified and quantified. Manuela was happy to supply enforcement laboratories with copies of the SOP and spreadsheet.

SOP Measurement of Total Alkaloids in Foods Containing Cocoa and Chocolate, Version 1.0
74 of 74
APPENDIX 9 Table 6 Total Nitrogen measurement in Cocoa Liquor
Sample Lab Ref
Total N (%)
Theobromine from tot N (%)
Theobromine found (%)
20090631 2.164 6.962 1.2147
20090638 2.251 7.242 1.3132
20090780 2.081 6.694 0.8374
20090800 2.343 7.540 1.1669
20091327 2.067 6.651 1.0359
20091327 2.049 6.592
20091328 2.199 7.077 1.1149
20100079 2.211 7.113 1.1246
20100080 2.291 7.371 1.2706
20100081 2.305 7.417 1.1498
20100085 2.163 6.961 0.9507
20100093 2.333 7.508 1.0581
20100252 2.347 7.551 1.3697
20100254 2.160 6.949 1.0779
20100255 2.074 6.673 0.9416
20100255 2.064 6.642
20100256 2.187 7.037 0.9002
20100265 2.301 7.404 1.1759
20100959 2.281 7.338 1.0599
20100972 2.154 6.931 1.1917
NIST2384 2.119 6.818
20101818 2.322 7.470 1.0892
20101822 2.246 7.226 1.1575
20101834 2.151 6.920 0.9664
20101842 2.324 7.476 1.1998
20101844 2.186 7.032 1.0963
20101845 2.174 6.994 1.1071
Analysis was carried out on samples of cocoa liquor for total nitrogen using the Kjeldahl method, modified to use with a hot block digestion unit. The shaded results are duplicate analyses.


