Measuring party orientations towards European integration:Results from an expert survey
LEONARD RAYPolitical Science Department, Binghamton University, New York, USA
Abstract. Some observers have held that political parties have been minor players in theprocess of European integration due to the low salience of the issue and the prevalence ofintra party disagreement over European questions. Although recent scholarship and the risingsalience of European issues have brought increased attention to the role of political parties,the study of the relationship between party positions and both public opinion and policy out-comes has been hampered by an absence of comparable data on party positions. This researchnote presents the findings of an expert survey on party positions on the issue of Europeanintegration. In addition to estimates of the parties’ positions on the issue itself, this surveyprovides information on the importance of the issue of European integration to each party,and the extent of internal dissent within parties. The data also indicate that parties have, onaverage, become increasingly pro-European over the period 1984–1996. Both the salience ofthe issue of integration and the extent of intra-party disagreement have increased during thisperiod. However, deep intra-party divisions appear less prevalent than commonly believed.
Introduction
Political parties are important actors in the process of European integration.In addition to their role as actors within supranational institutions, politicalparties play an important role in linking the European Union to the citizensof Europe. While information about the preferences of parties is importantfor understanding the development of the EU, further information about theimportance of European issues to parties, and the internal divisions withinparties is needed to understand whether parties can effectively provide abridge between European citizens and European institutions. The democraticdeficit of the EU has been blamed in part on the unwillingness of politicalparties to stress the issue of European integration because of their internaldivisions on the issue. Any systematic study of these topics requires compar-able cross national data on the positions taken by political parties on Europeanintegration.
284 LEONARD RAY
Data on party positions on the EU is also important for the analysis of anumber of theoretical questions central to the discipline of political science.Such data have been usefully applied to the analysis of coalition formation inmultiparty systems (see Laver & Hunt 1992), although the issue of Europeanintegration has generally not been included in such analyses. The conditionsunder which parties may influence the opinions of their electorates can also beaddressed with these data (Ray 1997). One can even analyze the direction ofinfluence between parties and electorates to determine whether parties leador follow public opinion (Ray 1997; Steenbergen & Scott 1997). Furtherresearch could address the nature of intergovernmental bargaining, and therole of the media in agenda setting.
This research note describes and presents a comprehensive dataset on theorientations of Western European political parties towards European integra-tion from 1984 to 1996. This dataset contains estimates of three aspects of aparty’s position on the issue of integration. These are the general orientationof the party (whether it is pro or anti EU), the importance of European issuesfor the party, and the degree to which parties are internally divided on theissue.
Measuring party positions
Michael Laver & Ben Hunt (1992) discuss three possible methods for deter-mining the issue positions of political parties. The first method is the analysisof party documents, the second is the use of mass public opinion surveys, andthe third is the use of expert judgments. Each of these methods has distinctiveadvantages and disadvantages.
The analysis of party documents (generally electoral manifestos) has theadvantage of relying directly on the parties themselves for information aboutparty positions. Manifesto texts reflect the positions which a party has goneon record as holding. While manifestos are an invaluable source of inform-ation about party preferences and priorities, turning a party manifesto intoa set of data points is a tricky process. To the extent that quantitative con-tent analysis depends upon the evaluations of individual readers it may stillbe a somewhat subjective and contextual exercise. The content analysis ofmanifestos requires the elaboration of a strict coding scheme if the resultsare to be reasonably replicable across coders. Such a method can reducedifficulties arising from the subjective reading of texts.1 Content analysisalso restricts the universe of parties which can be studied. Manifestos maynot be available for all political parties, resulting in the exclusion of some(often smaller) parties from the dataset.2 In addition, some parties, for whichmanifestos are available, do not mention the issue of European integration in
MEASURING PARTY ORIENTATIONS TOWARDS EUROPEAN INTEGRATION 285
their manifestos. This may be due to the low salience of the issue for thatparty, or to the absence of a clear party position on the issue, or to deepinternal divisions over the issue. The manifestos themselves do not permit adetermination of which, if any, of these interpretations applies. The questionof internal dissent is particularly relevant to the issue of European integration,and here the manifestos are totally mute.
Mass survey research allows for an alternate method of determining partypositions. Survey data can be used to measure the positions of parties them-selves, or of their electorates. If a survey asks respondents to placethemselveson an ideological or policy preference scale, then the mean position of aparty’s electorate can be determined. The position of the party leadershipmust then be inferred from the aggregate position of the party’s electorate.This technique was employed by Hix & Lord (1997) in their discussion ofparty positions on integration. In some cases, survey data can be used todetermine the perceived position of the party leadership itself rather thanthe electorate. This distinction is crucial if the data are then to be used tocompare electorate opinion with party positions. Unfortunately, very fewcross-national surveys ask about party positions on issues. One Eurobaro-meter survey, Eurobarometer 30, did ask respondents in each EU membernation to evaluate the positions of the political parties of their nation. The po-sitions of party electorates are generally, but not always, related to perceivedpositions of parties (see Van der Eijk & Franklin 1991). This survey is there-fore an excellent source of data on the public perception of party positions,but only for 1988.
The third method of determining a party’s ideological or issue positions isthe use of expert judgments.3 Expert evaluations allow for the inclusion of allparties in a political system whether they have published manifestos or not.Unlike public opinion surveys, expert surveys are non random, and rarelyinvolve over a few hundred experts. The logistical costs are thus relativelylow. Expert judgments have been used to place political parties on a left/rightideological scale (Castles & Mair 1984; Huber & Inglehart 1995) as well asto place parties on a number of different policy scales (Laver & Hunt 1992;Laver 1994, 1995, 1998a,b). Unfortunately, expert judgements on party pos-itions on European integration are available for very few nations. These arethe Netherlands (Laver 1995), France (Laver & Hunt 1992), Ireland (Laver1994, 1998b) and the United Kingdom (Laver 1998a).
The expert survey
In order to obtain comparable cross-national data on the positions of partieson the issue of European integration, I conducted a new expert survey. This
286 LEONARD RAY
survey was intended to measure three aspects of the position taken by allmajor and minor parties in the EU and EFTA. Respondents were asked toevaluate the position taken by each party on the issue of European integration,the importance of the issue to each party, and the extent of internal dissentwithin each party. In order to track shifts in party positions as the nature of theEuropean Union has evolved, the experts were asked to provide evaluationsof each party at four points in time, 1984, 1988, 1992, and 1996. The text ofthe survey questionnaire is reproduced in the appendix to this note.
The ‘experts’ whose opinions were canvassed were indigenous profes-sional political scientists in the 18 nations targeted. The ECPR handbook ofpolitical scientists in Europe was used to identify survey recipients. Individu-als were chosen if they specialized in either the domestic political system oftheir nation, or European politics. In order to ensure a reasonable number ofresponses from each nation, this list of ‘experts’ was supplemented by non-indigenous political scientists with expertise on a given nation as indicatedby the ECPR handbook, or by a literature review of recent works on nationalparty systems; 258 experts were identified through this procedure. (Unfortu-nately, no experts could be identified for Iceland, and this nation was droppedfrom the study.)
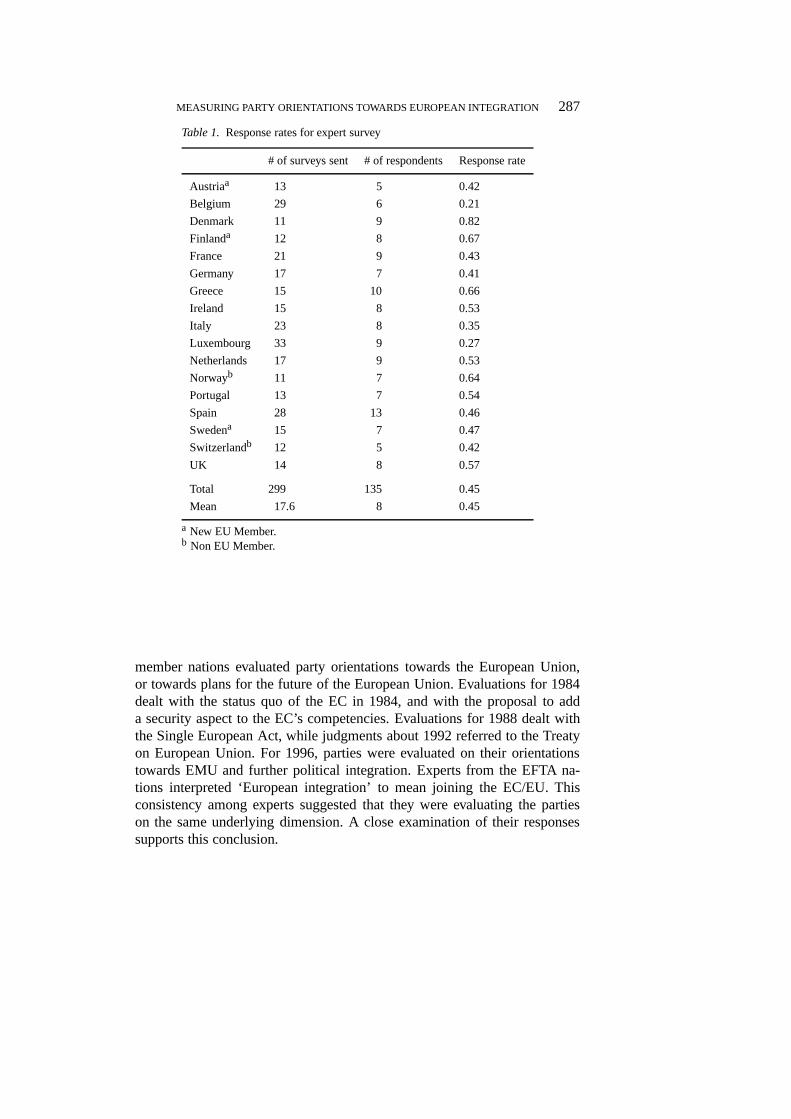
Of the 258 questionnaires that were mailed out 160 were returned, ofwhich 33 forms were returned blank. Most of these blank forms were returnedby individuals who indicated that they felt unqualified to accurately completethe questionnaire. Over half of these respondents suggested alternate expertsand 22 additional questionnaires were then sent out to those experts sugges-ted by individuals in the original sample. Given the low response rate forLuxembourg, the definition of ‘expert’ was expanded somewhat, and anotherround of questionnaires were sent to 19 newspaper editors, leaders of politicalparties, and members of the European parliament from Luxembourg. In all,299 surveys were sent out, and 135 usable responses were received, for anoverall response rate of 45 percent. This is a rather high response rate for anexpert survey, and may reflect the brevity of the questionnaire. The responserates for each nation are presented in Table 1. Following the precedent ofLaver and Hunt (1992: 37) and Huber and Inglehart (1995: 76) a minimumthreshold of 5 responses per nation was set for the inclusion of any nation inthe resulting dataset. All of the nations surveyed met this threshold and themean number of respondents per nation was 8.
The exact meaning of ‘European integration’ does vary over time andacross national political contexts. I had deliberately left the interpretation of‘European integration’ up to the experts themselves. Several experts wrote into explain exactly what they had interpreted ‘European integration’ to mean inthe context of their national political system. In general, the experts from EU
MEASURING PARTY ORIENTATIONS TOWARDS EUROPEAN INTEGRATION 287
Table 1. Response rates for expert survey
# of surveys sent # of respondents Response rate
Austriaa 13 5 0.42
Belgium 29 6 0.21
Denmark 11 9 0.82
Finlanda 12 8 0.67
France 21 9 0.43
Germany 17 7 0.41
Greece 15 10 0.66
Ireland 15 8 0.53
Italy 23 8 0.35
Luxembourg 33 9 0.27
Netherlands 17 9 0.53
Norwayb 11 7 0.64
Portugal 13 7 0.54
Spain 28 13 0.46
Swedena 15 7 0.47
Switzerlandb 12 5 0.42
UK 14 8 0.57
Total 299 135 0.45
Mean 17.6 8 0.45
a New EU Member.b Non EU Member.
member nations evaluated party orientations towards the European Union,or towards plans for the future of the European Union. Evaluations for 1984dealt with the status quo of the EC in 1984, and with the proposal to adda security aspect to the EC’s competencies. Evaluations for 1988 dealt withthe Single European Act, while judgments about 1992 referred to the Treatyon European Union. For 1996, parties were evaluated on their orientationstowards EMU and further political integration. Experts from the EFTA na-tions interpreted ‘European integration’ to mean joining the EC/EU. Thisconsistency among experts suggested that they were evaluating the partieson the same underlying dimension. A close examination of their responsessupports this conclusion.
288 LEONARD RAY
Reliability and validity
The evaluations of the experts were averaged to produce estimates of polit-ical parties’ positions on the issue of European unification. The reliabilityand validity of these data had to be determined in order to evaluate theirusefulness.4 Reliability refers to the degree to which the data systematicallymeasure some single underlying factor. Validity refers to the degree to whichthis factor corresponds to the theoretical concept in question, in this case partypositions on European integration.
The internal consistency of the expert judgements was used as a roughindicator of their reliability. In order to assess the internal consistency of thedata, I examined the responses in two ways. First, I analyzed the responses ofindividual experts in order to determine whether any individual experts weredeviating excessively from the overall consensus for their nation and if so,whether they exerted a substantial influence over the estimates. A second testwas to examine the standard deviations of the expert judgements as a measureof the extent of agreement among experts.
One way to measure the internal consistency and robustness of the data isto identify experts providing deviant evaluations of parties, and determinetheir impact, if any, on the final estimates of party positions. In order toidentify ‘deviant’ experts, I calculated the absolute difference between eachexpert’s judgment for a specific party and the overall mean of the expert judg-ments for that party. The overall mean on this difference measure was 0.66 forjudgments of party positions (on a 7 point scale), 0.56 for judgments about theimportance of European integration to a party (on a 5 point scale), and 0.47for evaluations of the extent of internal dissent (on a 5 point scale). Theseresults indicate significant consistency in the evaluations of most experts.
A careful analysis of the responses of individual experts revealed a fewanomalous respondents. Of course, there is no objective standard which dic-tates when a respondent deviated ‘substantially’ from the mean judgement. Idecided that any expert who was on average more than one point off of themean would be considered ‘suspect’.5 Applying this rule of thumb, 7 expertsprovided ‘suspect’ evaluations of party positions, and 5 experts provided‘suspect’ judgements of the importance of the issue. In order to check forthe possibility that these outlying experts may have biased the results ofthe survey, I recalculated the estimates of party positions with these expertsincluded and with them excluded. Of 2,031 estimates, only 38 (2%) wereaffected substantially by the inclusion of these experts.6 The estimates mostaffected by these ‘anomalous’ experts were the estimates for Swiss partiesin 1984, for Finnish parties in 1984 and 1988, and for tiny Portuguese rightand left wing parties. Those few estimates which may have been biased by
MEASURING PARTY ORIENTATIONS TOWARDS EUROPEAN INTEGRATION 289
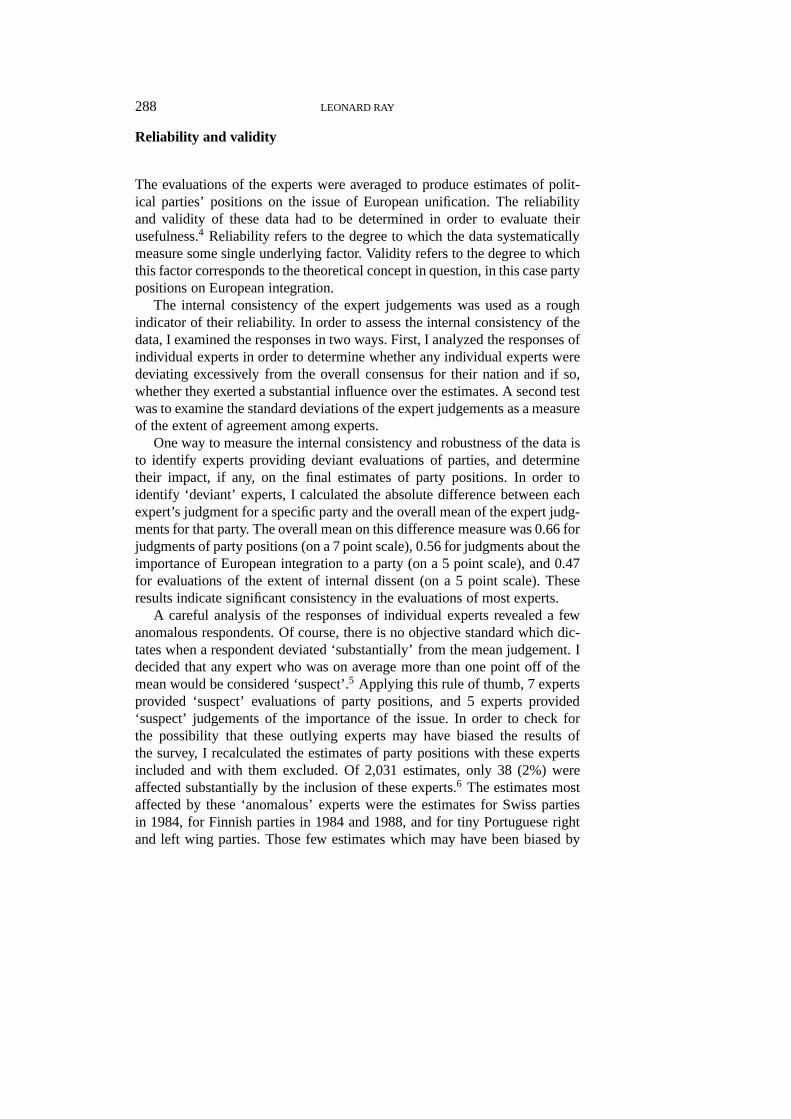
Table 2. Mean standard deviations of expert evaluations for each time period
Mean standard deviation of expert judgements
Type of judgement 1984 1988 1992 1996
Party position on integration 0.97 0.90 0.82 0.82
Salience of issue 0.75 0.75 0.69 0.70
Internal dissent 0.58 0.56 0.59 0.60
the inclusion of ‘anomalous’ respondents are clearly marked in the Appendixtables.
The analysis of standard deviations of each estimate allows for a roughindicator of the extent of agreement among experts. The mean standarddeviation of expert judgements in the present study ranged from 0.56 to0.97 depending upon the judgement in question. These standard deviationsare reported in Table 2. Since the present study used five and seven pointscales rather than ten point scales, the standard deviations, while lower inabsolute terms than those reported by Huber and Inglehart, actually indicateroughly comparable levels of agreement among experts.7 The consistency ofthe experts is also comparable to that reported by Laver and Hunt.8
In order to study shifts in party positions, experts were asked to evaluateparties at four different time points. One concern in the creation of the ques-tionnaire was the ability of respondents to evaluate parties’past positionson the issue. If these recalled judgments are less reliable than contemporaryjudgments, then we would expect the standard deviations of expert judgmentsto be larger for the earlier time periods. As Table 2 indicates, there is a slightdecrease in standard deviations over time for evaluations of party positionsand estimates of issue importance. For evaluations of internal dissent, thestandard deviations display no trend. The small magnitude of the differencesin standard deviations suggest that the recalled estimates for the 1980s areonly slightly less reliable than those for the 1990s.
The data produced by the expert survey do appear to be reliable measures.Whether they are actually measuring party positions on the issue of Europeanintegration turns on the question of their validity. The validity of an indicatoris the degree to which the indicator actually measures the intended concept.The simplest test of validity is the inspection of the data for ‘face validity’.The results do correspond to conventional wisdom about the positions ofvarious parties. However, face validity is a rather unsatisfactory criterion forthe evaluation of a dataset. A more rigorous test of the validity of these data
290 LEONARD RAY
requires a comparison with other quantitative indicators of party positions onEuropean integration.
Quantitative data on party positions in 1988 were available from two othersources. The other sources were the Eurobarometer survey mentioned earlier,and the Comparative Party Manifesto project.9 All three of these indicators ofparty position correlate highly. A principal components factor analysis wascarried out to demonstrate the degree of commonalty between these threeindicators. The factor analysis indicated that one underlying factor could ac-count for most of the variance in the three indicators. This factor accountedfor 91 percent of the variance in party positions as indicated by the expertsurvey. It also accounted for 87 percent of the variance in perceived party po-sitions (as indicated by respondents to Eurobarometer 30) and for 75 percentof the variance in party position as indicated from the Comparative ManifestoDataset.
This factor analysis indicates that all three of the indicators are validmeasures of party position on European integration. The differences in factorloadings do suggest that some of the measures capture the underlying variablebetter than others. The expert survey data appear to come closest to the un-derlying party positions (loading = 0.95). The Comparative Party Manifestodata are second in terms of validity (loading = 0.93), and the Eurobarometerdata third (loading 0.87).
The expert survey also asked respondents to evaluate the importance of theissue of integration to each of the parties. A test of the validity of this measureof issue salience is somewhat more difficult than the test of party positionsbecause only the manifesto dataset provides a roughly comparable indicatorof the importance of the issue to a party.10 The correlation between these twomeasures (0.25) is much lower than the correlation between measures of partyposition (0.80).
Unfortunately, a quantitative test of the validity of our measure of internalparty dissent is impossible. There are simply no other sources of quantitativedata on internal party dissent (on this issue) with which to compare the expertjudgements.
Some basic findings
One of the advantages of the data generated by this expert survey is thepossibility of comparing party positions over time. The remainder of thisresearch note will present some basic descriptive statistics on the evolutionof party orientations towards European integration from 1984 to 1996.
MEASURING PARTY ORIENTATIONS TOWARDS EUROPEAN INTEGRATION 291
Table 3. Distribution of parties by position on European integration 1984–1996
Position on European integration 1984 1988 1992 1996
Range Definition (in %) (in %) (in %) (in %)
1 to 1.5 Strongly opposed 10.9 12.4 12.1 11.2
1.5 to 2.5 Opposed 13.9 11.2 8.6 7.9
2.5 to 3.5 Somewhat opposed 14.5 13.0 11.5 11.8
3.5 to 4.5 Neutrality 13.3 10.1 9.8 11.2
4.5 to 5.5 Somewhat in favor 10.3 13.0 13.8 13.5
5.5 to 6.5 In favor 26.1 27.8 27.0 27.5
6.5 to 7 Strongly in favor 10.9 12.4 17.2 16.9
Table 4. Mean party position for each time period 1984–1996
1984 1988 1992 1996
All nations 4.23 4.34 4.57 4.64
EU 12 4.65 4.71 4.77 4.79
New 3 2.96 3.19 4.30 4.51
Non members 3.12 3.37 3.65 3.84
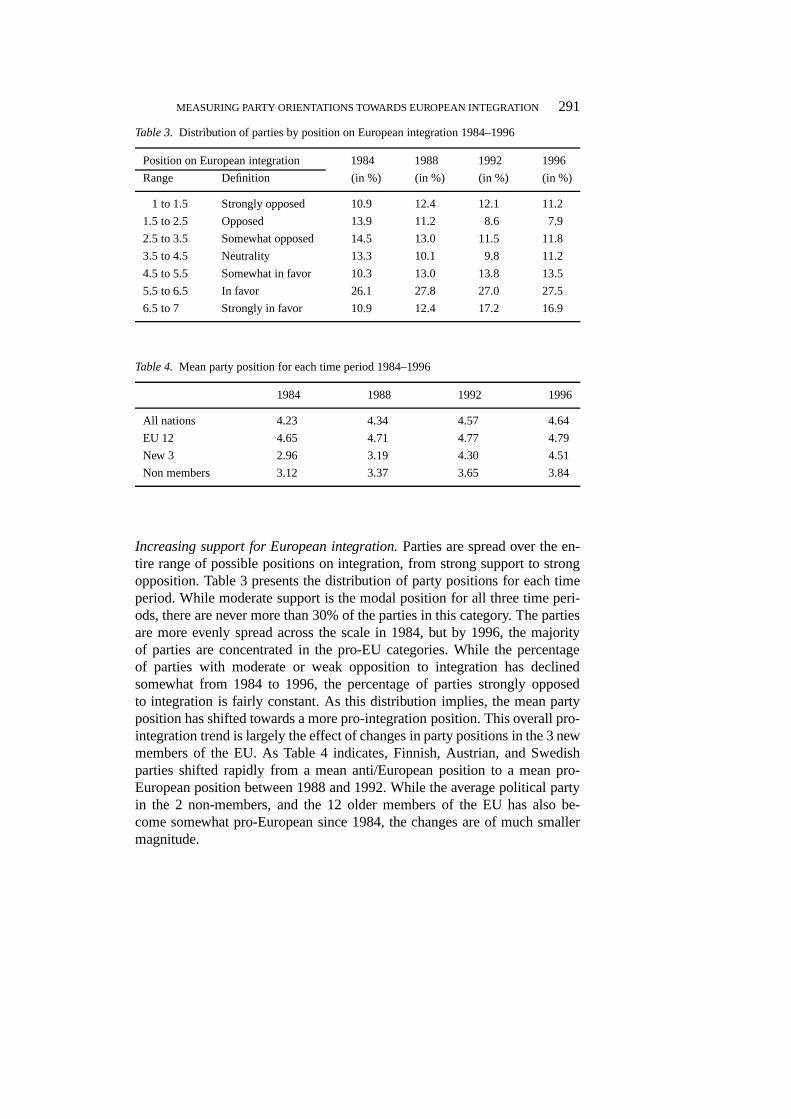
Increasing support for European integration.Parties are spread over the en-tire range of possible positions on integration, from strong support to strongopposition. Table 3 presents the distribution of party positions for each timeperiod. While moderate support is the modal position for all three time peri-ods, there are never more than 30% of the parties in this category. The partiesare more evenly spread across the scale in 1984, but by 1996, the majorityof parties are concentrated in the pro-EU categories. While the percentageof parties with moderate or weak opposition to integration has declinedsomewhat from 1984 to 1996, the percentage of parties strongly opposedto integration is fairly constant. As this distribution implies, the mean partyposition has shifted towards a more pro-integration position. This overall pro-integration trend is largely the effect of changes in party positions in the 3 newmembers of the EU. As Table 4 indicates, Finnish, Austrian, and Swedishparties shifted rapidly from a mean anti/European position to a mean pro-European position between 1988 and 1992. While the average political partyin the 2 non-members, and the 12 older members of the EU has also be-come somewhat pro-European since 1984, the changes are of much smallermagnitude.
292 LEONARD RAY
Table 5. Distribution of parties by importance of issue 1984–1996
Importance of issue of integration 1984 1988 1992 1996
Range Definition (in %) (in %) (in %) (in %)
1 to 1.5 Issue of no importance 5.5 2.4 0.0 0.0
1.5 to 2.5 A minor issue 36.4 28.4 17.2 17.4
2.5 to 3.5 An important issue 46.1 53.8 48.3 52.2
3.5 to 4.5 One of the most important issues 12.1 15.4 32.8 29.2
4.5 to 5 The most important issue 0.0 0.0 1.7 1.1
Table 6. Mean issue importance for parties in each time period 1984–1996
1984 1988 1992 1996
All nations 2.71 2.87 3.22 3.18
EU 12 2.95 3.01 3.12 3.14
New 3 1.92 2.40 3.69 3.51
Non members 2.10 2.51 3.30 3.06
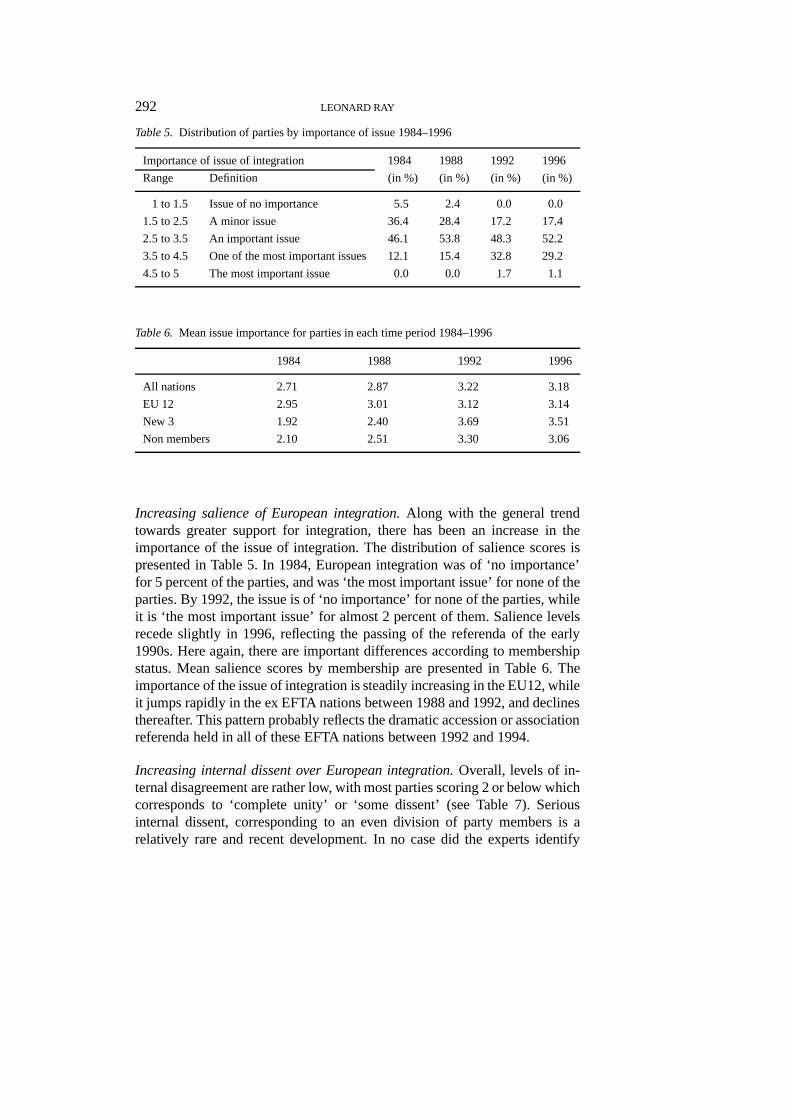
Increasing salience of European integration.Along with the general trendtowards greater support for integration, there has been an increase in theimportance of the issue of integration. The distribution of salience scores ispresented in Table 5. In 1984, European integration was of ‘no importance’for 5 percent of the parties, and was ‘the most important issue’ for none of theparties. By 1992, the issue is of ‘no importance’ for none of the parties, whileit is ‘the most important issue’ for almost 2 percent of them. Salience levelsrecede slightly in 1996, reflecting the passing of the referenda of the early1990s. Here again, there are important differences according to membershipstatus. Mean salience scores by membership are presented in Table 6. Theimportance of the issue of integration is steadily increasing in the EU12, whileit jumps rapidly in the ex EFTA nations between 1988 and 1992, and declinesthereafter. This pattern probably reflects the dramatic accession or associationreferenda held in all of these EFTA nations between 1992 and 1994.
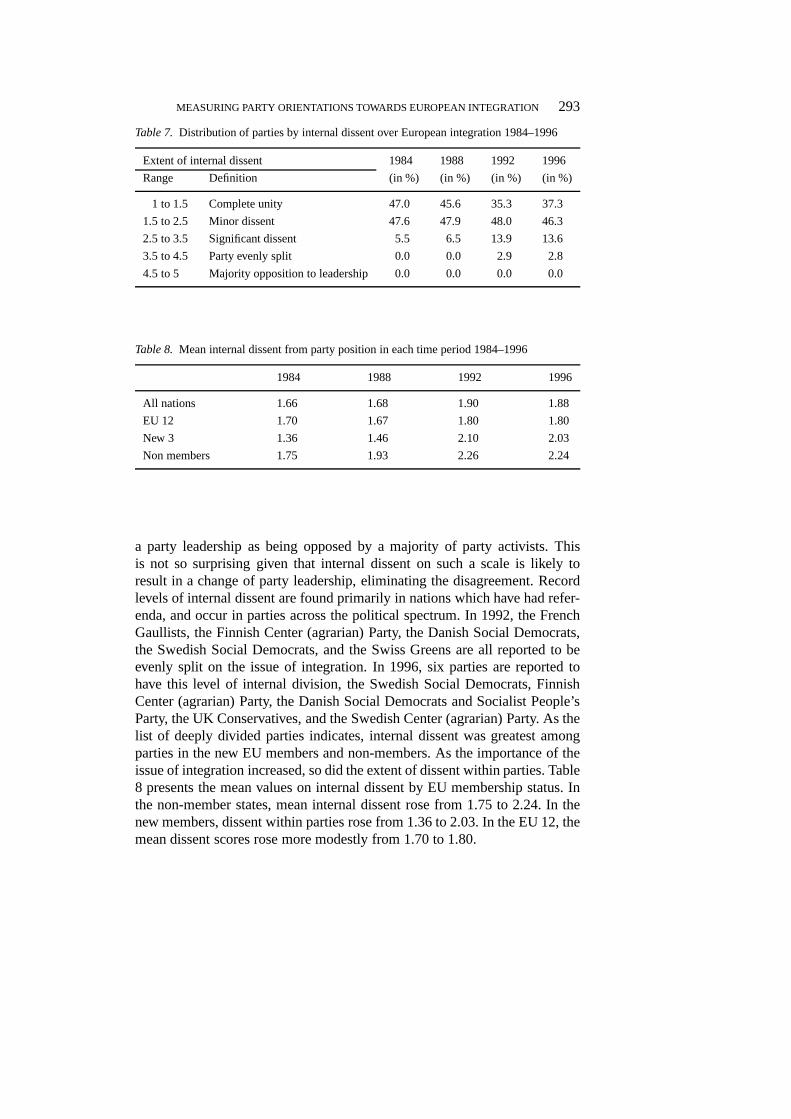
Increasing internal dissent over European integration.Overall, levels of in-ternal disagreement are rather low, with most parties scoring 2 or below whichcorresponds to ‘complete unity’ or ‘some dissent’ (see Table 7). Seriousinternal dissent, corresponding to an even division of party members is arelatively rare and recent development. In no case did the experts identify
MEASURING PARTY ORIENTATIONS TOWARDS EUROPEAN INTEGRATION 293
Table 7. Distribution of parties by internal dissent over European integration 1984–1996
Extent of internal dissent 1984 1988 1992 1996
Range Definition (in %) (in %) (in %) (in %)
1 to 1.5 Complete unity 47.0 45.6 35.3 37.3
1.5 to 2.5 Minor dissent 47.6 47.9 48.0 46.3
2.5 to 3.5 Significant dissent 5.5 6.5 13.9 13.6
3.5 to 4.5 Party evenly split 0.0 0.0 2.9 2.8
4.5 to 5 Majority opposition to leadership 0.0 0.0 0.0 0.0
Table 8. Mean internal dissent from party position in each time period 1984–1996
1984 1988 1992 1996
All nations 1.66 1.68 1.90 1.88
EU 12 1.70 1.67 1.80 1.80
New 3 1.36 1.46 2.10 2.03
Non members 1.75 1.93 2.26 2.24
a party leadership as being opposed by a majority of party activists. Thisis not so surprising given that internal dissent on such a scale is likely toresult in a change of party leadership, eliminating the disagreement. Recordlevels of internal dissent are found primarily in nations which have had refer-enda, and occur in parties across the political spectrum. In 1992, the FrenchGaullists, the Finnish Center (agrarian) Party, the Danish Social Democrats,the Swedish Social Democrats, and the Swiss Greens are all reported to beevenly split on the issue of integration. In 1996, six parties are reported tohave this level of internal division, the Swedish Social Democrats, FinnishCenter (agrarian) Party, the Danish Social Democrats and Socialist People’sParty, the UK Conservatives, and the Swedish Center (agrarian) Party. As thelist of deeply divided parties indicates, internal dissent was greatest amongparties in the new EU members and non-members. As the importance of theissue of integration increased, so did the extent of dissent within parties. Table8 presents the mean values on internal dissent by EU membership status. Inthe non-member states, mean internal dissent rose from 1.75 to 2.24. In thenew members, dissent within parties rose from 1.36 to 2.03. In the EU 12, themean dissent scores rose more modestly from 1.70 to 1.80.
294 LEONARD RAY
Conclusions
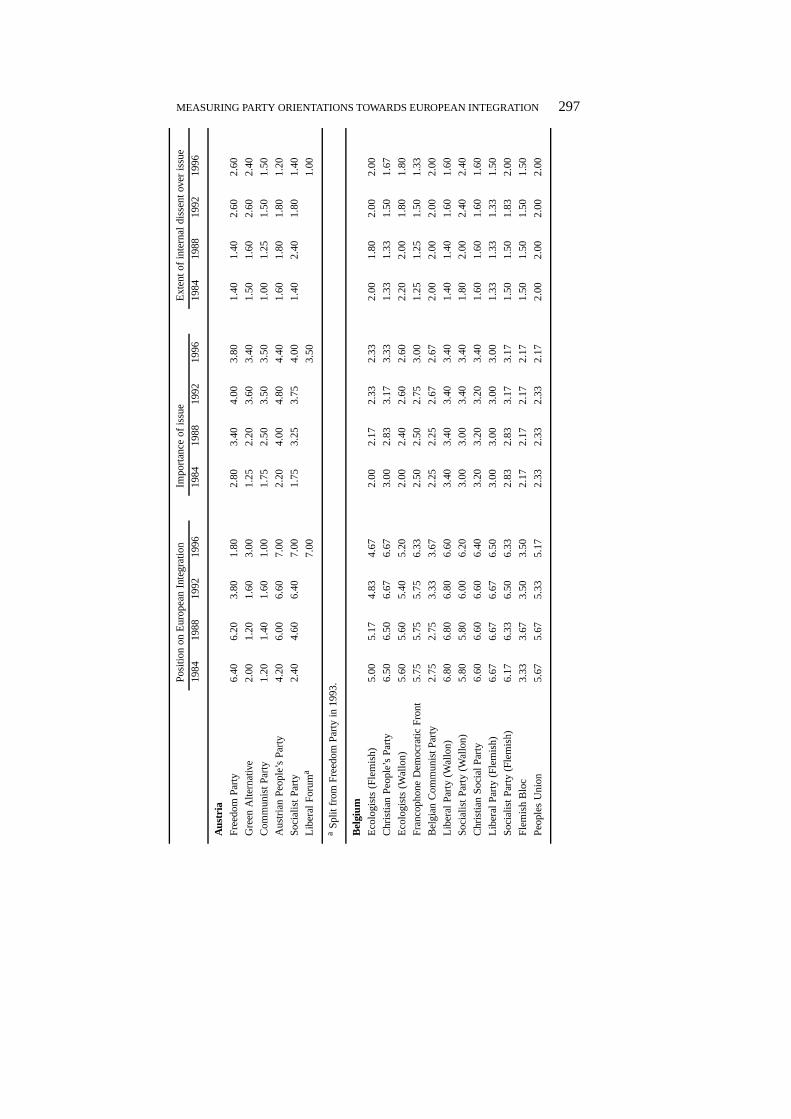
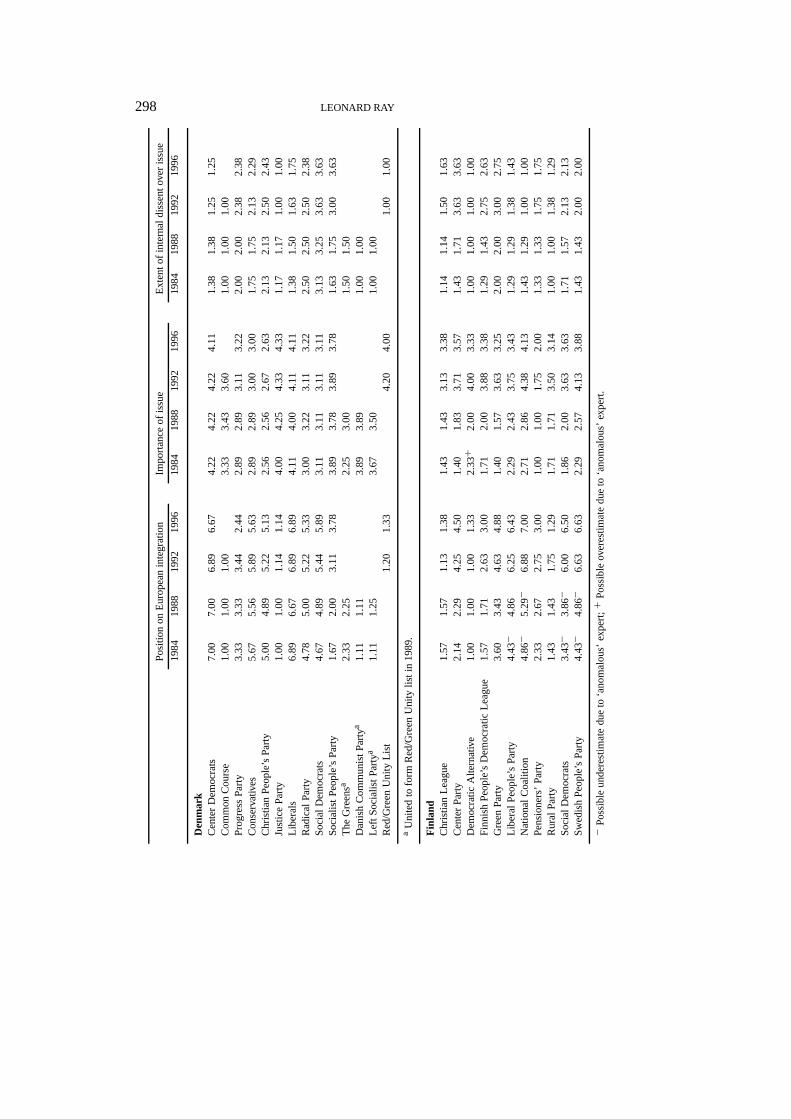
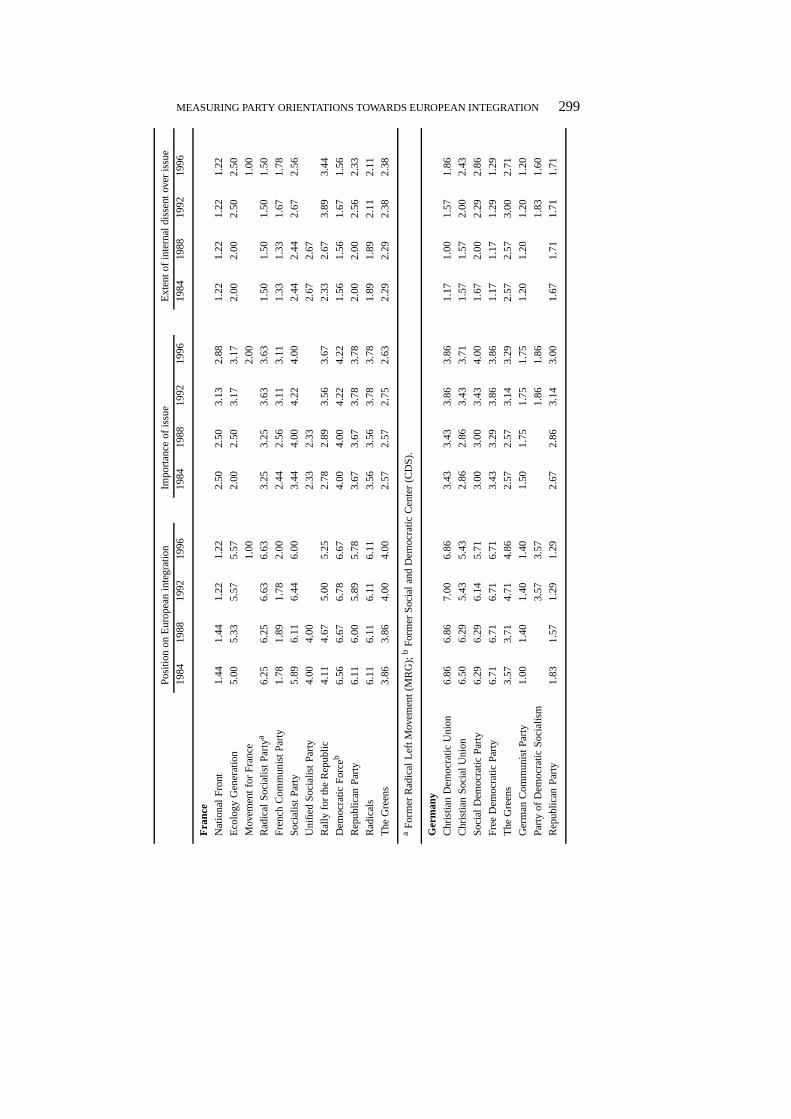
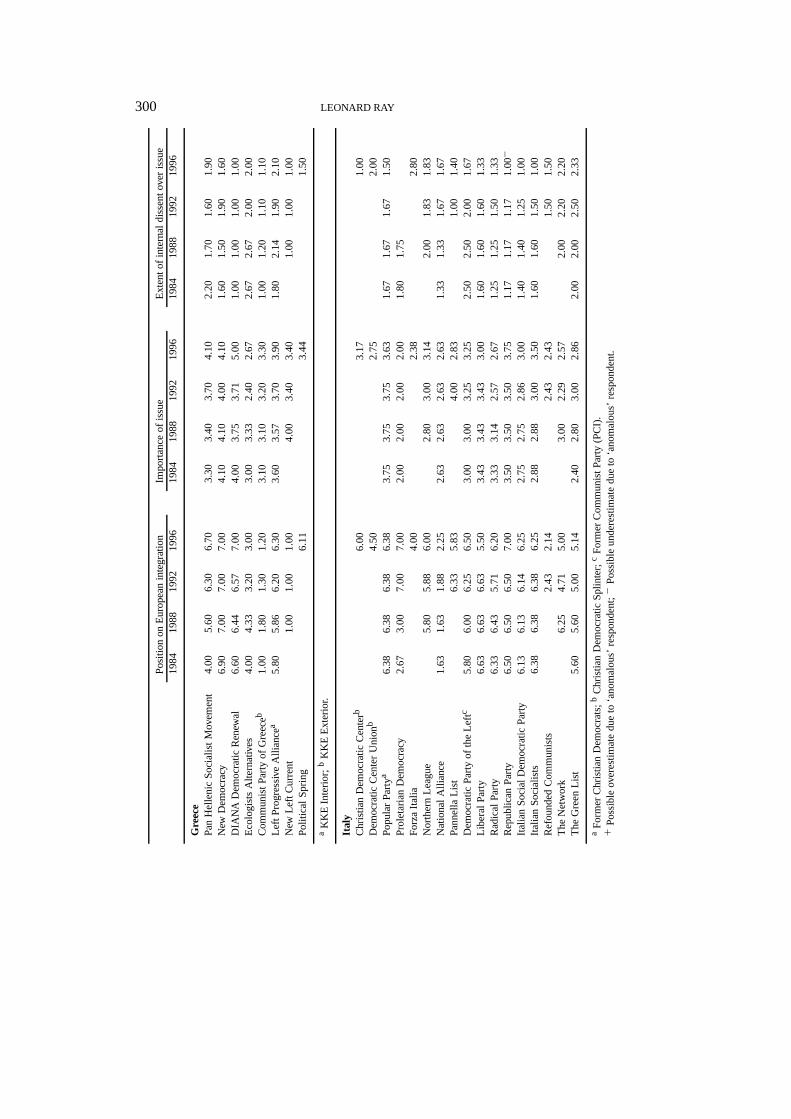
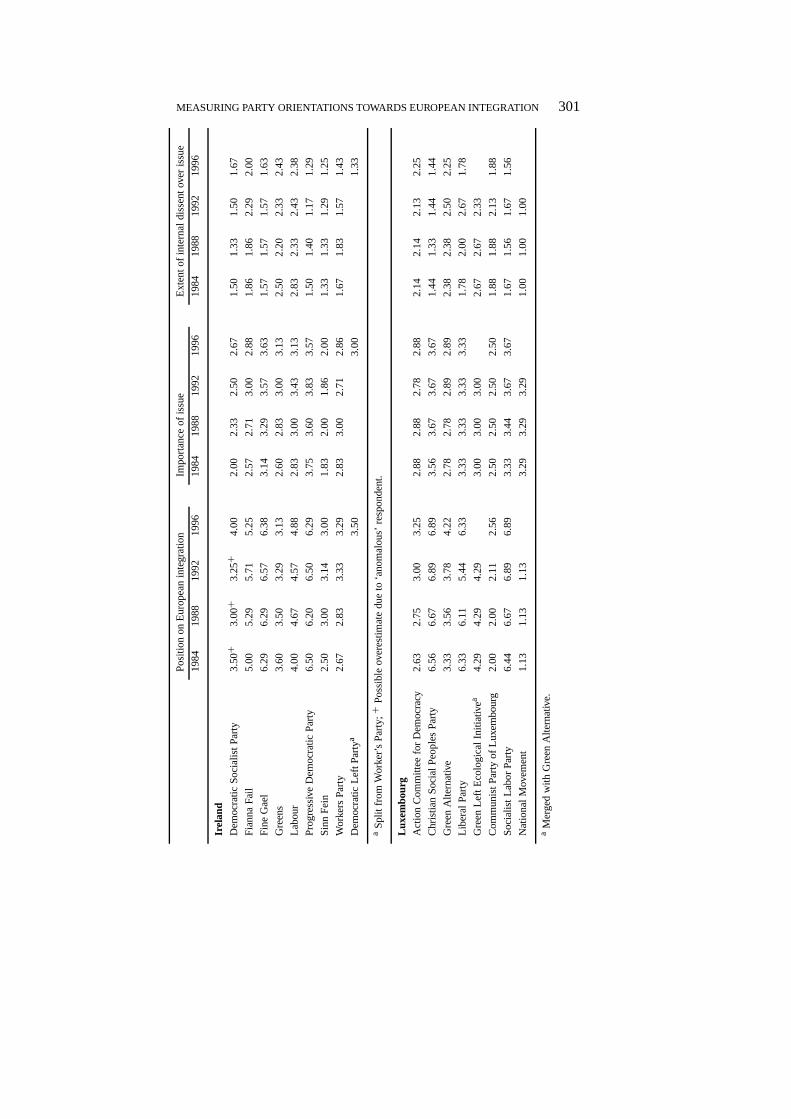
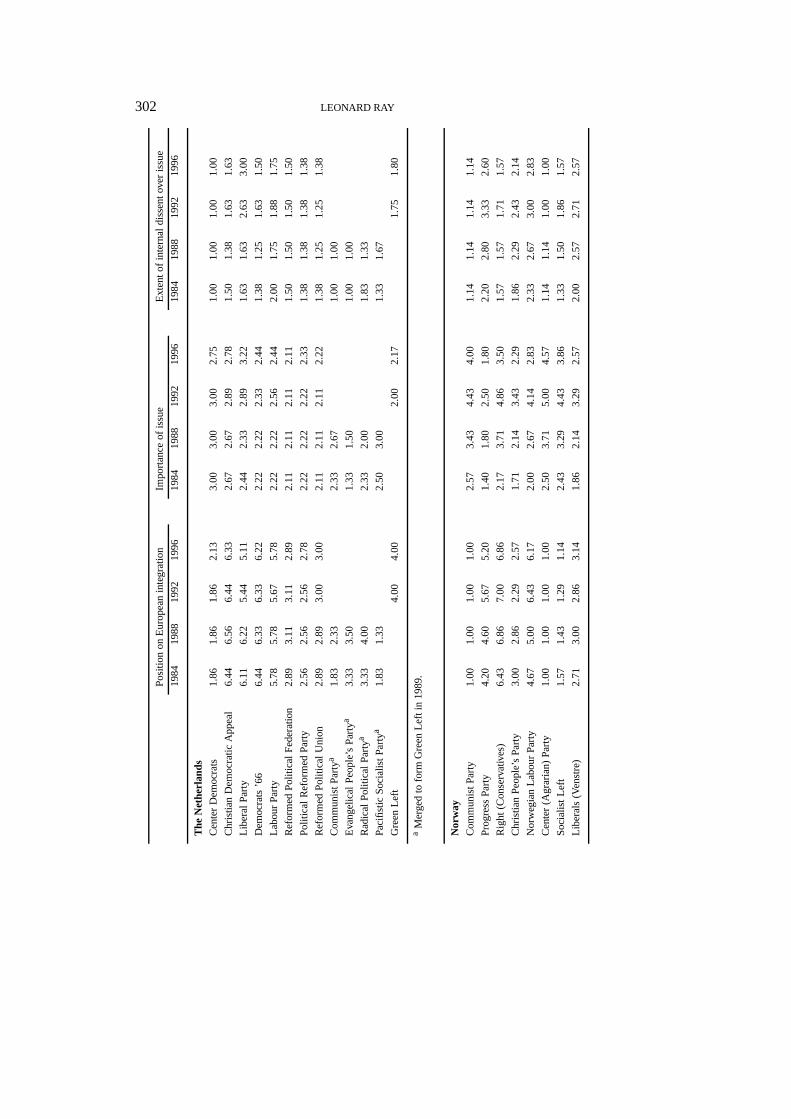
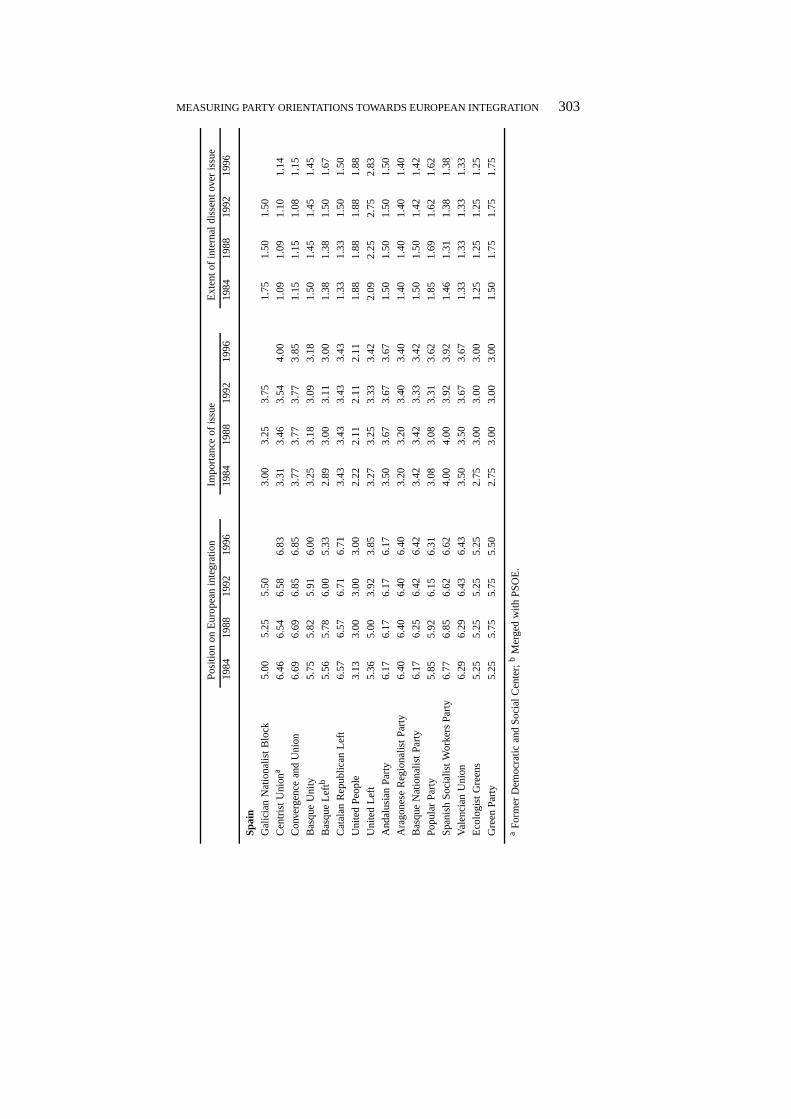
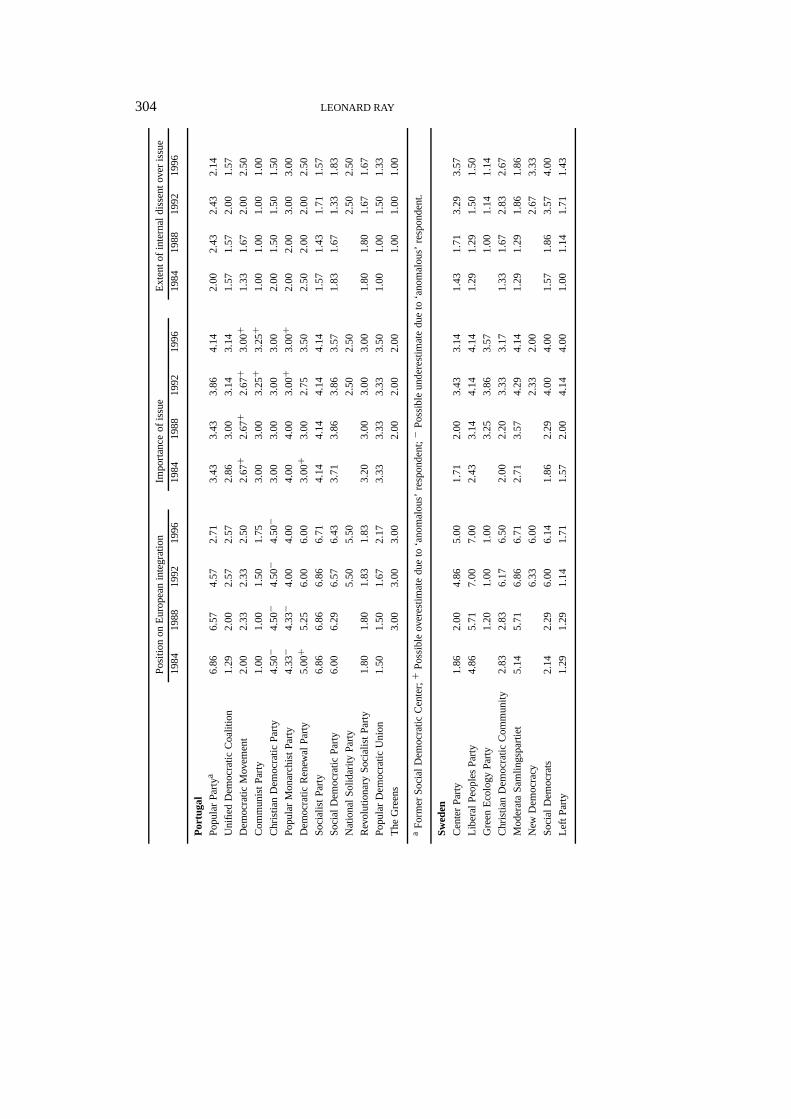
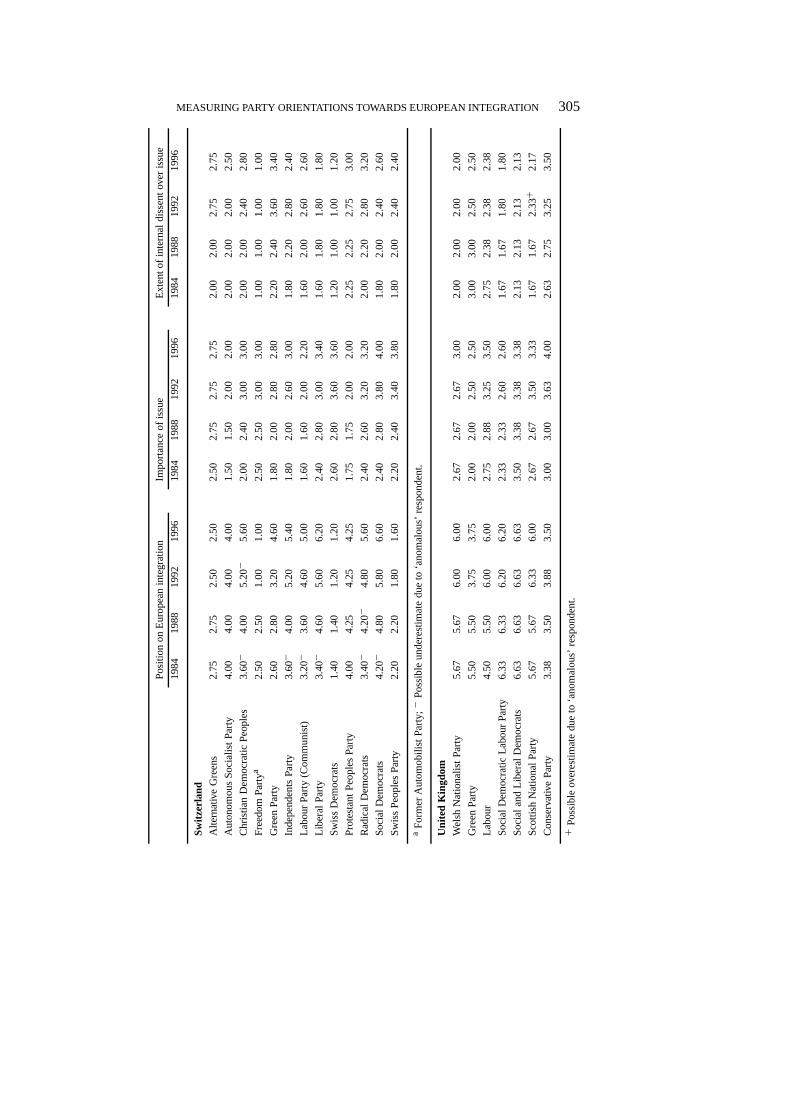
Thanks to the high level of cooperation from experts, and the consistency oftheir evaluations, the expert survey has produced a rich source of comparativeand time series data on party positions. The data indicate that parties havetaken a wide range of positions on the issue of integration, and that the im-portance of the issue has generally increased as the scope of EU competencehas grown, and the membership of the EU widened. Parties are generally notdeeply divided on the issue of integration, with some very important excep-tions. These data can be used to study cross national and temporal differencesin public opinion about integration, to explain party position taking, and toexamine the link between political parties and their electorates. In order tomake these data available to other researchers who may find them usefulfor their own research, the data for each political party are reproduced inseventeen tables in the appendix to this research note.
Notes
1. Some successful attempts have been made to eliminate inter-coder reliability problemsby using computers to code the content of party manifestos; see Laver & Garry (1997).This method seems to shift the problem of subjective interpretation of text to the level ofthe computer programmer who must decide which terms to associate with which policyareas.
2. The omission of smaller parties may be justifiable if the goal of the research is to studypolicy outcomes. If the goal is to study other aspects of party behavior, then the omissionof smaller, often opposition, parties reduces the generalizability of any findings to theuniverse of all political parties.
3. For a brief retrospective on the use of expert surveys, see Mair & Castles (1997).4. For a discussion of reliability and validity, see Johnson & Joslyn (1986: 64–72) and
Kenneth Bollen (1989: 184–222).5. One must keep in mind that the scale for party positions on European integration runs
from 1 to 7 while the other two scales run from 1 to 5. The present test is thus somewhatmore demanding for measures of party positions.
6. A shift was considered substantial if an estimate changed by more than 0.5.7. For their study of party positions on the Left-Right dimension, Huber and Inglehart find
the mean standard deviations of their estimates vary from 0.90 (on a 10 point scale) forevaluations of parties in consolidated democracies, to 1.33 for parties in non democracies(Huber & Inglehart 1995: 80).
8. Laver and Hunt do not report the overall mean standard deviation of their expert judge-ments. However, they do report the standard deviations for each estimated party positionin Appendix B.
9. For the manifesto data, the indicator used was the proportion of all references to theEU which were pro-integration. Parties whose manifestos do not refer to the EU at allare coded as missing. The manifesto from the election closest to 1988 was used for thisanalysis. Manifestos from 1989 were used for Greece., Luxembourg, The Netherlands,
MEASURING PARTY ORIENTATIONS TOWARDS EUROPEAN INTEGRATION 295
Norway, and Spain. 1988 was employed for Denmark, France, and Sweden. Manifestosfrom 1987 were used for Belgium, Finland, Germany, Ireland, Italy, Portugal, Switzer-land and the United Kingdom. For Austria, the 1986 manifestos were used. For theEurobarometer data, the mean perception of each party’s position on integration was used.
10. Total mentions of European issues as a proportion of the party platform is used here as anindicator of the importance of the issue to the party.
Appendix
Instructions to experts.Please use the form attached to evaluate the positionstaken by political parties on the issue of European Integration. Please evaluatethe parties using the following scales.
A. The overall orientation of theparty leadershiptowards European integra-tion:
1 = Strongly opposed to European integration2 = Opposed to European integration3 = Somewhat opposed to European integration4 = Neutral, no stance on the issue of European integration5 = Somewhat in favor of European integration6 = In favor of European integration.7 = Strongly in favor of European Integration
B. The relative importance of this issue in theparty’s public stance:1 = European Integration is of no importance, never mentioned by the
party2 = European Integration is a minor issue for the party3 = European Integration is an important issue for the party4 = European Integration is one of the most important issues for the party5 = European Integration is the most important issue for the party
C. Thedegree of dissentwithin the party over the party leadership’s position:1 = Complete unity2 = Minor dissent3 = Significant dissent4 = Party evenly split on issue5 = Leadership position opposed by a majority of party activists
Please rate each party on all three of these dimensions. Evaluate these partiesfor each of the following years; 1984, 1988, 1992, and 1996. Given the im-portant changes in the European Community/Union over the last decade, adynamic analysis of party positions is particularly important. If possible, spe-cify the approximate timing of any major shifts in the orientation of specificparties. However, I understand that it may be difficult to evaluate the posi-tions taken by parties some 12 years ago. If you feel uncomfortable about
296 LEONARD RAY
your judgements of party positions in the 1980’s, feel free to restrict yourevaluations to the more recent periods. A partial response is certainly moreuseful than a non-response. If you would like to obtain an advance copy ofthe dataset, please return the dataset request form indicating the format whichyou would find most convenient.
Data tables.The following tables present the dataset compiled from theresponses to the expert survey on party positions on European integration.Important mergers or schisms are noted. Estimates which would shift by morethan 0.50 when ‘suspect’ experts are omitted from the dataset are indicatedby a ‘−’ if the ‘anomalous’ experts produce an underestimate, and by a ‘+’ ifthe inclusion of the suspect expert may have resulted in an overestimate forthat parameter. The scales are described in the instruction sheet distributed toexperts along with their response forms.
MEASURING PARTY ORIENTATIONS TOWARDS EUROPEAN INTEGRATION 297
Pos
ition
onE
urop
ean
Inte
grat
ion
Impo
rtan
ceof
issu
eE
xten
tofi
nter
nald
isse
ntov
eris
sue
1984
1988
1992
1996
1984
1988
1992
1996
1984
1988
1992
1996
Aus
tria
Fre
edom
Par
ty6.
406.
203.
801.
802.
803.
404.
003.
801.
401.
402.
602.
60
Gre
enA
ltern
ativ
e2.
001.
201.
603.
001.
252.
203.
603.
401.
501.
602.
602.
40
Com
mun
istP
arty
1.20
1.40
1.60
1.00
1.75
2.50
3.50
3.50
1.00
1.25
1.50
1.50
Aus
tria
nP
eopl
e’s
Par
ty4.
206.
006.
607.
002.
204.
004.
804.
401.
601.
801.
801.
20
Soc
ialis
tP
arty
2.40
4.60
6.40
7.00
1.75
3.25
3.75
4.00
1.40
2.40
1.80
1.40
Lib
eral
For
uma
7.00
3.50
1.00
aS
plit
from
Fre
edom
Par
tyin
1993
.
Bel
gium
Eco
logi
sts
(Fle
mis
h)5.
005.
174.
834.
672.
002.
172.
332.
332.
001.
802.
002.
00
Chr
istia
nP
eopl
e’s
Par
ty6.
506.
506.
676.
673.
002.
833.
173.
331.
331.
331.
501.
67
Eco
logi
sts
(Wal
lon)
5.60
5.60
5.40
5.20
2.00
2.40
2.60
2.60
2.20
2.00
1.80
1.80
Fra
ncop
hone
Dem
ocra
ticF
ront
5.75
5.75
5.75
6.33
2.50
2.50
2.75
3.00
1.25
1.25
1.50
1.33
Bel
gian
Com
mun
istP
arty
2.75
2.75
3.33
3.67
2.25
2.25
2.67
2.67
2.00
2.00
2.00
2.00
Lib
eral
Par
ty(W
allo
n)6.
806.
806.
806.
603.
403.
403.
403.
401.
401.
401.
601.
60
Soc
ialis
tP
arty
(Wal
lon)
5.80
5.80
6.00
6.20
3.00
3.00
3.40
3.40
1.80
2.00
2.40
2.40
Chr
istia
nS
ocia
lPar
ty6.
606.
606.
606.
403.
203.
203.
203.
401.
601.
601.
601.
60
Lib
eral
Par
ty(F
lem
ish)
6.67
6.67
6.67
6.50
3.00
3.00
3.00
3.00
1.33
1.33
1.33
1.50
Soc
ialis
tP
arty
(Fle
mis
h)6.
176.
336.
506.
332.
832.
833.
173.
171.
501.
501.
832.
00
Fle
mis
hB
loc
3.33
3.67
3.50
3.50
2.17
2.17
2.17
2.17
1.50
1.50
1.50
1.50
Peo
ples
Uni
on5.
675.
675.
335.
172.
332.
332.
332.
172.
002.
002.
002.
00
298 LEONARD RAY
Pos
ition
onE
urop
ean
inte
grat
ion
Impo
rtan
ceof
issu
eE
xten
tofi
nter
nald
isse
ntov
eris
sue
1984
1988
1992
1996
1984
1988
1992
1996
1984
1988
1992
1996
Den
mar
kC
ente
rD
emoc
rats
7.00
7.00
6.89
6.67
4.22
4.22
4.22
4.11
1.38
1.38
1.25
1.25
Com
mon
Cou
rse
1.00
1.00
1.00
3.33
3.43
3.60
1.00
1.00
1.00
Pro
gres
sP
arty
3.33
3.33
3.44
2.44
2.89
2.89
3.11
3.22
2.00
2.00
2.38
2.38
Con
serv
ativ
es5.
675.
565.
895.
632.
892.
893.
003.
001.
751.
752.
132.
29C
hris
tian
Peo
ple’
sP
arty
5.00
4.89
5.22
5.13
2.56
2.56
2.67
2.63
2.13
2.13
2.50
2.43
Just
ice
Par
ty1.
001.
001.
141.
144.
004.
254.
334.
331.
171.
171.
001.
00L
iber
als
6.89
6.67
6.89
6.89
4.11
4.00
4.11
4.11
1.38
1.50
1.63
1.75
Rad
ical
Par
ty4.
785.
005.
225.
333.
003.
223.
113.
222.
502.
502.
502.
38S
ocia
lDem
ocra
ts4.
674.
895.
445.
893.
113.
113.
113.
113.
133.
253.
633.
63S
ocia
list
Peo
ple’
sP
arty
1.67
2.00
3.11
3.78
3.89
3.78
3.89
3.78
1.63
1.75
3.00
3.63
The
Gre
ensa
2.33
2.25
2.25
3.00
1.50
1.50
Dan
ish
Com
mun
istP
artya
1.11
1.11
3.89
3.89
1.00
1.00
Lef
tSoc
ialis
tPar
tya1.
111.
253.
673.
501.
001.
00R
ed/G
reen
Uni
tyL
ist
1.20
1.33
4.20
4.00
1.00
1.00
aU
nite
dto
form
Red
/Gre
enU
nity
listi
n19
89.
Fin
land
Chr
istia
nL
eagu
e1.
571.
571.
131.
381.
431.
433.
133.
381.
141.
141.
501.
63C
ente
rP
arty
2.14
2.29
4.25
4.50
1.40
1.83
3.71
3.57
1.43
1.71
3.63
3.63
Dem
ocra
ticA
ltern
ativ
e1.
001.
001.
001.
332.
33+2.
004.
003.
331.
001.
001.
001.
00F
inni
shP
eopl
e’s
Dem
ocra
ticL
eagu
e1.
571.
712.
633.
001.
712.
003.
883.
381.
291.
432.
752.
63G
reen
Par
ty3.
603.
434.
634.
881.
401.
573.
633.
252.
002.
003.
002.
75L
iber
alP
eopl
e’s
Par
ty4.
43−4.
866.
256.
432.
292.
433.
753.
431.
291.
291.
381.
43N
atio
nalC
oalit
ion
4.86−
5.29−
6.88
7.00
2.71
2.86
4.38
4.13
1.43
1.29
1.00
1.00
Pen
sion
ers’
Par
ty2.
332.
672.
753.
001.
001.
001.
752.
001.
331.
331.
751.
75R
ural
Par
ty1.
431.
431.
751.
291.
711.
713.
503.
141.
001.
001.
381.
29S
ocia
lDem
ocra
ts3.
43−3.
86−
6.00
6.50
1.86
2.00
3.63
3.63
1.71
1.57
2.13
2.13
Sw
edis
hP
eopl
e’s
Par
ty4.
43−4.
86−
6.63
6.63
2.29
2.57
4.13
3.88
1.43
1.43
2.00
2.00
−P
ossi
ble
unde
rest
imat
edu
eto
‘ano
mal
ous’
expe
rt;
+P
ossi
ble
over
estim
ate
due
to‘a
nom
alou
s’ex
pert
.
MEASURING PARTY ORIENTATIONS TOWARDS EUROPEAN INTEGRATION 299
Pos
ition
onE
urop
ean
inte
grat
ion
Impo
rtan
ceof
issu
eE
xten
tofi
nter
nald
isse
ntov
eris
sue
1984
1988
1992
1996
1984
1988
1992
1996
1984
1988
1992
1996
Fra
nce
Nat
iona
lFro
nt1.
441.
441.
221.
222.
502.
503.
132.
881.
221.
221.
221.
22
Eco
logy
Gen
erat
ion
5.00
5.33
5.57
5.57
2.00
2.50
3.17
3.17
2.00
2.00
2.50
2.50
Mov
emen
tfor
Fra
nce
1.00
2.00
1.00
Rad
ical
Soc
ialis
tPar
tya6.
256.
256.
636.
633.
253.
253.
633.
631.
501.
501.
501.
50
Fre
nch
Com
mun
istP
arty
1.78
1.89
1.78
2.00
2.44
2.56
3.11
3.11
1.33
1.33
1.67
1.78
Soc
ialis
tP
arty
5.89
6.11
6.44
6.00
3.44
4.00
4.22
4.00
2.44
2.44
2.67
2.56
Uni
fied
Soc
ialis
tP
arty
4.00
4.00
2.33
2.33
2.67
2.67
Ral
lyfo
rth
eR
epub
lic4.
114.
675.
005.
252.
782.
893.
563.
672.
332.
673.
893.
44
Dem
ocra
ticF
orceb
6.56
6.67
6.78
6.67
4.00
4.00
4.22
4.22
1.56
1.56
1.67
1.56
Rep
ublic
anP
arty
6.11
6.00
5.89
5.78
3.67
3.67
3.78
3.78
2.00
2.00
2.56
2.33
Rad
ical
s6.
116.
116.
116.
113.
563.
563.
783.
781.
891.
892.
112.
11
The
Gre
ens
3.86
3.86
4.00
4.00
2.57
2.57
2.75
2.63
2.29
2.29
2.38
2.38
aF
orm
erR
adic
alL
eftM
ovem
ent(
MR
G);b
For
mer
Soc
iala
ndD
emoc
ratic
Cen
ter
(CD
S).
Ger
man
yC
hris
tian
Dem
ocra
ticU
nion
6.86
6.86
7.00
6.86
3.43
3.43
3.86
3.86
1.17
1.00
1.57
1.86
Chr
istia
nS
ocia
lUni
on6.
506.
295.
435.
432.
862.
863.
433.
711.
571.
572.
002.
43
Soc
ialD
emoc
ratic
Par
ty6.
296.
296.
145.
713.
003.
003.
434.
001.
672.
002.
292.
86
Fre
eD
emoc
ratic
Par
ty6.
716.
716.
716.
713.
433.
293.
863.
861.
171.
171.
291.
29
The
Gre
ens
3.57
3.71
4.71
4.86
2.57
2.57
3.14
3.29
2.57
2.57
3.00
2.71
Ger
man
Com
mun
istP
arty
1.00
1.40
1.40
1.40
1.50
1.75
1.75
1.75
1.20
1.20
1.20
1.20
Par
tyof
Dem
ocra
ticS
ocia
lism
3.57
3.57
1.86
1.86
1.83
1.60
Rep
ublic
anP
arty
1.83
1.57
1.29
1.29
2.67
2.86
3.14
3.00
1.67
1.71
1.71
1.71
300 LEONARD RAY
Pos
ition
onE
urop
ean
inte
grat
ion
Impo
rtan
ceof
issu
eE
xten
tofi
nter
nald
isse
ntov
eris
sue
1984
1988
1992
1996
1984
1988
1992
1996
1984
1988
1992
1996
Gre
ece
Pan
Hel
leni
cS
ocia
list
Mov
emen
t4.
005.
606.
306.
703.
303.
403.
704.
102.
201.
701.
601.
90N
ewD
emoc
racy
6.90
7.00
7.00
7.00
4.10
4.10
4.00
4.10
1.60
1.50
1.90
1.60
DIA
NA
Dem
ocra
ticR
enew
al6.
606.
446.
577.
004.
003.
753.
715.
001.
001.
001.
001.
00E
colo
gist
sA
ltern
ativ
es4.
004.
333.
203.
003.
003.
332.
402.
672.
672.
672.
002.
00C
omm
unis
tPar
tyof
Gre
ece
b1.
001.
801.
301.
203.
103.
103.
203.
301.
001.
201.
101.
10L
eftP
rogr
essi
veA
llian
cea5.
805.
866.
206.
303.
603.
573.
703.
901.
802.
141.
902.
10N
ewL
eftC
urre
nt1.
001.
001.
004.
003.
403.
401.
001.
001.
00P
oliti
calS
prin
g6.
113.
441.
50
aK
KE
Inte
rior;
bK
KE
Ext
erio
r.
Italy
Chr
istia
nD
emoc
ratic
Cen
ter
b6.
003.
171.
00D
emoc
ratic
Cen
ter
Uni
onb4.
502.
752.
00P
opul
arP
artya
6.38
6.38
6.38
6.38
3.75
3.75
3.75
3.63
1.67
1.67
1.67
1.50
Pro
leta
rian
Dem
ocra
cy2.
673.
007.
007.
002.
002.
002.
002.
001.
801.
75F
orza
Italia
4.00
2.38
2.80
Nor
ther
nL
eagu
e5.
805.
886.
002.
803.
003.
142.
001.
831.
83N
atio
nalA
llian
ce1.
631.
631.
882.
252.
632.
632.
632.
631.
331.
331.
671.
67P
anne
llaL
ist
6.33
5.83
4.00
2.83
1.00
1.40
Dem
ocra
ticP
arty
ofth
eL
eft
c5.
806.
006.
256.
503.
003.
003.
253.
252.
502.
502.
001.
67L
iber
alP
arty
6.63
6.63
6.63
5.50
3.43
3.43
3.43
3.00
1.60
1.60
1.60
1.33
Rad
ical
Par
ty6.
336.
435.
716.
203.
333.
142.
572.
671.
251.
251.
501.
33R
epub
lican
Par
ty6.
506.
506.
507.
003.
503.
503.
503.
751.
171.
171.
171.
00−
Italia
nS
ocia
lDem
ocra
ticP
arty
6.13
6.13
6.14
6.25
2.75
2.75
2.86
3.00
1.40
1.40
1.25
1.00
Italia
nS
ocia
lists
6.38
6.38
6.38
6.25
2.88
2.88
3.00
3.50
1.60
1.60
1.50
1.00
Ref
ound
edC
omm
unis
ts2.
432.
142.
432.
431.
501.
50T
heN
etw
ork
6.25
4.71
5.00
3.00
2.29
2.57
2.00
2.20
2.20
The
Gre
enL
ist
5.60
5.60
5.00
5.14
2.40
2.80
3.00
2.86
2.00
2.00
2.50
2.33
aF
orm
erC
hris
tian
Dem
ocra
ts;
bC
hris
tian
Dem
ocra
ticS
plin
ter;c
For
mer
Com
mun
istP
arty
(PC
I).
+P
ossi
ble
over
estim
ate
due
to‘a
nom
alou
s’re
spon
dent
;−
Pos
sibl
eun
dere
stim
ate
due
to‘a
nom
alou
s’re
spon
dent
.
MEASURING PARTY ORIENTATIONS TOWARDS EUROPEAN INTEGRATION 301
Pos
ition
onE
urop
ean
inte
grat
ion
Impo
rtan
ceof
issu
eE
xten
tofi
nter
nald
isse
ntov
eris
sue
1984
1988
1992
1996
1984
1988
1992
1996
1984
1988
1992
1996
Irel
and
Dem
ocra
ticS
ocia
listP
arty
3.50+
3.00+
3.25+
4.00
2.00
2.33
2.50
2.67
1.50
1.33
1.50
1.67
Fia
nna
Fai
l5.
005.
295.
715.
252.
572.
713.
002.
881.
861.
862.
292.
00
Fin
eG
ael
6.29
6.29
6.57
6.38
3.14
3.29
3.57
3.63
1.57
1.57
1.57
1.63
Gre
ens
3.60
3.50
3.29
3.13
2.60
2.83
3.00
3.13
2.50
2.20
2.33
2.43
Lab
our
4.00
4.67
4.57
4.88
2.83
3.00
3.43
3.13
2.83
2.33
2.43
2.38
Pro
gres
sive
Dem
ocra
ticP
arty
6.50
6.20
6.50
6.29
3.75
3.60
3.83
3.57
1.50
1.40
1.17
1.29
Sin
nF
ein
2.50
3.00
3.14
3.00
1.83
2.00
1.86
2.00
1.33
1.33
1.29
1.25
Wor
kers
Par
ty2.
672.
833.
333.
292.
833.
002.
712.
861.
671.
831.
571.
43
Dem
ocra
ticL
eftP
artya
3.50
3.00
1.33
aS
plit
from
Wor
ker’s
Par
ty;+
Pos
sibl
eov
eres
timat
edu
eto
‘ano
mal
ous’
resp
onde
nt.
Luxe
mbo
urg
Act
ion
Com
mitt
eefo
rD
emoc
racy
2.63
2.75
3.00
3.25
2.88
2.88
2.78
2.88
2.14
2.14
2.13
2.25
Chr
istia
nS
ocia
lPeo
ples
Par
ty6.
566.
676.
896.
893.
563.
673.
673.
671.
441.
331.
441.
44
Gre
enA
ltern
ativ
e3.
333.
563.
784.
222.
782.
782.
892.
892.
382.
382.
502.
25
Lib
eral
Par
ty6.
336.
115.
446.
333.
333.
333.
333.
331.
782.
002.
671.
78
Gre
enL
eftE
colo
gica
lIni
tiativ
ea4.
294.
294.
293.
003.
003.
002.
672.
672.
33
Com
mun
istP
arty
ofL
uxem
bour
g2.
002.
002.
112.
562.
502.
502.
502.
501.
881.
882.
131.
88
Soc
ialis
tL
abor
Par
ty6.
446.
676.
896.
893.
333.
443.
673.
671.
671.
561.
671.
56
Nat
iona
lMov
emen
t1.
131.
131.
133.
293.
293.
291.
001.
001.
00
aM
erge
dw
ithG
reen
Alte
rnat
ive.
302 LEONARD RAY
Pos
ition
onE
urop
ean
inte
grat
ion
Impo
rtan
ceof
issu
eE
xten
tofi
nter
nald
isse
ntov
eris
sue
1984
1988
1992
1996
1984
1988
1992
1996
1984
1988
1992
1996
The
Net
herla
nds
Cen
ter
Dem
ocra
ts1.
861.
861.
862.
133.
003.
003.
002.
751.
001.
001.
001.
00
Chr
istia
nD
emoc
ratic
App
eal
6.44
6.56
6.44
6.33
2.67
2.67
2.89
2.78
1.50
1.38
1.63
1.63
Lib
eral
Par
ty6.
116.
225.
445.
112.
442.
332.
893.
221.
631.
632.
633.
00
Dem
ocra
ts’6
66.
446.
336.
336.
222.
222.
222.
332.
441.
381.
251.
631.
50
Lab
our
Par
ty5.
785.
785.
675.
782.
222.
222.
562.
442.
001.
751.
881.
75
Ref
orm
edP
oliti
calF
eder
atio
n2.
893.
113.
112.
892.
112.
112.
112.
111.
501.
501.
501.
50
Pol
itica
lRef
orm
edP
arty
2.56
2.56
2.56
2.78
2.22
2.22
2.22
2.33
1.38
1.38
1.38
1.38
Ref
orm
edP
oliti
calU
nion
2.89
2.89
3.00
3.00
2.11
2.11
2.11
2.22
1.38
1.25
1.25
1.38
Com
mun
istP
artya
1.83
2.33
2.33
2.67
1.00
1.00
Eva
ngel
ical
Peo
ple’
sP
artya
3.33
3.50
1.33
1.50
1.00
1.00
Rad
ical
Pol
itica
lPar
tya3.
334.
002.
332.
001.
831.
33
Pac
ifist
icS
ocia
listP
artya
1.83
1.33
2.50
3.00
1.33
1.67
Gre
enL
eft
4.00
4.00
2.00
2.17
1.75
1.80
aM
erge
dto
form
Gre
enL
efti
n19
89.
Nor
way
Com
mun
istP
arty
1.00
1.00
1.00
1.00
2.57
3.43
4.43
4.00
1.14
1.14
1.14
1.14
Pro
gres
sP
arty
4.20
4.60
5.67
5.20
1.40
1.80
2.50
1.80
2.20
2.80
3.33
2.60
Rig
ht(C
onse
rvat
ives
)6.
436.
867.
006.
862.
173.
714.
863.
501.
571.
571.
711.
57
Chr
istia
nP
eopl
e’s
Par
ty3.
002.
862.
292.
571.
712.
143.
432.
291.
862.
292.
432.
14
Nor
weg
ian
Lab
our
Par
ty4.
675.
006.
436.
172.
002.
674.
142.
832.
332.
673.
002.
83
Cen
ter
(Agr
aria
n)P
arty
1.00
1.00
1.00
1.00
2.50
3.71
5.00
4.57
1.14
1.14
1.00
1.00
Soc
ialis
tL
eft
1.57
1.43
1.29
1.14
2.43
3.29
4.43
3.86
1.33
1.50
1.86
1.57
Lib
eral
s(V
enst
re)
2.71
3.00
2.86
3.14
1.86
2.14
3.29
2.57
2.00
2.57
2.71
2.57
MEASURING PARTY ORIENTATIONS TOWARDS EUROPEAN INTEGRATION 303
Pos
ition
onE
urop
ean
inte
grat
ion
Impo
rtan
ceof
issu
eE
xten
tofi
nter
nald
isse
ntov
eris
sue
1984
1988
1992
1996
1984
1988
1992
1996
1984
1988
1992
1996
Spa
inG
alic
ian
Nat
iona
list
Blo
ck5.
005.
255.
503.
003.
253.
751.
751.
501.
50
Cen
tris
tUni
ona
6.46
6.54
6.58
6.83
3.31
3.46
3.54
4.00
1.09
1.09
1.10
1.14
Con
verg
ence
and
Uni
on6.
696.
696.
856.
853.
773.
773.
773.
851.
151.
151.
081.
15
Bas
que
Uni
ty5.
755.
825.
916.
003.
253.
183.
093.
181.
501.
451.
451.
45
Bas
que
Lef
tb5.
565.
786.
005.
332.
893.
003.
113.
001.
381.
381.
501.
67
Cat
alan
Rep
ublic
anL
eft
6.57
6.57
6.71
6.71
3.43
3.43
3.43
3.43
1.33
1.33
1.50
1.50
Uni
ted
Peo
ple
3.13
3.00
3.00
3.00
2.22
2.11
2.11
2.11
1.88
1.88
1.88
1.88
Uni
ted
Lef
t5.
365.
003.
923.
853.
273.
253.
333.
422.
092.
252.
752.
83
And
alus
ian
Par
ty6.
176.
176.
176.
173.
503.
673.
673.
671.
501.
501.
501.
50
Ara
gone
seR
egio
nalis
tP
arty
6.40
6.40
6.40
6.40
3.20
3.20
3.40
3.40
1.40
1.40
1.40
1.40
Bas
que
Nat
iona
list
Par
ty6.
176.
256.
426.
423.
423.
423.
333.
421.
501.
501.
421.
42
Pop
ular
Par
ty5.
855.
926.
156.
313.
083.
083.
313.
621.
851.
691.
621.
62
Spa
nish
Soc
ialis
tW
orke
rsP
arty
6.77
6.85
6.62
6.62
4.00
4.00
3.92
3.92
1.46
1.31
1.38
1.38
Val
enci
anU
nion
6.29
6.29
6.43
6.43
3.50
3.50
3.67
3.67
1.33
1.33
1.33
1.33
Eco
logi
stG
reen
s5.
255.
255.
255.
252.
753.
003.
003.
001.
251.
251.
251.
25
Gre
enP
arty
5.25
5.75
5.75
5.50
2.75
3.00
3.00
3.00
1.50
1.75
1.75
1.75
aF
orm
erD
emoc
ratic
and
Soc
ialC
ente
r;b
Mer
ged
with
PS
OE
.
304 LEONARD RAY
Pos
ition
onE
urop
ean
inte
grat
ion
Impo
rtan
ceof
issu
eE
xten
tofi
nter
nald
isse
ntov
eris
sue
1984
1988
1992
1996
1984
1988
1992
1996
1984
1988
1992
1996
Por
tuga
lP
opul
arP
artya
6.86
6.57
4.57
2.71
3.43
3.43
3.86
4.14
2.00
2.43
2.43
2.14
Uni
fied
Dem
ocra
ticC
oalit
ion
1.29
2.00
2.57
2.57
2.86
3.00
3.14
3.14
1.57
1.57
2.00
1.57
Dem
ocra
ticM
ovem
ent
2.00
2.33
2.33
2.50
2.67+
2.67+
2.67+
3.00+
1.33
1.67
2.00
2.50
Com
mun
istP
arty
1.00
1.00
1.50
1.75
3.00
3.00
3.25+
3.25+
1.00
1.00
1.00
1.00
Chr
istia
nD
emoc
ratic
Par
ty4.
50−4.
50−
4.50−
4.50−
3.00
3.00
3.00
3.00
2.00
1.50
1.50
1.50
Pop
ular
Mon
arch
istP
arty
4.33−
4.33−
4.00
4.00
4.00
4.00
3.00+
3.00+
2.00
2.00
3.00
3.00
Dem
ocra
ticR
enew
alP
arty
5.00+
5.25
6.00
6.00
3.00+
3.00
2.75
3.50
2.50
2.00
2.00
2.50
Soc
ialis
tP
arty
6.86
6.86
6.86
6.71
4.14
4.14
4.14
4.14
1.57
1.43
1.71
1.57
Soc
ialD
emoc
ratic
Par
ty6.
006.
296.
576.
433.
713.
863.
863.
571.
831.
671.
331.
83
Nat
iona
lSol
idar
ityP
arty
5.50
5.50
2.50
2.50
2.50
2.50
Rev
olut
iona
ryS
ocia
list
Par
ty1.
801.
801.
831.
833.
203.
003.
003.
001.
801.
801.
671.
67
Pop
ular
Dem
ocra
ticU
nion
1.50
1.50
1.67
2.17
3.33
3.33
3.33
3.50
1.00
1.00
1.50
1.33
The
Gre
ens
3.00
3.00
3.00
2.00
2.00
2.00
1.00
1.00
1.00
aF
orm
erS
ocia
lDem
ocra
ticC
ente
r;+P
ossi
ble
over
estim
ate
due
to‘a
nom
alou
s’re
spon
dent
;−
Pos
sibl
eun
dere
stim
ate
due
to‘a
nom
alou
s’re
spon
dent
.
Sw
eden
Cen
ter
Par
ty1.
862.
004.
865.
001.
712.
003.
433.
141.
431.
713.
293.
57
Lib
eral
Peo
ples
Par
ty4.
865.
717.
007.
002.
433.
144.
144.
141.
291.
291.
501.
50
Gre
enE
colo
gyP
arty
1.20
1.00
1.00
3.25
3.86
3.57
1.00
1.14
1.14
Chr
istia
nD
emoc
ratic
Com
mun
ity2.
832.
836.
176.
502.
002.
203.
333.
171.
331.
672.
832.
67
Mod
erat
aS
amlin
gspa
rtie
t5.
145.
716.
866.
712.
713.
574.
294.
141.
291.
291.
861.
86
New
Dem
ocra
cy6.
336.
002.
332.
002.
673.
33
Soc
ialD
emoc
rats
2.14
2.29
6.00
6.14
1.86
2.29
4.00
4.00
1.57
1.86
3.57
4.00
Lef
tPar
ty1.
291.
291.
141.
711.
572.
004.
144.
001.
001.
141.
711.
43
MEASURING PARTY ORIENTATIONS TOWARDS EUROPEAN INTEGRATION 305
Pos
ition
onE
urop
ean
inte
grat
ion
Impo
rtan
ceof
issu
eE
xten
tofi
nter
nald
isse
ntov
eris
sue
1984
1988
1992
1996
1984
1988
1992
1996
1984
1988
1992
1996
Sw
itzer
land
Alte
rnat
ive
Gre
ens
2.75
2.75
2.50
2.50
2.50
2.75
2.75
2.75
2.00
2.00
2.75
2.75
Aut
onom
ous
Soc
ialis
tP
arty
4.00
4.00
4.00
4.00
1.50
1.50
2.00
2.00
2.00
2.00
2.00
2.50
Chr
istia
nD
emoc
ratic
Peo
ples
3.60−
4.00
5.20−
5.60
2.00
2.40
3.00
3.00
2.00
2.00
2.40
2.80
Fre
edom
Par
tya2.
502.
501.
001.
002.
502.
503.
003.
001.
001.
001.
001.
00
Gre
enP
arty
2.60
2.80
3.20
4.60
1.80
2.00
2.80
2.80
2.20
2.40
3.60
3.40
Inde
pend
ents
Par
ty3.
60−4.
005.
205.
401.
802.
002.
603.
001.
802.
202.
802.
40
Lab
our
Par
ty(C
omm
unis
t)3.
20−3.
604.
605.
001.
601.
602.
002.
201.
602.
002.
602.
60
Lib
eral
Par
ty3.
40−
4.60
5.60
6.20
2.40
2.80
3.00
3.40
1.60
1.80
1.80
1.80
Sw
iss
Dem
ocra
ts1.
401.
401.
201.
202.
602.
803.
603.
601.
201.
001.
001.
20
Pro
test
ant
Peo
ples
Par
ty4.
004.
254.
254.
251.
751.
752.
002.
002.
252.
252.
753.
00
Rad
ical
Dem
ocra
ts3.
40−4.
20−
4.80
5.60
2.40
2.60
3.20
3.20
2.00
2.20
2.80
3.20
Soc
ialD
emoc
rats
4.20−
4.80
5.80
6.60
2.40
2.80
3.80
4.00
1.80
2.00
2.40
2.60
Sw
iss
Peo
ples
Par
ty2.
202.
201.
801.
602.
202.
403.
403.
801.
802.
002.
402.
40
aF
orm
erA
utom
obili
stP
arty
;−P
ossi
ble
unde
rest
imat
edu
eto
‘ano
mal
ous’
resp
onde
nt.
Uni
ted
Kin
gdom
Wel
shN
atio
nalis
tP
arty
5.67
5.67
6.00
6.00
2.67
2.67
2.67
3.00
2.00
2.00
2.00
2.00
Gre
enP
arty
5.50
5.50
3.75
3.75
2.00
2.00
2.50
2.50
3.00
3.00
2.50
2.50
Lab
our
4.50
5.50
6.00
6.00
2.75
2.88
3.25
3.50
2.75
2.38
2.38
2.38
Soc
ialD
emoc
ratic
Lab
our
Par
ty6.
336.
336.
206.
202.
332.
332.
602.
601.
671.
671.
801.
80
Soc
iala
ndL
iber
alD
emoc
rats
6.63
6.63
6.63
6.63
3.50
3.38
3.38
3.38
2.13
2.13
2.13
2.13
Sco
ttish
Nat
iona
lPar
ty5.
675.
676.
336.
002.
672.
673.
503.
331.
671.
672.
33+
2.17
Con
serv
ativ
eP
arty
3.38
3.50
3.88
3.50
3.00
3.00
3.63
4.00
2.63
2.75
3.25
3.50
+P
ossi
ble
over
estim
ate
due
to‘a
nom
alou
s’re
spon
dent
.
306 LEONARD RAY
References
Bollen, K. (1989).Structural Equations with Latent Variables. New York: John Wiley andSons.
Castles, F. & Mair, P. (1984). Left-right political scales: Some ‘expert’ judgments,EuropeanJournal of Political Research12(1): 73–88.
Eijk, C. Van der & Franklin, M. (1991). European Community politics and electoral repres-entation: Evidence from the 1989 European elections study,European Journal of PoliticalResearch19: 105–127.
Hix, S. & Lord, C. (1997).Political Parties in the European Union. London: Macmillan.Huber, J. & Inglehart, R. (1995). Expert interpretations of party space and party locations in
42 societies,Party Politics1: 73–111.Inglehart, R. & Klingemann, H.-D. (1976). Party identification ideological preference, and
the left-right dimensions among Western mass publics, in: I. Budge, I. Crewe & D. Farlie(eds.),Party Identification and Beyond. London: Wiley.
Laver, M. & Hunt, B. (1992).Policy and Party Competition.New York: Routledge.Laver, M. & Garry, J. (1997). Estimating policy positions from party manifestos. Paper
prepared for the symposium ‘Actors and Institutions in West European ParliamentaryDemocracies’, 13–15 June, Umea.
Laver, M. (1994). Party policy and cabinet portfolios in Ireland 1992: Results from an expertsurvey,Irish Political Studies9: 157–164.
Laver, M. (1995). Party policy and cabinet portfolios in the Netherlands, 1994: Results froman expert survey,Acta Politica30(1): 3–28.
Laver, M. (1998a). Party policy in Britain, 1997,Political Studies46: 336–347.Laver, M. (1998b). Party policy in Ireland, 1997,Irish Political Studies13: 159–171.Mair, P. & Castles, F. (1977). Reflections: Revisiting expert judgements,European Journal of
Political Research31: 150–157.Steenbergen, M.R. & Scott, D.J. (1997). Representation persuasion and public opinion
towards the European Union. Paper prepared for the annual meeting of the SouthernPolitical Science Association, Norfolk VA, November 1997.
Address for correspondence:Professor Leonard Ray, Department of Political Science, Bing-hamton University, P.O. Box 6000, Binghamton, NY 13902-6000, USAPhone: (606) 777-4374; Fax: (606) 777-2675; E-mail: [email protected]