F:\Jobs\1367B\Reports\015\015a.doc Page 1 MEMORANDUM COMPANY: FerrAus ATTENTION: Jason Hyde Brett Hazelden Rudolph van Niekerk FROM: Daragh Monaghan DATE: 15 July 2011 JOB NO: 1367B DOC NO: 015a SUBJECT: 13 (Mirrin Mirrin) Creek Diversion Detailed Design - Interim Design Memo Jason, We are pleased to present our interim design memo regarding the detailed hydraulic design and layouts of the 13 Creek diversion. As requested, 13 Creek is referred to as Mirrin Mirrin Creek for the purposes of this project. The purpose of this memo is to summarise our findings to date, and to give recommendations on the Mirrin Mirrin Creek diversion channel dimensions. Following discussion of the interim design with the various stakeholders and designers, we will proceed with the detailed design drawings for the diversion. 1. BACKGROUND The FerrAus Pilbara Iron Ore Project (FPP) is located on the eastern margin of the Hamersley Province in the Pilbara region of Western Australia, approximately 75km east of the township of Newman, on the northern border of the Jigalong Aboriginal Reserve (Figure 1). The FPP currently comprises three main areas of development, Robertson Range, Davidson Creek and Mirrin Mirrin (Figure 2). Mirrin Mirrin Creek passes through the Davidson Creek project area, and a diversion is required to enable mining to commence in the area. RPS Aquaterra has previously completed preliminary designs for the diversion of Mirrin Mirrin Creek. As part of the Definitive Feasibility Study (DFS), FerrAus requires the completion of the detailed design of the Mirrin Mirrin Creek diversion. 2. EXISTING ENVIRONMENT 2.1 Regional Surface Water Hydrology The proposed Mirrin Mirrin and Davidson Creek projects are located within the Upper Fortescue catchment, which comprises an area of approximately 29,800km 2 (Figure 3). The main feature of the Upper Fortescue catchment is the Fortescue Marsh. The marsh area is in the physiographic unit known as the Fortescue Valley, and occupies a trough between the Chichester and Hamersley Plateaux (Beard, 1975). The Goodiadarrie Hills, located on the valley floor just west from the marsh rail crossing, effectively cuts the Fortescue River into two separate river systems. West from the Goodiadarrie Hills, the Lower Fortescue River Catchment drains in a general north-westerly direction to the coast, whereas east of the hills the Fortescue Marsh receives drainage from the Upper Fortescue River Catchment. Several large creek systems discharge to the Fortescue Marsh. These systems include the Fortescue River, Weeli Wolli Creek, Marillana Creek, Caramulla Creek and Jigalong Creek. The alluvial outwash fan from the Weeli Wolli Creek and other smaller creek systems abutting the Goodiadarrie Hills is believed to
We are pleased to present our interim design memo regarding the detailed hydraulic design and layouts of the 13 Creek diversion. As requested, 13 Creek is referred to as Mirrin Mirrin Creek for the purposes of this project. The purpose of this memo is to summarise our findings to date, and to give recommendations on the Mirrin Mirrin Creek diversion channel dimensions.
Following discussion of the interim design with the various stakeholders and designers, we will proceed with the detailed design drawings for the diversion.
1. BACKGROUND
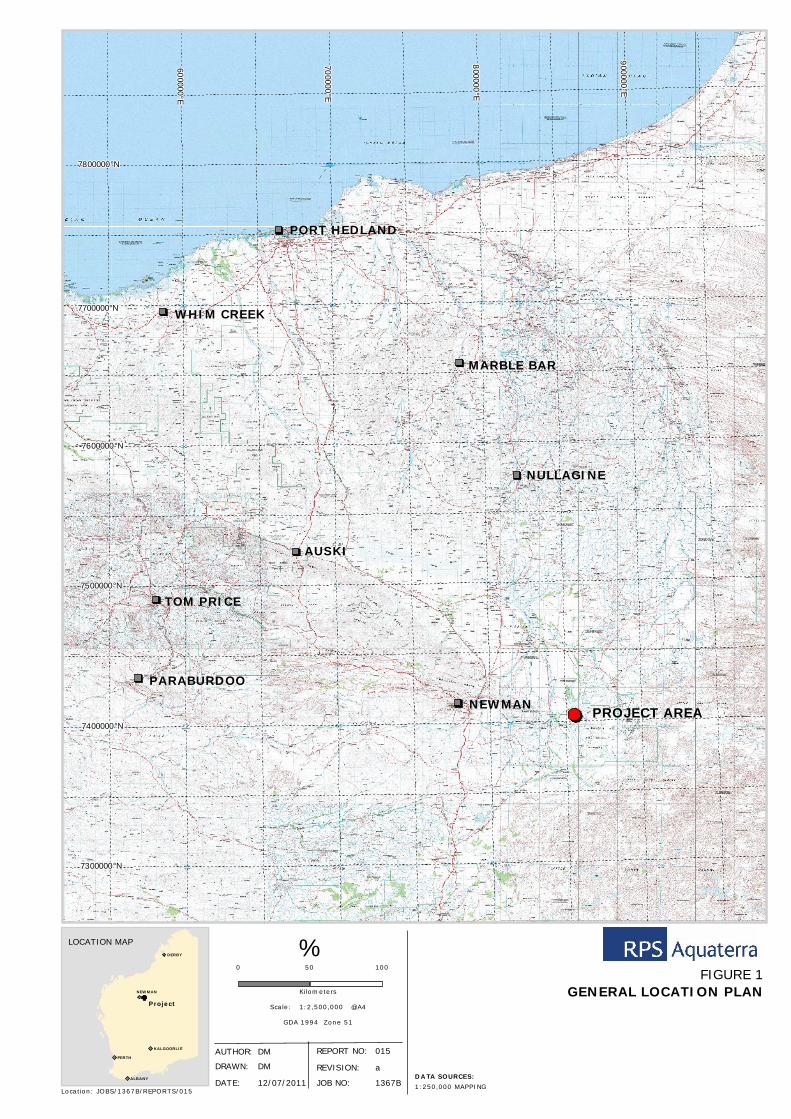
The FerrAus Pilbara Iron Ore Project (FPP) is located on the eastern margin of the Hamersley Province in the Pilbara region of Western Australia, approximately 75km east of the township of Newman, on the northern border of the Jigalong Aboriginal Reserve (Figure 1). The FPP currently comprises three main areas of development, Robertson Range, Davidson Creek and Mirrin Mirrin (Figure 2).
Mirrin Mirrin Creek passes through the Davidson Creek project area, and a diversion is required to enable mining to commence in the area. RPS Aquaterra has previously completed preliminary designs for the diversion of Mirrin Mirrin Creek. As part of the Definitive Feasibility Study (DFS), FerrAus requires the completion of the detailed design of the Mirrin Mirrin Creek diversion.
2. EXISTING ENVIRONMENT
2.1 Regional Surface Water Hydrology
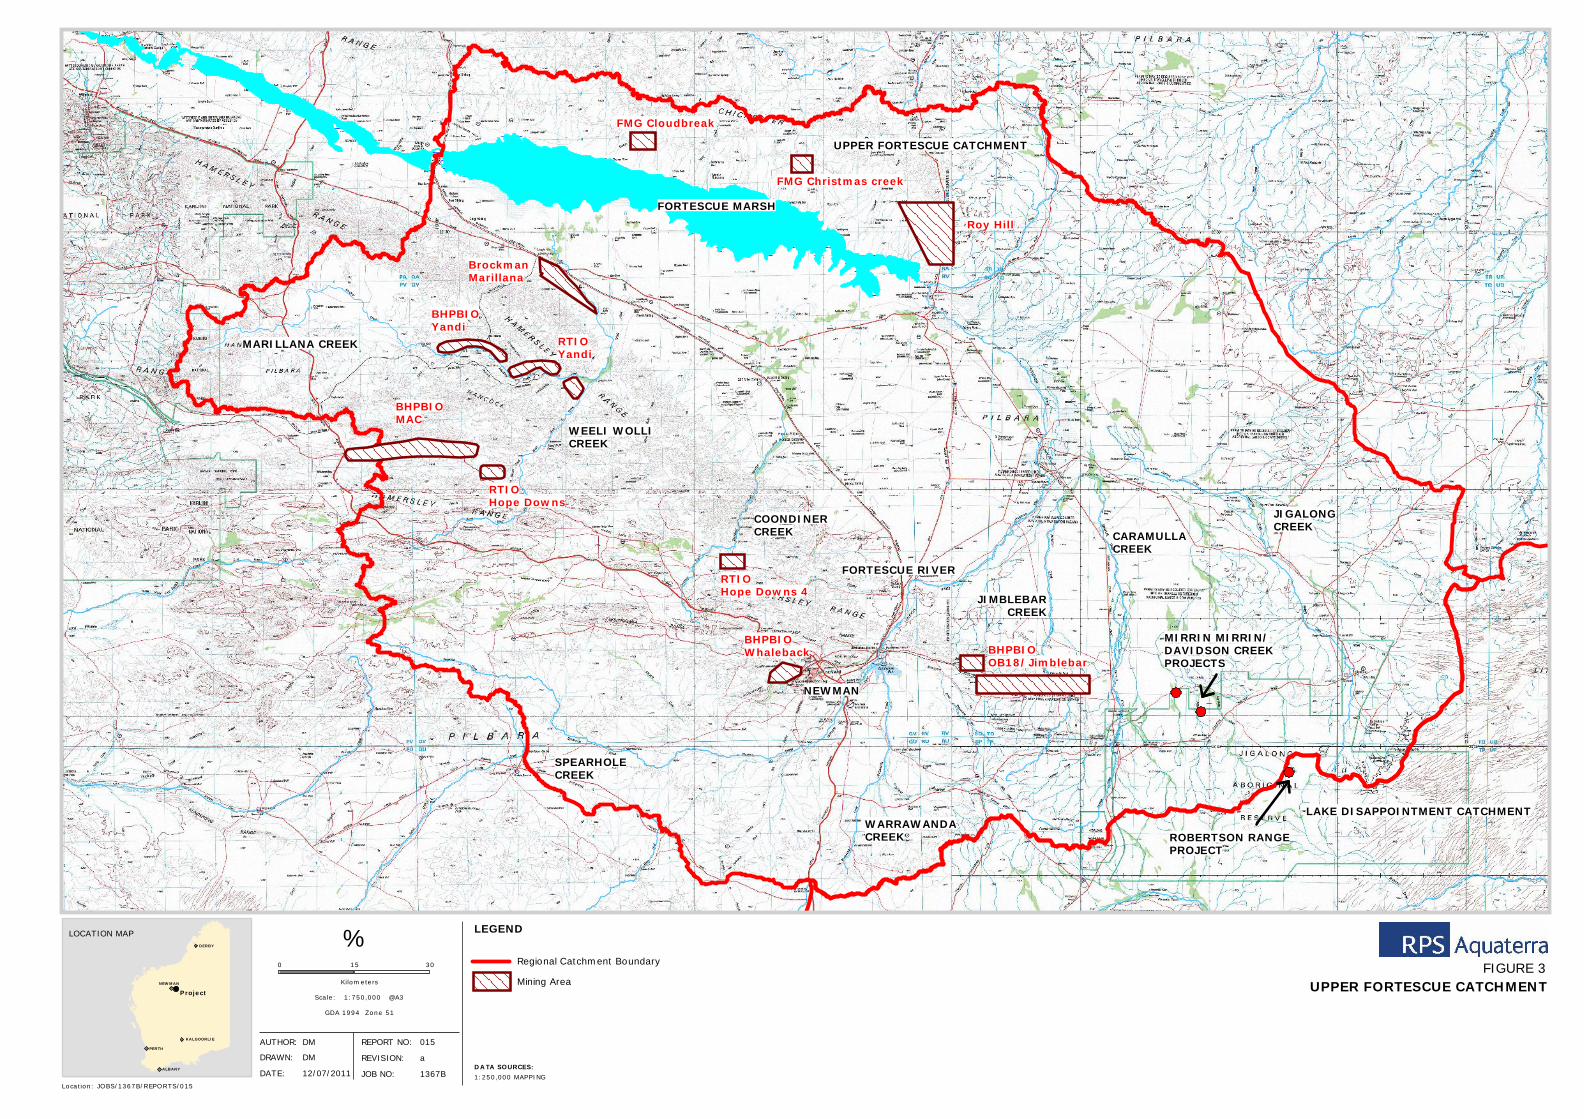
The proposed Mirrin Mirrin and Davidson Creek projects are located within the Upper Fortescue catchment, which comprises an area of approximately 29,800km
2 (Figure 3). The main feature of the
Upper Fortescue catchment is the Fortescue Marsh.
The marsh area is in the physiographic unit known as the Fortescue Valley, and occupies a trough between the Chichester and Hamersley Plateaux (Beard, 1975).
The Goodiadarrie Hills, located on the valley floor just west from the marsh rail crossing, effectively cuts the Fortescue River into two separate river systems. West from the Goodiadarrie Hills, the Lower Fortescue River Catchment drains in a general north-westerly direction to the coast, whereas east of the hills the Fortescue Marsh receives drainage from the Upper Fortescue River Catchment.
Several large creek systems discharge to the Fortescue Marsh. These systems include the Fortescue River, Weeli Wolli Creek, Marillana Creek, Caramulla Creek and Jigalong Creek. The alluvial outwash fan from the Weeli Wolli Creek and other smaller creek systems abutting the Goodiadarrie Hills is believed to
F:\Jobs\1367B\Reports\015\015a.doc Page 2
be partially responsible for this obstruction to the Fortescue River and forming the Fortescue Marsh. The DoW considers the upper portion of the Fortescue River which drains to the Marsh as a closed system.
The Fortescue Marsh is an extensive intermittent wetland acting as a flood storage and occupying an area around 100km long by typically 10km wide, located on the floor of the Fortescue Valley. The marsh has an elevation around 400m AHD. To the north, the Chichester Plateau rises to over 500m AHD, whereas to the south the Hamersley Ranges rises to over 1000m AHD. Following significant rainfall events, runoff from the creeks drains to the marsh. For the smaller runoff events, isolated pools form on the marsh opposite the main drainage inlets, whereas for the larger events the whole marsh area has the potential to flood.
Published topographical mapping indicates that the lower bed levels in the Fortescue Marsh predominantly lie between 400m and 405m AHD. Data provided by the DoW states that the flood level in the marsh would need to be marginally higher than 413m AHD to overspill westwards past the Goodiadarrie Hills. No published flood level data are available for the marsh. Anecdotal evidence suggests that over the last 50 years, following major cyclonic events, flood levels of approx 410m AHD have occurred.
Surface water runoff to the marsh is of low salinity and turbidity, though the runoff turbidity typically increases significantly during peak periods of flooding (WRC, 2000). Following a major flood event (that flooded the whole marsh area), anecdotal data indicates that the water could pond up to 10m depth in the lowest elevation marsh areas. Water stored in the marsh slowly dissipates through the processes of seepage and evaporation. During the evaporation process, the water salinity increases and as the flooded areas recede, traces of surface salt can be seen. During the seepage process, the increasingly more saline water is believed to seep into the valley floor alluvial deposits.
2.2 Local Surface Water Hydrology
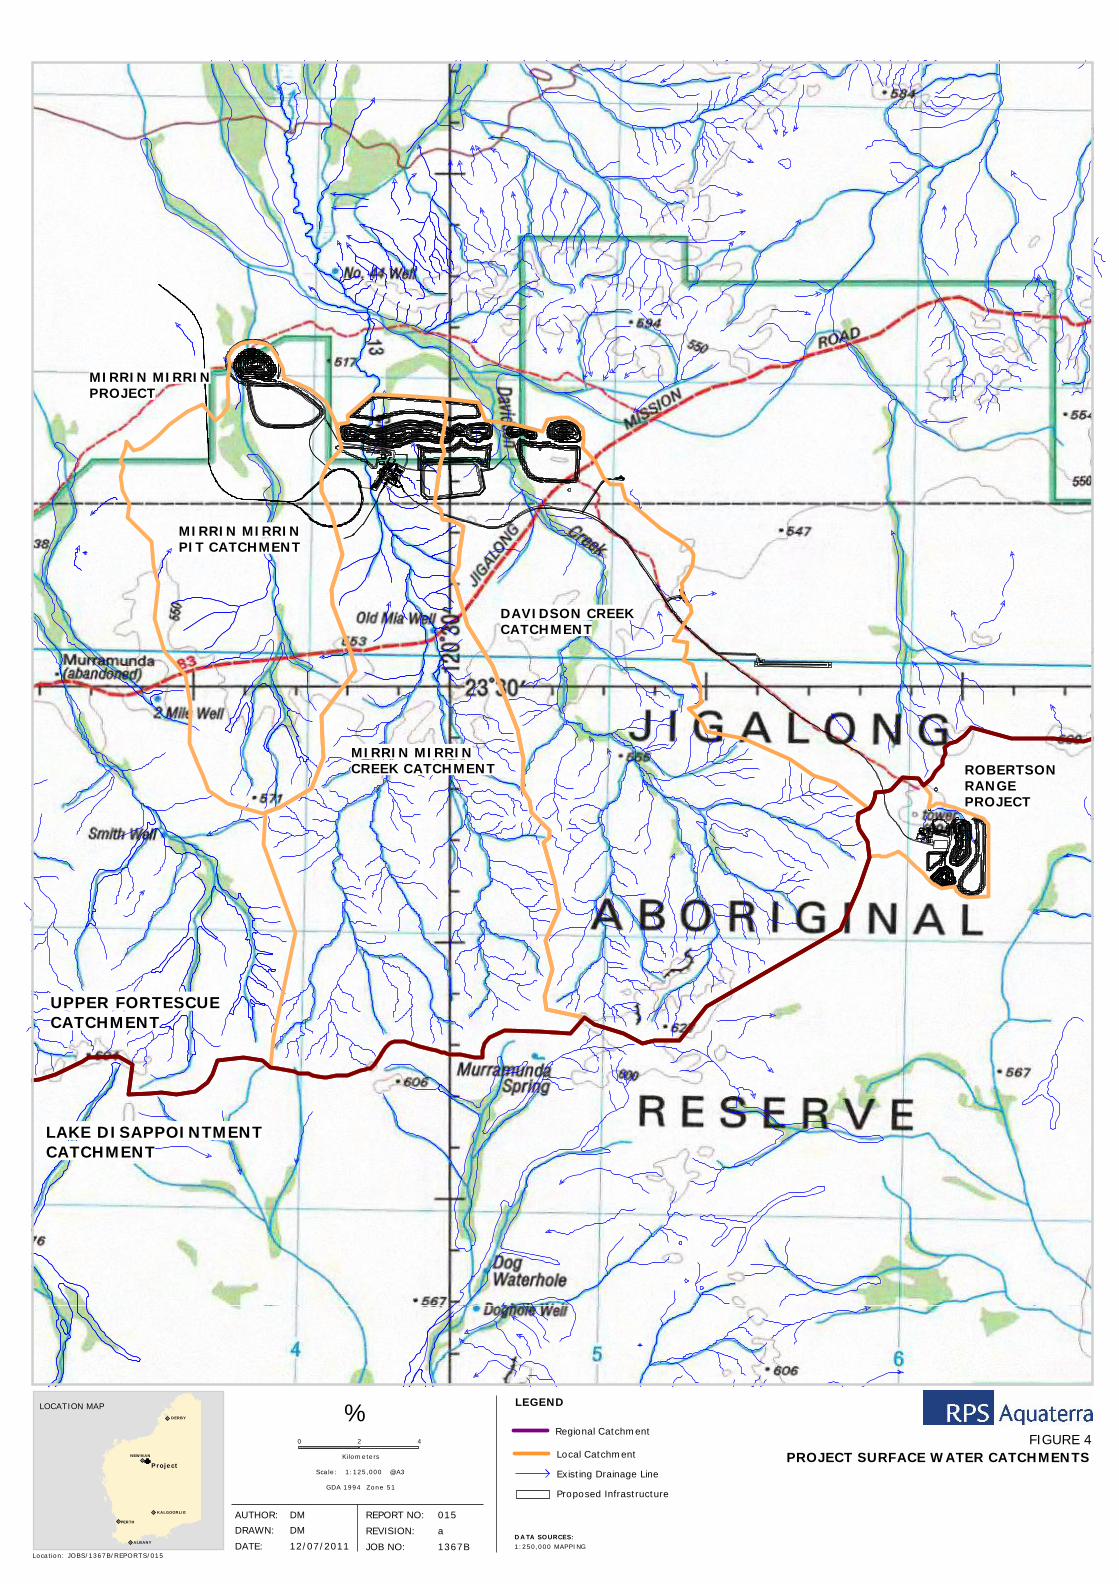
The Davidson Creek and Mirrin Mirrin Creek catchments which impact on the Davidson Creek project are approximately 170km
2 and 150km
2 respectively (Figure 4). The creeks are around 25km in length
upstream of the mining area, have generally relatively flat average bed gradients of around 0.2%, and drain mainly in a northerly direction towards the mining area.
There is a low ridge orientated in an east-west direction immediately to the south of the proposed pits, through which Mirrin Mirrin Creek and Davidson Creek flow. In the vicinity of the proposed pit areas, Mirrin Mirrin Creek generally has a well defined channel approximately 20 to 30m wide (from aerial photography) and is approximately 1m deep. Davidson Creek also has a defined flow channel, although the creek bed is generally braided and narrower than Mirrin Mirrin Creek (from aerial photography).
Immediately downstream from the planned mine development area, the Mirrin Mirrin Creek gradient reduces with wide flow zones and relatively flat gradients that tend to attenuate runoff and reduce peak discharges. Flood flows through this area would typically be shallow and relatively slow moving. Around 15km downstream of the mining area, the incised main channel of Mirrin Mirrin Creek diffuses, and flows from here would be mainly as overland flow.
Mirrin Mirrin Creek and Davidson Creek merge around 5km downstream of the mining area, and continue as Mirrin Mirrin Creek for about 70km before joining Caramulla and Jimblebar Creeks just upstream of the Fortescue River. Jigalong Creek also merges in the same general area (Figure 3). In this merger zone, the natural ground levels are extremely flat and the main flow channels become braided and less defined. Discharges from these main river/creek systems tend to disperse into a wide floodplain and travel via smaller flow channels and as overland flow. Mapping indicates that this floodplain is many kilometres wide. Overall, the Fortescue Marsh is around 135km downstream of the mining area.
2.3 Mirrin Mirrin Creek Geomorphology
The following section has been summarised from the report “Mine Water Options Assessment - Stream Diversions, Thirteen Creek and Davidson Creek” (SKM Draft Report 18/05/11).
2.3.1 General
The fluvial geomorphology of Mirrin Mirrin Creek in the project area can be described at the reach scale as an anabranching channel pattern, typical of the unconfined alluvial setting of the stream, characteristic of many arid regions. Mirrin Mirrin Creek can be classified as ridge-form anabranching, which involves the
F:\Jobs\1367B\Reports\015\015a.doc Page 3
accretion of ridges within an existing channel. Once the ridges have accreted to sufficient height the single channel is divided into multiple channels.
The planform of Mirrin Mirrin Creek can be described as straight, and is likely due to the proportion of sediment carried by bed load in this stream and the tendency for high bed load to reduce channel sinuosity.
The stability of the creek banks (and in-channel ridges) are likely to be dependent on the presence of vegetation, and are likely to respond to changes in geomorphic and hydraulic variables that influence bank stability.
Although the channels of Mirrin Mirrin Creek have a relatively simple trapezoidal morphology, the features that add diversity to the in-channel form include in-channel ridges, point bars and pools, benches, and erosion resistant outcrops. These would be typical of many creek systems within the Pilbara region.
2.3.2 Longitudinal Section
The longitudinal section and stream grades of Mirrin Mirrin Creek in the reach inspected appear to be entirely controlled by alluvial processes. Although outcrops of erosion resistant material were noted in the bed of Mirrin Mirrin Creek, the outcrops were only local features occupying a small proportion of the overall channel width and do not exert a significant influence on the longitudinal section of Mirrin Mirrin Creek.
The existing longitudinal profile of Mirrin Mirrin Creek estimated to be 1.5m/km. In order to create a stable diversion channel, it is preferable for that the grade along the diversion to replicate the existing grade of the current channel as closely as possible.
2.3.3 Bed Morphology and Sediment
The bed form of Mirrin Mirrin Creek is dominated by dunes, which do not tend to have any ripples imposed on them. This provides a qualitative indication that both velocities and sediment transport rates along Mirrin Mirrin Creek are substantial for a low land alluvial river system.
Observations in the field indicate that the calibre of sediment varies from very fine sand through to medium to coarse gravels. The higher calibre sediments are often found in the trough of dunes.
2.3.4 Important Processes
A key consideration in designing a diversion for Mirrin Mirrin Creek is identifying the fluvial processes and characteristics that are important to the maintenance of channel form. These are discussed in relation to the diversion design later in this report.
Flow Energy
The low energy of the flow in these ridge-form anabranching channels is important as it reduces the rate of erosion of stream banks and in-channel ridges. The stream banks and ridges are comprised of loose sand that has low cohesion, which would more susceptible to erosion in a higher energy fluvial environment.
Sediment Transport
The steep-sided nature and the height of the accreted ridges indicates that the sand deposited on the ridges is sourced from suspended load sediment rather than bed load. Hence the availability of fine to medium sand for suspension in the water column is important to the construction of in-channel ridges.
The straight overall planform of Mirrin Mirrin Creek may be in part a symptom of the quantity of bed load moving through this system. Any increase in the sinuosity of Mirrin Mirin Creek and associated lengthening of the stream risks disrupting sediment transport continuity resulting in the aggradation of the bed of the creek at the upstream end of the diversion.
Mud Drapes
Mud drapes on the banks of Mirrin Mirrin Creek were noted on site. These form after a flood on the receding limb of the hydrograph when the lower energy of flows and eddying along the bank face enables silts and clays to settle on the bank face. They are likely to be important to the stability of the creek as the
F:\Jobs\1367B\Reports\015\015a.doc Page 4
mud provides a cohesive layer over the bank that reduces the risk of erosion, and is also likely to improve conditions on the bank face for establishing vegetation.
High Flows and Flow Variability
Flows that are near bankfull or above are probably important to the maintenance and construction of the ridges in the channels, as the substantially lower depths of flow over the ridges during floods and the hydraulic roughness caused by the vegetation along the ridges results in the preferential deposition of sand on ridges.
A range of flows is thought to be important to the success of riparian vegetation all the way up the bank profile.
Cease to flow
The formation of the ridges on Mirrin Mirrin Creek is also likely to be dependent on the system retaining an ephemeral flow regime. The cease to flow provides the opportunity for vegetation to colonise the bed of the channel, which creates a flow shadow along which sediment deposits and further vegetation can establish to commence the process of ridge construction.
Vegetation
Riparian vegetation is important to the physical form of Mirrin Mirrin Creek. Ground cover is important to the stabilisation of banks and ridges, while over storey vegetation and the shrub layer are also likely to be important for bank stability and are critical to the initiation of in-channel ridges. Uprooted vegetation and timber debris allows zones of deposition to form, suitable for the establishment of vegetation.
Vegetation and the associated woody debris that is generated and transported through the system is likely to be an important component of hydraulic roughness and hence critical to the energy of flow in the channel and hence erosion, deposition and sediment transport.
3. PEAK FLOW ESTIMATION
Typical for projects of this nature, the peak 100 year average recurrence interval (ARI) event was selected as the design flow. Several techniques are available for estimating peak flows (for various ARIs), including the following, all of which were used to initially estimate the 100 year ARI peak flow:
1977 Australian Rainfall & Runoff (AR&R) Rational Method;
1987 AR&R Rational Method;
1987 AR&R Index Flood Method;
Revised Index Flood Method (unpublished); and
Rainfall runoff routing programs such as RORB and XPRAFTS.
The RORB model (developed by Monash University and SKM Pty Ltd, Laurensen et al. 2006) is a general rainfall runoff and streamflow routing computer model used to calculate flood hydrographs from rainfall and catchment characteristics. The model adjusts rainfall for catchment losses to produce rainfall-excess, and routes this through conceptual storages (which represent the storage effect of the catchment drainage lines), to produce streamflow hydrographs. Peak flood discharges derived using the RORB model are considered to be more reliable than other estimates, as it takes into account the characteristics of various sub-catchments within the main catchment.
Using the RORB model, it was considered that the “proportional loss” or “runoff coefficient (RoC)” approach for rainfall losses was the most appropriate, based on previous work undertaken in the Pilbara (Dufty 1992, Flavell 1996).
Based on the above, and using design rainfall intensity/frequency/duration (IFD) data for the area, the design peak flows through and downstream of the lease for the 100 year ARI have been calculated using the RORB RoC model. The design 100 year ARI peak flows are estimated as follows:
Mirrin Mirrin Creek at pit boundary: 340 m3/s;
Davidson Creek at pit boundary: 375 m3/s;
Confluence of all creeks downstream of lease: 910m3/s (which includes other catchments).
F:\Jobs\1367B\Reports\015\015a.doc Page 5
By comparison, the 500 year ARI peak flows were estimated for each of the above areas as 651 m3/s,
715 m3/s and 1725 m
3/s respectively.
4. PRE-DEVELOPMENT WATER LEVELS
Flood water levels along Mirrin Mirrin Creek were modelled for the existing pre-development using the HEC-RAS software package.
HEC-RAS is a hydraulic backwater analysis program and was used to simulate flow conditions in the area. The program provides a flow backwater analysis model for open channel and floodplain flow. It computes the water surface elevation at a cross section using an iterative solution of the standard step method (Henderson, 1966). The underlying assumptions implicit in the analytical expressions used in the program are that flow is steady, gradually varied and one dimensional; and channel slopes are small. These assumptions are simplifications of the natural propagation of flow in space and time through a watercourse and the accuracy of the water surface elevations computed is related to the validity of these assumptions. Inputs to the model include flow cross sections, waterway roughness values, peak flow rates and the downstream water level.
The inputs for the model include topographic data to generate model cross-sections (based on topographic data supplied by FerrAus), the design flow (discussed previously), starting water level (based on existing stream bed slope) and channel roughness (varies between channel flow and overbank flow).
The pre-development model cross section locations are shown in Figure 5.
A sensitivity analysis was then performed on the results by separately varying the flow rate and the friction coefficients (+ 50% in each case) and increasing the downstream water level by 1m. The effects on predicted design 100 year ARI flood levels through the project development area were negligible (maximum increase of around 0.3m).
The predicted 100 year ARI peak flow velocities in the natural creek averaged around 1.8m/s, with the highest velocity around 2.7m/s.
The estimated 100 year ARI flood levels are presented in Figure 5, together with a plot of the predicted extent of flooding. It should be noted that the predicted extent of flooding is interpolated manually between cross-sections, so some inaccuracy is likely.
The HEC-RAS model output is summarised in Appendix A.
5. MIRRIN MIRRIN CREEK DIVERSION
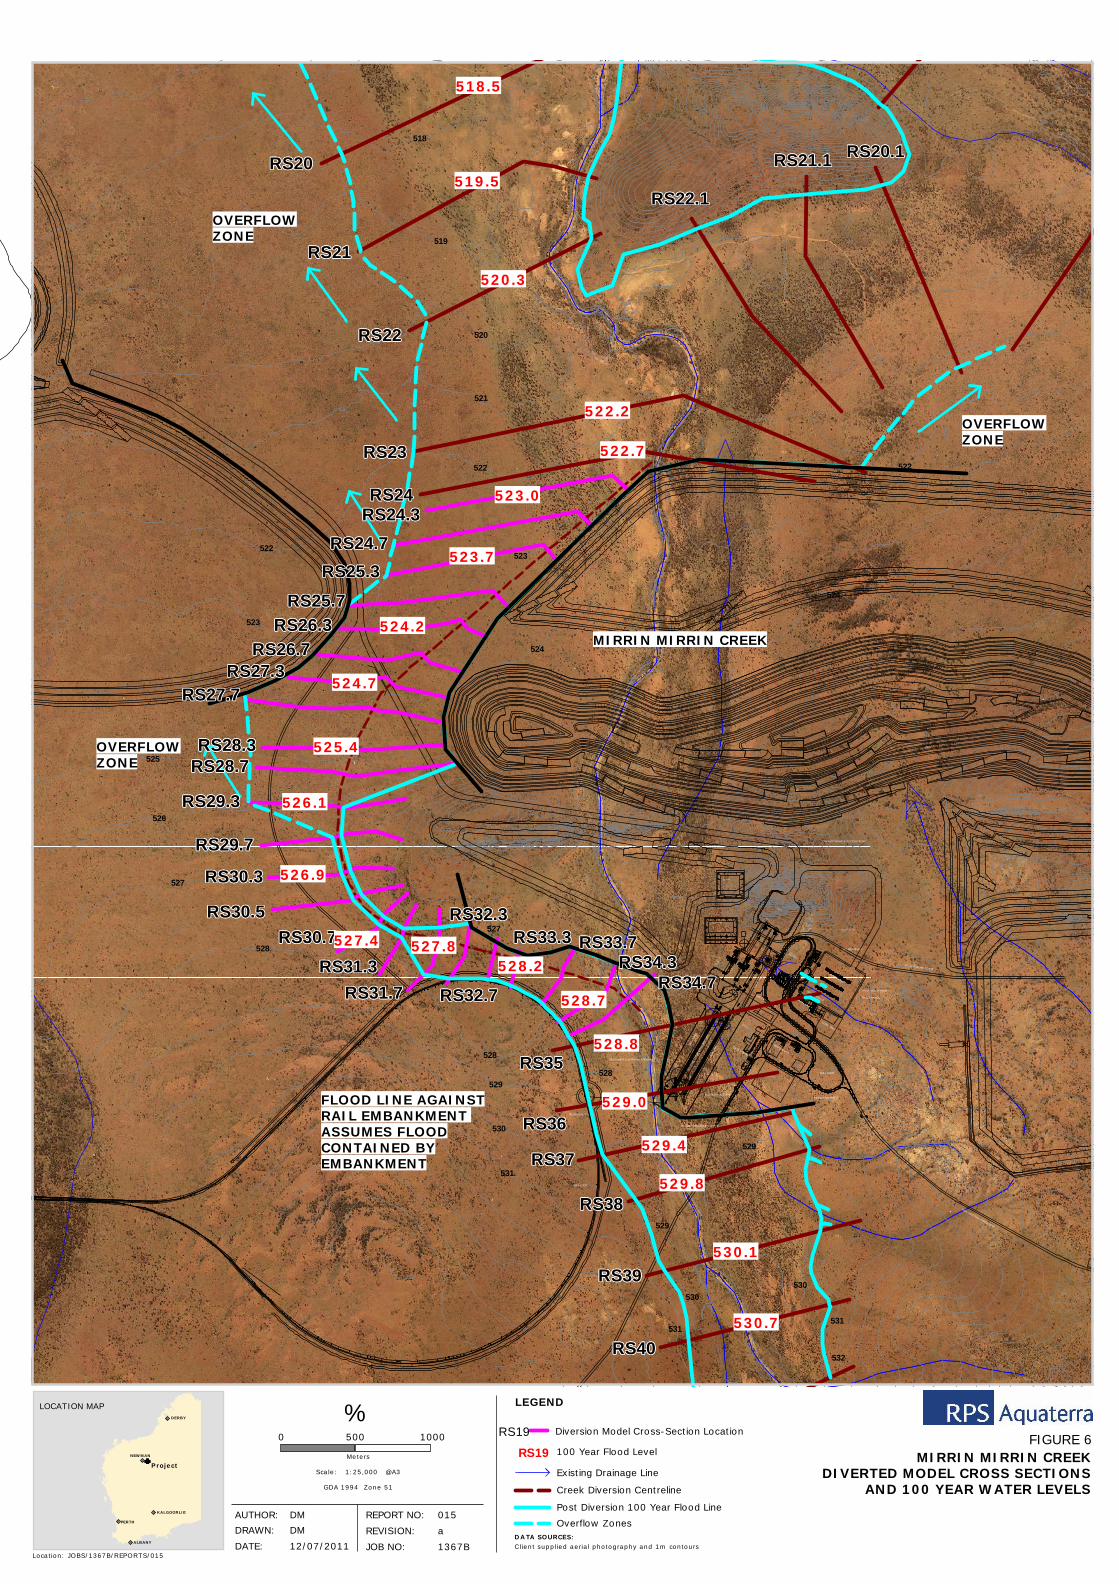
A preliminary design for the diversion of Mirrin Mirrin Creek in the vicinity of the pit area was completed by RPS Aquaterra (Davidson Creek Project - Thirteen Creek Diversion: Preliminary Design, doc. ref. 1009C/061a 14/04/10). As a result of the revised site layout, the proposed Mirrin Mirrin Creek diversion has been slightly relocated and remodelled on an amended route. The proposed centre line of the diversion route is shown on Figure 6, along with the modelled cross- section locations. As before, the proposed diversion cuts through a low ridge around the western side of the pit area.
Similar to our previous design, the function of the diversion channel is to safely divert flood waters from Mirrin Mirrin Creek around the pit and back into Mirrin Mirrin Creek further downstream whilst providing flood protection to the pit and infrastructure area but limiting the impact of the diversion on the environment.
5.1 Hydraulic Design Criteria
Consistent with the previous design, the hydraulic design criteria are as follows, which are discussed in more detail below:
Design Flood – 100 year ARI.
Reproduce pre-development flood levels.
Stable flow profile.
Continuously draining channel.
Limit the disturbance footprint.
F:\Jobs\1367B\Reports\015\015a.doc Page 6
5.1.1 Design Flood – 100 Year ARI
The diversion channel has been designed to protect the pit and plant area from flooding. Industry standard for pit flood defence is to protect against the 100 year ARI flood plus a freeboard. The selected freeboard will depend upon the consequences of overtopping, the degree of certainty of the flood level estimates and the sensitivity of flood levels to flood parameters such as peak discharges and channel roughness. Typically, the minimum recommended freeboard above the 100 year ARI flood would be 1.0m, and can be greater depending on the consequences of failure.
5.1.2 Reproduce Pre-Development Flood Levels
For the design ARI, the diversion channel is designed to reproduce as close as predicted pre-development flood levels and flow regime in Mirrin Mirrin Creek at the upstream end of the diversion channel, to minimise the impact on Mirrin Mirrin Creek. However, the pre-development Mirrin Mirrin Creek and the diversion channel will hydraulically respond differently to different flow events. As such, it will not be possible to fully match pre-development and post development flood levels at all levels of flooding. As the design ARI for the channel is the 100 year ARI event, this event has been adopted to reproduce the pre-development flood level at the upstream end of the channel.
Flood levels in Mirrin Mirrin Creek immediately upstream from the mine development area are predicted not to be changed significantly by construction of the diversion. Similarly, the effects of the diversion on flood levels downstream of the diversion are predicted not to be changed significantly.
In particular, the design will take into account higher frequency rainfall events, and ensure that the diversion will not impact significantly on the frequency of overbank flow, so as to minimise the environmental effects of the diversion.
5.1.3 Stable Flow Profile
The following design criteria have been implemented to ensure the flow profile is stable:
Froude Numbers are less than about 0.9 to ensure the flow is sub-critical and therefore stable as compared with super-critical flow and reduce risk for unstable hydraulic jumps to form.
Peak flow velocities to be preferably similar to natural channel velocities, to give a similar sediment transfer capacity.
Bed slopes should match existing bed slopes unless other factors over-ride.
Bed widths to generally match that of the natural environment unless other factors over-ride.
5.1.4 Continuously Draining Channel
The diversion channel has been designed such that it is continuously draining. However, we note that there is evidence of localised pooling in the existing creek bed, and the detailed design will allow for the creating of small localised pools, whilst generally being continuously draining.
5.1.5 Limit the Footprint of Disturbance
To limit the area of flora loss and visual impact, design of the diversion channel has limited the footprint of disturbance, whilst satisfying all other design constraints. The existing established vegetation will help control the amount of soil erosion during a flood. Disturbing this vegetation with construction of the diversion channel will increase the potential erosion, at least in the short term. Therefore, by limiting the disturbance footprint, the potential for erosion will be reduced.
5.2 Desirable Fluvial Characteristics
The desirable fluvial characteristics to be considered for the diversion design are discussed below:
5.2.1 Flow Energy
The diversion will be deigned to keep velocities as low as practicable, so as to reduce the erosion risk. In addition, bank slopes will be constructed at appropriate batters to further reduce erosion potential.
F:\Jobs\1367B\Reports\015\015a.doc Page 7
Sediment Transport
It is not anticipated that there will be significant change in the suspended sediment load of the creek. It may be difficult to encourage significant material deposition within the deeper sections of the excavated channel due to the confined nature of the section. However at the detailed design stage, localised depressions and additional roughness will be added to the channel bed, to encourage sediment retention and fluvial bed forms to develop.
There will be an increased risk of additional material deposition at the upstream end of the diversion as the slope of the diverted channel is lower than that of the upstream section. However, as both slopes would be considered relatively flat, this risk would be considered low.
Mud Drapes
It is anticipated that the natural mud drapes would form with the diversion and not be adversely impacted by the altered flow characteristics.
High Flows and Flow Variability
Whilst some sections of the diverted channel will fully contain the 100 year ARI flow, the areas downstream have been designed to overflow reasonably regularly. As such, the engineered banks should be exposed to a range of flows, consistent with the current process.
Cease to flow
The diversion design will be essentially continuously draining, and as such the cease to flow regime will be maintained. This will encourage some vegetation growth and fluvial processes.
Vegetation
It is expected that bank vegetation growth would commence relatively quickly, and would assist in bank stabilisation, and would contribute to the initiation of ridges etc over time.
Post construction, or as part of the construction process, fluvial material can be deposited within the diverted creek bed to encourage some of the natural processes initially.
Vegetation growth along the banks and within the main channel will be monitored over the course of the mine life.
5.3 Diversion Modelling
5.3.1 Basic Model Setup
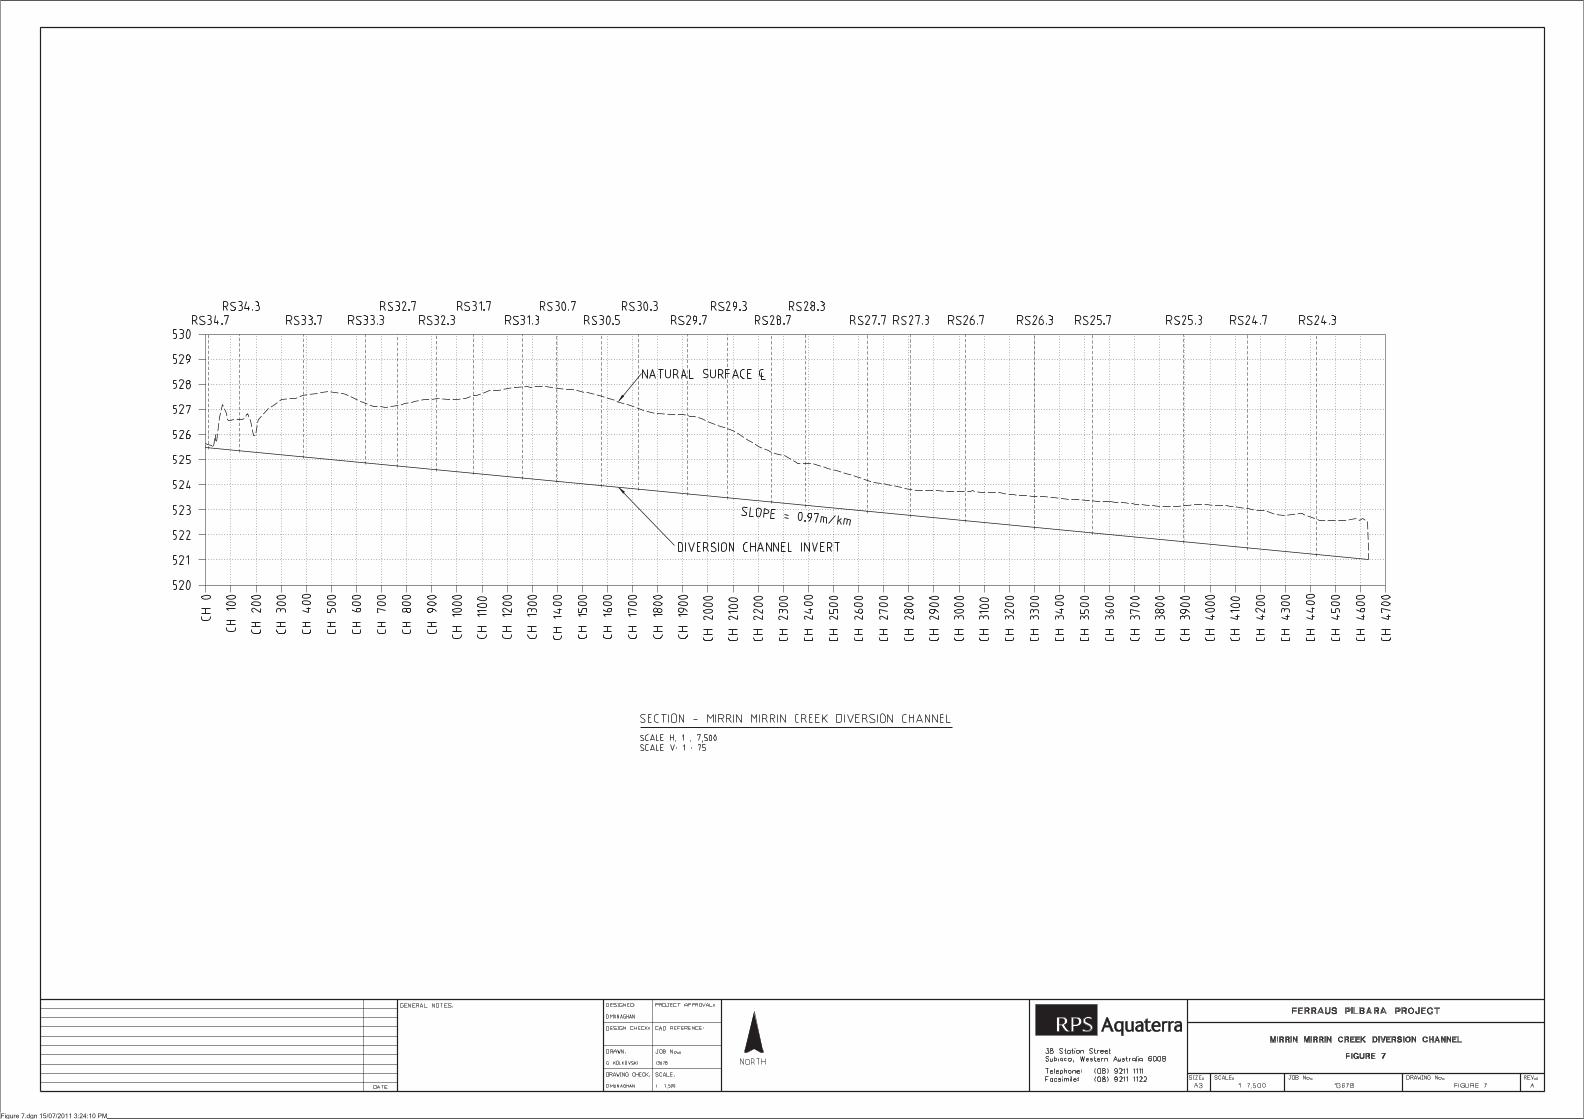
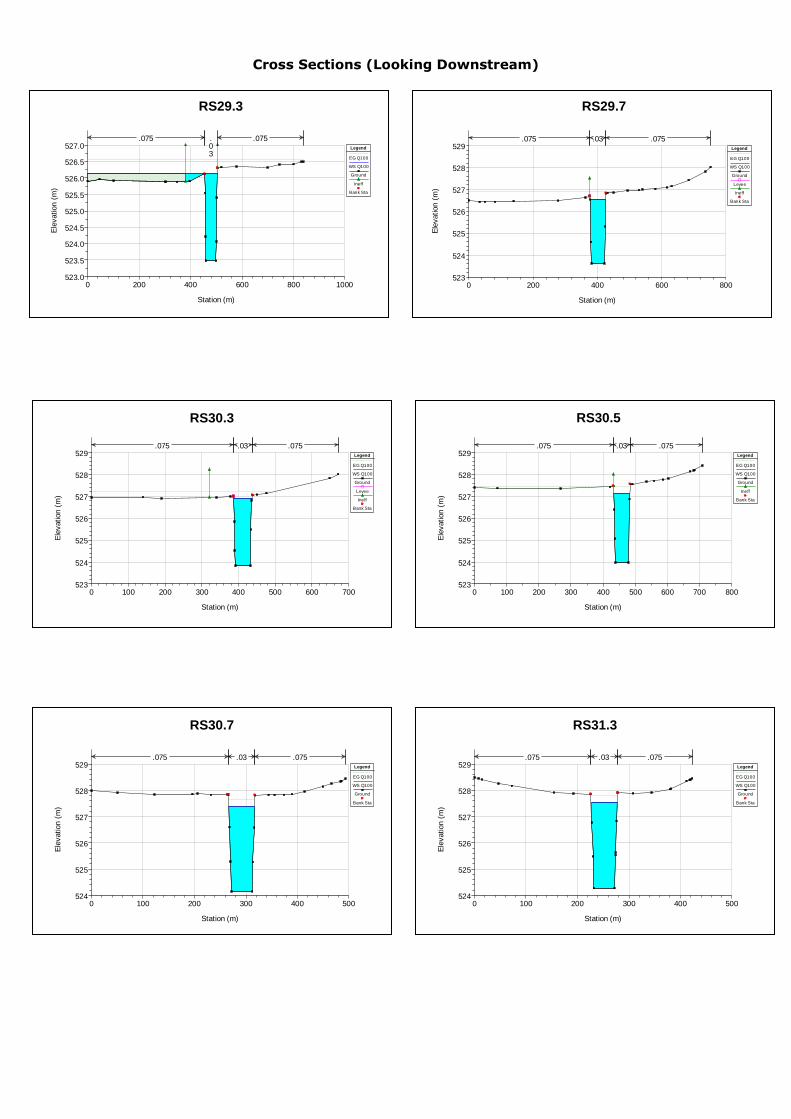
A hydraulic flow model (HEC-RAS) has been developed for the revised diversion design, and the model parameters were varied to largely fulfil the above design criteria. Previous modelling indicated that there was no advantage to varying the channel slope along the diversion route, and as such the selected channel slope for all base modelling was a continuously falling grade of 1.0m/km from the start of the diversion through to joining back in to the original Mirrin Mirrin Creek alignment, as shown on Figure 6 (along with the modelled cross-section locations). This grade is limited by topography, and as the diversion route is longer than the corresponding natural creek channel length, the downstream channel gradient is flatter than the current creek slope, which is estimated at around 1.5m/km. The diversion .long section is shown on Figure 7. It is generally considered that maintaining a uniform channel slope would assist in the hydraulic stability of the channel.
The basic shape of the modelled diversion channel is that of a trapezoid, with side slopes of 1.5H:1V extended up to natural ground levels. Given the geotechnical uncertainties of the material to be excavated at present, this is a reasonable compromise between the softer material that will in reality require 2.5H:1V side slopes, and potentially harder material at depth that may only require 1H:1V (or steeper) side slopes. It is also a conservative approach to the modelling.
5.3.2 Modelling Results
With the fixed and relatively flat creek diversion route, adjusting the channel base width provides the only real means to keep velocities within acceptable limits, and controlling upstream water levels.
F:\Jobs\1367B\Reports\015\015a.doc Page 8
A number of channel base widths were modelled with a view to seeing the impacts on water levels and velocities at various model cross sections for the 100 ARI peak flow rate. These base widths were nominally 30m, 40m and 50m.
It became apparent that in the downstream third of the diversion drain route that increasing the drain base width had minimal impact on flood levels in the area, due mainly to the relatively shallow depth of the drain in this area (i.e. relatively regular flood events would overtop the main diversion channel and would become overbank flow – consistent with the characteristics of the natural creek). Table 1 below summarises some of the model outputs at selected cross-sections to illustrate this point.
Table 1: Effect of Diversion Base Width on Downstream Reach Water Levels
Cross-Section 30m Base Width 40m Base Width 50m Base Width
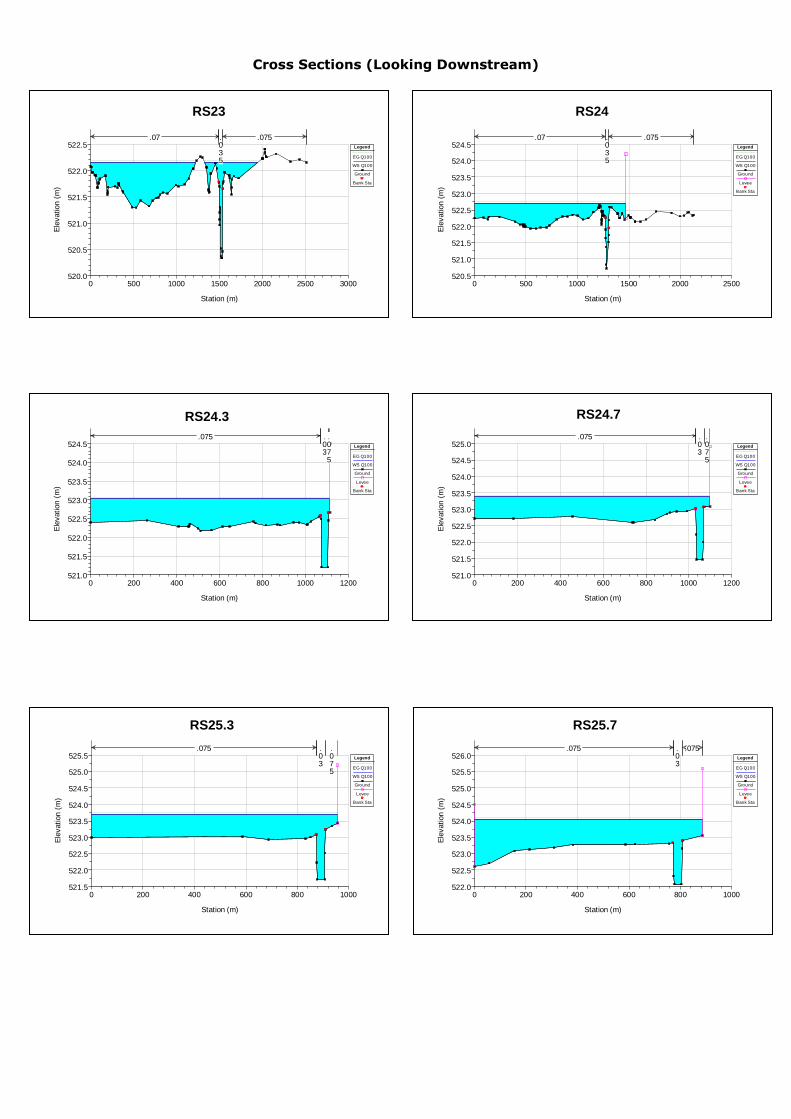
RS27.7 RL524.9m RL524.8m RL524.8m
RS25.7 RL524.1m RL524.0m RL524.0m
RS24.3 RL523.0m RL523.0m RL523.0m
Based on the above, it was decided to adopt the 30m base width option for the downstream third of the diversion drain design. The modelling also indicates that at most areas through this section, flows including and greater than the 5 year ARI event would largely overflow the main channel (consistent with the characteristics of the natural creek), which would limit the environmental impacts of the diversion. For all of the above base widths, the 100 year ARI velocities in the lower reach main channel are relatively low, with an average of around 1.6m/s, and a maximum of 2.2m/s.
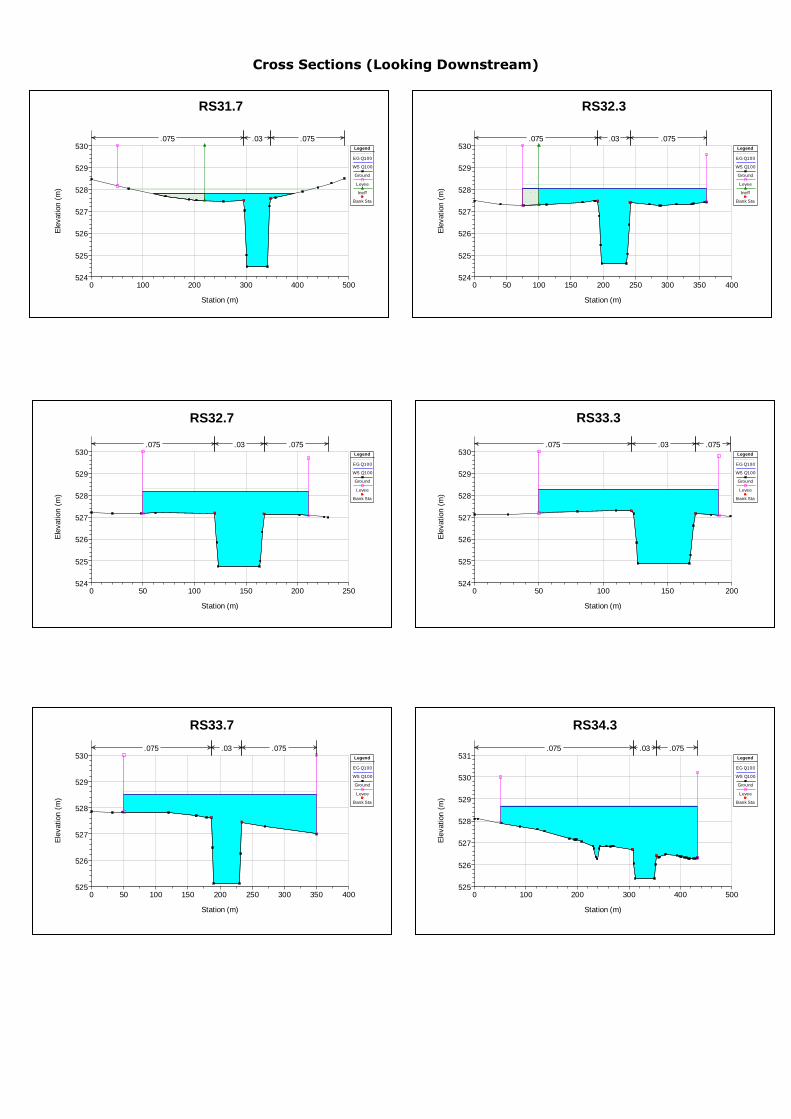
For the remainder of the diversion channel, the model outputs at key locations (plant area, main flood protection bund), as well as other non-critical locations were compared for the various base channel widths. The results are summarised in Table 2 below.
Table 2: Effect of Diversion Base Width on Upstream Reach Water Levels
Cross-Section 30m Base Width 40m Base Width 50m Base Width
RS37 RL529.5m RL529.4m RL529.4m
RS36 RL529.2m RL529.0m RL528.8m
RS34.3 RL529.1m RL528.7m RL528.4m
RS33.3 RL528.7m RL528.3m RL527.9m
RS32.3 RL528.6m RL528.0m RL527.6m
RS31.3 RL528.1m RL527.6m RL527.2m
RS30.5 RL527.5m RL527.1m RL526.8m
RS29.7 RL526.8m RL526.5m RL526.3m
RS29.3 RL526.1m RL526.1m RL526.0m
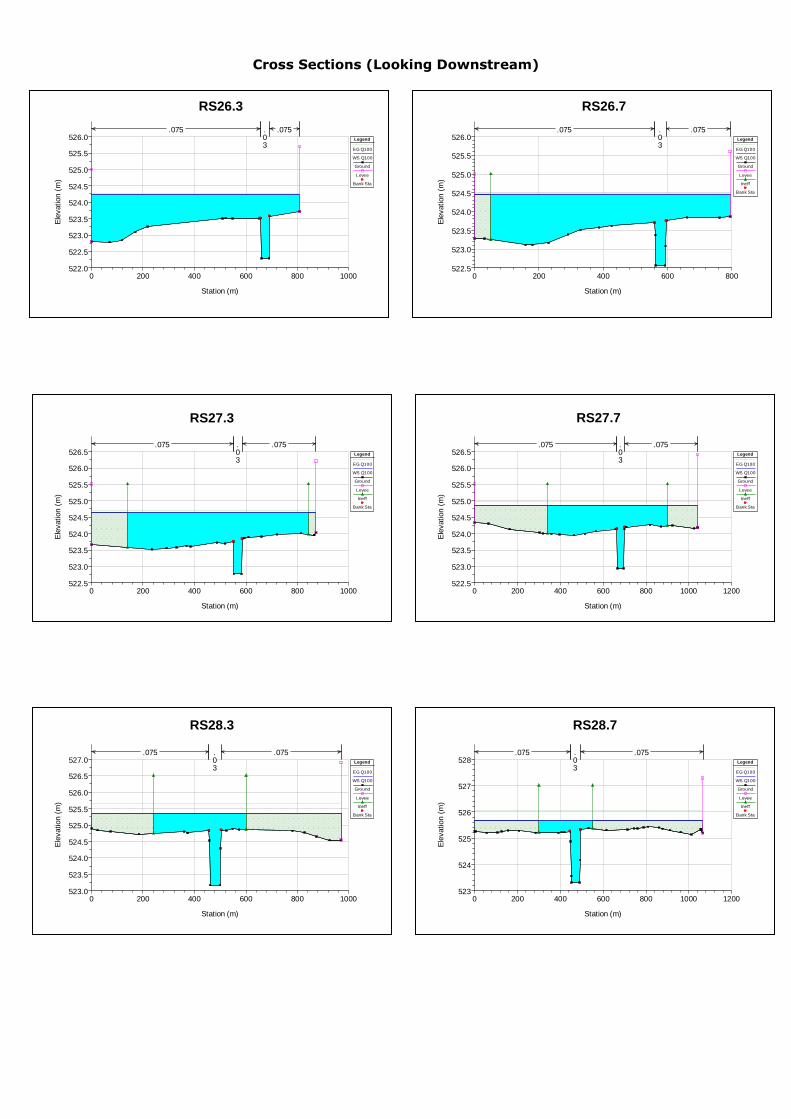
RS28.3 RL525.4m RL525.3m RL525.2m
It can be seen from the table above that the water level differences at RS37 and RS36 (located upstream of the diversion, but impinged by the plant flood protection bund) are minimal for the various diversion base widths. However, in areas where the 100 year ARI flows are largely confined within the excavated channel, the potential water level difference could be up to 1.0m (RS32.3). In order to quantify the impacts of one design width over another, the excavation volumes for each of the options was estimated, and compared to the earthworks required for the associated plant flood protection bund. For each option, the bund design assumed a freeboard of 1.5m over the 100 year ARI water level, a crest width of 3m, and side batters of 2.5H:1V. The results are summarised in Table 3 below.
F:\Jobs\1367B\Reports\015\015a.doc Page 9
Table 3: Earthworks Volumes for Various Channel Designs (m3)
Cross-Section 30m Base Width 40m Base Width 50m Base Width
Diversion Excavation 316,400 410,200 504,000
Bund Fill 86,100 70,300 59,700
As expected, the narrower base width diversion requires the least volume of material to be removed, but due to the higher water levels requires a greater volume of earthworks for the plant flood protection bund.
As discussed previously, it was decided to design the downstream third of the diversion with a base width of 30m (from RS27.7 downstream to where the diversion re-joins its original alignment). The modelling indicated that the velocities for the 100 year ARI event using the 30m base width for the next few cross-sections (RS28.3 up to RS29.7) were too high at over 3.0m/s. For these cross-sections, velocities are more acceptable using a channel base width of 40m (below 3.0m/s). Using a base width of 50m would decrease water levels by a further 0.1 to 0.2m at these cross-sections.
Moving upstream, the peak 100 year ARI water levels in cross-sections RS30.3 through to RS31.3 are fully confined within the excavated channel regardless of whether 40m or 50m base widths are used. As such, it was decided to adopt a 40m channel base width for cross-sections RS31.3 through to RS28.3.
Moving further upstream through the remainder of the modelled diversion cross-sections, it was decided that the water level reductions (around 0.3 to 0.4m) by increasing the channel base width from 40m to 50m could not be justified as the additional earthworks required for increasing the bund height was far less than the additional channel excavation requirements.
In summary, the recommended diversion channel design is 40m base width from the commencement of the diversion to RS28.3, from which point it reduces down to 30m base width and continues for the remainder of the diversion.
The required excavation earthworks for this option is approximately 382,000m3, with an associated plant
flood protection bund volume of approximately 69,000m3, which compares favourably to the other volumes
summarised in Table 3.
The 100 year ARI peak flow velocities in the diversion channel average around 1.9m/s, with the highest velocity around 2.9m/s.
It should be noted that at the time of writing, there is a possible discrepancy between the topographic data used for the diversion (and plant) design and the rail loop. As such, the rail loop formation levels could not be verified. The model conservatively assumed that the 100 year flood level would be contained on the west side of the diversion by the rail embankment. If the rail embankment is subsequently designed with a lower formation, it will not contain the 100 year flood, and peak flood levels may drop. At this point, it is not possible to accurately inform the rail designers as to the expected water level in the vicinity of the rail loop, or the velocities of overbank flow that may flow parallel to the rail embankment (although it would be expected to be less than 0.5m/s).
The modelling indicated that post-diversion upstream 100 year ARI water levels have returned to those of the pre-diversion water levels by model cross-section RS39. Similarly, downstream of the diversion, post-diversion 100 year ARI water levels are the same as the pre-diversion water levels model cross-section by RS23. However, design peak 100 year flood levels in the creek adjacent to the plant site are estimated to increase due to the diversion and bunding construction with an increase by up to around 1.0m at the entrance to the diversion channel.
The modelling also indicates that from cross-section RS27.3 downstream, flows including and greater than the 5 year ARI would overflow the banks, which would assist in maintaining the current environmental surface water regime of the area.
The full details of the model output for the chosen Mirrin Mirrin Creek diversion design is contained in Appendix B. The 100 year ARI peak flood levels are shown on Figure 6.
By way of a sensitivity analysis, the peak 500 year ARI flow was also modelled (around 90% additional peak flow over the 100 year ARI peak event). The results show that water levels rose by around an average of 1.1m in the vicinity of the plant flood protection bund, indicating that a 1.5m freeboard is likely
F:\Jobs\1367B\Reports\015\015a.doc Page 10
to be adequate. Further downstream, water levels increased by an average of 0.4m in the vicinity of the pit and waste dump, indicating that a freeboard of 1.0m would be adequate.
5.3.3 Discussion
The above channel design is a practical compromise between the main purpose of the diversion channel, the economics of the construction, and the environmental impacts. The design is largely in keeping with the design criteria, namely:
Designed for the peak 100 year ARI event.
Flood levels upstream and downstream of the diversion will be largely unchanged.
Stable flow profile (Froude numbers are low and a similar range of pre and post development flow velocities).
The channel is continuously draining.
Disturbance footprint has been minimised.
The model sensitivity was tested by modelling the 500 year ARI peak flow through the diversion. In this case, the maximum increase in water levels was around 1.1m in the vicinity of the plant flood protection bund, and 0.4m in the vicinity of the pit and waste dump. Minimum freeboard allowances of around 1.5m in the vicinity of the plant and 1.0m in the vicinity of the pit and waste dump would adequately protect the project area.
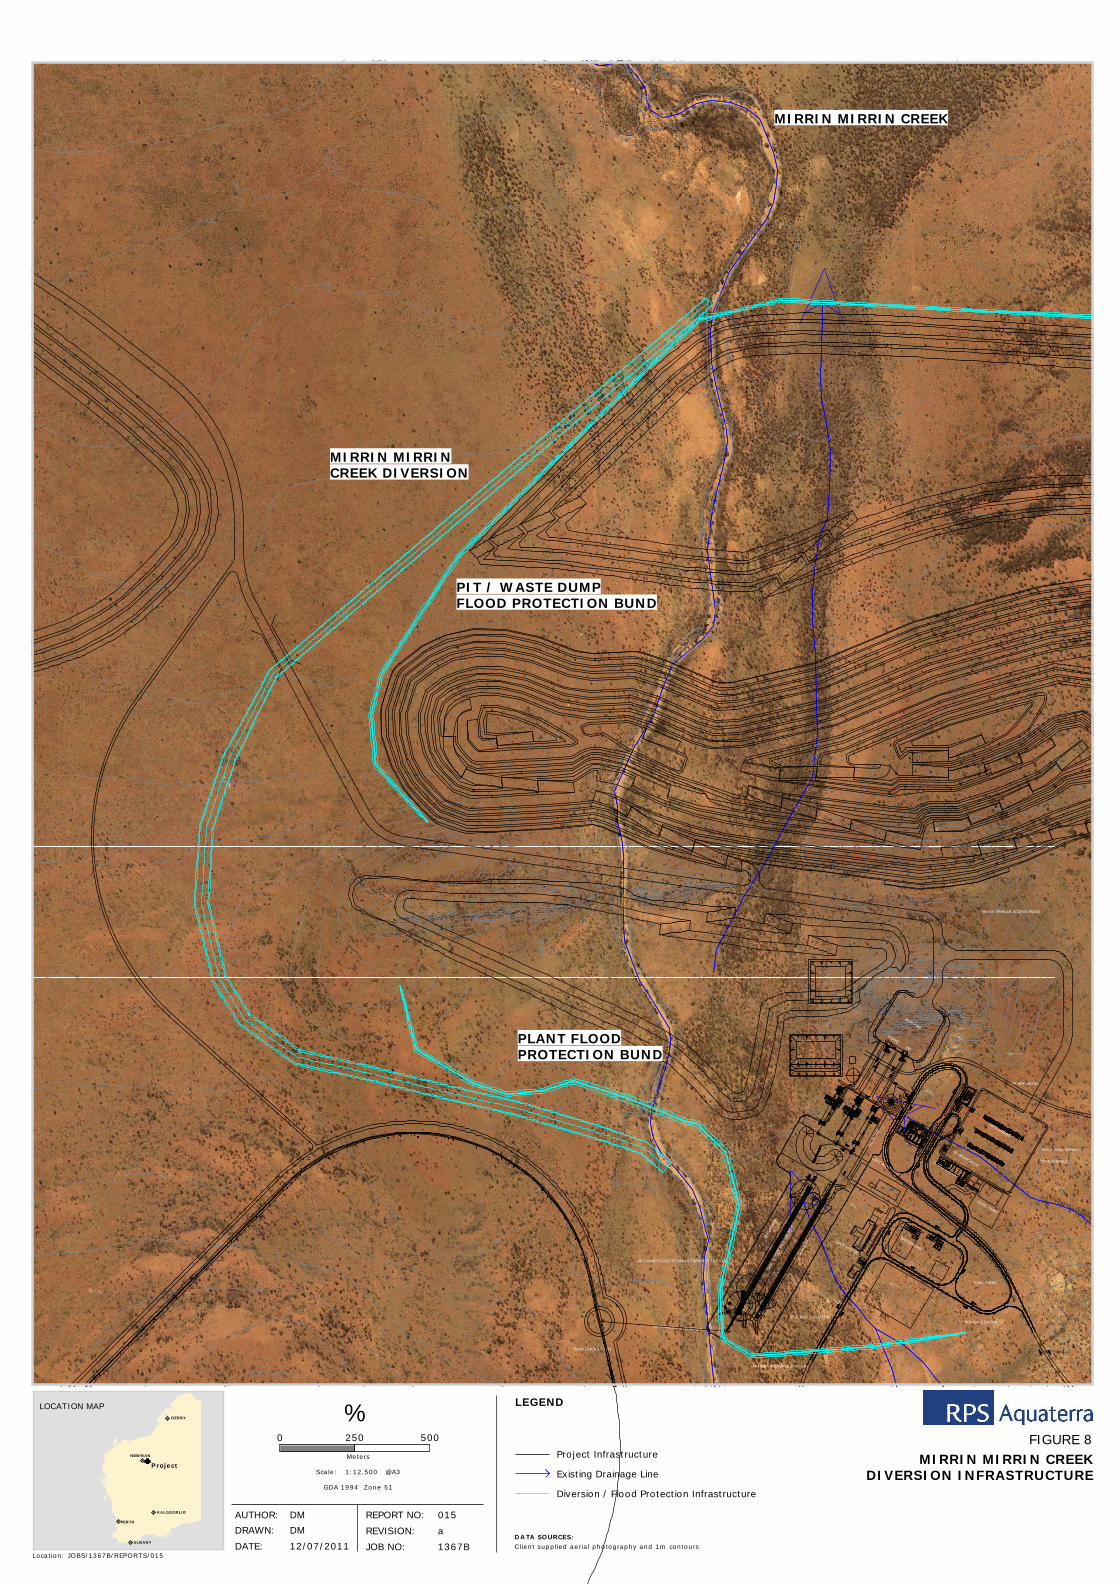
The footprint of the required diversion drain excavation and associated flood protection infrastructure is shown on Figure 8.
It is generally accepted that it is difficult to replicate completely the fluvial processes that occur naturally in creeks within a man-made diversion. Due to space constraints, it is not possible to recreate the existing creek and associated floodplain, particularly as much of the diversion is impinged by infrastructure. Some sections of the diversion channel are relatively deep, and may require excavation through harder ground. It is likely to be difficult to encourage natural fluvial processes to occur in this area. Hence it is important that the areas downstream of the deeper section, and those areas immediately upstream and downstream of the diversion are not adversely affected.
With the proposed diversion design, natural fluvial processes are expected to slowly develop within the channel and associated floodplains. The inclusion of localised depressions and roughness will encourage sediment and water to be retained within the channel bed and the growth of some vegetation.
6. SUMMARY AND CONCLUSION
The Mirrin Mirrin Creek diversion has been re-designed based on the limitations of lease boundaries, and revised infrastructure plans. The design adequately addresses all the hydraulic requirements and desirable fluvial processes for the diversion, and it is expected that there would be minimal environmental impact.
We recommend proceeding with the design to DFS standards based on the contents of this interim design memo. We look forward to your review of this report and in particular we would appreciate any comments and feedback regarding localised modifications to the design of the creek bed with regard to the excavation of local low points, the use of existing bed material to re-line the diverted creek bed, etc.
We trust this memo meets your current requirements, but should you have any queries regarding any of the content, please do not hesitate to contact the undersigned.
Yours sincerely, RPS Aquaterra
Daragh Vince
Daragh Monaghan Vince Piper Principal Water Resources Engineer Senior Principal Water Resources Engineer