37
1 Method validation and verification W. W. Wong Senior Accreditation Officer HKAS 20 November 2009

1
Method validation and verification
W. W. WongSenior Accreditation Officer
HKAS20 November 2009
2
Method Validation
• What is it?• When is it required?• Why is it necessary?• What are required?• How much is adequate?• How should it be done?

3
Method Validation – what are required
Validation of methods (cl. 5.4.5.3 )The range and accuracy of the values
obtainable from validated methods (e.g.• Uncertainty of results• Detection limit• Selectivity• Linearity• Repeatability• Reproducibility• Robustness/cross-sensitivity
4
HOKLAS SC No. 37 “Food” Test Category – Chemical Testing
• Being commented by AAB WP on Food (today is the last day for comment)
• Will be published very soon• Contains criteria specific to food testing• With a view to assist labs• In particular, method validation and sample
preparation

5
HOKLAS SC No. 37 Section 5.3 Validation of methods
• Screening methods: <5% false compliant rate at level of interest
• More stringent may be required for some applications

6
Confirmation of identity
• Mass spectrometric detection
+50%+50%<10%%+30%+20%>10% to 20%+25%+15%>20% to 50%+20%+10%>50%
CI-GC-MS, GC-MSn, LC-MS, LC-MSn
EI-GC-MS (relative)
Relative intensity(% of base peak)
7
Limit of DetectionxLD = 3sO + xBl
Where
xLD is the limit of detection
sO is the SD of the outlier free result of a matrix blank sample. should be based on at least 10 independent completedeterminations of analytes concentration in a typical matrix blank or low-level material, with no censoring of zero or negative results.
xBl is the mean concentration of the matrix blank

8
Limit of QuantificationThe limit of quantification represents a
concentration of the determinand that can
reasonably be determined with an acceptable
level of accuracy. Usually it is arbitrarily taken
as a fixed multiple of the detection limit.

9
Limit of Quantification
Estimated by:
xLQ = 3xLD
The factor k=3 corresponds to a relative result
uncertainty of approximately 33%.

10
Limit of QuantificationAOAC
• smallest amount of analyte in a test sample that can be
quantitatively determined with suitable precision and
accuracy under previously established method conditions.
• It is often taken as the blank value plus 10 times the std
dev.

11
Reporting limits
• Set at a level at which quantitative results may be obtained with a specified degree of confidence
• Limits of detection and reporting shall be verified.

12
Reporting limitsISO/TS 13530:2009• RL is a specific concentration at or
above the limit of quantification that is reported to the client with a certain degree of confidence. It is often defined on a project-specific basis. If the RL is set below the limit of quantification by the client, method modification is required.

13
Reporting limits
ISO/TS 13530:2009• For verification of limit of detection
and limit of quantification, spiked blank matrix samples at these concentration levels and blank matrix samples shall be analysed in the same manner as real samples.

14
Reporting limits
ISO/TS 13530:2009• If the uncertainty of results for the
samples spiked at the limit of quantification level is smaller than or equal to the relative precision corresponding to the factor k, the limit of quantification is verified.

15
Reporting limitsISO/TS 13530:2009Δx = 1xLQ k
whereΔx = t .s/ √n
k is the factor for calculating the limit of quantification as a multiple of detection, here: k=3

16
Reporting limits• In essence, the laboratory needs to provide
supporting data that, at the reporting limit, the measurement uncertainty (including bias and precision) meets the acceptance criteria.
• The direct method is to find the recovery and RSD at the reporting limit and compare them with the acceptance criteria.

17
Recommended LOD and LOQ
ML= specified maximum and/or minimum level
For ML ≧ 0.1 mg/kg, LOD ≦ML X 1/5For ML < 0.1 mg/kg, LOD ≦ML X 2/5
LOQ
For ML ≧ 0.1 mg/kg, LOD ≦ML X 1/10For ML < 0.1 mg/kg, LOD ≦ML X 1/5
LOD

18
Recommended Recovery
40-1201µg/kg60-11510µg/kg80-110100µg/kg80-1101mg/kg80-11010mg/kg90-107100mg/kgRecovery (R)95-105≧ 0.1% (1mg/g)97-103≧ 1% (1g/100g)98-102≧ 10% (10g/100g)98-102100%(100g/100g)
Recovery (%)Unit

19
Precision
AOAC Official Methods of Analysis (2005)Appendix E: Laboratory Quality AssuranceCommon values of within lab precision
2010ppb101ppm50.01%21%1100%
RSDrConcentration

20
Estimation of standard deviation by mean range
s = R/d2
d2 is 1.128 for duplicateR is the mean range of the duplicates
21
Range of food matrices
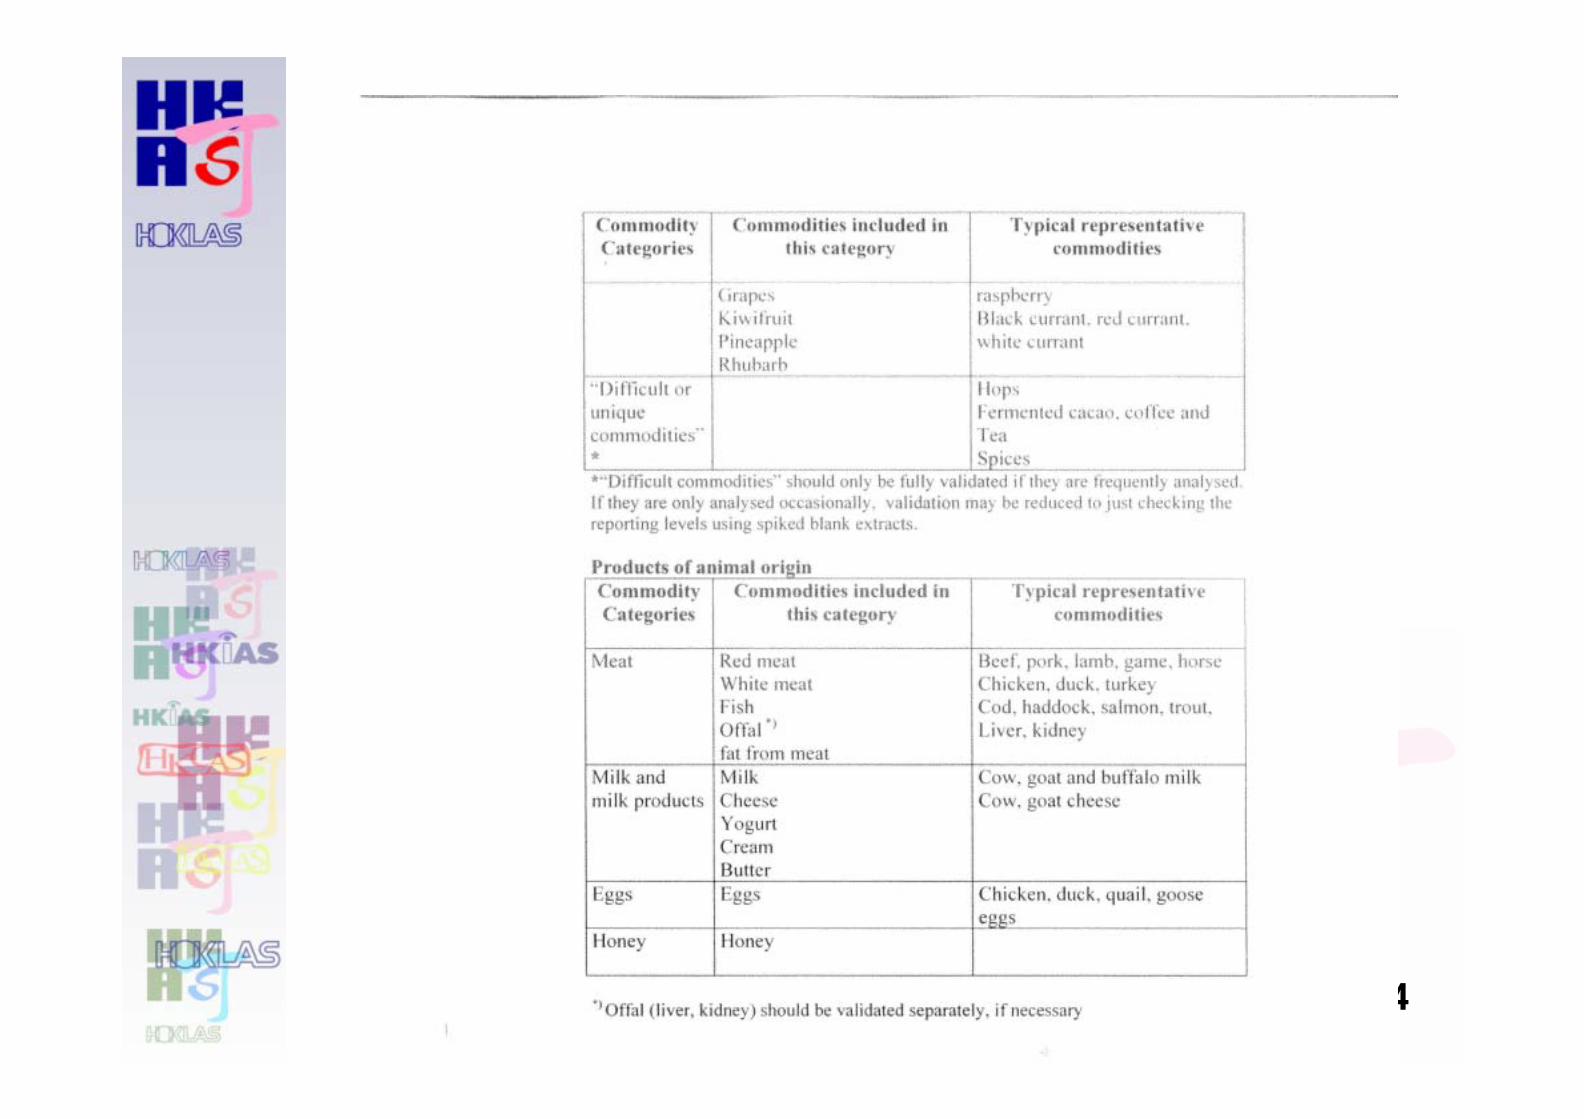
• If a method is to be accredited under “general foodstuffs”, satisfactory validation data shall be obtained for at least five different food matrices (protein, carbohydrate, oil, dietary fibreand water) with at least three food types representative of each food matrix.
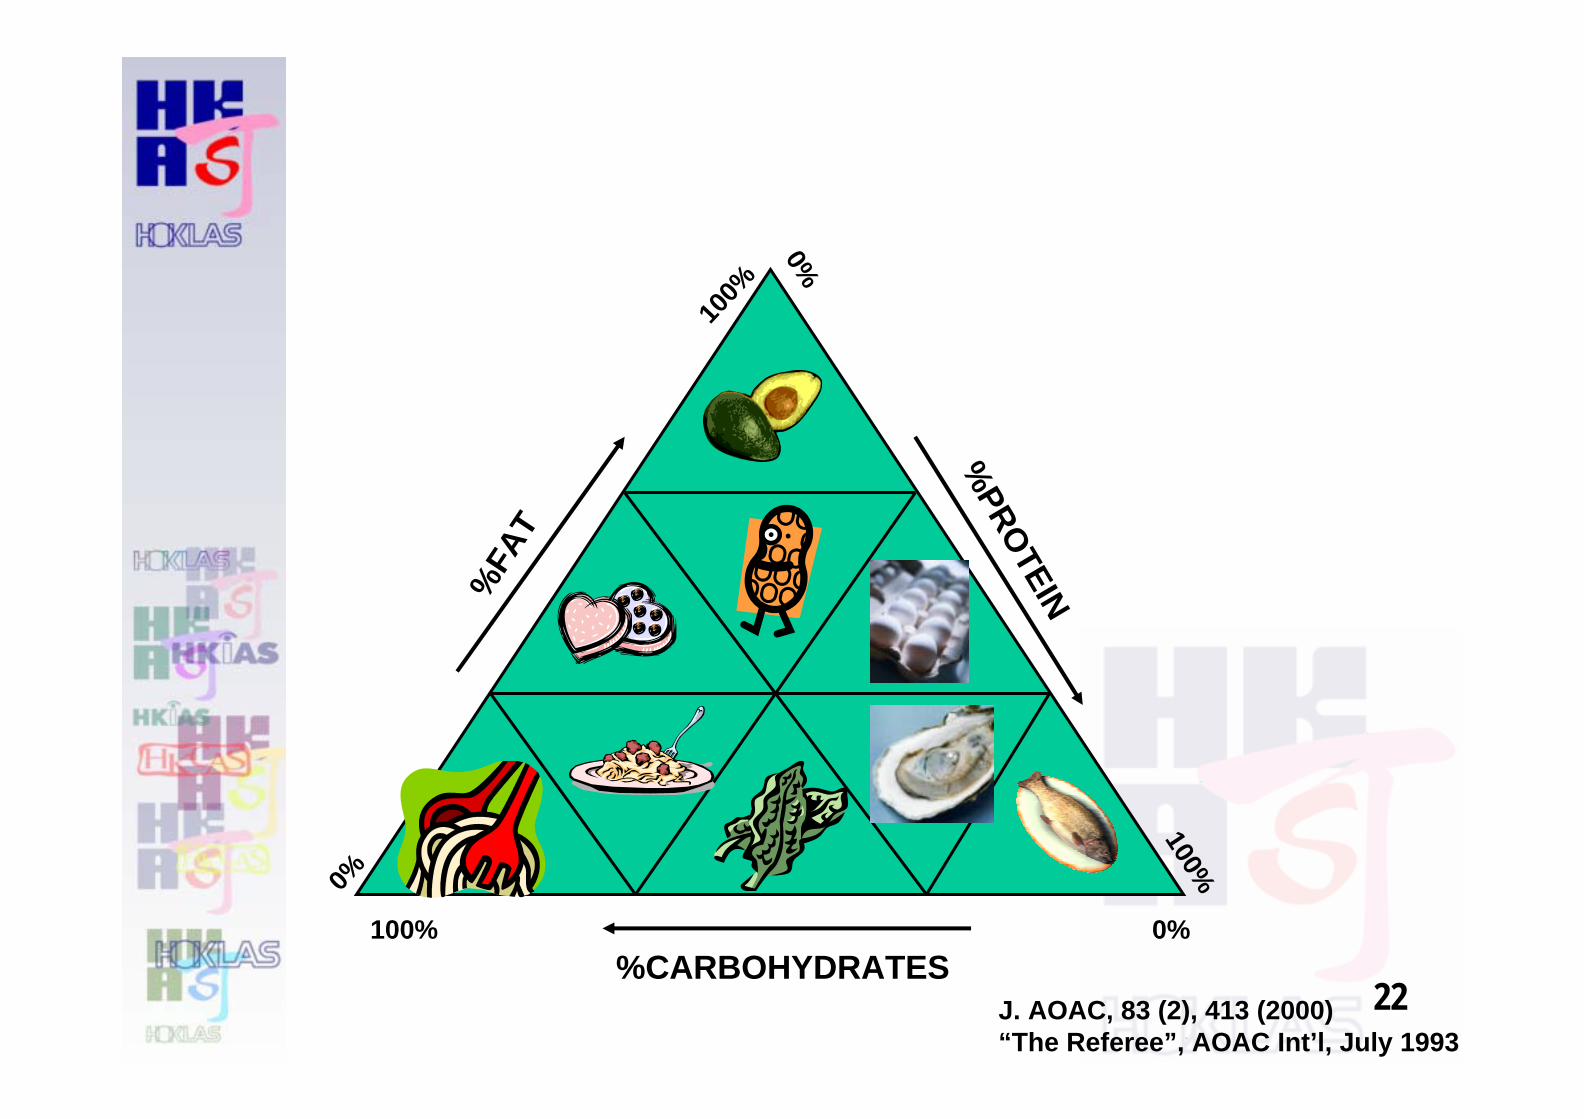
22
0%
%FA
T
%PROTEIN
%CARBOHYDRATES0%
0%
100%
100%
100%
J. AOAC, 83 (2), 413 (2000)“The Referee”, AOAC Int’l, July 1993

23
24

25
Range of food matrices
• The range of matrices shall also in line with those listed in relevant regulations. Due consideration shall also be taken for the food matrices with potential interferences, e.g. high chloride effect on the ICP-MS determination.

26
Range of food matrices
• “General foodstuffs” ≠ all foods • Test procedure shall document the food matrices used in
the validation studies• Labs need to assess and determine the applicability of
their methods to the food samples received.
27
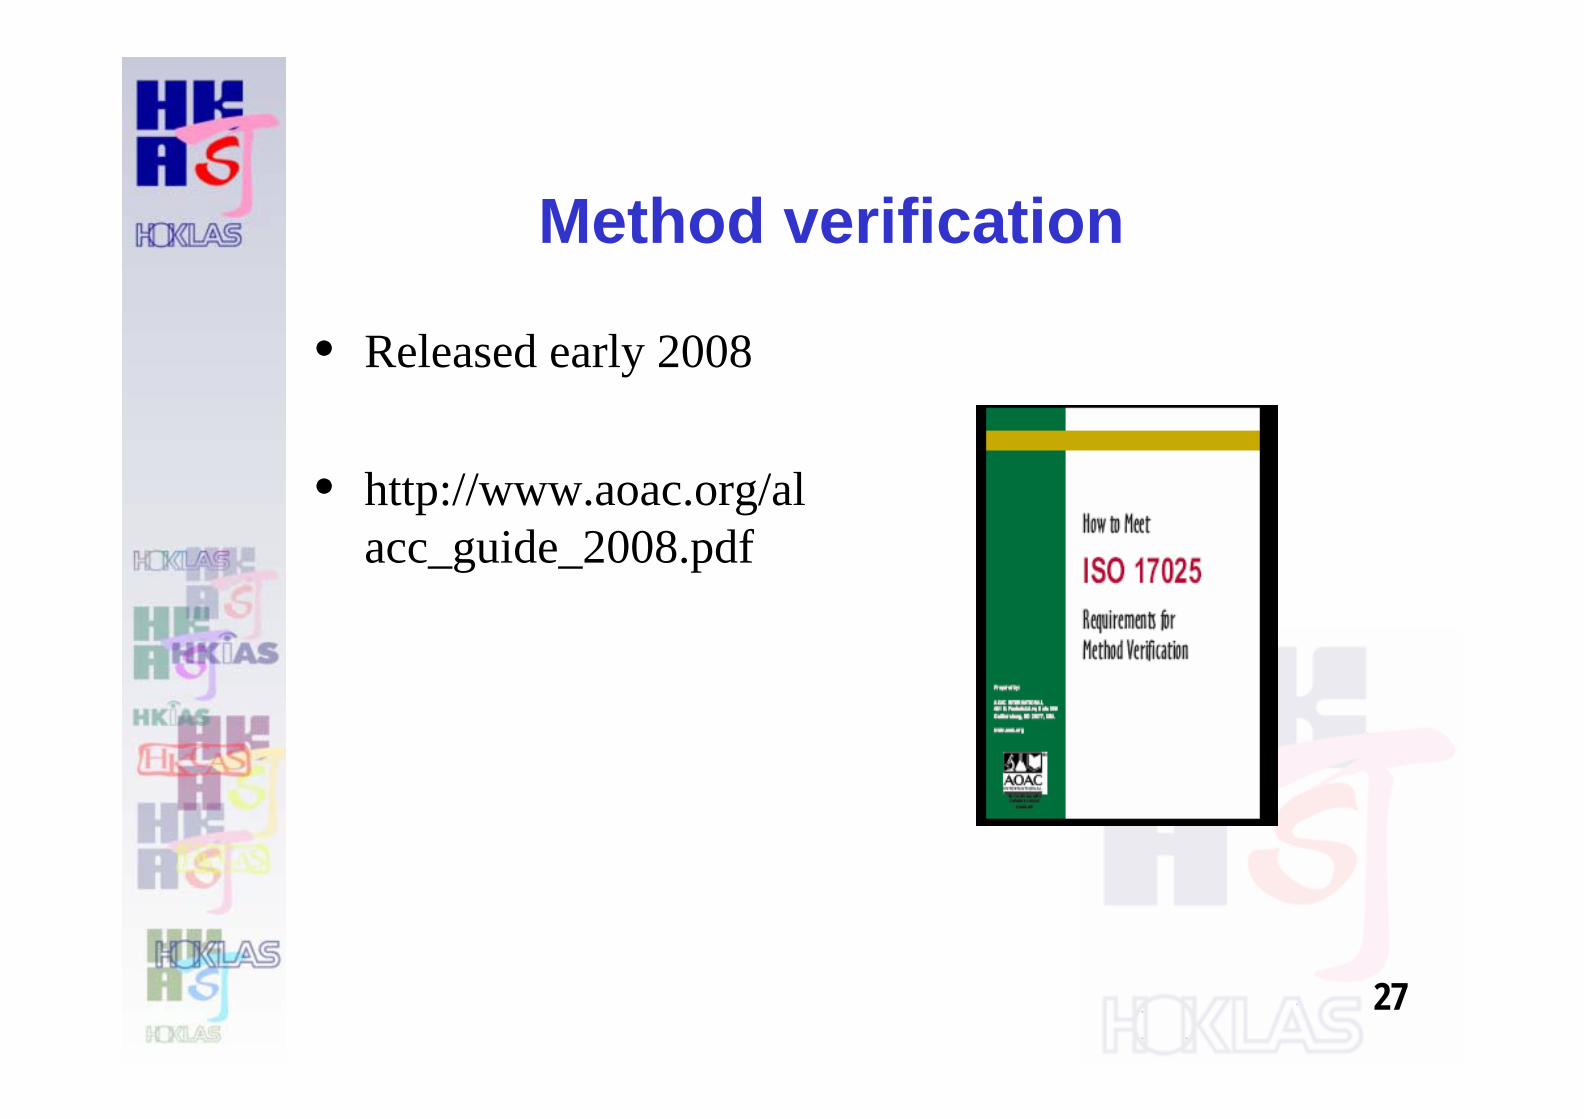
Method verification
• Released early 2008
• http://www.aoac.org/alacc_guide_2008.pdf

28
How should it be done?
The following are some examples of useful references• Harmonised guidelines for single-laboratory
validation of method of analysis (IUPAC Technical Report), 2002
• How to meet ISO 17025 Requirements for Method Verification, AOAC, 2007
• ISO/TS 21748:2004 Guidance for the use of repeatability, reproducibility and trueness estimates in measurement uncertainty estimation

29
How should it be done?
CRMs• How many replicate results are required for proper
comparison of the certified reference value and the actual analysis result?
• Is it necessary for the mean of test result for a CRM to lie within the uncertainty range of the certified value?
• Is a result outside the uncertainty range acceptable ?

30
How should it be done?
Useful references- ISO Guide 33: 2000
Uses of certified reference materials

31
How should it be done?
comparison of results with other methods(ISO 5725-6:1994 clause 8)- comparison of precision of the two methods
where = repeatability standard deviation of method B
= repeatability standard deviation of method Aif F<F(95%) (νrA,νrB): statistically no significant difference
ASBSF
r
r2
2
=
BSr2
ASr2
32
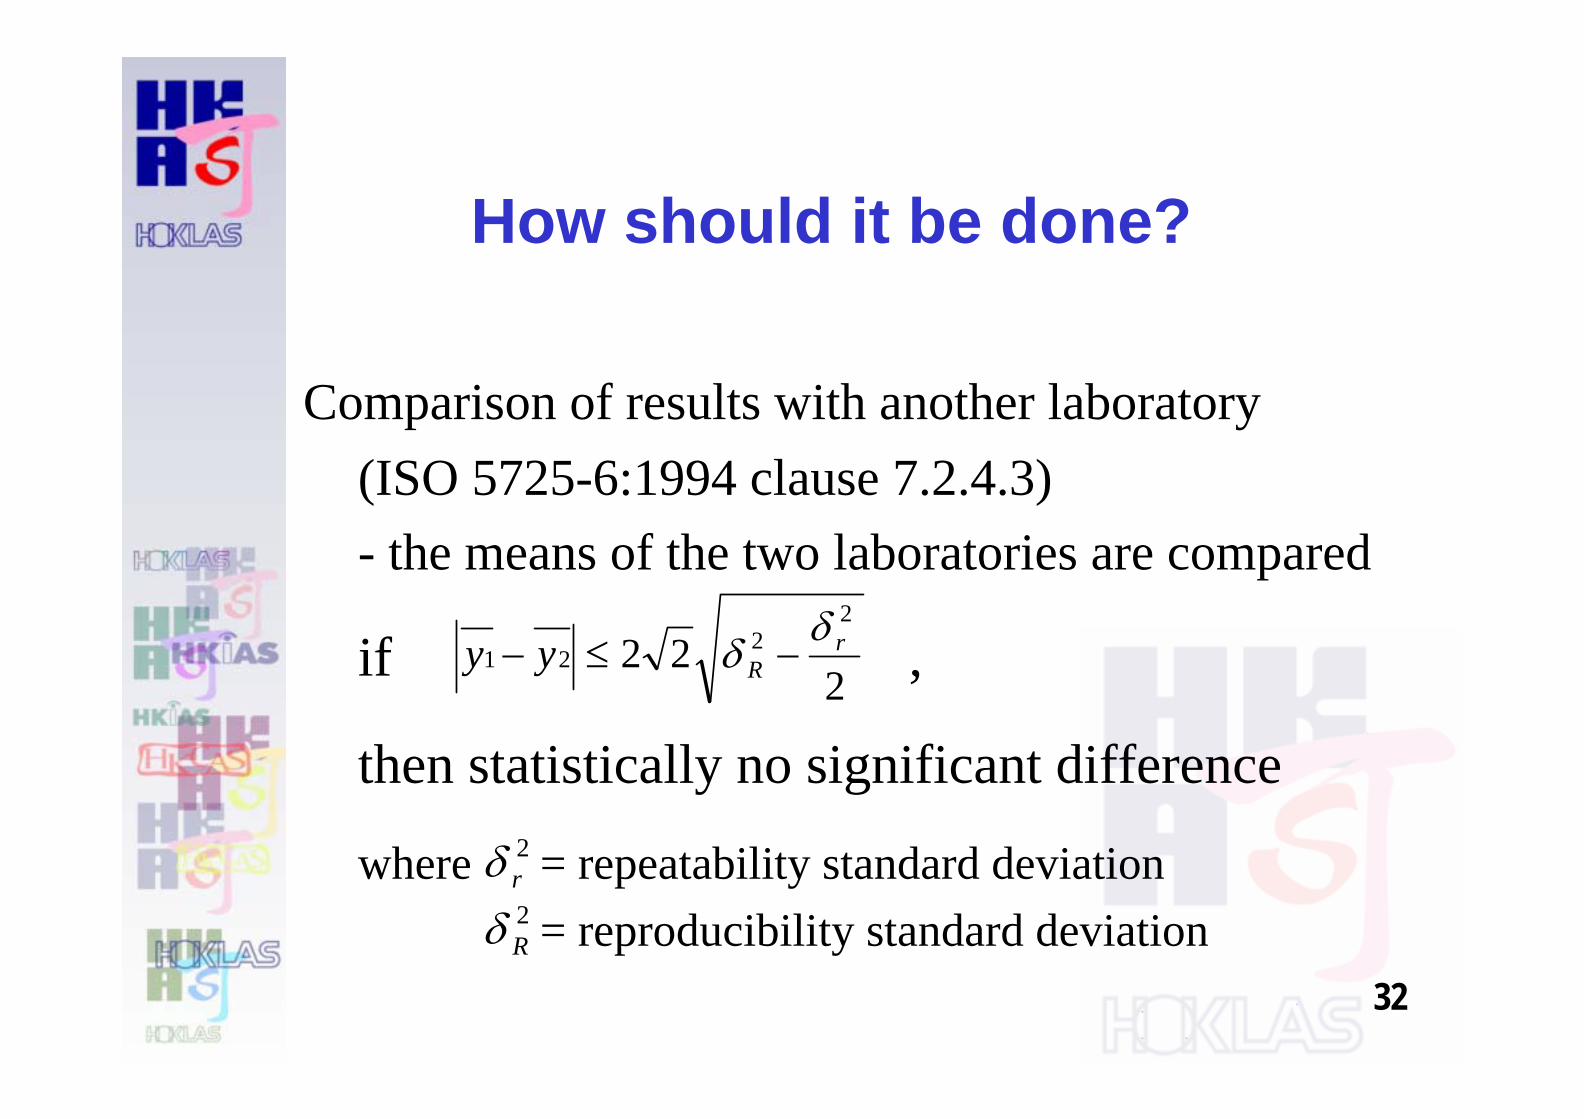
How should it be done?
Comparison of results with another laboratory(ISO 5725-6:1994 clause 7.2.4.3)- the means of the two laboratories are compared
if ,
then statistically no significant difference
where = repeatability standard deviation= reproducibility standard deviation
222
22
21r
Ryyδ
δ −≤−
2rδ2Rδ
33
How should it be done - verification
Worked examples of method verification are available from AOAC
• Determination of Total, Saturated, and Monosaturated Fats In Foodstuffs by Hydrolytic Extraction and Gas Chromatographic Quantitation: Collaborative Study
• Determination of Low-Level Glucose and Fructose in Raw and Refined Crystalline Sugar by High-Performance Anion Exchange Chromatography
34
Common deficiencies• Number of food matrices used not adequate• Number of food types for each matrix not
adequate• Concentration levels used not adequate• Reporting limits estimated but not verified• Food samples chosen not representative of the
food matrices

35
Common deficiencies
• Confirmation of identity technique not available or adequate
• Validation/verification data analyses not done correctly
• Measurement uncertainty not available/not estimated correctly
• Equipment and/or test procedures not conforming to the test std requirements

36
Common deficiencies
• Lack of or inappropriate sampling procedure• QC plan acceptance limits not appropriate
37
Thank you


![Data Validation and Verification [Autosaved] · ON IP DATA VALIDATION, VERIFICATION AND EXCHANGE DATA VALIDATION AND VERIFICATION USING IPOBSD’S TOOLS. Data Quality Vicious Cycle.](https://static.documents.pub/doc/80x56/5e9d0eaef4fa863d2d614a6c/data-validation-and-verification-autosaved-on-ip-data-validation-verification.jpg)


