31
What’s Measured Improves Metrics That Matter ! Raj Indugula [email protected] Rob Brown [email protected]
| Date post: | 19-Mar-2017 |
| Category: |
Technology |
| Upload: | rob-brown-cissp-itilv3-jncia |
| View: | 79 times |
| Download: | 1 times |
Agenda• Why and What of Metrics
• Principles of Measurement
• Key Drivers & Metrics
• Key Takeaways
• Q&A

What does
mean in today’s
Lean-Agile-DevOps world?
3

What is Measurement?
Measures • I have 5
apples • # incidents
Metrics • I have 5 more
apples than yesterday
• % of Sev1 incidents since feature rollout
Observation that reduces uncertainty…
4
Are Metrics Evil?
5

6

What Makes A Good Metric?
http://www.flickr.com/photos/circasassy/7858155676/
Understandable
Comparative
Behavior changing
7

Measure movement towards your
business goals & outcomes
Where are you going?
8
Picture source New Relic

KEY DRIVERS & METRICS
Development ReleaseQA OperateDeploy Customer Success
Business Success

1. Business Success• Starts with Measurable Objectives • Indicators for success • Market share • New business service enablement
10
# of S
torie
s �
0
40
80
120
160
Sprints �78 (6/8-6/21) 80 (7/6-7/19) 82 (8/3-8/16) 84 (8/31-9/13) 86 (9/28-10/11) 88 (10/26-11/8)
Scope (Total Stories Planned) Total Completed (Cumulative) Stories Completed Per SprintProjected (Optimistic) Projected (Pessimistic) Projected (Median)
261948320191116
108106100
81776966
46
2716
138138138138134128
121118109
999488
1627
46
66 6977 81
100106 108
8894 99
109118 121
128134 138 138 138 138
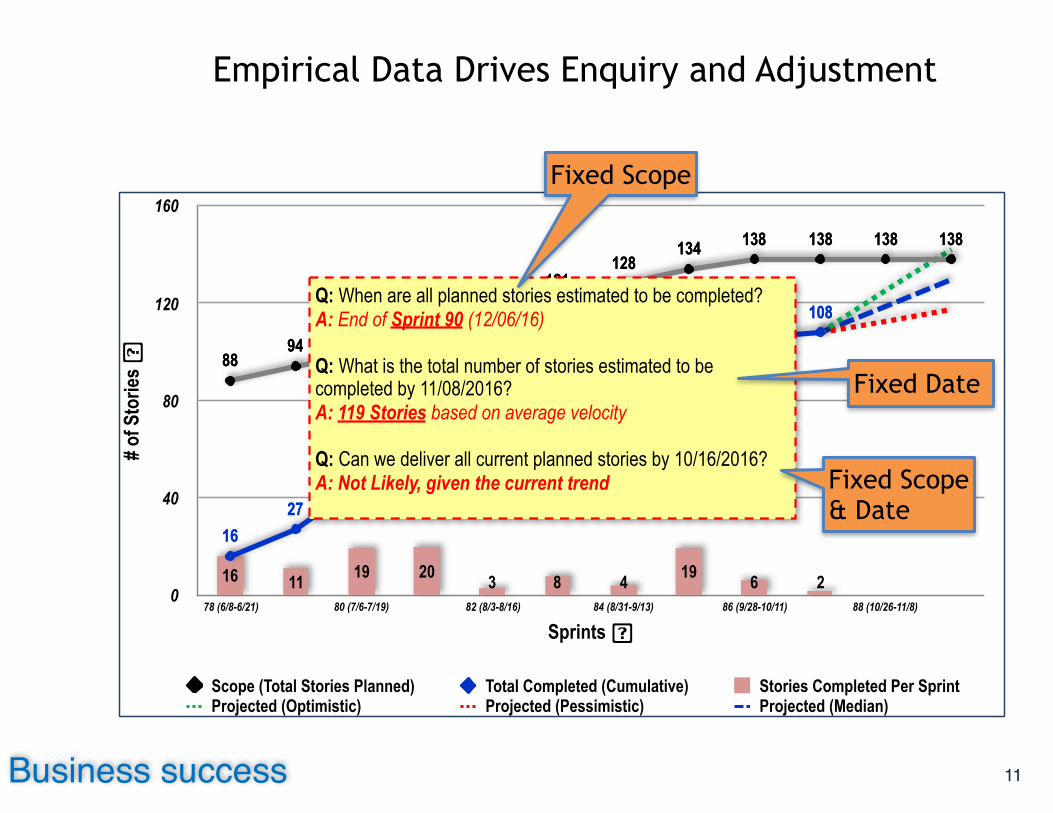
Empirical Data Drives Enquiry and Adjustment
11Business success
Q: When are all planned stories estimated to be completed? A: End of Sprint 90 (12/06/16)
Q: What is the total number of stories estimated to be completed by 11/08/2016? A: 119 Stories based on average velocity
Q: Can we deliver all current planned stories by 10/16/2016? A: Not Likely, given the current trend
Fixed Scope
Fixed Date
Fixed Scope & Date

Business Success
• Average Revenue per User • Customer Lifetime Value • Daily/Monthly Active Users • Average Session Time • % Change in Customer Volume • Feature Metrics
Business Success
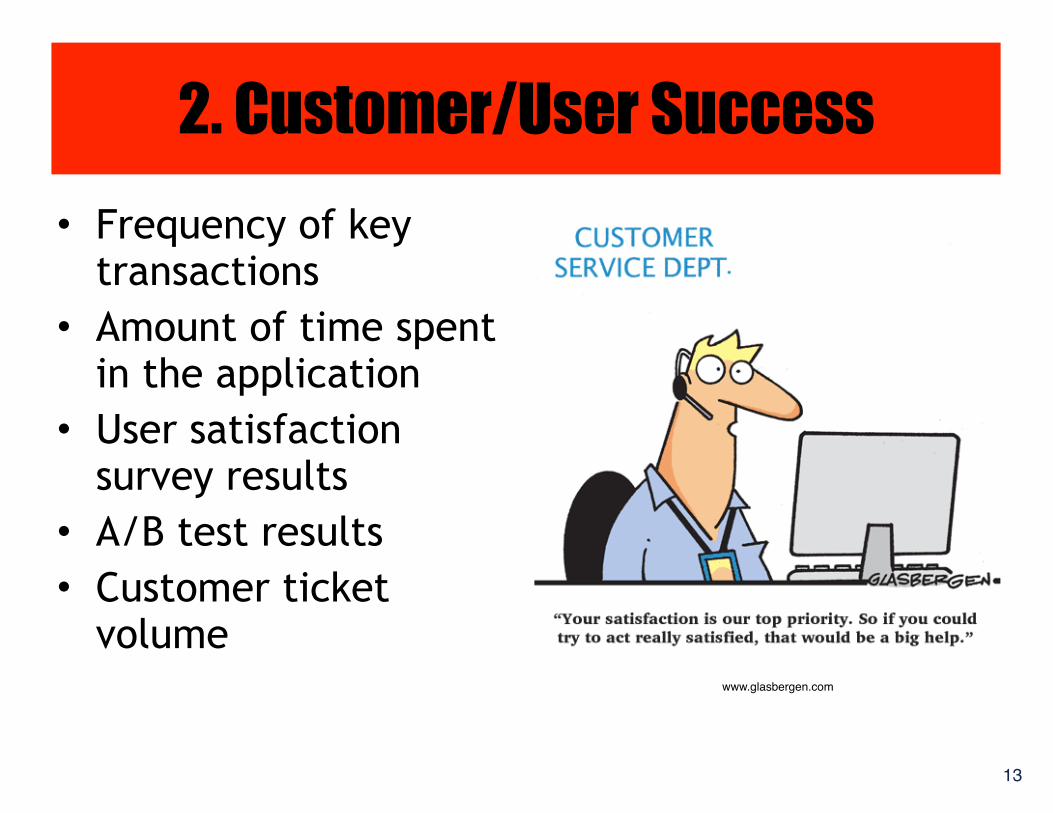
2. Customer/User Success• Frequency of key
transactions • Amount of time spent
in the application • User satisfaction
survey results • A/B test results • Customer ticket
volumewww.glasbergen.com
13

Product 1
0
23
45
68
90
7/26/2
020
8/2/20
20
8/9/20
20
8/16/2
020
8/23/2
020
8/30/2
020
9/6/20
20
9/13/2
020
9/20/2
020
9/27/2
020
10/4/
2020
10/11
/2020
411 10
611
4 48
1
14
60
90
79
6963
5248
44
36 35
2115 15
PendingResolved
Product 2
0
75
150
225
300
7/26/2
020
8/2/20
20
8/9/20
20
8/16/2
020
8/23/2
020
8/30/2
020
9/6/20
20
9/13/2
020
9/20/2
020
9/27/2
020
10/4/
2020
10/11
/2020
18
58
9 2 6 10 20 25 28 19 223
229
171 162 160 154144
12499
7152
30 27
PendingResolved
Customer Satisfaction
“You Build it, You Own It”
Improving Responsiveness to Issues

Customer Success
Customer Success
• Customer Ticket Volume • Net Promoter Score • Net Value Score • Customer Anxiety • Reliability

3. Operations Success
• Availability • Performance • Efficiency • Support
16
http://landing.google.com/sre/book/
Deploy Release Operate

Improving Deployment Success Rate, Not Just Frequency
17Operations success
Build Daily Success Rate Date Build name
9/12/2016 9/13/2016 9/14/2016 9/15/2016 9/16/2016
Test Suite 1
Test Suite 2
Test Suite 3
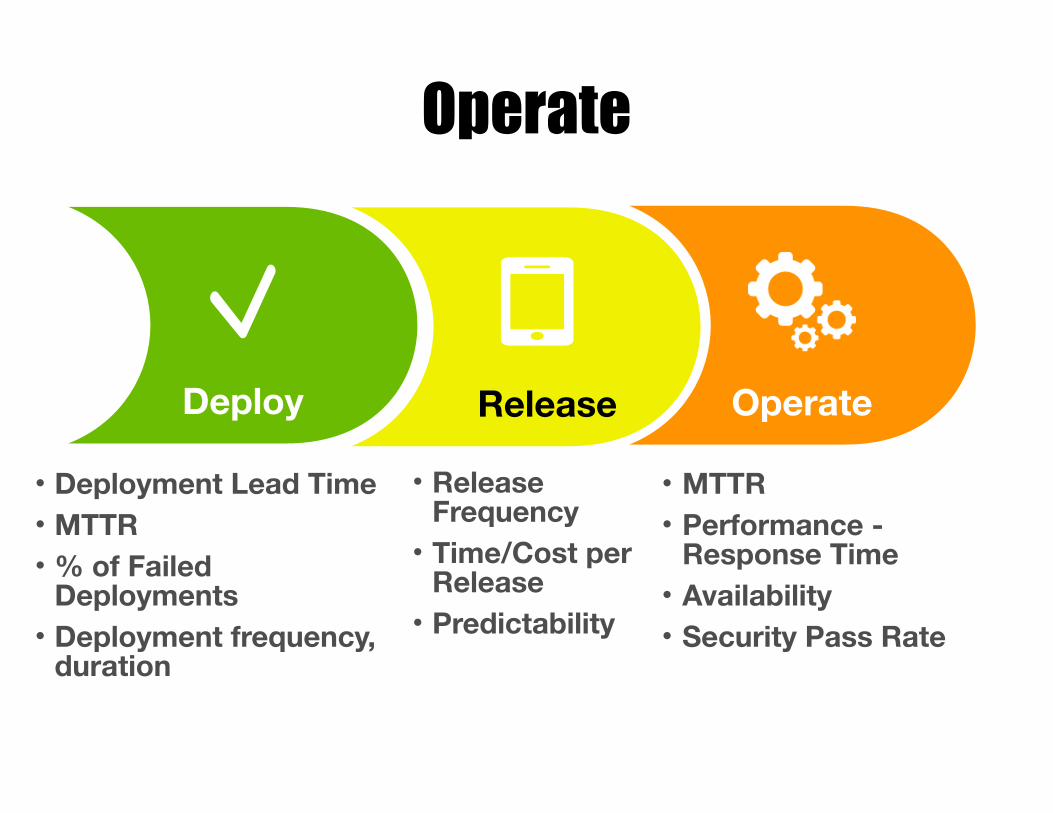
Operate
Deploy Release Operate
• Deployment Lead Time • MTTR • % of Failed
Deployments • Deployment frequency,
duration
• Release Frequency • Time/Cost per
Release • Predictability
• MTTR • Performance -
Response Time • Availability • Security Pass Rate

4. Development Success
• Lead time for changes (from development to deployment)
• Deployment frequency
• % Failed deployments• Incident severity • Outstanding defects
Develop QA Deploy

0%
25%
50%
75%
100%
Sprint 83
Sprint 84
Sprint 85
Sprint 86
OtherNew CapabilityMajor InterfaceProduct EnhancementsProduction IncidentsTechnical DebtArch. Improvement
Insight into Team Capacity and Work Items
20Development success
Balancing New Feature Work with Maintenance and Improvement

Development
• Development Lead Time • Idle Time • Cycle Time • Work in Progress-
Technical Debt • Rework
• Idle Time • MTTD • Defects
• Deployment Lead Time • MTTR • % of Failed
Deployments • Deployment frequency,
duration
DeployQADevelopment

Outcome Title: Provide a common platform for CI/CD - PaaS/CaaS
Outcome Description: Provide teams a ubiquitous, self service platform for build, deploy and test.
Measure: Team Adoption rateBaseline: 1 team/monthBudget: 6 millionDependancies: platform & security engineers, IaaS provider
Adoption Rate Measures:Features
FrequencyForm Factor
New Service
USER.id Date Event Form Count
billy.bob 2/10/17 login IDE 3
suzy.q 2/11/17 image stream GUI 4
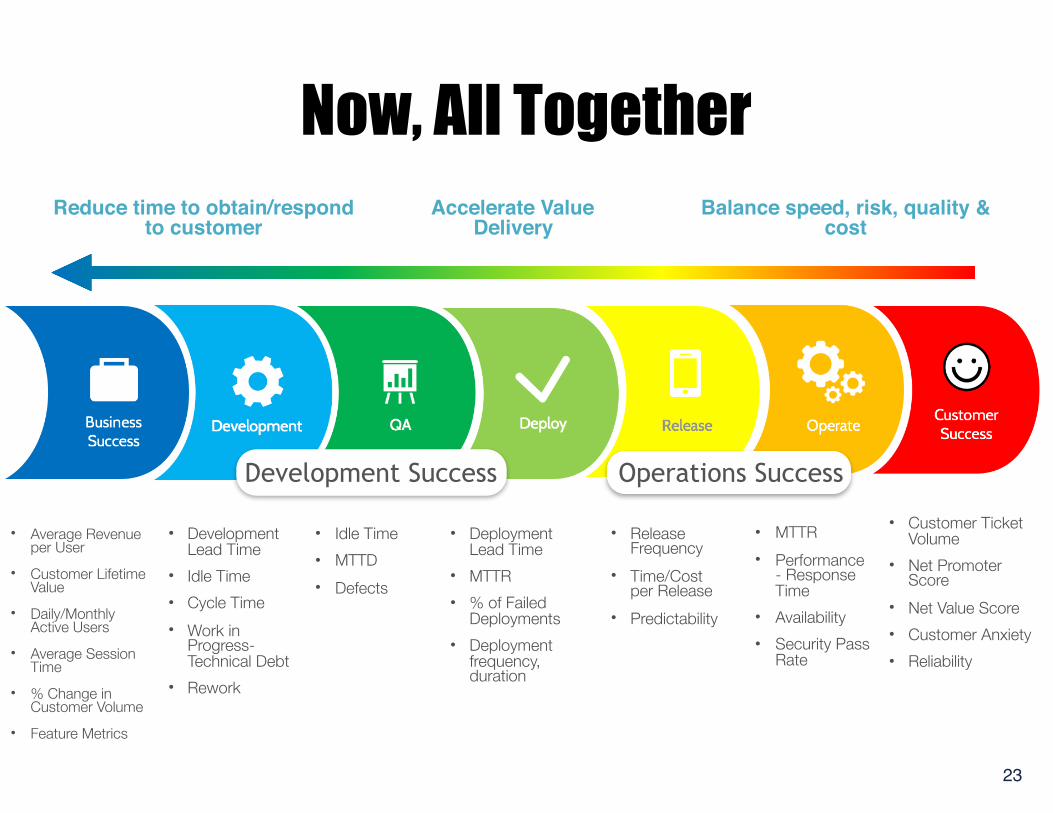
• Average Revenue per User
• Customer Lifetime Value
• Daily/Monthly Active Users
• Average Session Time
• % Change in Customer Volume
• Feature Metrics
• Development Lead Time
• Idle Time • Cycle Time • Work in
Progress-Technical Debt
• Rework
• Idle Time • MTTD • Defects
• Deployment Lead Time
• MTTR • % of Failed
Deployments • Deployment
frequency, duration
• MTTR • Performance
- Response Time
• Availability • Security Pass
Rate
• Customer Ticket Volume
• Net Promoter Score
• Net Value Score • Customer Anxiety • Reliability
• Release Frequency
• Time/Cost per Release
• Predictability
Accelerate Value Delivery
Balance speed, risk, quality & cost
Reduce time to obtain/respond to customer
Now, All Together
23
Operations SuccessDevelopment Success

Monitoring Framework
• Aggregate metrics from all success contexts
• See the entire system
• Enables visualization, anomaly detection, trending, alerting…
Source Adaptation: Turnbull, The Art of Monitoring, Kindle edition, chap. 2.
Business Success
Customer Success
Development Success
Operations Success
24
Event Aggregator

https://github.com/capitalone/Hygieiahttps://github.com/capitalone/Hygieia

KEY TAKEAWAYS

• Keep inventory of metrics small
• Measure outcomes, not individuals
• Monitor balanced set of metrics
• Monitor trends, not data points
• Share Widely – Interaction encourages exploration
“If you measure me in an illogical way…don’t complain about illogical behavior” - Goldratt
27

Next Steps
Clear Objective Well formed metrics
Measure & Improve
“Metrics illuminate, not indicate” – George Dinwiddie

REFERENCES

• http://onstartups.com/tabid/3339/bid/96738/Measuring-What-Matters-How-To-Pick-A-Good-Metric.aspx
• http://www.slideshare.net/GoAtlassian/understanding-metrics-what-to-measure-and-why-john-custy
• http://www.slideshare.net/TeamQualityPro/the-good-the-bad-and-the-metrics
• http://devopsenterprise.io/media/DOES_forum_metrics_102015.pdf
• http://devops.com/2014/11/10/devops-scorecard/ • http://www.datical.com/blog/9-metrics-devops-teams-tracking/ • http://devops.com/2015/01/26/metrics-devops/ • https://blog.appdynamics.com/devops/quantified-devops/ • http://www.slideshare.net/jedi4ever/devops-metrics • http://www.slideshare.net/ITRevolution/does15-troy-magennis-
and-julia-wester-metrics-and-modeling-helping-teams-see-how-to-improve
• https://thenewstack.io/tag/ebook5-monitoring-and-management/
• https://www.artofmonitoring.com/

Pin Your Metric
UsefulUseless


