MICHIGAN PUBLIC SCHOOL EMPLOYEES’ RETIREMENT SYSTEM 1 Michigan Public School Employees’ Retirement System A Pension and Other Employee Benefit Trust Fund of the State of Michigan Comprehensive Annual Financial Report for the Fiscal Year Ended September 30, 2013 MPSERS Prepared by: Financial Services for Office of Retirement Services P.O. Box 30171 Lansing, Michigan 48909-7671 517-322-5103 1-800-381-5111
Transcript
MICHIGAN PUBLIC SCHOOL EMPLOYEES’ RETIREMENT SYSTEM 1
Michigan Public School Employees’ Retirement System A Pension and Other Employee Benefit Trust Fund of the State of Michigan
Comprehensive Annual Financial Report for the Fiscal Year Ended September 30, 2013
M P S E R S
Prepared by:
Financial Services for
Office of Retirement Services P.O. Box 30171
Lansing, Michigan 48909-7671 517-322-5103
1-800-381-5111
2 MICHIGAN PUBLIC SCHOOL EMPLOYEES’ RETIREMENT SYSTEM
Table of Contents
Introductory Section Certificate of Achievement ....................................................................................................................................... 4 Public Pension Standards Award .............................................................................................................................. 5 Letter of Transmittal ................................................................................................................................................. 6 Retirement Board Members ................................................................................................................................. 11 Advisors and Consultants ...................................................................................................................................... 11 Organization Chart ............................................................................................................................................... 12
Financial Section Independent Auditor’s Report ................................................................................................................................ 14 Management’s Discussion and Analysis ................................................................................................................ 16 Basic Financial Statements Statement of Pension Plan and Other Postemployment Benefit Plan Net Position ........................................... 20 Statement of Changes in Pension Plan and Other Postemployment Benefit Plan Net Position ........................ 21 Notes to Basic Financial Statements ................................................................................................................. 22 Required Supplementary Information Schedules of Funding Progress .......................................................................................................................... 46 Schedules of Employer and Other Contributions .............................................................................................. 47 Note to Required Supplementary Information .................................................................................................. 48 Supporting Schedules Summary Schedules of Administrative and Other Expenses ............................................................................ 50 Schedule of Investment Expenses ..................................................................................................................... 51 Schedule of Payments for Professional Services ............................................................................................... 51 Detail of Changes in Plan Net Position ............................................................................................................. 52
Investment Section Report on Investment Activity ............................................................................................................................... 56 Asset Allocation ..................................................................................................................................................... 65 Investment Results ................................................................................................................................................. 66 List of Largest Stock Holdings ............................................................................................................................... 68 List of Largest Bond Holdings .............................................................................................................................. 68 Schedule of Investment Fees ................................................................................................................................. 69 Schedule of Investment Commissions .................................................................................................................... 70 Investment Summary .............................................................................................................................................. 71
Actuarial Section Actuary’s Certification ........................................................................................................................................... 74 Summary of Actuarial Assumptions and Methods ................................................................................................. 77 Schedules of Active Member Valuation Data ........................................................................................................ 79 Schedules of Changes in the Retirement Rolls ....................................................................................................... 80 Prioritized Solvency Test ....................................................................................................................................... 81 Analysis of System Experience .............................................................................................................................. 83 Summary of Plan Provisions ................................................................................................................................. 84
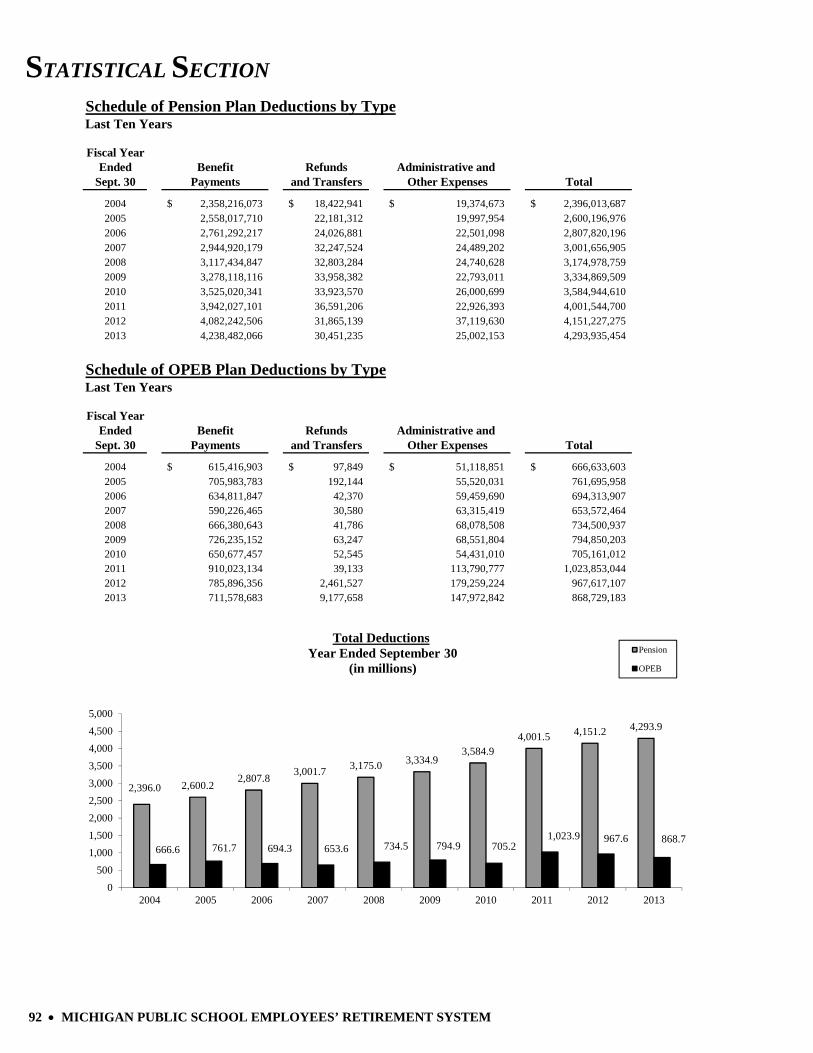
Statistical Section Schedules of Additions by Source .......................................................................................................................... 91 Schedules of Deductions by Type .......................................................................................................................... 92 Schedules of Changes in Net Position .................................................................................................................... 93 Schedules of Benefits and Refunds by Type .......................................................................................................... 94 Schedules of Retired Members by Type of Benefit ................................................................................................ 95 Schedule of Other Postemployment Benefits ......................................................................................................... 97 Schedules of Average Benefit Payments ................................................................................................................ 98 Schedule of Principal Participating Employers .................................................................................................... 101 Ten Year History of Membership ......................................................................................................................... 102 Schedule of Participating Employers ................................................................................................................... 103
MICHIGAN PUBLIC SCHOOL EMPLOYEES’ RETIREMENT SYSTEM 3
INTRODUCTORY SECTION
Certificate of Achievement Public Pension Standards Award
Letter of Transmittal Retirement Board Members
Advisors and Consultants Organization Chart
INTRODUCTORY SECTION
4 MICHIGAN PUBLIC SCHOOL EMPLOYEES’ RETIREMENT SYSTEM
Certificate of Achievement
INTRODUCTORY SECTION
MICHIGAN PUBLIC SCHOOL EMPLOYEES’ RETIREMENT SYSTEM 5
Public Pension Standards Award
INTRODUCTORY SECTION
6 MICHIGAN PUBLIC SCHOOL EMPLOYEES’ RETIREMENT SYSTEM
Letter of Transmittal
Michigan Public School Employees’ Retirement System P.O. Box 30171 Lansing, Michigan 48909-7671 Telephone 517- 322-5103 Outside Lansing 1-800-381-5111
STATE OF MICHIGAN
RICK SNYDER, Governor
DEPARTMENT OF TECHNOLOGY, MANAGEMENT & BUDGET
December 19, 2013 The Honorable Rick Snyder Governor, State of Michigan, Members of the Legislature State of Michigan, Retirement Board Members and Members, Retirees and Beneficiaries Ladies and Gentlemen: We are pleased to present the comprehensive annual financial report of the Michigan Public School Employees’ Retirement System (System) for fiscal year 2013. INTRODUCTION TO REPORT The System was established by legislation under Public Act 136 of 1945, and is administered by the Office of Retirement Services (ORS). The number of active and retired members and beneficiaries of the System is presented in Note 1 of the financial statements in the Financial Section of this report. The purpose of the System is to provide benefits for all public school employees. The services performed by ORS staff provide benefits to members. Responsibility Responsibility for both the accuracy of the data and the completeness and fairness of the presentation, including all disclosures, rests with the leadership team of the System. To the best of our knowledge and belief, the enclosed data is accurate in all material respects and is reported in a manner designed to present fairly the financial position and results of operations of the System. Internal Control Structure The leadership team of the System is responsible for maintaining adequate internal accounting controls designed to provide reasonable assurance that transactions are executed in accordance with management’s general or specific authorization, and are recorded as necessary to maintain accountability for assets and to permit preparation of financial statements in accordance with accounting principles generally accepted in the United States of America. The internal control structure is designed to provide reasonable assurance regarding the safekeeping of assets and reliability of all financial records.
INTRODUCTORY SECTION
MICHIGAN PUBLIC SCHOOL EMPLOYEES’ RETIREMENT SYSTEM 7
Letter of Transmittal (continued) The concept of reasonable assurance recognizes that the cost of a control should not exceed the benefits likely to be derived and that the valuation of costs and benefits requires estimates and judgments by management. This internal control structure includes maintaining written policies and procedures. Discussion and analysis of net position and related additions and deductions are presented in the Management Discussion and Analysis which can be found immediately following the Independent Auditor’s Report. Independent Auditors and Actuary The Office of the Auditor General (OAG), independent auditors, conducted an annual audit of the System. The independent auditor’s report on the System’s financial statements is included in the Financial Section of this report. Statute requires that an annual actuarial valuation be conducted. The purpose of the valuation is to evaluate the mortality, service, compensation and other financial experience of the System and to recommend employer-funding rates for the subsequent year. The annual actuarial valuation was completed by Gabriel Roeder Smith & Company for the fiscal year ended September 30, 2012. Actuarial certification and supporting statistics are included in the Actuarial Section of this report. Management’s Discussion and Analysis (MD&A) Generally Accepted Accounting Principles (GAAP) require that management provide a narrative introduction, overview, and analysis to accompany the Basic Financial Statements in the form of MD&A. This letter of transmittal is intended to complement MD&A and should be read in conjunction with it. The MD&A can be found immediately following the Independent Auditor’s Report. PROFILE OF THE GOVERNMENT In accordance with Public Act 300 of 1980, on October 31, 1980, the Public School Employees’ Chapter I Retirement Fund merged with the Public School Employees’ Chapter II Retirement Fund to establish the Public School Employees’ Retirement System. Public Acts 136 of 1945 and 259 of 1974, respectively, created the two original funds. A twelve-member board governs administrative policy. Employee contributions, employer contributions, and investment earnings provide financing for the System. Under Public Act 91 of 1985, employees may contribute additional amounts into a “member investment plan.” Public Act 75 of 2010 established a new Pension Plus Plan which provides all individuals hired on or after July 1, 2010, with a combined Defined Benefit and Defined Contribution benefit structure. ECONOMIC CONDITIONS AND OUTLOOK Despite challenging economic times, the System continues to show steady performance over the long-term. Investments The State Treasurer is the investment fiduciary and custodian of all investments of the System pursuant to State law. The primary investment objective is to maximize the rate of return on the total investment portfolio, consistent with a high degree of prudence and sufficient diversity to eliminate inordinate risks and to meet the actuarial assumption for the investment return rate. The investment activity for the year produced a total rate of return on the portfolio of 12.5% for the Pension Plan and 12.3% for the Other Postemployment Benefits (OPEB) Plan. For the last five years, the System has experienced an annualized rate of return of 6.8% for the Pension Plan. A summary of asset allocation and rates of return can be found in the Investment Section of this report. Accounting System Transactions of the System are reported on the accrual basis of accounting. Revenues are recorded when earned, and expenses are recorded when incurred. Participants’ benefits are recorded when payable by law. We believe that the accounting and administrative internal controls established by the System provide reasonable assurance the System is
INTRODUCTORY SECTION
8 MICHIGAN PUBLIC SCHOOL EMPLOYEES’ RETIREMENT SYSTEM
Letter of Transmittal (continued) carrying out its responsibilities in safeguarding its assets, in maintaining the reliability of the financial records for preparing financial statements, and in maintaining accountability for its assets. Funding Funds are derived from the excess of additions to plan net position over deductions from plan net position. Funds are accumulated by the System to meet future benefit obligations to retirees and beneficiaries. The percentage computed by dividing the actuarial value of assets by the actuarial accrued liability is referred to as the “funded ratio.” This ratio provides an indication of the funding status of the System and generally, the greater this percentage, the stronger the System. Effective in fiscal year 2001, the System uses the valuation from the previous fiscal year for this report in accordance with Governmental Accounting Standards Board (GASB) Statement No. 25. Consistent with this approach, the most recent actuarial valuation was performed as of September 30, 2012. The actuarial value of the assets and actuarial accrued liability were $38.4 billion and $62.7 billion, respectively, resulting in a funded ratio of 61.3% at September 30, 2012. An historical perspective of funding levels for the System is presented on the Schedule of Funding Progress in the Required Supplementary Information in the Financial Section of this report. Postemployment Benefits An actuarial valuation is completed annually to determine the actuarial accrued liability if the postemployment benefits were to be pre-funded. As of September 30, 2012, the actuarial accrued liability for postemployment benefits based on pre-funding is $14.8 billion. GASB Statement No. 43 (implemented in fiscal year 2007) does not require retroactive application of the reporting changes. Therefore, only seven valuation years are presented and included in the required supplementary information in this report. MAJOR GOALS ACCOMPLISHED Social media presence for ORS begins - The Office of Retirement Services (ORS) completed an evaluation of social media as an additional way to communicate with customers. ORS determined that social media was a worthwhile communication channel and established five objectives: improve pre-retirement knowledge, improve post-retirement knowledge, increase online self-service, support existing processes, and share interesting news and resources from other sources. After developing an implementation and maintenance plan, ORS launched the official Facebook page in August 2013 and has documented early success with the number of engaged customers interacting with ORS and each other. ORS continues innovative technology approach with User Experience Team - The Office of Retirement Services (ORS) joined forces with the State of Michigan User Experience (UX) team, a part of Department of Technology, Management & Budget Shared Services, to find out if our customers found miAccount and the ORS website easy to navigate. ORS has already improved the customer experience by creating a What Happens Next document that users receive when they apply for retirement in miAccount. The UX team also prepared miAccount prototypes for the processes that caused our customers the most confusion during user experience testing. ORS will use the prototypes to implement further changes in miAccount and the customer website. ORS websites now mobile - To provide our customers with the best possible online experience, even on the go, the Office of Retirement Services’ eight member websites are now mobile. These versions of our websites are different from the desktop sites in that they have fewer navigation options and are tailored specifically to the mobile user. The pages are designed with each site’s most common tasks, like logging into miAccount or getting high-level plan information. Customers also have the option of visiting the full desktop site on their mobile device. Employee engagement – The Office of Retirement Services (ORS) leaders are increasing its employee engagement and developing high performance teams with the Power of Perspectives and Forging Breakthroughs workshops. We offered this experience to every employee over the last three years, sustained with quarterly team exercises and monthly communication. These activities foster a work climate where open-mindedness is practiced, respect is demonstrated, diversity is valued, and creativity and innovation thrive. Fellow co-workers, instead of management, lead the workshops. ORS has also embraced the importance of individual and team recognition for high performance in various ways including simple notecards to show appreciation to staff who do great work, or short-term reserved parking for employees.
INTRODUCTORY SECTION
MICHIGAN PUBLIC SCHOOL EMPLOYEES’ RETIREMENT SYSTEM 9
Letter of Transmittal (continued) Direct deposit campaign - To ensure secure, timely pension payments, the Office of Retirement Services began delivering all pensions through direct deposit beginning in 2013. Before the end of 2012, 11,500 paper check recipients switched to direct deposit. All new pension inceptions are established as direct deposit.
Contract management - The Office of Retirement Services (ORS) manages several contracts that are essential to providing valuable benefits and best-in-class services to its members and retirees. This year, ORS exercised an option year for 2014 with the prescription drug vendor, Catamaran, and through those negotiations achieved a projected $40 million in savings. ORS takes on new retirement system: MRS - On October 1, 2012, the Office of Retirement Services (ORS) welcomed nearly 4,000 retired members of the Michigan National Guard as the Military Retirement System (MRS) transitioned from the Department of Military & Veterans Affairs to ORS, becoming ORS’s fifth retirement system. ORS is handling all aspects of the pension plan from initial eligibility and retirement applications to processing pension payments to the retiree and subsequent pension beneficiaries. ORS debuts new workshop - Picture Your Future: Advancing on Your Road to Retirement Readiness! is the Office of Retirement Services’(ORS’s) newest customer outreach product. Picture Your Future is for members ten years away from retirement and complements existing ORS materials. While it emphasizes the value of the retirement system in financial planning, it also reviews other factors for a secure and healthy retirement. During breakout sessions, participants use personas – hypothetical public school members - to create a vision for life after retirement, develop a plan to make the vision a reality, identify the steps to achieve the vision, and risks and strategies to address them. The idea is that members will relate to the personas, think about their own circumstances, and take action sooner rather than later to learn about and prepare for retirement. ORS surveys caller experience - The Office of Retirement Services (ORS) has developed a digital after call survey that is delivered via email after a customer speaks with a customer service representative. If the customer meets certain criteria and has an email address on file, the survey is sent. It consists of four questions and a comment field. ORS’s customer service area then uses a reporting tool to pull various reports on overall customer satisfaction and individual agent scores. School districts benefit with Access miAccount campaign - Recognizing the influence school districts have on their employees, the Office of Retirement Services launched a program to support school districts that encouraged their employees to log into miAccount during the Public School Employees Retirement System election window. The Access miAccount program acknowledged school districts whose members logged in, accessed their personalized account information, and made the reform elections. The campaign was a success. By October of 2012, 90 percent of employers (representing 96 percent of members) participated. ORS establishes State's first HRA accounts - Health Reimbursement Arrangements (HRAs) are tax-advantaged health savings plans funded by employers to help retirees pay, tax-free, for qualified medical expenses incurred in retirement. Unused funds may be carried forward for reimbursement in future years. The recent reforms established HRAs as a benefit under the Personal Healthcare Fund (PHF) for participants in the state, public school, and state police retirement systems. The Office of Retirement Services established the State’s first HRAs for qualifying former state employees who elected the PHF during the 2012 reform and whose lump sum credit at termination exceeds IRS contribution limits to their 401(k) and 457 accounts. ORS partners with MDE and DTMB on School Aid Fund communications - The Office of Retirement Services partnered with the Michigan Department of Education craft a special communication to all superintendents and school finance officials that explains the impact that privatization may have on Unfunded Accrued Actuarial Liability, and ultimately, the School Aid Fund. The communication included a worksheet that superintendents can use to conduct a true cost-benefit analysis of keeping services in-house or privatizing them.
INTRODUCTORY SECTION
10 MICHIGAN PUBLIC SCHOOL EMPLOYEES’ RETIREMENT SYSTEM
Letter of Transmittal (continued) HONORS Public Pension Standards Award - The Public Pension Coordinating Council awarded the retirement system with the 2013 Public Pension Standards Award for Funding and Administration. Government Finance Officers Association award - The Government Finance Officers Association (GFOA) of the United States and Canada awarded the retirement system with the Certificate of Achievement for Excellence in Financial Reporting for our fiscal year 2012 Comprehensive Annual Financial Report (CAFR). This marks the 22nd consecutive year ORS has received this prestigious award. Application Support Team honored for public school reform IT efforts - The Michigan Information Systems Association (MISA) awarded the Office of Retirement Services’ (ORS) Application Support Team with the MISA IT Excellence Award for their work on the public school reform election project. This award recognizes the pre-work to get ORS systems ready for the public school reform election. This included making elections available in miAccount, employer reporting updates, and performance testing and reinforcing to make sure that miAccount could handle heavy system loads during the election window. Acknowledgements The preparation of this report was accomplished with the dedication and cooperation of many people. It is intended to provide complete and reliable information as a basis for making management decisions, as a means of determining compliance with legal provisions, and as a means for determining responsible stewardship of the funds of the System. We would, therefore, like to express our appreciation for the assistance given by staff, the advisors and the many people who contributed to its preparation. We believe their combined efforts have produced a report that will enable employers and plan members to better evaluate and understand the Michigan Public School Employees’ Retirement System. Their cooperation contributes significantly to the success of the System. Sincerely,
Phillip J. Stoddard, Director Office of Retirement Services
INTRODUCTORY SECTION
MICHIGAN PUBLIC SCHOOL EMPLOYEES’ RETIREMENT SYSTEM 11
Administrative Organization Retirement Board Members* Ivy Bailey Active Classroom Teacher Term Expired March 30, 2012
Scott Koenigsknecht, Chair Active Superintendent Term Expires March 30, 2017
Mike Engle Active Classroom Teacher Term Expires March 30, 2017
Charles Thomas Retired Finance/Operations Term Expires March 30, 2015
Stephen Epstein General Public - Investments Term Expires March 30, 2016
Michael Ringuette General Public - Actuary/Health Insurance Term Expires March 30, 2014
Timothy Nelson Community College Trustee Term Expires March 30, 2016
Kevin Philipps Active Finance/Operations, Non-Superintendent Term Expires March 30, 2016
John Olekszyk, Vice Chair Retired Teacher Term Expires March 30, 2014
Christine Veld Active Non-Certified Support Term Expires March 30, 2017
Larry Ward Reporting Unit Board of Control Term Expires March 30, 2016
Michael P. Flanagan Ex-officio Member Representing State Superintendent of Education
*Statute provides that board members may continue to serve after their term expires until they are replaced or reappointed.
Administrative Organization Department of Technology, Management &
Budget Office of Retirement Services
P.O. Box 30171 Lansing, Michigan 48909-7671
517-322-5103 1-800-381-5111
Advisors and Consultants Actuaries Gabriel Roeder Smith & Co. Mita D. Drazilov Southfield, Michigan
Independent Auditors Thomas H. McTavish, C.P.A. Auditor General State of Michigan
Investment Manager and Custodian Andy Dillon State Treasurer State of Michigan
Legal Advisor Bill Shuette Attorney General State of Michigan
Medical Advisors Gabriel Roeder Smith & Co. Southfield, Michigan
Investment Performance Measurement State Street Corporation State Street Investment Analytics Boston, MA
INTRODUCTORY SECTION
12 MICHIGAN PUBLIC SCHOOL EMPLOYEES’ RETIREMENT SYSTEM
Administrative Organization (continued)
Financial ServicesMichael Gilliland, Director
Fiscal Management Division
Laurie Hill, Assistant Director
Ronald W. Foss, Director
Phillip J. Stoddard, Director
Jon M. Braeutigam, Director
Office ofRetirement Services
Organization Chart
Department of Technology, Management & BudgetJohn E. Nixon, Director
Department of Treasury *Andy Dillon, State Treasurer
Bureau of Investments
*The investments of the System are managed by the Michigan Department of Treasury. Information on the investments and the fiduciary, Michigan Department of Treasury, can be found in the Investment Section, Introduction. In addition, see the Investment Section, Schedule of Investment Fees and Schedule of Investment Commissions, for information regarding the investment fees and commissions paid as well as investment professionals utilized by the System.
MICHIGAN PUBLIC SCHOOL EMPLOYEES’ RETIREMENT SYSTEM 13
FINANCIAL SECTION
Independent Auditor’s Report Management’s Discussion and Analysis
Basic Financial Statements Notes to Basic Financial Statements
Required Supplementary Information Note to Required Supplementary Information
Supporting Schedules
14 MICHIGAN PUBLIC SCHOOL EMPLOYEES’ RETIREMENT SYSTEM
MICHIGAN PUBLIC SCHOOL EMPLOYEES’ RETIREMENT SYSTEM 15
FINANCIAL SECTION
16 MICHIGAN PUBLIC SCHOOL EMPLOYEES’ RETIREMENT SYSTEM
Management’s Discussion and Analysis
Our discussion and analysis of the Michigan Public School Employees’ Retirement System’s (System) financial performance provides an overview of the System’s financial activities for the fiscal year ended September 30, 2013. Please read it in conjunction with the transmittal letter in the Introductory Section on page 6 and the basic financial statements, which follow this discussion.
FINANCIAL HIGHLIGHTS
System assets exceeded liabilities at the close of fiscal year 2013 by $42.6 billion (reported as net position). Net position is restricted to meet future benefit payments.
The System’s funding objective is to meet long-term benefit obligations through contributions and investment income. As of September 30, 2012, the funded ratio for pension benefits was approximately 61.3% and the funded ratio for other postemployment benefits (OPEB) was approximately 9.1%.
Additions for the year were $8.2 billion, which are comprised primarily of contributions of $3.1 billion and investment gains of $5.1 billion.
Deductions increased over the prior year from $5.1 billion to $5.2 billion or 0.9%. Most of this increase represents increased pension benefits paid.
THE STATEMENT OF PLAN NET POSITION AND THE STATEMENT OF CHANGES IN PLAN NET POSITION
This Comprehensive Annual Financial Report (CAFR) consists of two financial statements; The Statement of Pension Plan and Other Postemployment Benefit Plan Net Position (page 20) and The Statement of Changes in Pension Plan and Other Postemployment Benefit Plan Net Position (page 21). These financial statements report information about the System, as a whole, and about its financial condition that should help answer the question: Is the System, as a whole, better off or worse off as a result of this year’s activities? These statements include all assets and liabilities using the economic resources measurement focus and the accrual basis of accounting. Under the accrual basis of accounting, all revenues and expenses are taken into account regardless of when cash is received or paid. The Statement of Pension Plan and Other Postemployment Benefit Plan Net Position presents all of the System’s assets and liabilities, with the difference between the two reported as net position. Over time, increases and decreases in net position measure whether the System’s financial position is improving or deteriorating. The Statement of Changes in Pension Plan and Other Postemployment Benefit Plan Net Position presents how the System’s net position changed during the most recent fiscal year. These two financial statements should be reviewed along with the Schedules of Funding Progress (page 45) and Schedules of Employer and Other Contributions (page 46) to determine whether the System is becoming financially stronger or weaker and to understand changes over time in the funded status of the System.
FINANCIAL SECTION
MICHIGAN PUBLIC SCHOOL EMPLOYEES’ RETIREMENT SYSTEM 17
Management’s Discussion and Analysis (continued) FINANCIAL ANALYSIS System total assets as of September 30, 2013, were $46.3 billion and were mostly comprised of cash, investments, and contributions due from employers. Total assets increased $2.5 billion or 5.7% between fiscal years 2012 and 2013, due primarily to net investment gains. Total liabilities as of September 30, 2013, were $3.7 billion and were comprised of warrants outstanding, accounts payable, deferred revenue, amounts due to other funds, and obligations under securities lending. Total liabilities decreased $0.5 billion or 12.2% between fiscal years 2012 and 2013 primarily due to decreased accounts payables and obligations under securities lending. System assets exceeded its liabilities at the close of fiscal year 2013 by $42.6 billion. Total net position restricted for pension and OPEB increased $3.0 billion or 7.6% from the previous year, primarily due to net investment gains.
Increase2013 2012 (Decrease)
AssetsEquity in common cash 302,756$ 152,975$ 97.9 %Receivables 380,108 354,391 7.3Investments 45,621,181 43,300,862 5.4
Total Assets 46,304,046 43,808,228 5.7
LiabilitiesWarrants outstanding 784 3,519 (77.7)Deferred revenue 3,183 2,497 27.5Accounts payable and other accrued liabilities 251,920 284,071 (11.3)Amounts due to other funds 486 100.0Obligations under securities lending 3,439,588 3,921,029 (12.3)
Total Liabilities 3,695,961 4,211,116 (12.2)
Total Net Position 42,608,084$ 39,597,112$ 7.6 %
Net Position
(in thousands)
FINANCIAL SECTION
18 MICHIGAN PUBLIC SCHOOL EMPLOYEES’ RETIREMENT SYSTEM
Management’s Discussion and Analysis (continued) ADDITIONS TO PLAN NET POSITION The reserves needed to finance pension and other postemployment benefits are accumulated through the collection of employer and employee contributions and through earnings on investments. Contributions and net investment income for fiscal year 2013 totaled approximately $8.2 billion. Total additions for fiscal year 2013 decreased approximately $415.4 million or 4.8% from those of fiscal year 2012 due primarily to decreased net investment income. Total contributions increased between fiscal years 2012 and 2013 by $126.5 million or 4.2%, while net investment income decreased $541.9 million or 9.7%. The Investment Section of this report reviews the results of investment activity for fiscal year 2013. DEDUCTIONS FROM PLAN NET POSITION
The primary expenses of the System include the payment of pension benefits to members and beneficiaries, payment for health, dental and vision benefits, refund of contributions to former members, and the cost of administering the System. Total deductions for fiscal year 2013 were $5.2 billion, an increase of 0.9% over fiscal year 2012 deductions. The health, dental, and vision care expenses during the year decreased by $74.3 million or 9.5%, from $785.9 million to $711.6 million. The payment of pension benefits increased by $156.2 million or 3.8% between fiscal years 2012 and 2013. In fiscal year 2013, the increase in pension benefit expenses resulted from an increase in retirees (4,291) and an increase in benefit payments to retirees. Administrative expenses decreased by $5.9 million or 3.3% between fiscal years 2012 and 2013, primarily due to a combination of a one-time bond guarantee expense in fiscal year 2012 and increased technological support in fiscal year 2013. Refunds and transfers to other systems increased by $5.3 million or 15.4% between fiscal years 2012 and 2013, due in part to the transfer of employee health contributions contributed after September 3, 2012, to ING for members electing the Personal Healthcare Fund.
FINANCIAL SECTION
MICHIGAN PUBLIC SCHOOL EMPLOYEES’ RETIREMENT SYSTEM 19
Management’s Discussion and Analysis (continued)
Increase2013 2012 (Decrease)
AdditionsMember contributions 779,847$ 723,038$ 7.9 %Employer contributions 2,337,139 2,250,034 3.9Other governmental contributions 9 17,406 (99.9)Net investment income (loss) 5,055,209 5,597,139 (9.7)Miscellaneous income 1,433 1,369 4.7 Total additions 8,173,637 8,588,987 (4.8)
DeductionsPension benefits 4,238,482 4,082,243 3.8Health care benefits 711,579 785,896 (9.5)Refunds and transfers to other systems 39,629 34,327 15.4Uncollectible receivables 37,551 (100.0)Administrative and other expenses 172,975 178,828 (3.3) Total deductions 5,162,665 5,118,844 0.9
Net increase (decrease) 3,010,972 3,470,143 (13.2)
Net Position - Beginning of Year 39,597,112 36,126,969 9.6Net Position - End of Year 42,608,084$ 39,597,112$ 7.6 %
Changes in Plan Net Position(in thousands)
RETIREMENT SYSTEM AS A WHOLE The System’s overall Net Position experienced an increase in 2013. The System’s rate of return for the Pension Plan’s investments decreased an overall 1.0% from a 13.5% return in fiscal year 2012 to a 12.5% return during fiscal year 2013. The system’s rate of return for the OPEB Plan’s investments decreased an overall 1.0% from a 13.3% return in fiscal year 2012 to a 12.3% return during fiscal year 2013. Management believes that the system remains financially sound and positioned to meet its ongoing benefit obligations due, in part, to a prudent investment program, cost controls, and strategic planning. CONTACTING SYSTEM FINANCIAL MANAGEMENT This financial report is designed to provide the Retirement Board, our membership, taxpayers, investors, and creditors with a general overview of the System’s finances and to demonstrate the System’s accountability for the money it receives. If you have any questions about this report or need additional financial information, contact the Office of Retirement Services, P.O. Box 30171, Lansing, MI 48909-7671.
FINANCIAL SECTION
20 MICHIGAN PUBLIC SCHOOL EMPLOYEES’ RETIREMENT SYSTEM
Statement of Pension Plan and Other Postemployment Benefit Plan Net Position As of September 30, 2013
Pension OPEB
Plan Plan Total
Assets:
Equity in common cash 197,219,547$ 105,536,240$ 302,755,787$
Receivables:
Amounts due from members 922,334 922,334
Amounts due from employers 119,530,359 45,160,791 164,691,150
Amounts due from other 66,191,997 66,191,997
Amounts due from employer long term 106,862,472 2,488,016 109,350,488
Amounts due from other long term 32,992,819 32,992,819
Interest and dividends 5,667,078 292,445 5,959,523
Total receivables 232,982,243 147,126,068 380,108,311
Investments:
Short term investment pools 1,417,904,803 624,709,708 2,042,614,511
Fixed income pools 4,973,723,297 256,541,667 5,230,264,964
Total liabilities 3,278,268,311 417,693,088 3,695,961,399
Net Position Restricted for Pension Benefits and OPEB: 40,015,539,616$ 2,592,544,527$ 42,608,084,143$
The accompanying notes are an integral part of these financial statements.
FINANCIAL SECTION
MICHIGAN PUBLIC SCHOOL EMPLOYEES’ RETIREMENT SYSTEM 21
Statement of Changes in Pension Plan and Other Postemployment Benefit Plan Net Position For Fiscal Year Ended September 30, 2013
Pension OPEBPlan Plan Total
Additions:Contributions: Member contributions 385,007,587$ 394,839,047$ 779,846,634$ Employer contributions: Colleges, universities and federal 119,897,655 87,032,149 206,929,804 School districts and other 1,244,238,807 885,970,570 2,130,209,377 Other governmental contributions 9,108 9,108
Total contributions 1,749,144,049 1,367,850,874 3,116,994,923
Investment income (loss): Net appreciation (depreciation) in fair value of investments 3,956,054,117 158,554,611 4,114,608,728 Interest, dividends, and other 949,630,880 39,445,126 989,076,006 Investment expenses: Real estate operating expenses (994,884) (41,229) (1,036,113) Other investment expenses (114,492,259) (4,187,287) (118,679,546) Securities lending activities: Securities lending income 78,537,316 3,399,083 81,936,399 Securities lending expenses (10,172,364) (524,099) (10,696,463)
Net investment income (loss) 4,858,562,806 196,646,205 5,055,209,011
Transfers from other systems 8,796 8,796 Miscellaneous income 1,347,458 76,676 1,424,134
Total additions 6,609,063,109 1,564,573,755 8,173,636,864
Deductions: Benefits and refunds paid to plan members and beneficiaries: Retirement benefits 4,238,482,066 4,238,482,066 Health benefits 612,955,516 612,955,516 Dental/vision benefits 98,623,167 98,623,167 Refunds of contributions 30,450,220 1,095,145 31,545,365 Transfers to other systems 1,015 8,082,513 8,083,528 Administrative and other expenses 25,002,153 147,972,842 172,974,995
Total deductions 4,293,935,454 868,729,183 5,162,664,637
Net Increase (Decrease) 2,315,127,655 695,844,572 3,010,972,227
Net Position Restricted for Pension Benefits and OPEB:Beginning of Year 37,700,411,961 1,896,699,955 39,597,111,916
End of Year 40,015,539,616$ 2,592,544,527$ 42,608,084,143$
The accompanying notes are an integral part of these financial statements.
FINANCIAL SECTION
22 MICHIGAN PUBLIC SCHOOL EMPLOYEES’ RETIREMENT SYSTEM
Notes to Basic Financial Statements September 30, 2013
NOTE 1 - PLAN DESCRIPTION
ORGANIZATION The Michigan Public School Employees’ Retirement System (System) is a cost-sharing, multiple employer, state-wide, defined benefit public employee retirement plan governed by the State of Michigan (State) originally created under Public Act 136 of 1945, recodified and currently operating under the provisions of Public Act 300 of 1980, as amended. Section 25 of this act establishes the board’s authority to promulgate or amend the provisions of the System. The System’s pension plan was established by the State to provide retirement, survivor and disability benefits to public school employees. In addition, the System’s health plan provides all retirees with the option of receiving health, dental and vision coverage under the Michigan Public School Employees’ Retirement Act. There are 706 participating employers. A list of employers is provided in the Statistical Section. The System is a qualified pension trust fund under section 401(a) of the Internal Revenue Code. By statute, employees of K-12 public school districts, public school academies, district libraries, tax-supported community colleges and seven universities may be members. The seven universities are: Eastern Michigan, Central Michigan, Northern Michigan, Western Michigan, Ferris State, Michigan Technological and Lake Superior State. Employees, who first become employed by one of the seven universities on or after January 1, 1996, become members of an alternative plan.
The System’s financial statements are included as a pension and other employee benefit trust fund in the State of Michigan Comprehensive Annual Financial Report.
The System is administered by the Office of Retirement Services within the Michigan Department of Technology, Management & Budget. The Department Director appoints the Office Director who serves as Executive Secretary to the System’s Board, with whom the general oversight of the System resides. The State Treasurer serves as the investment officer and custodian for the System.
MEMBERSHIP
At September 30, 2013, the System's membership consisted of the following:
Retirees and beneficiariescurrently receiving benefits: Regular benefits 178,510 Survivor benefits 16,370 Disability benefits 6,072 Total 200,952
Current Employees: Vested 110,926 Non-vested 103,980 Total 214,906
Inactive employees entitledto benefits and not yetreceiving them 16,235
Total all members 432,093
FINANCIAL SECTION
Notes to Basic Financial Statements (continued)
MICHIGAN PUBLIC SCHOOL EMPLOYEES’ RETIREMENT SYSTEM 23
Enrollment in the health plan is voluntary. The number of participants is as follows:
Health, Dental and Vision Plan
Eligible participants 198,240
Participants receiving benefits: Health 147,260 Dental/Vision 159,152
BENEFIT PROVISIONS - PENSION Introduction Benefit provisions of the defined benefit pension plan are established by State statute, which may be amended. Public Act 300 of 1980, as amended, establishes eligibility and benefit provisions for the defined benefit (DB) pension plan. Retirement benefits for DB plan members are determined by final average compensation and years of service. DB members are eligible to receive a monthly benefit when they meet certain age and service requirements. The System also provides disability and survivor benefits to DB plan members. A DB member or Pension Plus plan member who leaves Michigan public school employment may request a refund of his or her member contributions to the retirement system account. A refund cancels a former member’s rights to future benefits. However, returning members who previously received a refund of their contributions may reinstate their service through repayment of the refund upon satisfaction of certain requirements. Pension Reform 2010 On May 19, 2010, the Governor signed Public Act 75 of 2010 into law. As a result, any member of the Michigan Public School Employees’ Retirement System (MPSERS) who became a member of MPSERS after June 30, 2010 is a Pension Plus member. Pension Plus is a hybrid plan that contains a pension component with an employee contribution (graded, up to 6.4% of salary) and a flexible and transferable defined contribution (DC) tax-deferred investment account that earns an employer match of 50% (up to 1% of salary) on employee contributions. Retirement benefits for Pension Plus members are determined by final average compensation and years of service. Disability and survivor benefits are available to Pension Plus members. Pension Reform 2012 On September 4, 2012, the Governor signed Public Act 300 of 2012 into law. The legislation grants all active members who first became a member before July 1, 2010 and who earned service credit in the 12 months ending September 3, 2012, or were on an approved professional services or military leave of absence on September 3, 2012, a voluntary election regarding their pension. Any changes to a member’s pension are effective as of the member’s transition date, which is defined as the first day of the pay period that begins on or after February 1, 2013. Under the reform, members voluntarily chose to increase, maintain, or stop their contributions to the pension fund. Option 1 members voluntarily elected to increase their contributions to the pension fund as noted below, and retain the 1.5% pension factor in their pension formula. The increased contribution would begin as of their transition date and continue until they terminate public school employment.
Basic Plan members: 4% contribution Member Investment Plan (MIP)-Fixed, MIP-Graded, and MIP-Plus members: a flat 7% contribution
FINANCIAL SECTION
Notes to Basic Financial Statements (continued)
24 MICHIGAN PUBLIC SCHOOL EMPLOYEES’ RETIREMENT SYSTEM
Option 2 members voluntarily elected to increase their contribution to the pension fund as stated in Option 1 and retain the 1.5% pension factor in their pension formula. The increased contribution would begin as of their transition date and continue until they reach 30 years of service. If and when they reach 30 years of service, their contribution rates will return to the previous level in place as of the day before their transition date (0% for Basic Plan members, 3.9% for MIP-Fixed, up to 4.3% for MIP-Graded, or up to 6.4% for MIP-Plus). The pension formula for any service thereafter would include a 1.25% pension factor.
Option 3 members voluntarily elected not to increase their contribution to the pension fund and maintain their current level of contribution to the pension fund. The pension formula for their years of service as of the day before their transition date will include a 1.5% pension factor. The pension formula for any service thereafter will include a 1.25% pension factor.
Option 4 members voluntarily elected to no longer contribute to the pension fund and therefore are switched to the Defined Contribution plan for future service as of their transition date. As a DC participant they receive a 4% employer contribution to a tax-deferred 401(k) account and can choose to contribute up to the maximum amounts permitted by the IRS to a 457 account. They vest in employer contributions and related earnings in their 401(k) account based on the following schedule: 50% at 2 years, 75% at 3 years, and 100% at 4 years of service. They are 100% vested in any personal contributions and related earnings in their 457 account. Upon retirement, if they meet age and service requirements (including their total years of service), they would also receive a pension (calculated based on years of service and Final Average Compensation as of the day before their transition date and a 1.5% pension factor).
Members who did not make an election before the deadline defaulted to Option 3 as described above. Deferred or nonvested public school employees on September 3, 2012, who return to public school employment on or after September 4, 2012, will be considered as if they had elected Option 3 above. Returning members who made the retirement plan election will retain whichever option they chose. Employees who first work on or after September 4, 2012, choose between two retirement plans: the Pension Plus plan described above and a Defined Contribution (DC) plan that provides a 50% employer match (up to 3% of salary) on employee contributions. New employees are automatically enrolled as members in the Pension Plus plan as of their date of hire. They have 75 days from the last day of their first pay period, as reported to ORS, to elect to opt out of the Pension Plus plan and become a qualified participant in the DC plan; if no election is made they will remain in the Pension Plus plan. If they elect to opt out of the Pension Plus plan, their participation in the DC plan will be retroactive to their date of hire. Regular Retirement The retirement benefit for DB and Pension Plus plan members is based on a member’s years of credited service (employment) and final average compensation (FAC). The FAC is calculated based on the member’s highest total wages earned during a specific period of consecutive calendar months divided by the service credit accrued during that same time period. For a Member Investment Plan (MIP) member, who became a member of MPSERS prior to July 1, 2010, the averaging period is 36 consecutive months. For a Pension Plus member, who became a member of MPSERS after June 30, 2010, the averaging period is 60 consecutive months. For a Basic Plan member, this period is the 60 consecutive months yielding the highest total wages. The annual pension is paid monthly for the lifetime of a retiree. The calculation of a member’s pension is determined by their pension election under PA 300 of 2012 and is shown below: Option 1: FAC x total years of service x 1.5% Option 2: FAC x 30 years of service x 1.5% + FAC x years of service beyond 30 x 1.25% Option 3: FAC x years of service as of transition date x 1.5% + FAC x years of service after transition date x 1.25% Option 4: FAC as of transition date x years of service as of transition date x 1.5%
FINANCIAL SECTION
Notes to Basic Financial Statements (continued)
MICHIGAN PUBLIC SCHOOL EMPLOYEES’ RETIREMENT SYSTEM 25
A MIP member who became a member of MPSERS prior to July 1, 2010 may retire at:
1. age 46 with 30 or more years of credited service; or 2. age 60 with 10 or more years of credited service; or 3. age 60 with 5 years of credited service provided the member has worked through his or her 60th birthday and
has credited service in each of the five school fiscal years immediately preceding the retirement effective date. A Pension Plus member who became a member of MPSERS after June 30, 2010 may retire at age 60 with 10 or more years of credited service. A Basic Plan member may retire at: 1. age 55 with 30 or more years of credited service; or 2. age 60 with 10 or more years of credited service. There is no mandatory retirement age. Early Retirement A member may retire with an early permanently reduced pension: 1. after completing at least 15 but less than 30 years of credited service; and 2. after attaining age 55; and 3. with credited service in each of the 5 school years immediately preceding the pension effective date. The early pension is computed in the same manner as a regular pension, but is permanently reduced 0.5% for each full and partial month between the pension effective date and the date the member will attain age 60. Deferred Retirement If a member terminates employment before attaining the age qualification, but after accruing 10 or more years of credited service, the member becomes a deferred member and is eligible for a pension at the time the age qualification is attained. Non-Duty Disability Benefit A member with 10 or more years of credited service who becomes totally and permanently disabled due to any non-duty related cause and who has not met the age requirement for a regular pension is eligible for a non-duty disability pension computed in the same manner as an age and service pension, upon recommendation from the member’s personal physician and the Retirement Board physician and the approval of the Retirement Board. An Annual Certification of Disability is conducted each January. Upon prior approval, total disability benefits plus authorized outside earnings are limited to 100% of final average compensation (increased by two percent for each year retired; first year 100%, next year 102%, etc). Duty Disability Benefit A member who becomes totally and permanently disabled as a result of a duty-related cause, who has not met the age and service requirement for a regular pension, and who is in receipt of weekly workers’ compensation is eligible for a duty disability pension computed in the same manner as an age and service pension (but based upon a minimum of 10 years of service) upon recommendation from the member’s personal physician and the Retirement Board physician and the approval of the Retirement Board. An Annual Certification of Disability is conducted each January. Upon prior
FINANCIAL SECTION
Notes to Basic Financial Statements (continued)
26 MICHIGAN PUBLIC SCHOOL EMPLOYEES’ RETIREMENT SYSTEM
approval, total disability benefits plus authorized outside earnings are limited to 100% of final average compensation (increased by two percent for each year retired; first year 100%, next year 102%, etc). Forms of Payment The election of a pension option is made at the time of application. Once a member has retired, the option choice is irrevocable. The pension effective date is the first of the calendar month following the date the member has satisfied the age and service requirements, has terminated public school employment and has the completed application forms on file with the System for a period of 15 days. A retroactive pension can be paid for no more than 12 calendar months. Thus, delay in filing the application can result in a loss of some retroactive pension benefits. An applicant may select only one of the following options. Straight Life Pension - The Straight Life Pension pays the largest level pension a retiree can receive during his or her lifetime and stops with the month of a retiree’s death. There are no monthly benefits for a beneficiary. The pension benefit is computed with no beneficiary rights. If the retiree made contributions while an employee and has not received the total accumulated contributions before death, a refund of the balance of the contributions is made to the beneficiary of record. If the retiree did not make any contributions, there will not be payments to any beneficiaries. Survivor Options - Under the Survivor Options, 100% Survivor Pension, 100% Equated, 75% Survivor Pension, 75% Equated, 50% Survivor Pension and 50% Equated, the reduction is an actuarial determination dependent upon the combined life expectancies of a retiree and a beneficiary, and varies from case to case. A beneficiary may only be a spouse, brother, sister, parent or child (including an adopted child) of a retiring member. If the beneficiary pre-deceases a retiree, the pension will revert to either the Straight Life or Straight Life Equated amount (“pop-up” provision). If, however, a retiree was single at the time of retirement and subsequently married, the retiree can request to nominate a new spouse if they elected the straight life option at retirement. Also, if a retiree was married at the time of retirement and has since been widowed and remarried, the retiree can request to nominate a new spouse as a pension beneficiary as long as they elected a survivor option for the spouse at the time of retirement. 100% Survivor Pension - pays a reduced pension to a retiree. The month after a retiree’s death, the same amount will be paid to a designated beneficiary for the remainder of his or her lifetime. 75% Survivor Pension - pays a reduced pension to a retiree. The month after a retiree’s death, 75% of the pension amount will be paid to a designated beneficiary for the remainder of his or her lifetime. 50% Survivor Pension - pays a reduced pension to a retiree. The month after a retiree’s death, 50% of the pension amount will be paid to a designated beneficiary for the remainder of his or her lifetime. Equated Plan - The Equated Plan may be combined with the Straight Life, 100% Survivor, 75% Survivor, or 50% Survivor Pension by any member under age 61, except a disability applicant. The Equated Plan provides a higher pension every month until age 62, at which time the monthly pension is permanently decreased to a lower amount than the Straight Life, 100%, 75%, or 50% Survivor alone would provide. The intent of the Equated Plan is for the retiree’s pension to decrease at age 62 by approximately the same amount as that person’s Social Security benefit will provide. The System pension until age 62 should be about the same as the combined System pension and Social Security after age 62. The projected Social Security pension the retiring member obtains from the Social Security Administration and furnishes to the System is used in the Equated Plan calculation. The actual Social Security pension may vary from the estimate. NOTE: The reduction in the pension at age 62 pertains to the Equated Plan only and affects only the retiree. A beneficiary under 100% Equated, 75% Equated or 50% Equated will receive the 100%, 75%, or 50% Survivor amount
FINANCIAL SECTION
Notes to Basic Financial Statements (continued)
MICHIGAN PUBLIC SCHOOL EMPLOYEES’ RETIREMENT SYSTEM 27
the month following the retiree’s death as if the Equated Plan had not been chosen. A beneficiary does not participate in the Equated Plan. Survivor Benefit A non-duty survivor pension is available if a Member Investment Plan (MIP) member has 10 years of credited service or, if age 60 or older, with five years of credited service; the date they became a MIP member does not matter. The Basic Plan provides a survivor pension with 15 years of credited service or, if age 60 or older, with 10 years of credited service. An active member may nominate as a survivor beneficiary a spouse, child(ren) (including adopted child(ren)), brother, sister, or parent. If other than the spouse is nominated and a spouse exists, the spouse must waive this benefit. If no beneficiary has been nominated, the beneficiary is automatically the spouse; or, if there is no spouse, unmarried children under age 18 share the benefit equally until age 18. The benefit is computed as a regular pension but reduced in accordance with an Option 2 (100% survivor pension factor). The pension begins the first of the month following the member’s death. In the event of the death of a deferred member, the System begins payment to the nominated beneficiary at the time the member would have attained the minimum age qualification. A duty survivor pension is payable if weekly Workers’ Compensation is being paid to the eligible beneficiary due to the member’s death. A spouse receives the benefit (based on a minimum of 10 years of service credit) reduced in accordance with a l00% survivor pension factor. If there is no spouse, unmarried children under age 18 share the benefit equally until age 18; if there is no spouse or child(ren), a disabled and dependent parent is eligible. Post Retirement Adjustments A retiree who became a Member Investment Plan (MIP) member prior to July 1, 2010, receives an annual post-retirement non-compounded increase of three percent of the initial pension in the October following twelve months of retirement. Basic Plan members do not receive an annual post-retirement increase, but are eligible to receive a supplemental payment in those years when investment earnings exceed actuarial assumptions. Pension Plus members do not receive an annual post-retirement increase. On January 1, 1990, pre-October 1, 1981 retirees received an increase that ranged from 1% to 22% dependent upon the pension effective date. On October 1, 1990, the base pension of all retirees with an effective pension date of January 1, 1987, or earlier was increased to include all prior post-retirement adjustments. On January 1, 1986, all recipients through calendar year 1985 received a permanent 8% increase that established the 1986 base pension. In addition, each October, retirees with a pension effective date of January 1, 1987, or earlier receive a fixed increase equal to 3% of the base pension. Both increases are deducted from the distribution of excess investment income, if any. Beginning in 1983, eligible recipients receive an annual distribution of excess investment income, if any.
FINANCIAL SECTION
Notes to Basic Financial Statements (continued)
28 MICHIGAN PUBLIC SCHOOL EMPLOYEES’ RETIREMENT SYSTEM
Member Contributions Mandatory member contributions were phased out between 1974 and 1977, with the plan remaining noncontributory until January 1, 1987, when the Member Investment Plan (MIP) was enacted. MIP members enrolled prior to January 1, 1990, contribute at a permanently fixed rate of 3.9% of gross wages. The MIP contribution rate was 4.0% from January 1, 1987, the effective date of the MIP, until January 1, 1990, when it was reduced to 3.9%. Members first hired between January 1, 1990 and June 30, 2008, and returning members who did not work between January 1, 1987, through December 31, 1989, contribute at the following graduated permanently fixed contribution rates: 3% of the first $5,000; 3.6% of $5,001 through $15,000; 4.3% of all wages over $15,000. Members first hired July 1, 2008, or later including Pension Plus Plan members, contribute at the following graduated permanently fixed contribution rates: 3% of the first $5,000; 3.6% of $5,001 through $15,000; 6.4% of all wages over $15,000. Basic Plan members make no contributions. For a limited period ending December 31, 1992, an active Basic Plan member could enroll in the MIP by paying the contributions that would have been made had enrollment occurred initially on January 1, 1987, or on the date of hire, plus interest. MIP contributions at the rate of 3.9% of gross wages begin at enrollment. Actuarial rate of interest is posted to member accounts on July 1st on all MIP monies on deposit for 12 months. If a member leaves public school service and no pension is payable, the member’s accumulated contributions plus interest, if any, are refundable. Under Public Act 300 of 2012, eligible members voluntarily chose between increasing, maintaining, or stopping their contributions to the pension fund as of the transition date. Their options are described in detail under Pension Reform 2012 beginning on page 23. Members who elected to increase their level of contribution contribute 4% (Basic Plan) or 7% (MIP); by doing so they maintain a 1.5% pension factor in their pension formula. Members who elected to maintain their level of contribution will receive a 1.25% pension factor in their pension formula for their years of service as of their transition date. Their contribution rates are described above. Members who elected to stop their contributions became participants in the Defined Contribution plan as of their transition date. Employer Contributions Each school district or reporting entity is required to contribute the full actuarial funding contribution amount to fund pension benefits. BENEFIT PROVISIONS – OTHER POSTEMPLOYMENT Introduction Benefit provisions of the postemployment healthcare plan are established by State statute, which may be amended. Public Act 300 of 1980, as amended, establishes eligibility and benefit provisions. Retirees have the option of health coverage, which, through 2012, was funded on a cash disbursement basis. Beginning fiscal year 2013, it is funded on a prefunded basis. The System has contracted to provide the comprehensive group medical, hearing, dental and vision coverage for retirees and beneficiaries. A subsidized portion of the premium is paid by the System with the balance deducted from the monthly pension of each retiree health care recipient. For members who first worked before July 1, 2008, (Basic, MIP-Fixed, and MIP-Graded plan members) the subsidy is the maximum allowed by statute. To limit future liabilities of Other Postemployment Benefits, members who first worked on or after July 1, 2008, (MIP-Plus plan members) have a graded premium subsidy based on career length where they accrue credit towards their insurance premiums in retirement, not to exceed the maximum allowable by statute. Public Act 300 of 2012 sets the maximum subsidy at 80% beginning January 1, 2013; 90% for those Medicare eligible and enrolled in the insurances as of that date. Public Act 75 of 2010 requires each actively employed member of MPSERS after June 30, 2010, to annually contribute 3% of their compensation to offset employer contributions for health care benefits of current retirees.
FINANCIAL SECTION
Notes to Basic Financial Statements (continued)
MICHIGAN PUBLIC SCHOOL EMPLOYEES’ RETIREMENT SYSTEM 29
Dependents are eligible for health care coverage if they meet the dependency requirements set forth in Public Act 300 of 1980, as amended. The number of participants and other relevant financial information are as follows:
Employer payroll contribution rate 9.11% Applications for enrollment after retirement are accepted anytime during the year, with coverage effective six months following the receipt of the application. Retiree Healthcare Reform of 2012 Public Act 300 of 2012 granted all active members of the Michigan Public School Employees Retirement System, who earned service credit in the 12 months ending September 3, 2012, or were on an approved professional services or military leave of absence on September 3, 2012, a voluntary election regarding their retirement healthcare. Any changes to a member’s healthcare benefit are effective as of the member’s transition date, which is defined as the first day of the pay period that begins on or after February 1, 2013. Under Public Act 300 of 2012, members were given the choice between continuing the 3% contribution to retiree healthcare and keeping the premium subsidy benefit described above, or choosing not to pay the 3% contribution and instead opting out of the subsidy benefit and becoming a participant in the Personal Healthcare Fund (PHF), a portable, tax-deferred fund that can be used to pay healthcare expenses in retirement. Participants in the PHF are automatically enrolled in a 2% employee contribution into their 457 account as of their transition date, earning them a 2% employer match into a 401(k) account. Members who selected this option stop paying the 3% contribution to retiree healthcare as of the day before their transition date, and their prior contributions will be deposited into their 401(k) account no later than their first pay date after March 1, 2013. Members who did not make an election before the deadline retain the subsidy benefit and continue making the 3% contribution toward retiree healthcare. Deferred or nonvested members on September 3, 2012 who are rehired on or after September 4, 2012, will contribute 3% to retiree healthcare and will retain the subsidy benefit. Returning members who made the retirement healthcare election will retain whichever option they chose. Those who elected to retain the premium subsidy continue to annually contribute 3% of compensation into the health care funding account. A member or former member age 60 or older, who made the 3% healthcare contributions but who does not meet eligibility requirements may request a refund of their contributions. Similarly, if a retiree dies before the total value of the insurance subsidy paid equals the total value of the contributions the member made, and there are no eligible dependents, the beneficiary may request a refund of unused funds. Refunds of member contributions to the healthcare funding account are issued as a supplemental benefit paid out over a 60 month period. 1. Retirees with at least 21 years of service, who terminate employment after October 31, 1980, with vested deferred benefits, are eligible for subsidized employer paid health benefit coverage. 2. A delayed subsidy applies to retirees who became a member of the retirement system before July 1, 2008 and who purchased service credit on or after July 1, 2008. Such individuals are eligible for premium subsidy benefits at age 60 or
FINANCIAL SECTION
Notes to Basic Financial Statements (continued)
30 MICHIGAN PUBLIC SCHOOL EMPLOYEES’ RETIREMENT SYSTEM
when they would have been eligible to retire without having made a service purchase, whichever comes first. They may enroll in the insurances earlier, but are responsible for the full premium until the premium subsidy begins. Under Public Act 300 of 2012, the state no longer offers an insurance premium subsidy in retirement for public school employees who first work on or after September 4, 2012. Instead, all new employees will be placed into the Personal Healthcare Fund where they will have support saving for retirement healthcare costs in the following ways:
They will be automatically enrolled in a 2% employee contribution into a 457 account as of their date of hire, earning them a 2% employer match into a 401(k) account.
They will receive a credit into a Health Reimbursement Account (HRA) at termination if they have at least 10 years of service at termination. The credit will be $2,000 for participants who are at least 60 years of age at termination or $1,000 for participants who are less than 60 years of age at termination.
Participants in the Personal Healthcare Fund, who become disabled for any reason, are not eligible for any employer funded health insurance premium subsidy. If a PHF participant suffers a non-duty related death, his or her health benefit dependents are not eligible to participate in any employer funded health insurance premium subsidy. If a PHF participant suffers a duty death, the state will pay the maximum health premium allowed by statute for the surviving spouse and health benefit dependents. The spouses’ insurance subsidy may continue until his or her death, the dependents’ subsidy may continue until their eligibility ends (through marriage, age, or other event). Upon eligibility for a duty death benefit, the 2% employer matching contributions and related earnings in the PHF 401(k) are forfeited and the state will pay for the subsidy payments. The beneficiaries receive the member’s personal contributions and related earnings in the PHF 457 account. NOTE 2 - SUMMARY OF SIGNIFICANT ACCOUNTING POLICIES
Basis of Accounting and Presentation The System’s financial statements are prepared using the accrual basis of accounting. Contributions from the employers are recognized as revenue when due and payable. Benefits and refunds are recognized when due and payable in accordance with the terms of the System. The reserves are described below and details are provided in the supporting schedules.
Reserves Reserve for Employee Contributions - This reserve represents active member contributions and interest less amounts transferred to the Reserve for Retired Benefit Payments for regular and disability retirement, amounts refunded to terminated members, and amounts transferred to the Reserve for Employer Contributions representing unclaimed funds. Members no longer contribute to this reserve except to purchase eligible service credit or repay previously refunded contributions. At September 30, 2013, the balance in this reserve was $1.5 billion. Reserve for Pension Plus Employee Contributions - This reserve represents active member contributions and interest less amounts transferred to the Reserve for Pension Plus Retired Benefit Payments for regular retirement, amounts refunded to terminated members, and amounts transferred to the Reserve for Pension Plus Employer Contributions representing unclaimed funds. This reserve was established under the provisions of Public Act 75 of 2010. At September 30, 2013, the balance in this reserve was $34.2 million. Reserve for Member Investment Plan - This reserve represents MIP contributions and interest less refunds and transfers to the Reserve for Retired Benefit Payments. At September 30, 2013, the balance in this reserve was $4.4 billion.
Reserve for Employer Contributions – This reserve represents all reporting unit contributions, except payments for health benefits. Interest from the Reserve for Undistributed Investment Income reserve is credited annually. Amounts are transferred annually to the Reserve for Retired Benefit Payments to bring the balance of that reserve into balance with the actuarial present value of retirement allowances. At September 30, 2013, the balance in this reserve was ($27.7) billion.
FINANCIAL SECTION
Notes to Basic Financial Statements (continued)
MICHIGAN PUBLIC SCHOOL EMPLOYEES’ RETIREMENT SYSTEM 31
Reserve for Pension Plus Employer Contributions – This reserve represents all reporting unit contributions for Pension Plus members, except payments for health benefits. Interest from the Reserve for Undistributed Investment Income reserve is credited annually at a rate of 7%. Amounts are transferred annually to the Reserve for Retired Pension Plus Benefit Payments to bring the balance of that reserve into balance with the actuarial present value of retirement allowances. This reserve was established under the provisions of Public Act 75 of 2010. At September 30, 2013, the balance in this reserve was $28.5 million. Reserve for Retired Benefit Payments - This reserve represents payments of future retirement benefits to current retirees. At retirement, a member’s accumulated contributions plus interest are transferred into this reserve. Monthly benefits, which are paid to the retiree, reduce this reserve. At the end of each fiscal year, an amount, determined by an annual actuarial valuation, is transferred from the Reserve for Employer Contributions to bring the balance of this reserve into balance with the actuarial present value of retirement allowances. At September 30, 2013, the balance in this reserve was $43.5 billion. Reserve for Retired Pension Plus Benefit Payments - This reserve represents payments of future retirement benefits to current Pension Plus retirees. At retirement, a member’s accumulated contributions plus interest are transferred into this reserve. Monthly benefits, which are paid to the retiree, reduce this reserve. At the end of each fiscal year, an amount, determined by an annual actuarial valuation, is transferred from the Reserve for Pension Plus Employer Contributions to bring the balance of this reserve into balance with the actuarial present value of retirement allowances. This reserve was established under the provisions of Public Act 75 of 2010. Currently, there are no participants qualified to retire under this program. At September 30, 2013, the balance in this reserve was $0.
Reserve for Undistributed Investment Income – This reserve represents all investment earnings. Interest is transferred annually to the other reserves. Administrative expenses of the System are paid from the Reserve for Administrative Expenses, which is credited with amounts from the Reserve for Undistributed Investment Income to cover the expenses. For ease of reporting and understanding, the two reserves are presented as one reserve in the supporting schedules. Public Act 143 of 1997 established a stabilization subaccount within the Reserve for Undistributed Investment Income to which any over funding is credited. As of September 30, 2013, the balance in the subaccount was zero. At September 30, 2013, the balance in this reserve was $18.2 billion. Reserve for Health (OPEB) Related Benefits - This reserve is credited with employee and employer contributions for retirees’ health, dental, and vision benefits. Starting in fiscal year 2013, the employer contribution is based on a prefunded basis and represents a level of funding that, if paid on an ongoing basis, is projected to cover normal cost each year and amortize any unfunded actuarial liability (or funding excess) over a period not to exceed thirty years. In addition, in fiscal year 2013, federal funding for Medicare Part D and Employer Group Waiver Plan (EGWP) was paid directly to a third party vendor. The third party vendor uses the Retiree Drug Subsidy (RDS) funding for any claims submitted and bills the system for any remaining claims outstanding. Premiums for health, dental and vision benefits are paid from this reserve. At September 30, 2013, the balance in this reserve was $2.6 billion. Reporting Entity The System is a pension and other employee benefit trust fund of the State. As such, the System is considered part of the State and is included in the State’s Comprehensive Annual Financial Report as a pension and other employee benefit trust fund. The System and its Board are not financially accountable for any other entities or other organizations. Accordingly, the System is the only entity included in this financial report.
FINANCIAL SECTION
Notes to Basic Financial Statements (continued)
32 MICHIGAN PUBLIC SCHOOL EMPLOYEES’ RETIREMENT SYSTEM
Benefit Protection Public Act 100 of 2002 was passed by the Michigan Legislature to protect pension benefits of public employees from alienation (being transferred). Alienation is attachment, garnishment, levy, execution, bankruptcy or other legal process except for divorce orders or eligible domestic relation orders. The statutes governing the System contained an “anti- alienation” clause to provide for this protection; however, many smaller public pension systems did not have the benefit of this protection. Therefore, Public Act 100 of 2002 was passed to establish legal protection of pension assets that encompasses all public employees. Fair Value of Investments Plan investments are reported at fair value. Securities traded on a national or international exchange are valued at the last reported sales price at current exchange rates. Corporate bonds not traded on a national or international exchange are based on equivalent values of comparable securities with similar yield and risk. The fair value of private investments is based on the net asset value reported in the financial statements of the respective investment entity. The net asset value is determined in accordance with governing documents of the investment entity, and is subject to an independent annual audit. Securities purchased with cash collateral under securities lending activities are recorded at estimated fair value. Other investments not having an established market are recorded at estimated fair value. Investment Income Dividend and interest income is recognized on the accrual basis. Fair value changes are recorded as investment income or loss. Purchases and sales of investments are recorded as of the trade date (the date upon which the transaction is initiated), except for purchase and sale of mortgages, real estate, and alternative investments which are recorded as of the settlement date (the date upon which the transaction is ultimately completed). The effect of recording such transactions as of the settlement date does not materially affect the financial statements. Costs of Administering the System Each year a restricted general fund appropriation is requested to fund the on-going business operations of the System. These administrative costs are ultimately funded by the System through the regular transfer of funds from the System to the State’s general fund based on either a direct cost or allocation basis depending on the nature of the expense. Costs of administering the System are financed by undistributed investment income of the System. Property and Equipment Office space is leased from the State on a year to year basis. Office equipment is capitalized if the value exceeds $5,000. These assets are recorded at cost and are reported net of depreciation in the Statement of Pension Plan and Other Post-employment Benefit Plan Net Position. Such assets are depreciated on a straight-line basis over 10 years. As of September 30, 1998, all capitalized equipment was fully depreciated. No additional equipment has been capitalized for the System since that date. Related Party Transactions Leases and Services - The System leases operating space and purchases certain administrative, data processing, legal and investment services from the State. The space and services are not otherwise available by competitive bid. The schedule below summarizes costs incurred by the System for such services.
2013
Building Rentals 983,997$ Technological Support 8,847,387 Attorney General 445,225 Investment Services 12,796,707 Personnel Services 10,507,765
FINANCIAL SECTION
Notes to Basic Financial Statements (continued)
MICHIGAN PUBLIC SCHOOL EMPLOYEES’ RETIREMENT SYSTEM 33
Cash - At September 30, 2013, the System had $302.8 million in a common cash investment pool maintained for various State operating funds. The participating funds in the common cash pool earn interest at various rates depending upon prevailing short-term interest rates. Earnings from these activities amounted to $31.0 thousand for the year ended September 30, 2013. NOTE 3 - CONTRIBUTIONS AND FUNDED STATUS Contributions The majority of the members currently participate on a contributory basis. Reporting units are required by Public Act 300 of 1980, as amended, to contribute amounts necessary to finance the coverage of members and retiree OPEB. Contribution provisions are specified by State statute and may be amended only by action of the State Legislature. Employer contributions to the System are determined on an actuarial basis using the entry age normal actuarial cost method. Under this method, the actuarial present value of the projected benefits of each individual included in the actuarial valuation is allocated on a level basis over the service of the individual between entry age and assumed exit age. The portion of this cost allocated to the current valuation year is called the normal cost. The remainder is called the actuarial accrued liability. Normal cost is funded on a current basis. For retirement and OPEB benefits, the unfunded(overfunded) actuarial accrued liability will be amortized over a 23 year period for the 2013 fiscal year. Actual employer contributions for retirement benefits were $1,364.1 million for fiscal year 2013. The fiscal year 2013 annual covered payroll is not yet available. Required employer contributions based on previous year actuarial valuations for pensions included:
1. $390.0 million for fiscal year 2013 for the normal cost of pensions representing 4.5% (before reconciliation) of annual covered payroll for fiscal year 2012.
2. $1,541.9 million for fiscal year 2013 for amortization of unfunded actuarial accrued liability representing
17.8% (before reconciliation) of annual covered payroll for fiscal year 2012. Actual employer contributions for other postemployment benefits (OPEB) were $973.0 million for fiscal year 2013. The fiscal year 2013 annual covered payroll is not yet available. Required employer contributions based on previous year actuarial valuations for OPEB included:
1. $392.4 million for fiscal year 2013 for the normal cost of OPEB representing 4.5% (before reconciliation) of annual covered payroll for fiscal year 2012.
2. $1,074.5 million for fiscal year 2013 for amortization of unfunded actuarial accrued liability representing
12.4% (before reconciliation) of annual covered payroll for fiscal year 2012. The System is required to reconcile with actuarial requirements annually. Any funding excess or deficiency for pension benefits is smoothed over 5 years. One-fifth (20%) of the funding excess or deficiency is included in the subsequent year’s contribution, and is not recognized as a payable or receivable in the accounting records.
In May 1996, the Internal Revenue Service issued a private letter ruling allowing the System’s members to purchase service credit and repay refunds using tax-deferred (pre-tax) dollars. The program was implemented in fiscal year 1998, and payments began in fiscal year 1999.
The program allows members to purchase service credit and repay refunds on a tax-deferred basis. Members sign an irrevocable agreement that identifies the contract duration, monthly payment, total contract amount and years of service credit being purchased. The duration of the contract can range from 1 to 20 years. The amounts are withheld from members’ paychecks and are treated as employer pick-up contributions pursuant to Internal Revenue Code Section 414(h). At September 30, 2013, there were 20,046 agreements. The agreements were discounted using the assumed
FINANCIAL SECTION
Notes to Basic Financial Statements (continued)
34 MICHIGAN PUBLIC SCHOOL EMPLOYEES’ RETIREMENT SYSTEM
actuarial rate of return of 8% for September 30, 2013. The average remaining length of a contract was approximately 6.3 years for 2013. The short-term receivable was $35.2 million and the discounted long-term receivable was $102.6 million at September 30, 2013. Funded Status Participating employers are required to contribute at an actuarially determined rate for both pension benefits and OPEB. For fiscal year 2012, the actuarial accrued liability (AAL) for pension benefits was $62.7 billion, and the actuarial value of assets was $38.4 billion, resulting in an unfunded actuarial accrued liability (UAAL) of $24.3 billion and a funded ratio of 61.3%. The covered payroll (annual payroll of active employees covered by the plan) was $8.6 billion, and the ratio of the UAAL to the covered payroll was 280.6%. For fiscal year 2012, the actuarial accrued liability (AAL) for OPEB benefits was $14.8 billion, and the actuarial value of assets was $1.3 billion, resulting in an unfunded actuarial accrued liability (UAAL) of $13.4 billion and a funded ratio of 9.1%. The covered payroll (annual payroll of active employees covered by the plan) was $8.6 billion, and the ratio of the UAAL to the covered payroll was 155.4%. Actuarial Valuations and Assumptions Actuarial valuations for both the pension and OPEB plans involve estimates of the value of reported amounts and assumptions about the probability of occurrence of events far into the future. Examples include assumptions about future employment, mortality and the healthcare cost trend. Amounts determined regarding the funded status of the plan and the annual required contributions (ARC) are subject to continual revision as actual results are compared with past expectations and new estimates are made about the future (see note 5). The schedule of funding progress, presented as required supplementary information following the notes to the financial statements, presents multi-year trend information about whether the actuarial value of plan assets for both pension and OPEB plans is increasing or decreasing over time relative to the actuarial accrued liabilities for benefits. The accompanying schedules of employer contributions present trend information about the amounts contributed to the plan by employers in comparison to the ARC, an amount that is actuarially determined in accordance with the parameters of GASB Statement No. 25 for pension contributions and GASB Statement No. 43 for OPEB contributions. Projections of benefits for financial reporting purposes are based on the substantive plan (the plan as understood by the employer and plan members) and include the types of benefits provided at the time of each valuation and the historical pattern of sharing of benefit costs between the employer and plan members to that point. The actuarial methods and assumptions used include techniques that are designed to reduce the effects of short term volatility in actuarial accrued liabilities and the actuarial value of assets, consistent with the long-term perspective of the calculations.
FINANCIAL SECTION
Notes to Basic Financial Statements (continued)
MICHIGAN PUBLIC SCHOOL EMPLOYEES’ RETIREMENT SYSTEM 35
The information presented in the required supplementary schedules was determined as part of the actuarial valuations at the dates indicated. Additional information as of the latest actuarial valuation follows:
Summary of Actuarial Assumptions
Valuation Date 9/30/2012Actuarial Cost Method Entry Age, NormalAmortization Method - Pension Level Percent of Payroll, ClosedAmortization Method - OPEB Level Percent of Payroll, Closed
Actuarial Assumptions: Wage Inflation Rate 3.5% Investment Rate of Return - Pension - MIP and Basic Plans 8.0% - Pension Plus Plan 7.0% Investment Rate of Return - OPEB 8.0% Projected Salary Increases 3.5 - 15.9% Cost-of-Living Pension Adjustments 3% Annual Non-Compounded for MIP Members Healthcare Cost Trend Rate 8.5% Year 1 graded to 3.5% Year 12
Other Assumptions OPEB only: 2
Opt Out Assumption 21% of eligible participants hired before 7/1/2008and 30% of those hired after 6/30/2008 areassumed to opt out of the retiree health plan
Survivor Coverage 80% of male retirees and 67% of female retireesare assumed to have coverage continuing after the
retiree's death Coverage Election at Retirement 75% of male and 60% of female future retirees are
assumed to elect coverage for 1 or moredependents
1 Based on the provisions of GASB Statement Nos. 25, 43 and 45 when the actuarial accrued liability for a defined benefit pension plan is underfunded or overfunded, the difference should be amortized over a period not to exceed thirty years for the fiscal periods beginning on or after June 15, 2006. 2 Applies to individuals hired before September 4, 2012.
FINANCIAL SECTION
Notes to Basic Financial Statements (continued)
36 MICHIGAN PUBLIC SCHOOL EMPLOYEES’ RETIREMENT SYSTEM
NOTE 4 - INVESTMENTS Investment Authority Under Public Act 380 of 1965, as amended, the authority for the purchase and the sale of investments resides with the State Treasurer. Investments are made subject to the Public Employee Retirement System Investment Act, Public Act 314 of 1965, as amended. The Public Employee Retirement System Investment Act authorizes, with certain restrictions, the investment of pension fund assets in stocks, corporate and government bonds and notes, mortgages, real estate, and certain short-term and alternative investments. Investments must be made for the exclusive purposes of providing benefits to active members, retired members and beneficiaries, and for defraying the expenses of investing the assets. Derivatives The State Treasurer employs the use of derivatives in the investment of the pension and other employee benefit trust funds (the trust funds). Derivatives are used in managing the trust fund portfolios, but uses do not include speculation or leverage of investments. Less than 12% of the total trust funds’ portfolio has been invested from time to time in future contracts, swap agreements, structured notes, option and forward contracts. State investment statutes limit total derivative exposure to 15% of a fund’s total asset value, and restrict uses to replication of returns and hedging of assets. Swap agreements represent the largest category of derivative investments subject to this limitation. Option and Future contracts traded daily on an exchange and settling in cash daily or having a limited and fully defined risk profile at an identified, fixed cost are not subject to the derivative exposure limitation. The derivative fair values are reported on the Statement of Pension Plan and Other Postemployment Benefit Plan Net Position as of September 30, 2013, in their respective investment pools market value. Derivative net appreciation and depreciation are reported on the Statement of Changes in Pension Plan and Other Postemployment Benefit Plan Net Position for fiscal year ended September 30, 2013, under “Investment income gain / (loss)”, in “Net appreciation (depreciation) in fair value of investments”. Bond interest, swap payments, and dividends are reported under “Investment Income”, in “Interest, Dividends, and other”.
FINANCIAL SECTION
Notes to Basic Financial Statements (continued)
MICHIGAN PUBLIC SCHOOL EMPLOYEES’ RETIREMENT SYSTEM 37
Derivative Investment Table as of September 30, 2013 (In Millions):
NetPercentage Appreciation Investment Fair Value
Investment and of Market Notional Investments (Depreciation) Income Subject toInvestment Type Value Value At Fair Value in Fair Value FY2013 Credit Risk
Structured NotesAbsolute Return Investments
U.S. Treasury Bond Future ContractsFixed Income Investments
To diversify the trust funds’ portfolio, the State Treasurer has entered into international swap agreements with investment grade counterparties, which are tied to stock market indices in forty foreign countries. Generally, one quarter or less of the notional amount tied to foreign stock market indices is hedged against foreign currency fluctuations. The swap agreements provide that the System will pay quarterly over the term of the swap agreements, interest indexed to the three month London Inter Bank Offer Rate (LIBOR), adjusted for an interest rate spread, on the notional amount stated in the agreements. International equity swap agreement maturity dates range from October 2013 to September 2014. The U.S. Domestic LIBOR based floating rate notes and other investments are held to correspond with the notional amount of the international swap agreements. The value of the international synthetic equity structures is a combination of the value of the swap agreements and the value of the notes and other investments. The book value represents the cost of the notes and other investments. The current value represents the current value of the notes and other investments and the change in the value of the underlying indices from the inception of the swap agreements. The current value is used as a representation of the fair value based on the intention to hold all swap agreements until maturity. At the maturity of the swap agreements, the trust funds will either receive the increase in the value of the equity indices from the level at the inception of the agreements, or pay the decrease in the value of the indices. The combined swap structure generally realizes gains and losses on a rolling basis. In May 2011, domestic equity swaps were added to the trust funds’ portfolio for the Domestic Equity Pools. The swap agreements provide that the System will pay interest quarterly or annually over the term of the swap agreements, interest indexed to the LIBOR, adjusted for an interest rate spread, on the notional amount stated in the agreements. Domestic equity swaps value is a combination of the value of the swap agreements and the value of short-term and equity investments. Book value represents the cost of short-term and equity investments. Current value represents the fair value of the short-term investments and the change in the value of the underlying indices from the inception of the swap agreements. Domestic equity swaps’ appreciation/(depreciation) primarily reflects the net changes in the domestic indices and increases in short-term and equity investments.
FINANCIAL SECTION
Notes to Basic Financial Statements (continued)
38 MICHIGAN PUBLIC SCHOOL EMPLOYEES’ RETIREMENT SYSTEM
Counterparty credit risk is the maximum loss amount that would be incurred if the counterparties to the derivative instrument failed to perform according to the terms of the contract, without respect to any collateral or other security, or netting arrangement. To get enhanced passive exposure to the Dow Jones UBS Commodity Total Return Index, the State Treasurer purchased structured notes from investment grade counterparties for the Absolute Return Pools. These notes are fully collateralized and pay cash rates on the underlying collateral, as well as providing the enhanced index return. Similar to a swap agreement with prices changing with the underlying index fluctuations, the notes differ due to their daily put option which allows the structure to end and settle before the note’s maturity. The maturity dates on the structured notes range from June 2014 through July 2019. The State Treasurer traded U. S. Treasury bond future contracts to manage duration and yield curve exposure. To provide downside protection and enhance current income, the State Treasurer traded covered equity options on single securities for the Absolute Return and Equity Investment pools. Put options are used to protect against large negative moves in single stocks, as well as to express interest in a security that is trading well below its intrinsic value. Call options have been used to achieve current income on single equity securities that are trading near their intrinsic value. Securities Lending State statutes allow the System to participate in securities lending transactions, and the System has, by way of an Agreement, authorized Credit Suisse, the agent bank, to lend the System’s securities to broker-dealers and banks pursuant to a form of loan agreement. During the fiscal year, the agent bank lent, at the direction of the State Treasurer, the System’s securities and received cash (United States) as collateral. The types of securities lent were equity, and fixed income, which includes government and corporate bonds and notes. Borrowers were required to deliver collateral for each loan equal to (i) in case of loaned securities denominated in United States dollars or whose primary trading market was located in the United States or sovereign debt issued by foreign governments, 102% of the fair value of the loaned securities; and (ii) in the case of loaned securities not denominated in United States dollars or whose primary trading market was not located in the United States, 105% of the fair value of the loaned securities. The agent bank agreed to indemnify the System by purchasing replacement securities, or returning cash collateral in the event borrower failed to return the loaned security or pay distributions thereon, due to the borrower’s insolvency. Under Master Securities Lending Agreements between the System and each borrower, the System and the borrowers have the right to terminate all securities lending transactions on demand. The cash collateral received on each loan was invested in assets held in a collateral account dedicated to the System. As of September 30, 2013, such assets had an average weighted maturity to next reset of 3.6 years and an average weighted maturity of 13.4 years. Because the loans are terminable at will, their duration did not generally match the duration of the investments made with cash collateral. On September 30, 2013, the System had no credit risk exposure to borrowers. The cash received for securities on loan for the System as of September 30, 2013, was $3,439,587,523. The fair market value of assets held in the dedicated collateral account at the custodian for the System as of September 30, 2013, was $2,703,163,095. The carrying amount, which is the fair market value, of securities on loan for the System as of September 30, 2013, was $3,362,504,181. Gross income, including capital gains and losses, from security lending for fiscal year ended September 30, 2013, with Credit Suisse was $81,936,401. Expenses associated with this income were the borrower’s rebate of $3,251,132 and fees paid to the agent bank of $7,445,331.
FINANCIAL SECTION
Notes to Basic Financial Statements (continued)
MICHIGAN PUBLIC SCHOOL EMPLOYEES’ RETIREMENT SYSTEM 39
Risk In accordance with GASB Statement No. 40, investments require certain disclosures regarding policies and practices and the risks associated with them. The credit risk, (including custodial credit risk and concentration of credit risk), the interest rate risk, and the foreign currency risk are discussed in the following paragraphs. Amounts represent the pro rata share of the underlying investments as required by GASB Statement No. 40. These are held in internal investment pools and reported as such in the financial statements. Credit Risk - Credit risk is the risk that an issuer will not fulfill its obligations.
Short-Term Fixed Income Investments - Prime commercial paper investments must be rated A-1 or P-1 at the
time of purchase as rated by the two major rating services Standard and Poor’s Corporation (S&P) and Moody’s Investor Service (Moody’s), respectively. Borrowers must have at least $400.0 million in commercial paper outstanding, and the State Treasurer may not invest in more than 10% of the borrower’s outstanding debt. The investments are further limited to $200.0 million in any borrower, unless the borrower has an A-1+ rating in which case the investment is not to exceed $300.0 million.
Long-Term Fixed Income Investments – Investment grade and noninvestment grade securities may be acquired
in compliance with the parameters set forth in Public Act 314 of 1965, as amended, and the State Treasurer’s investment policy. Law defines investment grade as investments in the top four major grades, rated by two national rating services, S&P (AAA, AA, A, BBB) and Moody’s (Aaa, Aa, A, Baa). At September 30, 2013, the System was in compliance with the policy in all material aspects.
FINANCIAL SECTION
Notes to Basic Financial Statements (continued)
40 MICHIGAN PUBLIC SCHOOL EMPLOYEES’ RETIREMENT SYSTEM
Investment Type Fair Value S&P Fair Value Moody's
Short Term 1,754,505$ A-1 1,754,505$ P-1
Government SecuritiesU.S. Agencies - Sponsored - AAA 550,571 Aaa
550,571 AA - Aa
Corporate Bonds & Notes30,822 AAA 65,411 Aaa
530,555 AA 299,076 Aa 1,790,942 A 1,720,572 A1,124,840 BBB 1,235,745 Baa
95,301 BB 163,572 Ba 77,325 B 82,163 B
1,331 CCC 10,337 Caa- CC 578 Ca - C 2 C
1,149 D - D374,104 NR 448,913 NR
International *301,308 AA 245,784 Aa101,889 A 278,988 A
78,219 BBB 78,219 Baa196,048 NR 74,473 NR
Securities Lending CollateralShort Term 399,331 NR 399,331 NR
- AAA 292,620 Aaa292,620 AA 45,491 Aa
47,836 A 2,345 A16,757 BB 1,725,772 Ba
223,018 CCC 165,244 Caa- C 57,774 Ca
1,709,015 NR - NR
Total 9,697,486$ 9,697,486$
NR - not rated
* International Investment types consist of domestic floating rate note used as part of a Swap strategy.
Rated Debt Investments(in thousands)
As of September 30, 2013
FINANCIAL SECTION
Notes to Basic Financial Statements (continued)
MICHIGAN PUBLIC SCHOOL EMPLOYEES’ RETIREMENT SYSTEM 41
Custodial Credit Risk - Custodial credit risk for investments is the risk that, in the event of a failure of the counterparty, the State will not be able to recover the value of the investment or collateral securities that are in the possession of an outside party. Investment securities are exposed to custodial credit risk if the securities are uninsured, are not registered in the name of the government and are held by either:
The counterparty or
The counterparty’s trust department or agent but not in the government name. The State Treasurer does not have a policy for custodial credit risk. However, the State’s custodial bank had a credit rating of A+ at September 30, 2013. As of September 30, 2013, no securities were exposed to custodial credit risk. Concentration of Credit Risk - Concentration of credit risk is the risk of loss attributed to the magnitude of a government’s investment in a single issuer. Other than obligations issued, assumed or guaranteed by the United States, its agencies or United States government sponsored enterprises, the System is prohibited by Public Act 314 of 1965, as amended, from investing in more than 5% of the outstanding obligations of any one issuer or investing more than 5% of a System’s assets in the obligations of any one issuer. At September 30, 2013, there were no investments in any single issuer that accounted for more than 5% of the System’s assets. The System held one investment that exceeded the 5% cap in obligations of any one issuer, The System is aware of breach and, in accordance with MCL 38.1133(3)(g), is developing a prudent plan for reallocating assets to comply with the prescribed limitation. Interest Rate Risk - Fixed Income Investments - Interest rate risk is the risk that changes in interest rates of debt investments will adversely affect the fair value of an investment. The State Treasurer’s policy states that cash equivalents are invested in short-term fixed income securities with an average weighted maturity of less than one year to provide liquidity and safety of principal from capital market and default risk. At September 30, 2013, the fair value of the System’s prime commercial paper was $1,754.5 million with the weighted average maturity of 19 days. The State Treasurer does not have a policy regarding interest rate risk for long-term debt investments. However, the trust funds are invested with a long-term strategy. The goal is to balance higher returns while accepting minimum risk for the return. Analyzing the yield curve on individual securities as compared to U.S. Treasuries determines, in part, what is an acceptable risk for the return. Therefore, market conditions such as lower interest rates result in shorter duration and higher interest rates result in longer duration.
FINANCIAL SECTION
Notes to Basic Financial Statements (continued)
42 MICHIGAN PUBLIC SCHOOL EMPLOYEES’ RETIREMENT SYSTEM
Fair Value
Effective Duration in
Years
Government U. S. Treasury 413,655$ 2.2 U. S. Agencies - Backed 643,155 4.9 U. S. Agencies - Sponsored 550,571 6.8
Corporate 4,026,369 4.1
International* Corporate 677,465 0.3
Total 6,311,215$
Debt securities are exclusive of securities lending collateral.
The interest rates reset on a quarterly basis for these securities.*International contains Corporate Debt Securities as a part of their derivative strategies.
Debt Securities(in thousands)
As of September 30, 2013
Foreign Currency Risk - Foreign currency risk is the risk that changes in exchange rates will adversely affect the fair value of an investment or deposit. The System invests in various securities denominated in foreign currencies. Authorized global securities include equities, fixed income, mutual funds, real estate, and limited partnerships. These investments are limited to 30% of the total assets of the System with additional limits of not more than 5% of the outstanding global securities of any one issuer and no more than 5% of the System’s assets in the global securities of any one issuer. In addition to these limits, the State Treasurer cannot acquire securities with companies that have active business operations in the state sponsors of terror as identified by the United States Secretary of State. At September 30, 2013, the total amount of foreign investment subject to foreign currency risk was $7,543.0 million, which amounted to 17.5% of total investments (exclusive of securities lending collateral) of the System.
FINANCIAL SECTION
Notes to Basic Financial Statements (continued)
MICHIGAN PUBLIC SCHOOL EMPLOYEES’ RETIREMENT SYSTEM 43
Alt. Invest.,Real Estate, & International
Infrastructure Fixed Income Pools Pools Equity Pools Pools Derivitives
Market Value Market Value Market Value Market Value Region Country Currency in U.S. $ in U.S. $ in U.S. $ in U.S. $ *
AMERICACanada Dollar 1,502$ 99Mexico Peso 3,311$
EUROPEEuropean Union Euro 934,692$ 59,127 3,492 569 Switzerland Franc 26,064 1,540 Sweden Krona 9,638 1,154 Denmark Krone 2,250 Norway Krone 775 255 U.K. Sterling 8,983 68,964 5,718
PACIFICAustralia Dollar 2,981 China Renminbi 438 Hong Kong Dollar 5,328 554 Japan Yen 34,665 59,706 New Zealand Dollar 75 Philippines Peso 652 Singapore Dollar 9,259 449 South Korea Won 41,216 979
MIDDLE EASTIsrael Shekel 99,084
VARIOUS 920,515 5,241,521 (2,593)
Total 1,864,190$ 5,599,831$ 7,455$ 71,486$
* International derivatives' market value exposure to foreign currency risk is the net amount of unrealized gains and unrealized losses. Maturity dates on these investments range from October 2013 through June 2014 with an average maturity of .4 years.
Foreign Currency Risk(in thousands)
As of September 30, 2013
NOTE 5 - ACCOUNTING CHANGES GASB issued Statement No. 63, Financial Reporting of Deferred Outflows of Resources, Deferred Inflows of Resources, and Net Position. The Statement provides financial reporting guidance for deferred outflows of resources and deferred inflows of resources and net position in a statement of financial position and also requires related disclosures. This Statement was implemented in fiscal year 2013. Beginning in fiscal year 2013, the System changed its OPEB funding policy to prefund benefits, formally funded on a pay-as-you-go basis. As a result of theis change in funding policy, the System’s actuary used an investment rate of return of 8%, rather than 4% that was previously used, to reflect the System’s projected long-term rate of return. Adopting the 8% investment rate of return had the following impact on the System’s OPEB actuarial valuations for fiscal year 2012:
A reduction of the fiscal year 2013 annual required contribution for OPEB by $641.5 million, or 30.4%. A reduction of the September 30, 2012 OPEB actuarial accrued liability by $8.3 billion, or 36.1%. A reduction of the September 30, 2012 OPEB unfunded actuarial accrued liability by $8.3 billion, or 38.3%.
FINANCIAL SECTION
Notes to Basic Financial Statements (continued)
44 MICHIGAN PUBLIC SCHOOL EMPLOYEES’ RETIREMENT SYSTEM
NOTE 6 – NEW ACCOUNTING PRONOUNCEMENTS GASB issued Statement No. 65, Items Previously Reported as Assets and Liabilities. This Statement establishes accounting and financial reporting standards that reclassify, as deferred outflows of resources or deferred inflows of resources, certain items that were previously reported as assets and liabilities and recongnizes, as outflows of resources or inflows of resources, certain items that were previously reported as assets and liabilities. The provisions of this Statement are effective for financial statements for periods beginning after December 15, 2012. This Statement will be implemented in fiscal year 2014. GASB issued Statement No. 67, Financial Reporting for Pension Plans – An Amendment of GASB Statement No. 25. The Statement's objective is to improve financial reporting by state and local governmental pension plans. This Statement results from a comprehensive review of the effectiveness of existing standards of accounting and financial reporting for pensions with regard to providing decision-useful information, supporting assessments of accountability and interperiod equity, and creating additional transparency. This Statement replaces the requirements of Statements No. 25 Financial Reporting for Defined Benefit Pension Plans and Note Disclosures for Defined Contribution Plans, and No. 50 Pension Disclosures, as they relate to pension plans administered through trusts or equivalent arrangements. The requirements of Statements No. 25 and No. 50 remain applicable to pension plans that are not administered through trusts or equivalent arrangements. The provisions of this Statement are effective for financial statements for fiscal years beginning after June 15, 2013. This Statement will be implemented in fiscal year 2014. NOTE 7 - COMMITMENTS AND CONTINGENCIES Under the Administrative Procedures Act, members may appeal a decision made by the Board. Once the administrative procedure has been exhausted, the decision may be appealed in Michigan’s court system. Various cases that have exhausted the administrative procedures have been appealed in the court system. These cases are in the normal course of business and the System does not anticipate any material loss as a result of the contingent liabilities. Pending Litigation Michigan Supreme Court No. 145924 Two cases have been consolidated and are pending in the Michigan Supreme Court (MSC). Plaintiffs are contesting the 3% contribution required by MCL 38.1343e to be made by members of the Michigan Public School Employees’ Retirement System. Plaintiffs allege a violation of Defendants’ contractual obligations gleaned from Const 1963, art 9, sec 24 and impairment of their contracts as prohibited under both the Michigan and U.S. Constitutions, art 2, sec 10. The trial court ruled in Plaintiffs’ favor and entered a preliminary injunction requiring that the Plaintiffs’ contributions not be used and be placed in an interest bearing account. The trial court ruling was affirmed by the Michigan Court of Appeals (COA) and an application for leave to the MSC remains pending. Contributions totaled approximately $549.8 million at September 30, 2013. While these cases were pending, the legislature passed 2012 PA 300 that again amended MCL 38.1343e. The 3% deductions discontinued being collected under 2010 PA 75, but are currently being collected under PA 300. Michigan Court of Appeals Nos. 313960 and 314065 On September 4, 2012, the Governor signed into law 2012 PA 300 giving public school employees' options on future retirement pension calculations and the 3% health care deductions, along with other changes to the Public School Employees Retirement Act. Immediately, the American Federation of Teachers (AFT) and Michigan Education Association (MEA) filed separate lawsuits before Judge Aquilina in the Court of Claims and sought Temporary Restraining Orders (TRO). The Court granted AFT a TRO that enjoined the State from enforcing the 52-day election period and granted MEA a TRO providing that all elections made under PA 300 may be rescinded or changed if any provisions of the Act are found unconstitutional by the trial court or any appellate court.
FINANCIAL SECTION
Notes to Basic Financial Statements (continued)
MICHIGAN PUBLIC SCHOOL EMPLOYEES’ RETIREMENT SYSTEM 45
An application for leave to appeal to the Court of Appeals (COA) was filed seeking immediate consideration and a stay of the TROs. Although the COA granted our application for leave to appeal, it denied Defendants request to stay the TROs. On January 15, 2012 the Court dismissed the appeal on grounds that it was moot in light of Judge Aquilina's subsequent ruling that PA 300 was constitutional except for the 52-day election period. On November 29, 2012, the trial Court ruled that, except for the 52- day window period, PA 300 was constitutional. Plaintiffs filed an appeal on December 28, 2012. Although the appellants filed separate appeals, the cases have been consolidated on appeal under docket number 314065. Argument was heard by the COA on August 6, 2013 and an opinion is anticipated any day. The 3% deductions continue.
FINANCIAL SECTION
46 MICHIGAN PUBLIC SCHOOL EMPLOYEES’ RETIREMENT SYSTEM
Required Supplementary Information
Schedules of Funding Progress
Expressing the net position restricted for benefits as a percentage of the actuarial accrued liability provides one indication of the System’s funding status. Analysis of this percentage over time indicates whether the System is becoming financially stronger or weaker. Generally, the greater this percentage, the stronger the System. Trends in unfunded actuarial accrued liability and annual covered payroll are both affected by inflation. Expressing the underfunded or overfunded actuarial accrued liability as a percentage of annual covered payroll approximately adjusts for the effects of inflation and aids analysis of progress made in accumulating sufficient assets to pay benefits when due. Generally, the smaller this percentage, the stronger the System.
1 The ARC has been recalculated for all years presented in order to reflect only the employer's share of the annual required
contributions and current assumptions.
2 Differences between the ARC and the actual contributions are the result of a timing difference between when the actuarial valuation is completed and the contributions are made. In addition, for fiscal years 2004, 2005, and 2006, transfers from the stabilization sub-account in the amount of $143.0 million, $187.4 million, and $54.2 million, respectively, were made to intentionally stabilize the contribution rates. The sub-account has no balance or activity since 2006.
3 Pursuant to Public Act 15 of 2007, the System's assets were revalued to their actual market value as of September 30, 2006. The five-year smoothing began again in fiscal year 2008.
1 Revised investment rate of return from 4% to 8% due to prefunding. 2 Differences between the ARC and the actual contributions are the result of a timing difference between when the actuarial valuation is completed and the contributions are made.
Other Postemployment Benefits
Pension Benefits
FINANCIAL SECTION
48 MICHIGAN PUBLIC SCHOOL EMPLOYEES’ RETIREMENT SYSTEM
Note to Required Supplementary Information
NOTE A - DESCRIPTION Ten year historical trend information designed to provide information about the System’s progress made in accumulating sufficient assets to pay benefits when due is presented in the preceding schedules. Other ten year historical trend information related to the System is presented in the Statistical and Actuarial Sections of the report. This information is presented to enable the reader to assess the progress made by the System in accumulating sufficient assets to pay pension and other postemployment benefits as they become due. Because this is the seventh year the System is reporting other postemployment benefits in accordance with GASB Statement No. 43, only seven years of historical trend information is provided. The comparability of trend information is affected by changes in actuarial assumptions, benefit provisions, actuarial funding methods, accounting policies, and other changes. Those changes usually affect trends in contribution requirements and in ratios that use the pension and other postemployment benefit obligations as a factor. The Schedules of Funding Progress and Schedules of Employer and Other Contributions are reported as historical trend information. The Schedules of Funding Progress are presented to measure the progress being made to accumulate sufficient assets to pay benefits when due. The Schedules of Employer and Other Contributions are presented to show the responsibility of the Employer in meeting the actuarial requirements to maintain the System on a sound financial basis.
FINANCIAL SECTION
MICHIGAN PUBLIC SCHOOL EMPLOYEES’ RETIREMENT SYSTEM 49
This page was intentionally left blank.
FINANCIAL SECTION
50 MICHIGAN PUBLIC SCHOOL EMPLOYEES’ RETIREMENT SYSTEM
Supporting Schedules
Personnel Services: Staff Salaries 3,541,795$ Retirement and Social Security 3,641,932 Other Fringe Benefits 1,306,237 Total 8,489,964
Professional Services: Accounting 1,384,123 Actuarial 254,728 Attorney General 445,225 Audit 65,540 Consulting 56,664 Medical 415,141 Total 2,621,421
Building and Equipment: Building Rentals 983,997 Equipment Purchase, Maintenance, and Rentals 63,066 Total 1,047,062
Miscellaneous: Travel and Board Meetings 34,762 Office Supplies 50,417 Postage, Telephone, and Other 3,587,702 Printing 323,438 Technological Support 8,847,387 Total 12,843,705
Total Administrative and Other Expenses 25,002,153$
Staff Salaries 2,017,801$ Health Fees 140,402,853 Dental Fees 5,552,188
Total Administrative and Other Expenses 147,972,842$
OPEB Plan Administrative and Other ExpensesFor Fiscal Year Ended September 30, 2013
Summary Schedule of Pension Plan Administrative and Other Expenses
For Fiscal Year Ended September 30, 2013
Summary Schedule of
FINANCIAL SECTION
MICHIGAN PUBLIC SCHOOL EMPLOYEES’ RETIREMENT SYSTEM 51
Supporting Schedules (continued)
Real Estate Operating Expenses 1,036,113$ Securities Lending Expenses 10,696,463
Other Investment Expenses1
ORS-Investment Expenses2
12,796,707 Custody Fees 802,071 Management Fees 102,854,846 Research Fees 2,225,922
Total Investment Expenses 130,412,122$
1 Refer to the Investment Section for fees paid to investment professionals2 Does not exclude Treasury Civil Service fees recorded as a pass through in
the Schedule of Investment Fees - State Treasurer. As of September 30, 2013,
fees totaled $136,562.
Accounting 1,384,123$ Actuary 254,728 Attorney General 445,225 Independent Auditors 65,540 Consulting 56,664 Medical Advisor 415,141
Total Payments 2,621,421$
Schedule of Investment Expenses
Schedule of Payments for Professional Services
For Fiscal Year Ended September 30, 2013
For Fiscal Year Ended September 30, 2013
FINANCIAL SECTION
52 MICHIGAN PUBLIC SCHOOL EMPLOYEES’ RETIREMENT SYSTEM
Supporting Schedules (continued)Detail of Changes in Plan Net Position (Pension and Other Postemployment Benefits)For the Fiscal Year Ended September 30, 2013
Contributions Pension Plus Plan ContributionsAdditions:Contributions: Member contributions 38,383,019$ 17,584,103$ 329,040,465$ Employer contributions: Colleges, universities and federal 117,664,943$ School districts and other 1,228,218,295 Other governmental contributions Total contributions 38,383,019 17,584,103 329,040,465 1,345,883,238
Investment income (loss): Net appreciation (depreciation) in fair value of investments Interest, dividends, and otherInvestment expenses: Real estate operating expenses Other investment expensesSecurities lending activities: Securities lending income Securities lending expenses
Net investment income (loss) - - - -
Transfers from other systems 8,796 Miscellaneous income 5,467 Total additions 38,391,815 17,584,103 329,045,932 1,345,883,238
Deductions: Benefits and refunds paid to plan members and beneficiaries: Retirement benefits Health benefits Dental/vision benefits Refund of contributions 3,398,688 565,490 26,376,054 96,131 Transfers to other systems 319 696 Administrative and other expenses Total deductions 3,399,007 565,490 26,376,750 96,131 Net Increase (Decrease) before other changes 34,992,808 17,018,613 302,669,182 1,345,787,107 Other Changes in Net Position: Interest allocation 61,436,830 (73,598) (28,916,067) Transfers upon retirement (81,342,760) (244,242,657) Transfers of employer shares (2,256,422,007) Total other changes in net position (19,905,930) (73,598) (273,158,724) (2,256,422,007) Net Increase (Decrease) 15,086,878 16,945,015 29,510,458 (910,634,900) Net Position Restricted for Pension Benefits and OPEB:Beginning of Year 1,508,604,382 17,258,719 4,393,873,147 (26,815,059,755) End of Year 1,523,691,260$ 34,203,734$ 4,423,383,605$ (27,725,694,655)$
FINANCIAL SECTION
MICHIGAN PUBLIC SCHOOL EMPLOYEES’ RETIREMENT SYSTEM 53
Supporting Schedules (continued)
Employer Retired Retired UndistributedContributions Benefit Benefit Payments InvestmentPension Plus Payments Pension Plus Income OPEB Total
54 MICHIGAN PUBLIC SCHOOL EMPLOYEES’ RETIREMENT SYSTEM
This page was intentionally left blank.
MICHIGAN PUBLIC SCHOOL EMPLOYEES’ RETIREMENT SYSTEM 55
INVESTMENT SECTION Prepared by Michigan Department of Treasury, Bureau of Investments
Jon M. Braeutigam, Director
Report on Investment Activity Asset Allocation
Investment Results List of Largest Stock Holdings List of Largest Bond Holdings
Schedule of Investment Fees Schedule of Investment Commissions
Investment Summary
INVESTMENT SECTION
Report on Investment Activity
56 MICHIGAN PUBLIC SCHOOL EMPLOYEES’ RETIREMENT SYSTEM
INTRODUCTION The State Treasurer reports investment activity quarterly to the Investment Advisory Committee (Committee), which reviews the investments, goals, and objectives of the retirement funds and may submit recommendations regarding them to the State Treasurer. The Investment Advisory Committee may also, by a majority vote, direct the State Treasurer to dispose of any holdings that, in the Committee’s judgment, are not suitable for the funds involved, and may, by unanimous vote, direct the State Treasurer to make specific investments. The Investment Advisory Committee was created by Act 380 of the Public Acts of 1965. The three public members of the five-member committee are appointed by the Governor with the advice and consent of the Senate for three-year terms. The Director of the Department of Licensing and Regulatory Affairs and the Director of the Department of Technology, Management and Budget are ex-officio members. As of September 30, 2013, members of the Committee were as follows: Naif A. Khouri (public member), James B. Nicholson (public member), L. Erik Lundberg, CFA (public member), Steve Arwood (ex-officio member), and John E. Nixon, CPA (ex-officio member). The public members serve without pay, but may be paid actual and necessary travel and other expenses. INVESTMENT POLICY & GOALS Investment policy states that the fiduciary will operate within standard investment practices of the prudent person and in accordance with Public Employee Retirement System Investment Act 314 of 1965. The fiduciary is authorized to invest in government obligations, corporate obligations, various short-term obligations, corporate (domestic and international) stocks, private equity interests, mutual funds, real estate interests, and other investments subject to specific parameters. Above all, trust fund assets are to be invested for the exclusive benefit of the members of the System, in a fiduciary capacity. The System’s Proxy Voting Policy sets forth directives on various issues including: Boards of Directors, corporate governance, social issues, corporate restructurings and defenses. All proxies are reviewed and voted in accordance with the System’s policy. The primary function of the System is to provide retirement, survivor and disability benefits along with health and other postemployment benefits to its members. The State Treasurer is the sole investment fiduciary and custodian of the System’s investments pursuant to State law. The goals of the System are:
1. Maintain sufficient liquidity to pay benefits. 2. Meet or exceed the actuarial assumption over the long term. 3. Perform in the top half of the public plan universe over the long term. 4. Diversify assets to preserve capital and avoid large losses. 5. Exceed individual asset class benchmarks over the long term. The strategy for achieving these goals is carried out by investing the assets of the System according to a five-year asset allocation model. The System currently invests in seven different asset classes, which provides for a well-diversified portfolio.
INVESTMENT SECTION
Report on Investment Activity (continued)
MICHIGAN PUBLIC SCHOOL EMPLOYEES’ RETIREMENT SYSTEM 57
Asset Allocation(Excludes Collateral on Loaned Securities)
As of 9/30/13Actual %
INVESTMENT AUTHORITY Pursuant to State Law (Section 91 of Act No. 380 of the Public Acts of 1965, as amended, and Section 12c of Act No. 314 of 1965, as amended), the State Treasurer, State of Michigan, is the investment fiduciary for the following four State sponsored retirement systems: Michigan Public School Employees’ Retirement System, Michigan State Employees’ Retirement System, Michigan State Police Retirement System, and Michigan Judges’ Retirement System. Act No. 314 of the Public Acts of 1965, as amended, authorizes the investment of assets of public employee retirement systems or plans created and established by the State or any political subdivision. INVESTMENT RESULTS Total Portfolio Results For the fiscal year ended September 30, 2013, the total System’s rate of return was 12.5% for the Pension Plan and 12.3% for the OPEB Plan as compiled by State Street Investment Analytics. Annualized rates of return for the three, five, and ten year periods ending September 30, 2013 were: 10.8%, 6.8%, and 7.4% respectively, for the Pension Plan. There were several positive economic developments during the fiscal year 2013. To highlight a few; the U.S. stock market S&P 500 returned 19.3% over the year, the U.S. economy added 2.1 million jobs, and home prices were higher than the prior year. At times, though, it was not at all certain that the economy was doing well. In October 2012, hurricane Sandy hit the eastern seaboard causing an estimated damage of $68 billion, the second costliest hurricane on record. In late December 2012 and early January 2013, the U.S. Legislature finally addressed the “Fiscal Cliff”. The buildup to the December 31 deadline is believed to have slowed the economy somewhat due to the uncertainty of the resolution. Anticipating some economic fall-out of these events, the FOMC in December 2012 announced an increase in the amount of open-ended purchases (also known as Quantitative Easing or “QE”) from $40 billion to $85 billion per month.
INVESTMENT SECTION
Report on Investment Activity (continued)
58 MICHIGAN PUBLIC SCHOOL EMPLOYEES’ RETIREMENT SYSTEM
By springtime 2013, it became evident that the policies adopted by the Federal Reserve Board were having a desirable effect on the economy as well as the financial markets. There was a feeling that given some growth in GDP, the jobs recovery, the housing recovery, strong corporate profits, etc., that conditions were getting back to normal, thus requiring normal Fed policy. In his testimony to Congress in May 2013, Federal Reserve Chairman Ben Bernanke explained that if the economy continued to show improvements, and if the board became confident in the sustainability of the improvements, the rate of $85 billion per month bond purchases would be reduced or tapered. One consequence of this statement was an increase in long-term interest rates. Between the end of April 2013 and the end of September 2013, the 10-year Treasury rate increased by roughly 0.9% to end the fiscal year at a rate of 2.6%. Many market prognosticators came to believe that the Fed would begin to taper in September 2013. However, in September the Fed surprised the markets by announcing that the current accommodations would continue because of risks that still exist in the economy. One such risk on the minds of the Federal Reserve Board could have been the possibility of the U.S. Government shutting down. By September 30, 2013, lawmakers were at an impasse on many issues, but the fight was particularly acute along the issues of raising the debt ceiling and the funding of the Patient Protection and Affordable Care Act, also known as Obamacare. As the fiscal year draws to an end, the grumblings of the effectiveness and the consequences of the QE policies are becoming more audible. In 1998 Long Term Capital Management (LTCM) required a $3.6 billion bailout. At the time, it was believed that this action was necessary in order to save the financial system. This year, the Fed’s QE program is the size of over 70 LTCM bailouts per quarter. Regardless, the prognosticators are now predicting tapering will begin sometime in 2014. By then, at the current rates, the jobs lost during the financial crisis will likely be fully recovered and the unemployment rate close to the Fed’s target of 6.5%. By that time, the new Fed Chair, Janet Yellen, will be in control as Fed Chairman Ben Bernanke will end his term in January 2014. Domestic Equity Pools The objective for investments made in domestic equities is to meet or exceed the total return of the S&P 1500 Super Composite for one, three, and five-year periods and a market cycle. For active management strategies, the objective is to earn returns that exceed the most relevant S&P Index (or the most relevant Russell Index), adjusting for market capitalization and style, for one, three, and five-year periods and a market cycle. Rank above median in a universe of managers possessing a similar market cap and style characteristics. For index, or passive return strategies, the objective is to return within 20 basis points of the S&P 500 Index, 50 basis points for the S&P 400 mid-cap, and 60 basis points for the S&P 600 small-cap over one, three, and five-year periods and a market cycle. The pools are invested primarily in equities or equity-related securities of U.S. companies through internal and externally managed strategies. The goal is to build a portfolio of strategies that will provide excess returns relative to the S&P 1500 while providing minimal tracking error to the index. At times a portion of these pools may be invested in exchange traded funds (ETFs) and fixed-income short-term securities with maturities of less than one year. The pools invest in equities and equity related securities that are listed on U.S. national securities exchanges, including American Depository Receipts (ADRs). They may also invest in stocks that are traded over-the-counter. The pools diversify their investments by allocating their equity strategies with consideration of the capitalization weightings of the S&P 1500 Index.
INVESTMENT SECTION
Report on Investment Activity (continued)
MICHIGAN PUBLIC SCHOOL EMPLOYEES’ RETIREMENT SYSTEM 59
The following summarizes the weightings of the pools as of September 30, 2013:
Active 52.1 %Passive 47.9Total 100.0 %
Large Cap 76.4 %Mid Cap 10.9Multi Cap 9.8Small Cap 2.9
Total 100.0 %
The System’s Domestic Equity pools total rate of return was 21.7 % for fiscal year 2013. This compared with 20.4% for the S&P 1500 Index. At the close of fiscal year 2013, the Domestic Equity pools represented 27.0% of total investments. The following summarizes the System's 77.5% ownership share of the Domestic Equity pools at September 30, 2013:
Short Term Pooled Investments 133,659$ Equities 11,563,275 Market Value of Equity Contracts (21,857) Other Investments (76) Long Term Obligations 840 Settlement Principal Payable (55,657) Settlement Proceeds Receivable 44,651 Accrued Dividends 10,154 Total 11,674,989$
Domestic Equity Pools(in thousands)
International Equity Pools The objective for investments made in International Equity pools is to meet or exceed the total return of the MSCI ACWI Ex-US Gross for one, three, and five-year periods and a market cycle. For active management strategies, the objective is to earn returns that exceed the most relevant S&P Index (or the most relevant Russell Index), adjusting for market capitalization, style and geography for one, three, and five-year periods and a market cycle. Rank above median in a universe of managers possessing a similar market capitalization, style and geography characteristics. For index, or passive return strategies, the objective is to return within 250 basis points of the S&P/Citigroup BMI-EPAC Index with 25% of the currency hedged for one, three, and five-year periods and a market cycle. Return within 400 basis points of the MSCI Emerging Markets Index, for one, three, and five-year periods and a market cycle. Active exposure is invested primarily in equities or equity-related securities of non-U.S. companies through externally managed strategies.
INVESTMENT SECTION
Report on Investment Activity (continued)
60 MICHIGAN PUBLIC SCHOOL EMPLOYEES’ RETIREMENT SYSTEM
Passive exposure to International Equity returns is achieved primarily by investing in a combination of fixed income LIBOR notes, short-term fixed income investments, and equity swap agreements on foreign stock indices in developed markets. Interest on the dedicated notes and short-term fixed income investments is exchanged for international stock returns, and the total notional amount of the swap agreements is invested in the approximate proportions of the S&P Broad Market Index (BMI) Europe and Pacific Composite (EPAC) country weightings in related indices. Use of swap agreements for a core position began in 1993, an American Depository Receipts (ADR) and index-related security portfolio was added in June of 1999 to increase portfolio management flexibility, and a multiple country fund portfolio with smaller capitalization stocks was added in September of 2002 to improve exposure to the smallest companies in the BMI index. Use of futures as an investment to hedge cash flows and balances began in December of 2008, and this use is expected to continue in the future. The combined Swap agreements, notes and short-term investments together continue to perform like a stock index fund that realizes all gains and losses on a rolling three year basis. The pools diversify their investments by allocating their equity strategies with consideration of the economic development status weightings of the S&P/Citigroup BMI -World ex-US Index.
The following summarizes the weightings of the pools as of September 30, 2013:
Active 56.2 %Passive 43.8Total 100.0 %
Developed 76.5 %Emerging 23.5Total 100.0 %
The System’s International Equity pools total rate of return was 16.3% for fiscal year 2013. This compared with 17.0% for the MSCI ACWI Ex US Gross. At the close of fiscal year 2013, the International Equity pools represented 14.8% of total investments. The following summarizes the System's 77.9% ownership share of the International Equity Pools at September 30, 2013:
Short Term Pooled Investments 39,103$ Equities 5,550,447 Fixed Income Securities 677,465 Market Value of Equity Contracts 113,461 Settlement Principal Payable (13,763) Accrued Dividends and Interest 1,460 Total 6,368,173$
International Equity Pools(in thousands)
Alternative Investment Pools The Alternative Investment pools objective is to meet or exceed the benchmark for all private equity investments over long time periods. The benchmark is a blend of the S&P 500 Index plus 300 basis points and the 10 Year Yield plus 300 basis points using ending weights of equity and fixed income holdings within the portfolio.
INVESTMENT SECTION
Report on Investment Activity (continued)
MICHIGAN PUBLIC SCHOOL EMPLOYEES’ RETIREMENT SYSTEM 61
Alternative Investments are investments in the private equity market, primarily through limited partnerships. The following summarizes the weightings of the pools as of September 30, 2013:
Buyout Funds 57.4 %Special Situation Funds 20.5Venture Capital Funds 10.0Fund of Funds 4.8Liquidation Portfolio 3.8Other 1.4Mezzanine Funds 2.1Total 100.0 %
The Alternative Investment pools had a return of 14.9% for the fiscal year ended September 30, 2013, versus the benchmark of 23.5%. At the close of fiscal year 2013, the Alternative Investment pools represented 19.4% of total investments. The following summarizes the System's 79.3% ownership share of the Alternative Investment pools at September 30, 2013:
Short Term Pooled Investments 87,759$ Equities 8,289,279 Settlement Proceeds Receivable 2,252 Total 8,379,290$
Alternative Investment Pools(in thousands)
Real Estate and Infrastructure Pools The objective of the Real Estate and Infrastructure pools is to provide diversification and favorable risk adjusted returns primarily through income and appreciation of investments. Investments are typically held through investment entities, such as limited partnerships or limited liability companies, established for the specific purpose of owning, leasing, managing, financing, or developing real estate and infrastructure related investments. The Real Estate and Infrastructure pools diversify its holdings by:
Geography - The pools are invested globally and are diversified geographically so that it is not concentrated in a limited number of markets or geographic areas.
Size and Value - The pools diversify its holdings by size so that it is not concentrated in a limited number of large investments.
Investment Type – The pools are diversified by investment type as summarized below.
INVESTMENT SECTION
Report on Investment Activity (continued)
62 MICHIGAN PUBLIC SCHOOL EMPLOYEES’ RETIREMENT SYSTEM
Multi-family apartments 23.4 %Commercial office buildings 13.6Hotel 19.2Retail shopping centers 16.9Industrial warehouse buildings 7.2For Sale Homes 4.2For Rent Homes 5.1Infrastructure 5.4Land 2.4Senior Living 1.0Short Term Investments 1.6Total 100.0 %
The Real Estate pool generated a return of 8.2% for fiscal year 2013. The two benchmark returns from the National Council of Real Estate Investment Fiduciaries: the National Property Blended Index (less 130 basis points) was 9.6% and the Open-End Diversified Core Equity Index was 12.0%. The Infrastructure Pool had a return of 13.9% for fiscal year 2013. The benchmark, CPI + 4% lagged 3m, was 5.8% At the close of fiscal year 2013, the Real Estate and Infrastructure pools represented 10.8% of total investments. The following summarizes the System’s 78.0% ownership share of the Real Estate and Infrastructure pools at September 30, 2013:
Short Term Pooled Investments 75,344$ Real Estate Equities 4,350,087 Infrastructure Equities 258,816 Total 4,684,247$
Real Estate and Infrastructure Pools(in thousands)
Fixed Income Pools The objective for investments made in the Fixed Income pools is to meet or exceed the Barclays Aggregate Bond Index over one, three, and five-year periods and market cycles. Rank above median in a nationally recognized universe of managers possessing a similar style. For Fixed Income sub-strategies, the objective return is to meet or exceed the most relevant Barclays benchmark index. The pools are invested primarily in fixed income securities of U.S. companies through internal and externally managed strategies. The goal is to build a portfolio of strategies that will provide excess returns relative to the blended benchmark while providing minimal tracking error to the index. At times a portion of the pools may be invested in exchange traded funds (ETFs) and fixed-income short-term securities with maturities of less than one year. The pools invest in fixed income and related securities in a diversified portfolio of investment grade corporate issues, treasuries, agencies, government sponsored enterprises and government guaranteed mortgages. The pools diversify its investments by allocating its strategies with consideration of credit risk.
The System’s Fixed Income pools total rate of return was (0.2)% for fiscal year 2013. This compared with (1.7)% for the Barclays Aggregate Bond benchmark.
INVESTMENT SECTION
Report on Investment Activity (continued)
MICHIGAN PUBLIC SCHOOL EMPLOYEES’ RETIREMENT SYSTEM 63
At the close of fiscal year 2013, the Fixed Income pools represented 12.1% of total investments. The following summarizes the System's 77.3% ownership share of the Fixed Income pools at September 30, 2013:
Short Term Pooled Investments 125,958$ Fixed Income Securities 5,074,943 Settlement Principal Payable (5,460) Accrued interest 34,824 Total 5,230,265$
Fixed Income Pools(in thousands)
Absolute Return Pools The Absolute Return Pools consist of the Absolute Return Strategies Pool and the Real Return and Opportunistic Investment Pool. The primary investment objective of the Absolute Return Strategies Pool is to generate a rate of return that meets or exceeds T-bills by 400 basis points net of fees over the one, three, and five-year periods and a market cycle. Also, exceed the appropriate HFN Fund of Funds median net of fees over one, three, and five-year periods and a market cycle. The Absolute Return Strategies pool rate of return for the fiscal year was 10.2% versus the benchmark’s 6.2%. The primary investment objective of the Real Return and Opportunistic Pool is to generate a rate of return that meets or exceeds the increase in the CPI by at least five percent (5%) annually net of fees over one, three, and five-year periods and a market cycle. If a peer universe is available, rank above median in a nationally recognized universe of managers possessing a similar style. For sub-strategies targeting a commodities index, the objective is to generate a rate of return that meets or exceeds the Dow Jones-AIG Total Return Commodities Index over one, three, and five year periods and a market cycle. Rank above median in a nationally recognized universe of managers possessing a similar style. The Real Return and Opportunistic Investments pool rate of return for the fiscal year was 6.6% versus the benchmark’s 7.1%. At the close of fiscal year 2013, the Absolute Return Pools represented 10.5% of total investments. The following summarizes the System's 78.0% ownership share of the Absolute Return Pools at September 30, 2013:
Short Term Pooled investments 277,087$ Equities 4,088,574 Long Term Obligations 168,806 Accrued Interest and Dividends 3,974 Total 4,538,441$
Absolute Return Pools(in thousands)
INVESTMENT SECTION
Report on Investment Activity (continued)
64 MICHIGAN PUBLIC SCHOOL EMPLOYEES’ RETIREMENT SYSTEM
Short Term Investment Pools The objective of the Short Term Investment pools is to closely match the return performance of its benchmark, the 30 day Treasury bill. The Short Term Investment pools return for the fiscal year was 0.5% for the Pension Plan and 0.4% for the OPEB Plan versus the benchmark’s 0.0%. Potential areas of investment are:
Obligations of the United States or its agencies. Banker’s acceptances, commercial accounts, certificates of deposit or depository receipts. Repurchase agreements for the purchase of securities issued by the US government or its agencies. Commercial paper rated at the time of purchase within the two highest classifications established by not less
than two national rating services as determined by the State Treasurer. Short duration investment grade corporate issues.
At the close of fiscal year 2013, the Short Term Investment pools represented 5.4% of total investments. The following summarizes the System's 61.9% ownership share of the Short Term Investment pools at September 30, 2013:
Short Term Pooled Investments 1,490,771$ Healthcare Contribution* 551,840 Equity in Common Cash 302,756 Accrued interest 3 Total 2,345,370$
Short Term Investment Pools(in thousands)
*PA 75 of 2010 required each actively employed member of MPSERS to contribute toward health care benefits. Amounts contributed to this account until September 3, 2012 are held and invested separately.
INVESTMENT SECTION
Report on Investment Activity (Continued)
MICHIGAN PUBLIC SCHOOL EMPLOYEES’ RETIREMENT SYSTEM 65
Asset Allocation – Security Type Only
Domestic Equity Pools 27.0%
International Equity Pools14.8%
Alternative Investment Pools 19.4%
Real Estate and Infrastructure Pools
10.8%
Fixed Income Pools 12.1%
Absolute Return Pools10.5%
Short Term Investment Pools 5.4%
INVESTMENT SECTION
Report on Investment Activity (continued)
66 MICHIGAN PUBLIC SCHOOL EMPLOYEES’ RETIREMENT SYSTEM
Pension Plan Investment Results for the Period Ending September 30, 2013
Annualized Rate of Return1
Investment Category Current Year 3 Years 5 Years 10 Years
International Equity Pools 16.3 7.1 6.9 7.5 International Blended Benchmark 2 17.0 6.4 5.4 7.2
Alternative Investment Pools 14.9 15.8 7.8 14.2 Alternative Blended Benchmark 3 23.5 21.3 14.3 11.4
Real Estate and Infrastructure Pools Real Estate Pool 8.2 11.1 (2.5) 5.2 NCREIF Property Blended Index 4 9.6 11.2 2.0 7.4 Infrastructure Pool 13.9 CPI + 4% lagged 3m 5.8
Fixed Income Pools (0.2) 3.5 6.8 5.3 Barclays Aggregate Bond (1.7) 2.9 5.4 4.6
Absolute Return Pools Total Absolute Return 10.2 5.6 0.8 HFRI Fund of Funds Cons 1 month lag 6.2 2.8 0.1 Total Real Return and Opportunistic 6.6 6.6 Real Return and Opportunistic Benchmark 5 7.1 7.7
Short Term Investment Pools 0.5 0.3 0.8 1.6 30 Day Treasury Bill 0.0 0.1 0.1 1.5
1 Calculations used a time-weighted rate of return based on the market rate of return in accordance with industry standards.
Excludes income and investment gains and losses from securities lending.
2 As of 10/1/10, index is MSCI ACWI Ex-US Gross. History 1/1/10 to 9/30/10 is S&P Developed BMI-EPAC
Net 75/25. History prior to 1/1/10 is S&P Developed BMI-EPAC Net 50/50.
3 As of 1/1/07, index is blend of S&P 500 plus 300 bps and 10 year yield plus 300 bps based on ending weights.
History prior to 1/1/07 is S&P500 plus 300 bps.
4 As of 10/1/05, index is NCREIF less 130 bp. History prior to 10/1/05 reflects NCREIF less 75 bp.
5 Benchmark is 50% (CPI + 5%) and 50% (actuarial rate 8%).
INVESTMENT SECTION
Report on Investment Activity (Continued)
MICHIGAN PUBLIC SCHOOL EMPLOYEES’ RETIREMENT SYSTEM 67
OPEB Investment Results for the Period Ending September 30, 2013
Investment Category Current Year
Total Portfolio 12.3 %
Domestic Equity Pools 21.7 S&P 1500 Index 20.4
International Equity Pools 16.3 International Blended Benchmark 2 17.0
Alternative Investment Pools 14.9 Alternative Blended Benchmark 3 23.5
Real Estate and Infrastructure Pools Real Estate Pool 8.2 NCREIF Property Blended Index 4 9.6
Fixed Income Pools (0.2) Barclays Aggregate Bond (1.7)
Absolute Return Pools Total Absolute Return 10.2 HFRI Fund of Funds Cons 1 month lag 6.2 Total Real Return and Opportunistic 6.6 Real Return and Opportunistic Benchmark 5 7.1
Short Term Investment Pools 0.4 30 Day Treasury Bill 0.0
1 Calculations used a time-weighted rate of return based on the market rate of return in accordance with industry standards.
Excludes income and investment gains and losses from securities lending.
2 As of 10/1/10, index is MSCI ACWI Ex-US Gross. History 1/1/10 to 9/30/10 is S&P Developed BMI-EPAC
Net 75/25. History prior to 1/1/10 is S&P Developed BMI-EPAC Net 50/50.
3 As of 1/1/07, index is blend of S&P 500 plus 300 bps and 10 year yield plus 300 bps based on ending weights.
History prior to 1/1/07 is S&P500 plus 300 bps.
4 As of 10/1/05, index is NCREIF less 130 bp. History prior to 10/1/05 reflects NCREIF less 75 bp.
5 Benchmark is 50% (CPI + 5%) and 50% (actuarial rate 8%).
INVESTMENT SECTION
68 MICHIGAN PUBLIC SCHOOL EMPLOYEES’ RETIREMENT SYSTEM
Largest Assets Held1
Rank Shares Stocks Market Value1 845,599 Apple Inc 403,139,107$ 2 3,686,908 Johnson & Johnson 319,618,059 3 286,179 Google Inc 250,667,397 4 14,526,655 Bank of America Corp 200,467,837 5 7,213,897 Schwab (Charles) Corp 152,501,774 6 1,762,546 Exxon Mobil Corporation 151,649,447 7 4,341,553 Microsoft Corp 144,617,136 8 3,440,784 Wells Fargo & Co 142,173,176 9 1,754,157 Pepsico Inc 139,455,472
10 1,103,228 Chevron Corp 134,042,229
Rank Par Amount Bonds & Notes Market Value1 200,795,900$ General Electric Cap Corp .4342% FRN Due 2-15-2017 197,516,100$ 2 78,254,749 Barclays Bank PLC 1.1291% FRN Due 1-13-2014 78,414,233 3 75,767,070 Barclays Bank PLC Due 7-24-2019 68,788,922 4 59,377,598 General Electric Cap Corp .5144% FRN Due 9-15-2014 59,544,686 5 47,476,116 Dow Chemical Co 5.7% Due 5-15-2018 54,800,161 6 50,814,391 Wachovia Corp .5244% FRN Due 6-15-2017 50,152,381 7 49,300,492 Total Capital Canada LTD .6476% FRN Due 1-17-2014 49,354,723 8 39,070,491 Target Corp 5.375% Due 5-1-2017 44,486,442 9 43,040,110 Berkshire Hathaway Fin .5986% FRN Due 1-10-2014 43,077,383
10 39,070,491 Private Export Funding 4.95% Due 11-15-2015 42,659,896
1 A complete list of holdings is available from the Michigan Department of Treasury.
2 Largest Bond Holdings are exclusive of securities lending collateral.
The System's investments are commingled in various pooled accounts. Amounts, par value and number of shares represents the System's pro-rata share based on its ownership of the investment pools.
Largest Stock Holdings (By Market Value)September 30, 2013
Largest Bond Holdings (By Market Value)2
September 30, 2013
INVESTMENT SECTION
MICHIGAN PUBLIC SCHOOL EMPLOYEES’ RETIREMENT SYSTEM 69
Schedule of Investment Fees The State Treasurer is the investment fiduciary and custodian of the System’s funds pursuant to State law. Outside advisors are utilized to augment the State Treasurer’s internal staff. 62.3% of the total investment portfolio is managed by fully discretionary outside advisors. The Michigan Department of Treasury’s cost of operations applicable to the System for the fiscal year amounted to $12,821 thousand or seven and nine tenths basis points (.079%) of the market value of the Assets under Management of the State Treasurer. Act 380 of the Public Acts of 1965 created an Investment Advisory Committee (Committee) comprised of the directors of the Department of Licensing and Regulatory Affairs and the Department of Technology, Management & Budget, or their duly authorized representatives, and three public members appointed by the Governor with the advice and consent of the Senate. The public members serve without pay, but may be paid actual and necessary travel and other expenses. The Committee meets quarterly to review investments, goals and objectives and may submit recommendations to the State Treasurer. The Committee may also, by a majority vote, direct the State Treasurer to dispose of any holding which, in the Committee’s judgment, is not suitable for the fund involved, and may by unanimous vote direct the State Treasurer to make specific investments. Schedule of Investment Fees
Investment Managers' Fees:
Assets underManagement Fees Basis(in thousands) (in thousands) Points*
State Treasurer 16,276,288$ 12,821$ 7.9Outside Advisors for Fixed Income 1,403,876 2,656 18.9 Absolute Return 4,229,904 12,105 28.6 International Equity 5,232,240 9,032 17.3 Domestic Equity 3,014,929 13,754 45.6 Alternative 8,379,290 56,969 68.0
4,684,247 8,340 17.8Total 43,220,774$ 115,677$
Other Investment Services Fees: Assets in Custody 42,366,198$ 3,028$ Securities on Loan 3,362,504 7,445
Real Estate and Infrastructure
* Alternative Investment partnership agreements that define the management fees, the asset management fees range from 75 basis points on remaining assets under management to 250 basis points of the committed capital. For Real Estate/Infrastructure, the asset management fees range from 40 to 200 basis points. For Absolute Return, the asset management fees range from 20 to 200 basis points. These fees, in most cases, are netted against income.
INVESTMENT SECTION
70 MICHIGAN PUBLIC SCHOOL EMPLOYEES’ RETIREMENT SYSTEM
Schedule of Investment Commissions
Actual Estimated EstimatedActual Number of Average Trade Research Estimated Estimated
Commissions Shares Commission Costs Costs Trade ResearchPaid 1 Traded 1 Per Share Per Share Per Share Costs Costs
Investment Brokerage Firms:Baird, Robert W., & Co. Inc. 1,088$ 30,231 0.04$ 0.01$ 0.03$ 302$ 907$ Banc Of America Securities LLC 103,909 3,236,612 0.03 0.01 0.02 32,367 64,732 Barclays Capital Inc. 221,704 7,390,122 0.03 0.01 0.02 73,901 147,803 BNY Convergex Execution Solutions LLC 29,138 1,456,852 0.02 0.01 0.01 14,568 14,568 BTIG LLC 383,429 34,033,280 0.01 0.01 340,333 Cantor Fitzgerald & Co. 10,717 826,738 0.01 0.01 8,267 Capital Institutional Services Inc. 141,120 4,067,446 0.03 0.01 0.02 40,675 81,350 Citigroup Global Markets Inc. 76,817 3,800,421 0.02 0.01 0.01 38,004 38,004 Cowen & Company LLC 118,219 3,937,967 0.03 0.01 0.02 39,380 78,759 Credit Suisse Securities LLC 335,932 12,420,654 0.03 0.01 0.02 124,207 248,413 Dahlman Rose & Company LLC 19,529 976,439 0.02 0.01 0.01 9,765 9,765 Deutsche Bank - Alex Brown 2,690 67,261 0.04 0.01 0.03 672 2,017 Deutsche Bank Securities Inc. 830 57,701 0.01 0.01 577 Drexel Hamilton 61,876 2,062,543 0.03 0.01 0.02 20,625 41,251 Goldman, Sachs & Co. 202 20,262 0.01 0.01 202 The Griswold Company Inc. 7,127 475,143 0.02 0.01 0.01 4,751 4,751 Guggenhiem Partners LLC 17,143 571,423 0.03 0.01 0.02 5,714 11,428 ISI Capital LLC 187,361 6,245,345 0.03 0.01 0.02 62,454 124,907 Investment Technology Group Inc. 15 1,458 0.01 0.01 15 J. P. Morgan Securities Inc. 194,043 6,604,142 0.03 0.01 0.02 66,042 132,083 Keefe, Bruyette & Woods Inc. 2,918 72,943 0.04 0.01 0.03 729 2,188 Mischler Financial Group Inc. 57,034 1,901,162 0.03 0.01 0.02 19,011 38,023 Morgan Stanley & Co. Inc. 288,764 9,898,694 0.03 0.01 0.02 98,987 197,974 OTA LLC 52,297 1,743,221 0.03 0.01 0.02 17,433 34,864 Pershing LLC 100 9,969 0.01 0.01 100 RBC Capital Markets 3,588 358,787 0.01 0.01 3,588 Sanford C. Bernstein & Co. LLC 216,832 7,234,266 0.03 0.01 0.02 72,342 144,686 Stifel, Nicolaus & Co. Inc. 6,107 153,622 0.04 0.01 0.03 1,536 4,609 UBS Securities LLC 446 44,576 0.01 0.01 446 Western International Securities Inc. 13,290 664,510 0.02 0.01 0.01 6,645 6,645 William Blair & Co. LLC 1,621 40,523 0.04 0.01 0.03 406 1,216
Total 2,555,886$ 110,404,313 0.02$ 0.01$ 0.01$
1,104,044$ 1,430,943$
1 Commissions are included in purchase and sale prices of investments. The commissions and shares represent the System's pro-rata share based on ownership of commission and share transactions in the investment pools.
Fiscal Year Ended September 30, 2013
INVESTMENT SECTION
MICHIGAN PUBLIC SCHOOL EMPLOYEES’ RETIREMENT SYSTEM 71
Investment Summary Fiscal Year Ended September 30, 2013
Percent of TotalPercent of Total Investment & Investment &
Market Value 1 Market Value Interest Income 2 Interest Income
Fixed Income Pools 5,230,264,964$ 12.1 % (15,969,959)$ (0.3) %
Short Term Investment Pools 2,345,370,298 3 5.4 5,353,525 0.1
Total 43,220,774,135$ 100.0 % 4,962,594,580$ 100.0 %
1 Market value excludes $2,703,163,096 in securities lending collateral for fiscal year 2013.2 Total Investment & Interest Income excludes net security lending income of $71,239,936
and gain of $141,090,154 for securities lending collateral.3 Short term investment pools market value includes $302,755,787 of equity in common cash.
INVESTMENT SECTION
72 MICHIGAN PUBLIC SCHOOL EMPLOYEES’ RETIREMENT SYSTEM
This page was intentionally left blank.
MICHIGAN PUBLIC SCHOOL EMPLOYEES’ RETIREMENT SYSTEM 73
ACTUARIAL SECTION
Actuary’s Certification Summary of Actuarial Assumptions and Methods
Schedules of Active Member Valuation Data Schedules of Changes in the Retirement Rolls
Prioritized Solvency Test Analysis of System Experience
Summary of Plan Provisions
ACTUARIAL SECTION
74 MICHIGAN PUBLIC SCHOOL EMPLOYEES’ RETIREMENT SYSTEM
Actuary’s Certification
ACTUARIAL SECTION
MICHIGAN PUBLIC SCHOOL EMPLOYEES’ RETIREMENT SYSTEM 75
Actuary’s Certification (continued)
ACTUARIAL SECTION
76 MICHIGAN PUBLIC SCHOOL EMPLOYEES’ RETIREMENT SYSTEM
Actuary’s Certification (continued)
ACTUARIAL SECTION
MICHIGAN PUBLIC SCHOOL EMPLOYEES’ RETIREMENT SYSTEM 77
Summary of Actuarial Assumptions and Methods
1. The investment return rate used in the valuations of the MIP and Basic Pension plans was 8% per year (7% for the Pension Plus plan) net of expenses, compounded annually. This rate of return is not the assumed real rate of return. The real rate of return is the rate of investment return in excess of the inflation rate. Considering other financial assumptions, this investment return rate translates to an assumed long-term real rate of return of 4.5% (3.5% for the Pension Plus plan). Adopted 2004 (2010 for the Pension Plus plan).
2. The healthy life mortality table used in evaluating allowances to be paid was the RP-2000 Combined Healthy
Mortality Table adjusted for improvements to 2020 using projection scale AA. Adopted 2010
3. Sample probabilities of regular, unreduced retirement are shown in Schedule 1 on the next page. Adopted 2010.
4. Sample probabilities of withdrawal from service and disability, together with individual pay increase
assumptions, are shown in Schedule 2 on the next page of this report. Adopted 2010.
5. Total active member payroll is assumed to increase 3.5% per year. This represents the portion of the individual pay increase assumptions attributable to inflation. In effect, this assumes no change in the number of active members. Adopted 2004.
6. An individual entry age actuarial cost method of valuation was used in determining age and service and
deferred retirement actuarial liabilities and normal cost. Adopted 1975. Unfunded actuarial accrued liabilities, are financed over a declining 40-year period beginning October 1, 1996. Adopted 1996.
7. The Department of Technology, Management & Budget approved the use of market value of assets as of
September 30, 2006, for valuation purposes. For investment gains and losses that occur after that date, a 5-year smoothing technique will be used. Specifically, the excess (shortfall) of actual investment income (including interest, dividends, realized and unrealized gains or losses) over the imputed-income at the valuation interest rate is considered the gain (loss), which is spread over five years. Adopted 2007.
8. The data about persons now covered and about present assets was furnished by the System’s administrative
staff. Although examined for general reasonableness, the data was not audited by the actuary.
9. The actuarial valuation computations were made by or under the supervision of a Member of the American Academy of Actuaries (MAAA). The assumptions used in the actuarial valuations were adopted by the System’s Board and the Department of Technology, Management & Budget after consulting with the actuary.
10. A 5-year experience investigation, covering the period from October 1, 2002, through September 30, 2007,
was completed in 2010. The purpose of the study was to analyze the actual experience of the System versus that anticipated by actuarial assumptions then in use. Adopted 2010.
11. Gabriel Roeder Smith and Co. was awarded the actuarial and consulting services contract beginning October 4,
2006.
ACTUARIAL SECTION
78 MICHIGAN PUBLIC SCHOOL EMPLOYEES’ RETIREMENT SYSTEM
Summary of Actuarial Assumptions and Methods (continued)
Retirement Years ofAges Teachers Non-Teachers Teachers Non-Teachers Service Teachers Non-Teachers
* In thousands of dollars.Notes:No. refers to number of retiree health contractsAnnual allowances added to rolls includes increases due to medical inflation and contract changes.Annual allowances removed from rolls includes decreases due to contract changes.
Average Annual
Allowances
Added to Rolls Removed from Rolls Rolls-End of Year % Increase in Annual
Allowances
ACTUARIAL SECTION
MICHIGAN PUBLIC SCHOOL EMPLOYEES’ RETIREMENT SYSTEM 81
Prioritized Solvency Test The System’s funding objective is to meet long-term benefit promises through contributions that remain approximately level from year to year as a percent of member payroll. If the contributions to the System are level in concept and soundly executed, the System will pay all promised benefits when due, the ultimate test of financial soundness. Testing for level contribution rates is the long-term solvency test. A prioritized solvency test is another means of checking a system’s progress under its funding program. In a short condition test, the plan’s present assets (cash and investments) are compared with: (1) active member contributions on deposit; (2) the liabilities for future benefits to present retired lives; and (3) the liabilities for service already rendered by active and inactive members. In a system that has been following the discipline of level percent of payroll financing, the liabilities for active member contributions on deposit (liability 1) and the liabilities for future benefits to present retired lives (liability 2) will be fully covered by present assets (except in rare circumstances). In addition, the liabilities for service already rendered by active members (liability 3) are normally partially covered by the remainder of present assets. Generally, if the System has been using level-cost financing, the funded portion of liability 3 will increase over time. Liability 3 being fully funded is not necessarily a by-product of level percent of payroll funding methods. The schedules that follow illustrate the history of the liabilities of the System and are indicative of the System’s policy of following the discipline of level percent of payroll financing.
(1) (2) (3)Valuation Active Retirants Active and Inactive
1 Percents funded on a total valuation asset and total actuarial accrued liability basis.2 Revised asset valuation method.3 Revised benefit provisions.
Pension Benefits
($ in millions)
Portion of AAL Covered by Assets
Actuarial Accrued Liability (AAL)
ACTUARIAL SECTION
82 MICHIGAN PUBLIC SCHOOL EMPLOYEES’ RETIREMENT SYSTEM
Prioritized Solvency Test (continued)
(1) (2) (3)Valuation Active Retirants Active and Inactive
1 Percents funded on a total valuation asset and total actuarial accrued liability basis.2 Revised actuarial assumptions and/or methods.
Other Postemployment Benefits
($ in millions)
Portion of AAL Covered by Assets
Actuarial Accrued Liability (AAL)
ACTUARIAL SECTION
MICHIGAN PUBLIC SCHOOL EMPLOYEES’ RETIREMENT SYSTEM 83
Gain/(Loss)
1. Retirements (including Disability Retirement). If members retire at older ages or with lower final average pay than assumed, there is a gain. If younger ages or higher average pays, a loss. 31,372,593$
2. Withdrawal From Employment (including death-in-service). If more liabilities are released by withdrawals and deaths than assumed, there is a gain. If smaller releases,a loss. (41,099,184)
3. Pay Increases. If there are smaller pay increases than assumed, there is a gain. If greater increases, a loss. 1,170,809,254
4. Investment Income. If there is greater investment income than assumed, there is a gain. If less income, a loss. (3,453,940,562)
5. Death After Retirement. If retirants live longer than assumed, there is a loss. If not as long, a gain. (184,067,751)
6. New entrants/Rehires. New entrants into the System will generally result in an actuarial loss. (49,256,525)
7. Other. Miscellaneous gains and losses resulting from data adjustments, timing of financial transactions, etc. (146,690,152)
8. Composite Gain (or Loss) During Year (2,672,872,327)$
Analysis of System Experience
Gains/(Losses) in Accrued Liabilities During Year Ended September 30, 2012Resulting from Differences Between Assumed Experience & Actual Experience
Type of Activity
ACTUARIAL SECTION
84 MICHIGAN PUBLIC SCHOOL EMPLOYEES’ RETIREMENT SYSTEM
Summary of Plan Provisions Our actuarial valuation of the System as of September 30, 2012, is based on the present provisions of the Michigan Public School Employees’ Retirement Act (Public Act 300 of 1980, as amended). Regular Retirement (no reduction factor for age) Eligibility - Age 55 with 30 years credited service; or age 60 with 10 years credited service. For Member Investment Plan (MIP) members, any age with 30 years credited service; or age 60 with 10 years credited service; or age 60 with 5 years of credited service provided member worked through 60th birthday and has credited service in each of the last 5 years. For Pension Plus (PPP) members, age 60 with 10 years of credited service. Mandatory Retirement Age - None. Transition Date – February 1, 2013 Annual Amount - Total credited service as of the Transition Date times 1.5% of final average compensation, Plus
An amount determined by the member’s election of Option 1, 2, 3, or 4 described below.
Option 1 – Credited Service after the Transition Date times 1.5% times FAC
Option 2 – Credited Service after the Transition Date (until total service reaches 30 years) times 1.5% times FAC, PLUS Credited Service after the Transition Date and over 30 years times 1.25% times FAC.
Option 3 – Credited Service after the Transition Date times 1.25% times FAC.
Option 4 – None (Member will receive benefit through a Defined Contribution plan).
Final Average Compensation - Average of highest 60 consecutive months (36 months for MIP members). FAC is calculated as of the last day worked unless the member elected option 4, in which case the FAC is calculated at the Transition Date.
Early Retirement (age reduction factor used)
Eligibility - Age 55 with 15 or more years credited service and earned credited service in each of the last 5 years. PPP members are not eligible for early retirements.
Annual Amount - Regular retirement benefit, reduced by 0.5% for each month by which the commencement age is less than 60.
Deferred Retirement (vested benefit)
Eligibility - 10 years of credited service. Benefit commences at the time age qualification is met.
Annual Amount - Regular retirement benefit based on service and final average compensation at time of termination.
Duty Disability Retirement
Eligibility - No age or service requirement; in receipt of workers’ disability compensation.
Annual Amount - Computed as regular retirement benefit with minimum benefit based on 10 years credited service. Additional limitation such that disability benefits plus authorized outside earnings limited to 100% of final average compensation (increased by 2% each year retired).
ACTUARIAL SECTION
MICHIGAN PUBLIC SCHOOL EMPLOYEES’ RETIREMENT SYSTEM 85
Summary of Plan Provisions (continued) Non-Duty Disability Retirement
Eligibility - 10 years of credited service. Annual Amount - Computed as regular retirement benefit based on credited service and final average compensation at time of disability. Additional limitation such that disability benefits plus authorized outside earnings limited to 100% of final average compensation (increased by 2% each year retired). Duty Death Before Retirement Eligibility - No age or service requirement. Beneficiary is in receipt of workers’ compensation. Also applies to “duty disability” retirees during first three years of disability. Annual Amount – Spouse benefit computed as regular retirement benefit with minimum benefit based on ten years of credited service, reduced for 100% joint and survivor election. If no surviving spouse, children under 18 share in benefit; if no spouse or children, a disabled and dependent parent is eligible. Non-Duty Death Before Retirement Eligibility – For Basic members, 15 years of credited service, or age 60 and 10 years of credited service. For MIP members, 10 years of credited service, or age 60 and 5 years of credited service. For PPP members, 10 years of credited service, or age 60 and 10 years of credited service. Annual Amount - Computed as regular retirement benefit, reduced in accordance with a 100% joint and survivor election, with payments commencing first of month following death. For the beneficiary of a deferred member, benefit commences at the time a member would have attained the minimum age qualification. Post-Retirement Cost-of-Living Adjustments One-time upward adjustments have been made in 1972, 1974, 1976 and 1977 for members retired on or after July 1, 1956, and prior to July 1, 1976, who were eligible for Social Security benefits. For members who retired prior to July 1, 1956, and not eligible for Social Security benefits based upon membership service, the minimum base pension was increased in 1965, 1971, 1972, 1974 and 1981, and in 1976 and 1977 one-time upward adjustments were made. Beginning in 1983, eligible recipients received an annual distribution of investment earnings in excess of 8% (supplemental payment). On January 1, 1986, all members who retired prior to January 1, 1986, were given a permanent 8% increase. On January 1, 1990, a one-time upward adjustment for members who retired prior to October 1, 1981, was made. Currently members receive annual increases based on the following schedule: Retired before January 1, 1987 - Greater of Supplemental payment or automatic 3% increase. Retired on or after January 1, 1987 under MIP - Automatic 3% increase only. Retired on or after January 1, 1987 not under MIP - Supplemental payment only. Retired under PPP – No increases.
ACTUARIAL SECTION
86 MICHIGAN PUBLIC SCHOOL EMPLOYEES’ RETIREMENT SYSTEM
Summary of Plan Provisions (continued) Post-Retirement Health Benefits Members hired before July 1, 2008 are eligible for 80% System paid Master Health Plan and Dental and Vision coverage for themselves and their dependents. However, those retirees Medicare eligible at January 1, 2013 receive 90% System paid coverage. Members hired before July 1, 2008 who retired from deferred vested status with less than 30 years of service, who terminate employment after October 31, 1980 with vested deferred benefits, are eligible for partially System paid health benefit coverage (no payment if less than 21 years of service, 10% of maximum employer payment for each year of service over 20 up to 80% for 28 or more years of service). Members hired after June 30, 2008, but before September 4, 2012, are eligible for 80% System paid Master Health Plan and Dental and Vision coverage for themselves and their dependents, but the premium subsidy is graded based on career length as described below:
a. Member is age 60 or older at retirement If member has 10 or more years of total service, the System pays 30% of the monthly
premium for the first 10 years of total service, plus 4% times next 13 years of total service, to a maximum of 80% of the monthly premium if 22.5 years of total service or more.
If a member has fewer than 10 years of total service, there is no System paid coverage.
b. Member is under age 60 at retirement If member has 25 years of actual service, the System pays 80% of the monthly premium. If the member has under 25 years of actual service, upon attainment of age 60 the member
may apply for System paid coverage (as described by the schedule above in a.). Dependents are eligible for 80% System paid employer health benefits (partial payments for dependents of deferred vested members who had 21 or more years of service and dependents of members hired on or after July 1, 2008, as per the above schedule). Members hired on or after September 4, 2012 will become participants of the Personal Healthcare Fund (PHF) and will not be eligible for insurance premium subsidy in retirement. For members hired on or after September 4, 2012, the maximum insurance subsidy is payable to the surviving spouse and health dependents of members who die as a result of injury or illness resulting from job activites. For all other members hired on or after September 4, 2012, the defined benefit portion of their post-retirement health benfits coverage is limited to a credit to a Health Reimbursement Account at termination if they have at least 10 years of service. The credit will be $2,000 for participants who are at least age 60 at termination or $1,000 for participants who are less than age 60 at termination. Public Act 300 of 2012 granted all members of the Michigan Public School Employees Retirement System, who earned service credit in the 12 months ending September 4, 2012, or were on an approved professional services or military leave of absence on September 4, 2012, a voluntary election regarding their retirement healthcare. Any changes to a member’s healthcare benefit are effective as of the member’s transition date, which is defined as the first day of the pay period that begins on or after February 1, 2013. Under Public Act 300 of 2012, members were given the choice between i. and ii. below:
i. Maintaining eligibility for the premium subsidy described above, and contributing 3% of their compensation while still working, or
ii. Entering the PHF. Members not making an election will default into the premium subsidy arrangement.
ACTUARIAL SECTION
MICHIGAN PUBLIC SCHOOL EMPLOYEES’ RETIREMENT SYSTEM 87
Summary of Plan Provisions (continued) If a member who elected the subsidy terminates prior to becoming eligible for the subsidy, dies before the total value of the subsidy received equals the total value of contributions made, or retires and declines coverage, the member or beneficiary may request a refund of unused funds. Refunds of member contributions to the healthcare funding account are issued as a supplemental pension benefit (payable at age 60 and payable from the pension plan) paid out over a 60 month period.
A delayed subsidy applies to retirees who became a member of the retirement system before July 1, 2008 and who purchased service credit on or after July 1, 2008. Such individuals are eligible for premium subsidy benefits at age 60 or when they would have been eligible to retire without having made a service purchase, whichever comes first. They may enroll in the insurances earlier, but are responsible for the full premium until the premium subsidy begins. Member Contributions before Transition Date (February 1, 2013) Basic Participants – None.
MIP Participants hired before January 1, 1990 - 3.9% of pay.
MIP Participants hired on or after January 1, 1990 and before July 1, 2008 - 3.0% of first $5,000 of pay, plus 3.6% of next $10,000 of pay, plus 4.3% pay in excess of $15,000.
MIP and PPP Participants hired on or after July 1, 2008 - 3.0% of first $5,000 of pay, plus 3.6% of next $10,000 of pay, plus 6.4% pay in excess of $15,000.
Member Contributions on or after Transition Date (February 1, 2013) Basic and MIP Members – Contributions depend on member election of Option 1, 2, or 3. Members electing Option 4 will not contribute to the Plan.
Option 1 – Basic Members – 4% All MIP members – 7%
Option 2 – Contributions as in Option 1 until member reaches 30 years of service. At 30 years of service, contribution reverts to pre-transition date level.
Option 3 – Post transition date contribution is the same as the pre-transition date contribution.
PPP Members – 3% of first $5,000 of pay, plus 3.6% of next $10,000 of pay, plus 6.4% of pay in excess of $15,000.
Member Contributions Attributable to the Retiree Health Plans Under Public Act 300 of 2012, members were given the choice between i. and ii. Below:
i. Maintaining eligibility for premium subsidy retiree medical coverage, and contributing 3% of their compensation while still working, or
ii. Entering the Personal Healthcare Fund (PHF)
Members not making an election defaulted into the premium subsidy arrangement.
If a member who elected the subsidy terminates prior to becoming eligible for the subsidy, dies before the total value of the subsidy received equals the total value of contributions made, or retires and declines coverage, the member or beneficiary may request a refund of unused funds. Refunds of member contributions to the healthcare funding account are issued as a supplemental pension benefit (payable at age 60 and payable from the pension plan) paid out over a 60 month period.
ACTUARIAL SECTION
88 MICHIGAN PUBLIC SCHOOL EMPLOYEES’ RETIREMENT SYSTEM
This page was intentionally left blank.
MICHIGAN PUBLIC SCHOOL EMPLOYEES’ RETIREMENT SYSTEM 89
STATISTICAL SECTION
Schedules of Additions by Source Schedules of Deductions by Type
Schedules of Changes in Net Position Schedules of Benefits and Refunds by Type
Schedules of Retired Members by Type of Benefit Schedule of Other Postemployment Benefits
Schedules of Average Benefit Payments Schedule of Principal Participating Employers
Ten Year History of Membership Schedule of Participating Employers
STATISTICAL SECTION
90 MICHIGAN PUBLIC SCHOOL EMPLOYEES’ RETIREMENT SYSTEM
This part of the System’s comprehensive annual financial report presents detailed information as a context for understanding what the information in the financial statements, note disclosures, and required supplementary information says about the System’s overall financial health.
Contents
Financial Trends These schedules contain trend information to help the reader understand how the System’s financial performance and fiscal health has changed over time. The schedules are presented for the last ten fiscal years. Schedules included are:
Schedule of Pension Plan Additions by Source Schedule of OPEB Plan Additions by Source Schedule of Pension Plan Deductions by Type Schedule of OPEB Plan Deductions by Type Schedule of Changes in Net Position - Pension Plan Schedule of Changes in Net Position - OPEB Plan Schedule of Pension Benefit and Refunds by Type Schedule of OPEB Benefits and Refunds by Type
Operating Information These schedules contain contextual information to assist the reader’s understanding of how the System’s financial information relates to the combination of participating members and the benefits it provides. Schedules are presented for the last ten fiscal years, except where noted. Schedules included are:
Schedule of Retired Members by Type of Pension Benefit Schedule of Retired Members by Type of Other Postemployment Benefits Schedule of Other Postemployment Benefits Schedule of Average Benefit Payments - Pension Schedule of Average Benefit Payments - Health Schedule of Average Benefit Payments - Dental/Vision Schedule of Principal Participating Employers Ten Year History of Membership Schedule of Participating Employers
STATISTICAL SECTION
MICHIGAN PUBLIC SCHOOL EMPLOYEES’ RETIREMENT SYSTEM 91
Last Ten Years
Fiscal YearEnded Member % of Annual Net Investment &
Sept. 30 Contributions Dollars Covered Payroll Other Income Total
Source: Gabriel Roeder Smith & Co. - for all periods except 10/1/04 to 9/30/05
Period 10/1/11 to 9/30/12 Average Monthly Benefit Average Final Average Salary Number of Active Retirants
Period 10/1/10 to 9/30/11 Average Monthly Benefit Average Final Average Salary Number of Active Retirants
Period 10/1/09 to 9/30/10 Average Monthly Benefit Average Final Average Salary Number of Active Retirants
Payment Periods Credited Service (Years) as of September 30
Period 10/1/04 to 9/30/05 Average Monthly Benefit Average Final Average Salary Number of Active Retirants
Period 10/1/05 to 9/30/06 Average Monthly Benefit Average Final Average Salary Number of Active Retirants
Period 10/1/06 to 9/30/07 Average Monthly Benefit Average Final Average Salary Number of Active Retirants
Period 10/1/07 to 9/30/08 Average Monthly Benefit
Average Final Average Salary Number of Active Retirants
Average Final Average Salary Number of Active Retirants
Period 10/1/08 to 9/30/09 Average Monthly Benefit
STATISTICAL SECTION
MICHIGAN PUBLIC SCHOOL EMPLOYEES’ RETIREMENT SYSTEM 101
Schedule of Principal Participating Employers For Fiscal Years Ending September 30, 2012 and 2003
Percentage Percentageof Total of Total
Participating Employer Employees System Employees System
Detroit Public Schools 9,009 3.81 % 24,270 7.75 %Utica Community Schools 4,443 1.88 5,148 1.64Grand Rapids Public Schools 3,788 1.60 5,382 1.72Ann Arbor Public Schools 3,443 1.45 4,042 1.29Oakland Community College 3,064 1.29 2,593 0.83Dearborn Public Schools 3,020 1.28 3,479 1.11Kalamazoo Public Schools 3,007 1.27 3,162 1.01Macomb Community College 2,627 1.11 2,353 0.75Plymouth-Canton Community SD 2,594 1.10 2,935 0.94Lansing School District 2,570 1.09 4,032 1.29
All other 199,095 84.13 255,626 81.66
Total 236,660 100.00 % 313,022 100.00 %
2012 2003
STATISTICAL SECTION
102 MICHIGAN PUBLIC SCHOOL EMPLOYEES’ RETIREMENT SYSTEM
Ten Year History of Membership (In thousands) Fiscal Year Ended September 30
214,906
200,952
0
50
100
150
200
250
300
350
2004 2005 2006 2007 2008 2009 2010 2011 2012 2013
ACTIVE RETIRED
Source: Gabriel Roeder Smith & Co.
STATISTICAL SECTION
MICHIGAN PUBLIC SCHOOL EMPLOYEES’ RETIREMENT SYSTEM 103
Schedule of Participating Employers at 9/30/13 Universities: Central Michigan University Eastern Michigan University Ferris State University Lake Superior State University Michigan Technological University Northern Michigan University Western Michigan University Community Colleges: Alpena Community College Bay De Noc Community College Charles S Mott Community College Delta College Glen Oaks Community College Gogebic Community College Grand Rapids Community College Henry Ford Community College Jackson College Kalamazoo Valley Community College Kellogg Community College Kirtland Community College Lake Michigan College Lansing Community College Macomb Community College Mid-Michigan Community College Monroe County Community College Montcalm Community College Muskegon Community College North Central Michigan College Northwestern Michigan College Oakland Community College Schoolcraft Community College Southwestern Michigan College St Clair County Community College Washtenaw Community College Wayne County Community College West Shore Community College Intermediate School Districts: Allegan Area Educational Service Agency Alpena-Montmorency-Alcona E. S. D. Barry Intermediate School District Bay-Arenac Intermediate School District Berrien R. E. S. A. Branch Intermediate School District Calhoun Intermediate School District Charlevoix-Emmet Intermediate School District
Cheboygan-Otsego-Presque Isle ESD Clare-Gladwin Intermediate School District Clinton County R. E. S. A. Coor Intermediate School District Copper Country Intermediate School District Delta-Schoolcraft Intermediate School District Dickinson-Iron Intermediate School District Eastern U P Intermediate School District Eaton Intermediate School District Genesee Intermediate School District Gogebic-Ontonagon Intermediate School District Gratiot-Isabella R. E. S. D. Hillsdale Intermediate School District Huron Intermediate School District Ingham Intermediate School District Ionia Intermediate School District Iosco R. E. S. A. Jackson Intermediate School District Kalamazoo R. E. S. A. Kent Intermediate School District Lapeer Intermediate School District Lenawee Intermediate School District Lewis Cass Intermediate School District Livingston E. S. A. Macomb Intermediate School District Manistee Intermediate School District Marquette-Alger Intermediate School District Mecosta-Osceola Intermediate School District Menominee Intermediate School District Midland County E. S. A. Monroe Intermediate School District Montcalm Area Intermediate School District Muskegon Area Intermediate School District Newaygo County R. E. S. A. Oakland Intermediate School District Ottawa Area Intermediate School District Saginaw Intermediate School District Sanilac Intermediate School District Shiawassee R. E. S. D. St. Clair County R. E. S. A. St. Joseph Intermediate School District Traverse Bay Area Intermediate School District Tuscola Intermediate School District Van Buren Intermediate School District Washtenaw Intermediate School District Wayne R. E. S. A. West Shore Educational Service District Wexford-Missaukee Intermediate School District
STATISTICAL SECTION
104 MICHIGAN PUBLIC SCHOOL EMPLOYEES’ RETIREMENT SYSTEM
Schedule of Participating Employers at 9/30/13 (continued) K – 12 School Districts: Adams Township School District Adams-Sigel #3 School Addison Community Schools Adrian Public Schools Airport Community Schools Akron-Fairgrove Schools Alanson Public Schools Alba Public Schools Albion Public Schools Alcona Community Schools Algonac Community Schools Allegan Public Schools Allen Park Public Schools Allendale Public Schools Alma Public Schools Almont Community Schools Alpena Public Schools Anchor Bay School District Ann Arbor Public Schools Arenac-Eastern High School Armada Area Schools Arvon Township Schools Ashley Community Schools Athens Area Schools Atherton Community Schools Atlanta Community Schools Au Gres-Sims School District Autrain-Onota Public Schools Avondale School District Bad Axe Public Schools Baldwin Community Schools Bangor Public Schools Bangor Township Schools Baraga Township Schools Bark River - Harris Schools Bath Community Schools Battle Creek Public Schools Bay City Public Schools Beal City Schools Bear Lake School Beaver Island Community Schools Beaverton Rural School District Bedford Public Schools Beecher Community School District Belding Area Schools Bellaire Public Schools Bellevue Community Schools Bendle Public Schools
Bentley Community Schools Benton Harbor Area Schools Benzie County Central Schools Berkley School District Berrien Springs Public Schools Bessemer Area School District Big Bay De Noc School District Big Burning-Colfax #1f School Big Jackson School District Big Rapids Public Schools Birch Run Area Schools Birmingham Public Schools Blissfield Community School District Bloomfield Hills School District Bloomingdale Public Schools Bois Blanc Pines School District Boyne City Public Schools Boyne Falls Public Schools Brandon School District Brandywine Public Schools Breckenridge Community Schools Breitung Township Schools Bridgeport-Spaulding Comm. School District Bridgman Public Schools Brighton Area Schools Brimley Public Schools Britton-Deerfield Schools Bronson Community Schools Brown City Community Schools Buchanan Community Schools Buckley Community Schools Bullock Creek School District Burr Oak Community Schools Burt Township School District Byron Area Schools Byron Center Public Schools Cadillac Area Public Schools Caledonia Community Schools Calumet Public Schools Camden-Frontier School Capac Community Schools Carman-Ainsworth Community School District Carney-Nadeau Public Schools Caro Community Schools Carrollton School District Carson City-Crystal Area Schools Carsonville-Port Sanilac School
STATISTICAL SECTION
MICHIGAN PUBLIC SCHOOL EMPLOYEES’ RETIREMENT SYSTEM 105
Schedule of Participating Employers at 9/30/13 (continued) K - 12 School Districts (continued):
Caseville Public Schools Cass City Public Schools Cassopolis Public Schools Cedar Springs Public Schools Center Line Public Schools Central Lake-Antrim County Public Schools Central Montcalm Public Schools Centreville Public Schools Charlevoix Public Schools Charlotte Public Schools Chassell Township Schools Cheboygan Area School District Chelsea School District Chesaning-Union Schools Chippewa Hills School District Chippewa Valley Schools Church School Clare Public Schools Clarenceville School District Clarkston Community Schools Clawson City School District Climax-Scotts Community Schools Clinton Community Schools Clintondale Community Schools Clio Area School District Coldwater Community Schools Coleman Community Schools Coloma Community Schools Colon Community School Columbia School District Comstock Park Public Schools Comstock Public Schools Concord Community Schools Constantine Public Schools Coon-Berlin Township School District #3 Coopersville Public Schools Corunna Public Schools Covert Public Schools Crawford-AuSable School District Crawford-Excelsior School District #1 Crestwood School District Croswell-Lexington Schools Dansville Schools Davison Community Schools Dearborn Heights School District #7 Dearborn Public Schools Decatur Public Schools Deckerville Community School District Delton-Kellogg Schools DeTour Area Schools
Detroit Public Schools Dewitt Public Schools Dexter Community Schools Dollar Bay-Tamarack School District Dowagiac-Union School District Dryden Community Schools Dundee Community Schools Durand Area Schools East China School District East Detroit School District East Grand Rapids Public Schools East Jackson Public Schools East Jordan Public Schools East Lansing Public Schools Eaton Rapids Public Schools Eau Claire Public Schools Eccles-Sigel #4 School Ecorse Public Schools Edwardsburg Public Schools Elk Rapids Schools Ellsworth Community Schools Elm River Township Schools Engadine Consolidated School District #4 Escanaba Area Public Schools Essexville-Hampton Public Schools Evart Public Schools Ewen-Trout Creek Consolidated School District Fairview Area Schools Farmington Public Schools Farwell Area Schools Fennville Public Schools Fenton Area Public Schools Ferndale City School District Fitzgerald Public Schools Flat Rock Community Schools Flint Community Schools Flushing Community Schools Forest Area Schools Forest Hills Public Schools Forest Park School District Fowler Public Schools Fowlerville Community Schools Frankenmuth School District Frankfort-Elberta Area Schools Fraser Public Schools Freeland Community Schools Free Soil Community School District # 8 Fremont Public Schools Fruitport Community Schools Fulton Schools Galesburg-Augusta Community School District
STATISTICAL SECTION
106 MICHIGAN PUBLIC SCHOOL EMPLOYEES’ RETIREMENT SYSTEM
Schedule of Participating Employers at 9/30/13 (continued) K - 12 School Districts (continued): Galien Township School Garden City Public Schools Gaylord Community Schools Genesee School District Gibraltar School District Gladstone Area Schools Gladwin Community Schools Glen Lake Community Schools Glenn-Ganges School District #4 Gobles Public Schools Godfrey-Lee Public Schools Godwin Heights Public Schools Goodrich Area Schools Grand Blanc Community Schools Grand Haven Public Schools Grand Ledge Public Schools Grand Rapids Public Schools Grandville Public Schools Grant Public Schools Grant Township School Grass Lake Community Schools Greenville Public Schools Grosse Ile Township Schools Grosse Pointe Public Schools Gull Lake Community Schools Gwinn Area Community Schools Hale Area Schools Hamilton Community Schools Hamtramck Public Schools Hancock Public Schools Hanover Horton School District Harbor Beach Community School District Harbor Springs Public Schools Harper Creek Community Schools Harper Woods Public Schools Harrison Community Schools Hart Public Schools Hartford Public Schools Hartland Consolidated Schools Haslett Public Schools Hastings Area School District Haynor- Easton Township School District #6 Hazel Park Public Schools Hemlock Public Schools Hesperia Community Schools Highland Park School District Hillman Community Schools Hillsdale Community Schools Holland Public Schools Holly Area Schools
Holt Public Schools Holton Public Schools Homer Community Schools Hopkins Public Schools Houghton Lake Community Schools Houghton-Portage Township School District Howell Public Schools Hudson Area Schools Hudsonville Public Schools Huron School District Huron Valley School District Ida Public Schools Imlay City Community Schools Inland Lakes Schools Ionia Public Schools Iron Mountain Public Schools Ironwood-Gogebic City Area Schools Ishpeming Public Schools Ithaca Public Schools Jackson Public Schools Jefferson Schools Jenison Public Schools Johannesburg-Lewiston Area Schools Jonesville Community Schools Kalamazoo Public Schools Kaleva Norman Dickson School District Kalkaska Public Schools Kearsley Community Schools Kelloggsville Public Schools Kenowa Hills Public Schools Kent City Community Schools Kentwood Public Schools Kingsley Area Schools Kingston Community Schools Kipper School L’Anse Public Schools Laingsburg Community Schools Lake City Area Schools Lake Fenton Community School District Lake Linden-Hubbell Public Schools Lake Orion Community School #3 Lake Shore Public Schools Laker Schools Lakeshore Public Schools Lakeview Community Schools Lakeview Public Schools Lakeview School District Lakeville Community Schools Lakewood School District Lamphere Public Schools L’Anse Creuse Public Schools
STATISTICAL SECTION
MICHIGAN PUBLIC SCHOOL EMPLOYEES’ RETIREMENT SYSTEM 107
Schedule of Participating Employers at 9/30/13 (continued) K - 12 School Districts (continued): Lansing Public Schools Lapeer Public Schools Lawrence Public Schools Lawton Community Schools Leland Public Schools Les Cheneaux Community Schools Leslie Public Schools Lincoln Consolidated Schools Lincoln Park Public Schools Linden Community Schools Litchfield Community Schools Livonia Public Schools Lowell Area Schools Ludington Area Schools Mackinaw City Public Schools Mackinac Island Public Schools Madison District Public Schools Madison School District #2 Mancelona Public Schools Manchester Community Schools Manistee Public Schools Manistique Area Schools Manton Consolidated School District Maple Valley Schools Mar Lee School District Marcellus Community Schools Marion Public Schools Marlette Community Schools Marquette Area Public Schools Marshall Public Schools Martin Public Schools Marysville Public Schools Mason Co.-Eastern-Custer #5 School District Mason Consolidated Schools Mason County Central School District Mason Public Schools Mattawan Consolidated Schools Mayville Community Schools McBain Rural Agricultural School Melvindale-Northern Allen Park School District Memphis Community Schools Mendon Community School Menominee Area Public Schools Meridian Public Schools Merrill Community Schools Mesick Consolidated Schools Michigan Center School District Mid Peninsula Schools Midland City Schools Milan Area Schools
Millington Community School District Mio-AuSable Schools Mona Shores School District #29 Monroe Public Schools Montabella Community Schools Montague Area Public Schools Montrose Community Schools Moran Township School District Morenci Area Schools Morley-Stanwood Community Schools Morrice Area Schools Mt Clemens Community Schools Mt Morris Consolidated Schools Mt Pleasant Public Schools Munising Public Schools Muskegon City Public Schools Muskegon Heights City Public Schools Napoleon Comm. School District Negaunee Public Schools New Buffalo Area Schools New Haven Community Schools New Lothrop Area Public Schools Newaygo Public Schools Nice Community Schools Niles Public Schools North Adams-Jerome Public Schools North Branch Area Schools North Central Area Schools North Dickinson School North Huron Schools North LeValley School #2 North Muskegon Public Schools Northport Public Schools Northview Public Schools Northville Public Schools Northwest School District Norway-Vulcan Area Schools Nottawa Community Schools Novi Community School District Oak Park School District Oakridge Public Schools Okemos Public Schools Olivet Community Schools Onaway Area Community Schools Onekama Consolidated Schools Onsted Community Schools Ontonagon Area School District Orchard View Schools Oscoda Area Schools Otsego Public Schools
STATISTICAL SECTION
108 MICHIGAN PUBLIC SCHOOL EMPLOYEES’ RETIREMENT SYSTEM
Schedule of Participating Employers at 9/30/13 (continued) K - 12 School Districts (continued): Ovid-Elsie Area Schools Owendale-Gagetown Area Schools Owosso Public Schools Oxford Area Community Schools Palo Community Schools Parchment School District Paw Paw Public Schools Peck Community Schools Pellston Public Schools Pennfield Public Schools Pentwater Public Schools Perry Public Schools Petoskey Public Schools Pewamo-Westphalia Comm School District Pickford Public Schools Pinckney Community Schools Pinconning Area Schools Pine River Area Schools Pittsford Area Schools Plainwell Community Schools Plymouth-Canton Community School District Pontiac City School District Port Hope Community Schools Port Huron Area Schools Portage Public Schools Portland Public Schools Posen Consolidated Schools Potterville Public Schools Powell Township School District Quincy Community Schools Rapid River Public Schools Ravenna Public Schools #24 Reading Community Schools Redford-Union School District #1 Reed City Public School District Reese Public Schools Reeths-Puffer Schools Republic-Michigamme Schools Richmond Community Schools River Rouge Public Schools River School River Valley School District Riverside-Hagar School District #6 Riverview Public Schools Rochester Community Schools Rockford Public Schools Rogers City Area Schools Romeo Community Schools Romulus Community Schools Roscommon Area Public Schools Roseville Community Schools
Royal Oak City School District Rudyard Public Schools Saginaw City Schools Saginaw Township Community Schools Saline Area Schools Sand Creek Community Schools Sandusky Community Schools Saranac Community Schools Saugatuck Public Schools Sault Ste Marie Public Schools Schoolcraft Community Schools Shelby Public Schools Shepherd Public Schools South Haven Public Schools South Lake Public Schools South Lyon Community Schools South Redford School District Southfield Public Schools Southgate Community School District Sparta Area Schools Spring Lake Public Schools Springport Public Schools St Charles Community Schools St Ignace Public Schools St Johns Public Schools St Joseph Public Schools St Louis Public Schools Standish-Sterling Community School District Stanton Township Public Schools Stephenson Area Public Schools Stockbridge Community Schools Strange-Oneida School #3 Sturgis Public Schools Summerfield Schools Superior Central School District Suttons Bay Public Schools Swan Valley School District Swartz Creek Community Schools Tahquamenon Area School District Tawas Area Schools Taylor School District Tecumseh Public Schools Tekonsha Community Schools Thornapple-Kellogg School Three Rivers Community Schools Traverse City Public Schools Trenton Public Schools Tri-County Area Schools Troy City School District Ubly Community Schools Union City Community Schools
STATISTICAL SECTION
MICHIGAN PUBLIC SCHOOL EMPLOYEES’ RETIREMENT SYSTEM 109
Schedule of Participating Employers at 9/30/13 (continued) K - 12 School Districts (continued): Unionville-Sebewaing Area Schools Utica Community Schools Van Buren Public Schools Vanderbilt Area Schools Vandercook Lake Public Schools Van Dyke Public Schools Vassar Public Schools Verona Mills School Vestaburg Community Schools Vicksburg Community Schools Wakefield-Marenisco School District Waldron Area Schools Walkerville Public Schools Walled Lake Consolidated Schools Warren Consolidated Schools Warren Woods Public Schools Waterford School District Watersmeet Township School District Watervliet Public Schools Waverly Community Schools Wayland Union Schools Wayne-Westland Community Schools Webberville Community Schools Wells Township School #18 West Bloomfield Schools West Branch-Rose City Area Schools West Iron County Public Schools West Ottawa Public Schools Western School District Westwood Community Schools Westwood Heights Schools White Cloud Public Schools White Pigeon Community Schools Whitefish Township School Whiteford Agricultural School Whitehall District Schools Whitmore Lake Public Schools Whittemore-Prescott Area Schools Williamston Community Schools Willow Run Community Schools Wolverine Community Schools Wood School District #8, Bangor Township Woodhaven-Brownstown School District Wyandotte Public Schools Wyoming Public Schools Yale Public School District Ypsilanti Public Schools Zeeland Public Schools
Public School Academies: AGBU Alex & Marie Manoogian School Aisha Shule/WEB DuBois Prep School Arts Academy in the Woods Bay-Arenac Community High School Blue Water Learning Academy Blue Water Middle College Academy Central Academy Charlton Heston Academy Commonwealth Community Development Academy Concord Academy Concord Montessori and Community School Countryside Charter School Creative Technologies Academy Crossroads Charter Academy Da Vinci Institute Dearborn Academy Detroit Service Learning Academy Edison Public School Academy El-Hajj Malik El-Shabazz Academy Gaudior Academy Grand Rapids Child Discovery Center Greater Heights Academy Henry Ford Academy Holly Academy Honey Creek Community School Hope Academy International Academy of Flint International Academy of Saginaw Joseph K. Lumsden Public School Academy Macomb Academy Madison Academy Martin Luther King, Jr. Public School Academy Michigan Math and Science Academy Michigan Technical Academy Mid-Michigan Leadership Academy Nah Tah Wahsh Public School Academy New Beginnings Academy New Branches School North Star Academy Oakland International Academy Outlook Academy Plymouth Educational Center Charter School St. Clair County Academy of Style St. Clair County Career Prep Academy St. Clair County Intervention Academy St. Clair County Learning Academy Summit Academy Summit Academy North
STATISTICAL SECTION
110 MICHIGAN PUBLIC SCHOOL EMPLOYEES’ RETIREMENT SYSTEM
Schedule of Participating Employers at 9/30/13 (continued) Public School Academies (continued): Three Lakes Academy Virtual Learning Academy of St. Clair Walden Green Day School Washtenaw Technical Middle College Wavecrest Career Academy West Village Academy Windover High School Woodland Park Academy Woodward Academy Libraries: Ann Arbor District Library Bacon Memorial District Library Cheboygan Area Public Library Flint Public Library Grosse Pointe Public Library Hackley Public Library Houghton Lake Public Library Kalamazoo Public Library Mt Clemens Public Library Public Libraries of Saginaw Willard District Library
MICHIGAN PUBLIC SCHOOL EMPLOYEES’ RETIREMENT SYSTEM 111
ACKNOWLEDGMENTS The Michigan Public School Employees’ Retirement System Comprehensive Annual Financial Report is prepared by Financial Services, Fiscal Management Division. Staff of the division for the fiscal year 2012 -2013 report included: Management: Ronald W. Foss, Director Cindy Peters, Accounting Manager Julie Salman, Accounting Manager Accountants: Dan Harry Erik Simmer Paula Webb Carol Wheaton
Technical and Support Staff:
Cecelia Anderson Cristine Berns
Jamin Schroeder Thomas Reese Special thanks are also extended to the Office of Retirement Services personnel, accounting and support personnel throughout Financial Services, Investments Division of Treasury, Department of Community Health cashiering personnel, Office of the Auditor General, Gabriel Roeder Smith & Co., and the staff at the Office of Financial Management. Preparation of this report would not have been possible without the efforts of these individuals.
The report may be viewed on-line at: www.michigan.gov/ors