26
Mineral and metals production: an overview Olle Östensson, Caromb Consulting
| Date post: | 18-Dec-2015 |
| Category: |
Documents |
| Upload: | hugo-hoover |
| View: | 244 times |
| Download: | 0 times |
Mineral and metals production: an overview
Olle Östensson, Caromb Consulting
Outline of presentation
• What are minerals?• Why is mining important?• Geography of mining• Demand for minerals• Reserves and resources
Some definitions
• Metals are chemical elements that conduct electricity.
• In nature, they occur in the form of minerals, which are chemical compounds containing metals and with specific chemical and physical characteristics.
• Minerals occurring in sufficient quantity and grade to be economically exploitable are called ores.
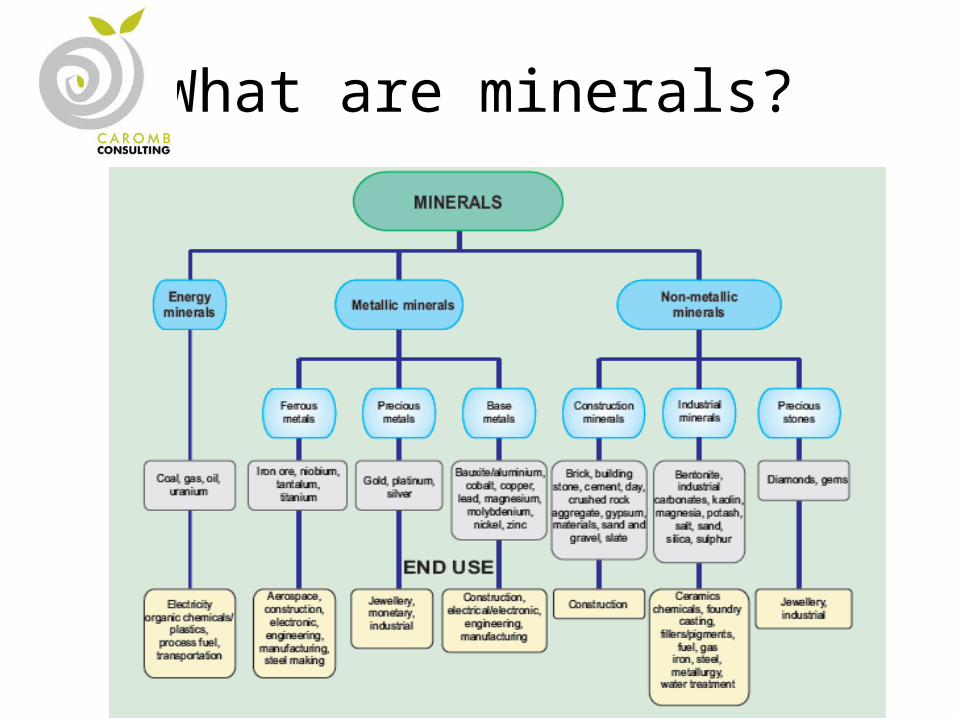
What are minerals?
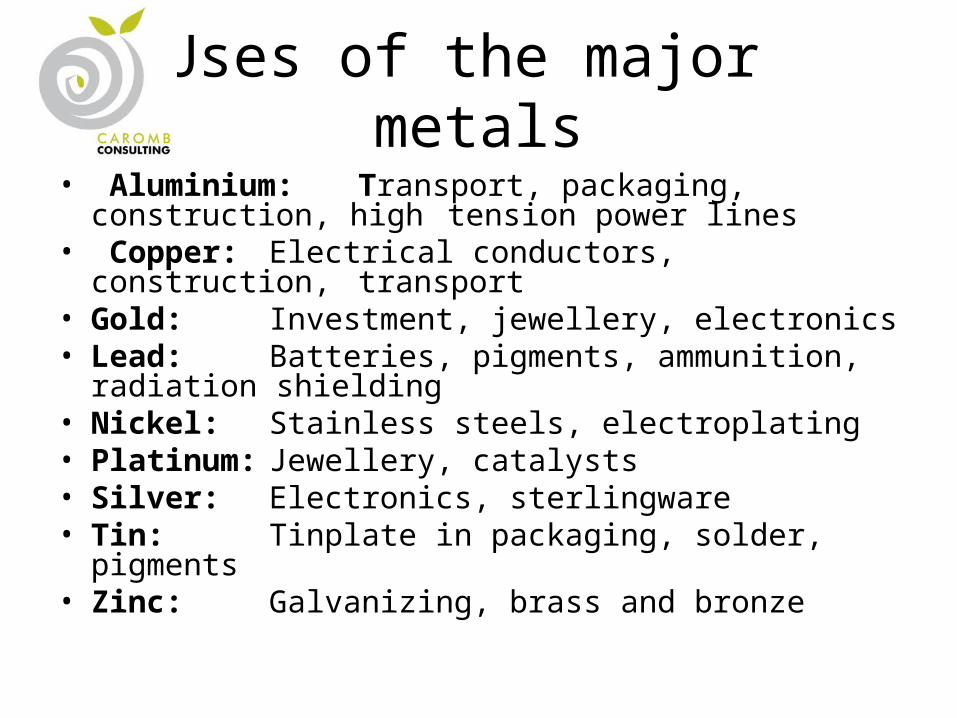
Uses of the major metals• Aluminium: Transport, packaging, construction, high
tension power lines• Copper: Electrical conductors, construction,
transport• Gold: Investment, jewellery, electronics• Lead: Batteries, pigments, ammunition,
radiation shielding• Nickel: Stainless steels, electroplating• Platinum: Jewellery, catalysts• Silver: Electronics, sterlingware• Tin: Tinplate in packaging, solder,
pigments• Zinc: Galvanizing, brass and bronze
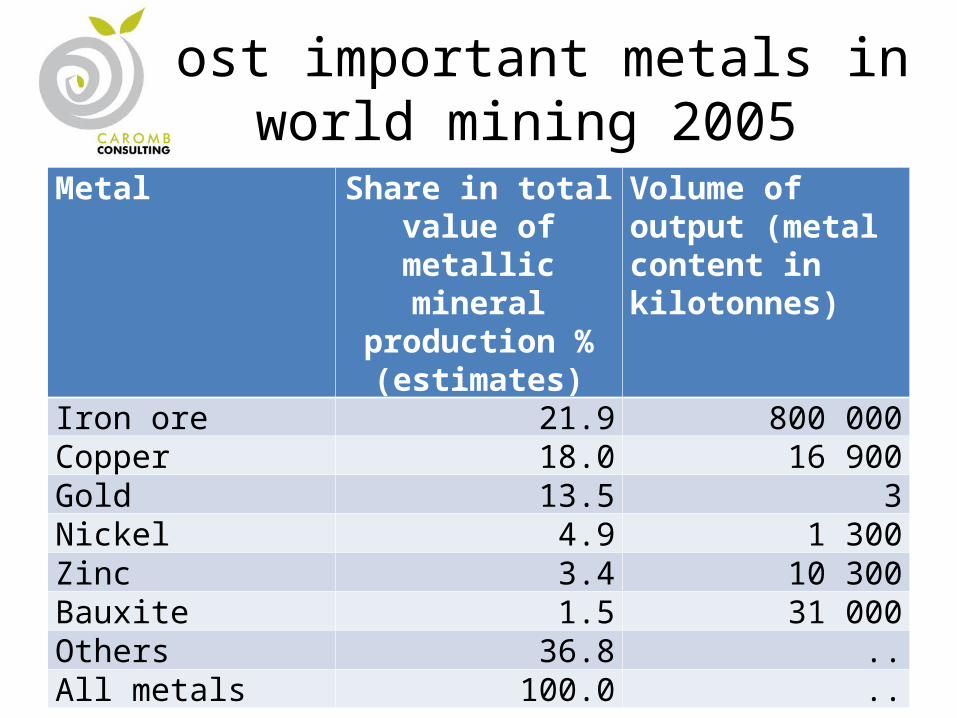
Most important metals in world mining 2005
Metal Share in total value of metallic mineral
production % (estimates)
Volume of output (metal content in kilotonnes)
Iron ore 21.9 800 000Copper 18.0 16 900Gold 13.5 3Nickel 4.9 1 300Zinc 3.4 10 300Bauxite 1.5 31 000Others 36.8 ..All metals 100.0 ..
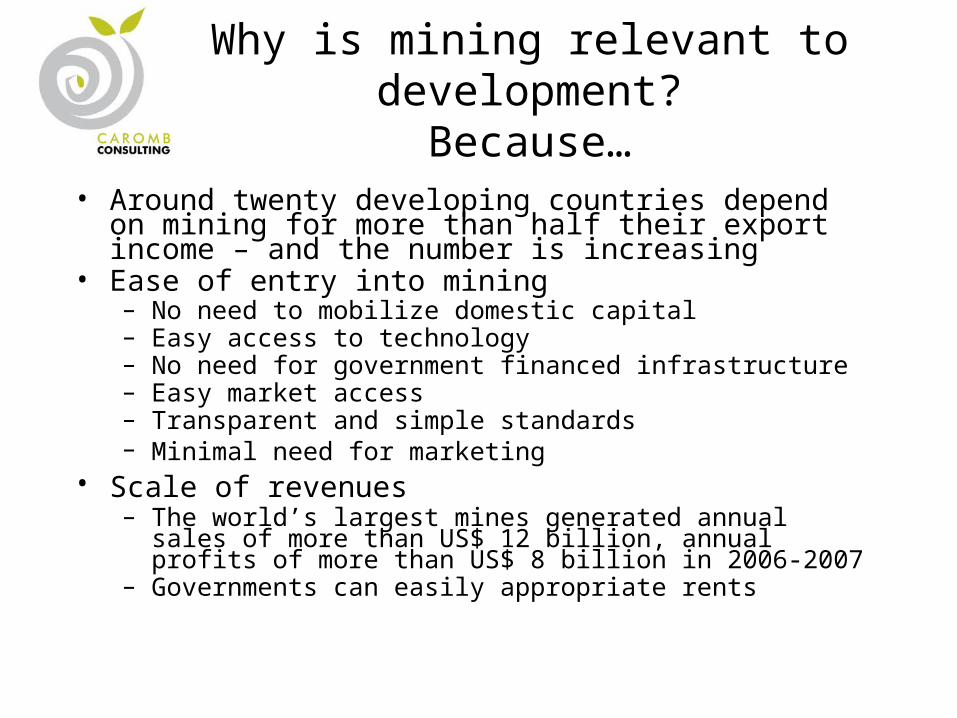
Why is mining relevant to development?Because…
• Around twenty developing countries depend on mining for more than half their export income – and the number is increasing
• Ease of entry into mining– No need to mobilize domestic capital– Easy access to technology– No need for government financed infrastructure– Easy market access– Transparent and simple standards– Minimal need for marketing
• Scale of revenues – The world’s largest mines generated annual sales of more than US$
12 billion, annual profits of more than US$ 8 billion in 2006-2007– Governments can easily appropriate rents
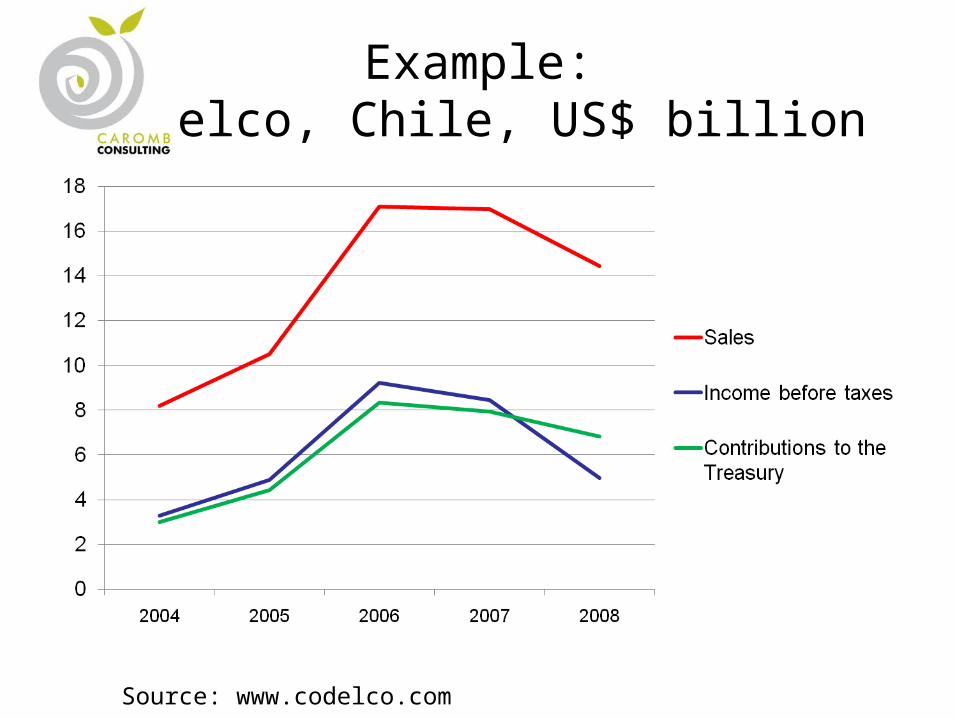
Example:Codelco, Chile, US$ billion
Source: www.codelco.com
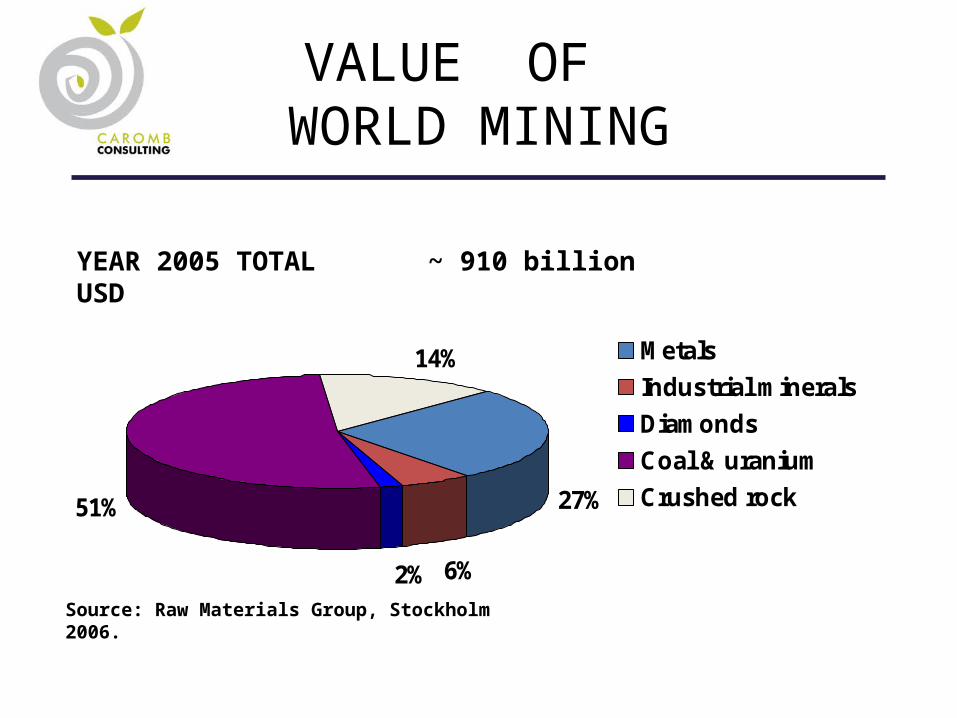
VALUE OF WORLD MINING
27%
6%2%
51%
14% Metals
Industrial minerals
Diamonds
Coal & uranium
Crushed rock
YEAR 2005 TOTAL ~ 910 billion USD
Source: Raw Materials Group, Stockholm 2006.
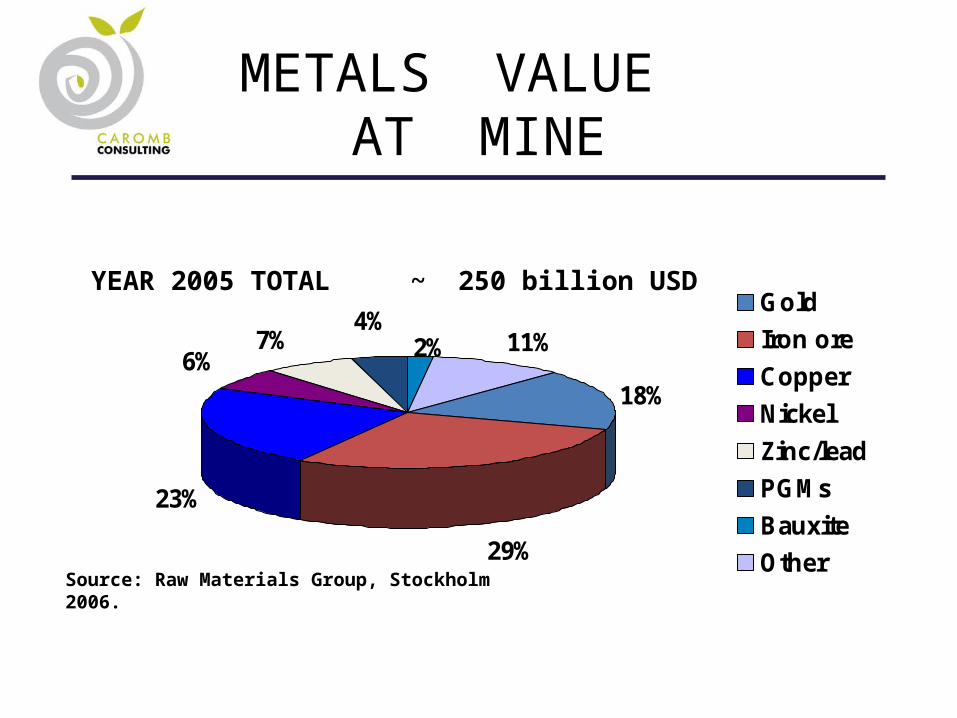
18%
29%
23%
11%6%
4%2%7%
Gold
Iron ore
Copper
Nickel
Zinc/lead
PGMs
Bauxite
Other
METALS VALUE AT MINE
YEAR 2005 TOTAL ~ 250 billion USD
Source: Raw Materials Group, Stockholm 2006.
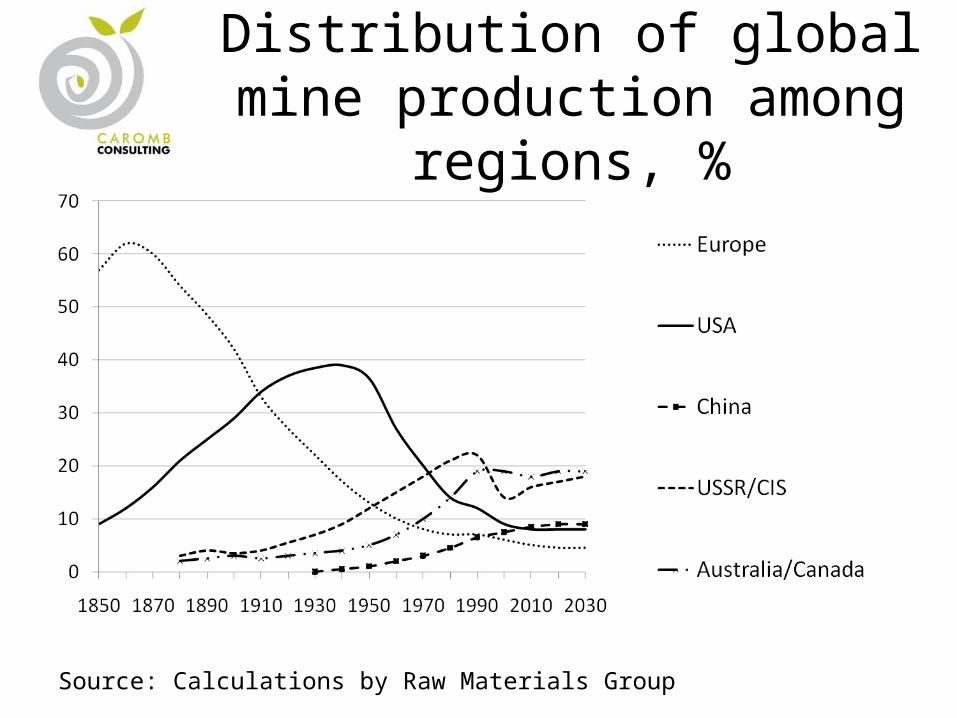
Distribution of global mine production among regions, %
Source: Calculations by Raw Materials Group
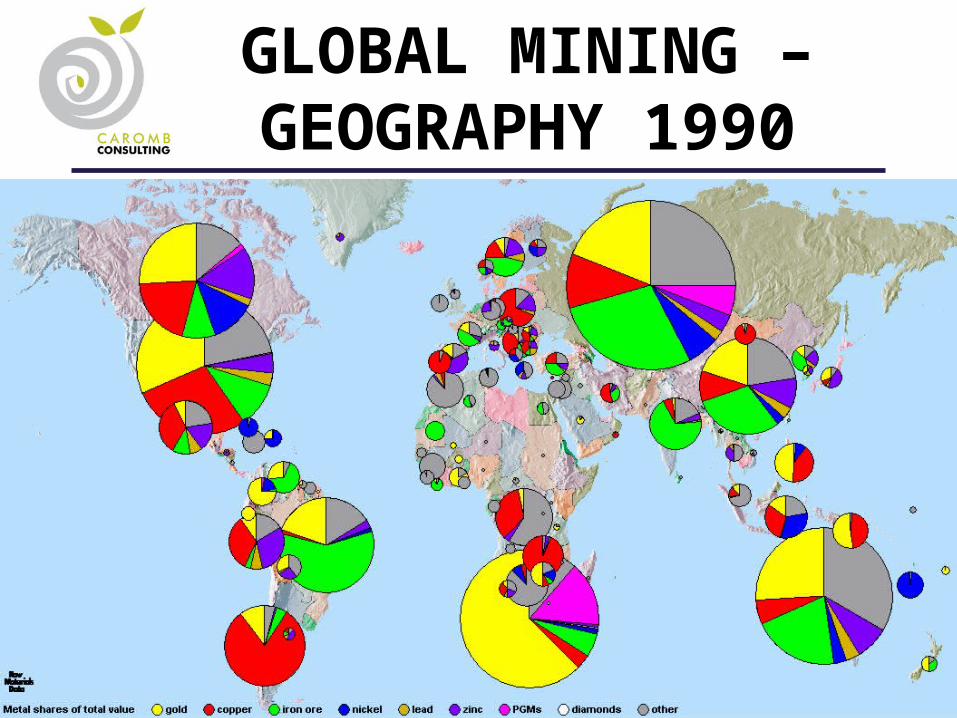
GLOBAL MINING – GEOGRAPHY 1990
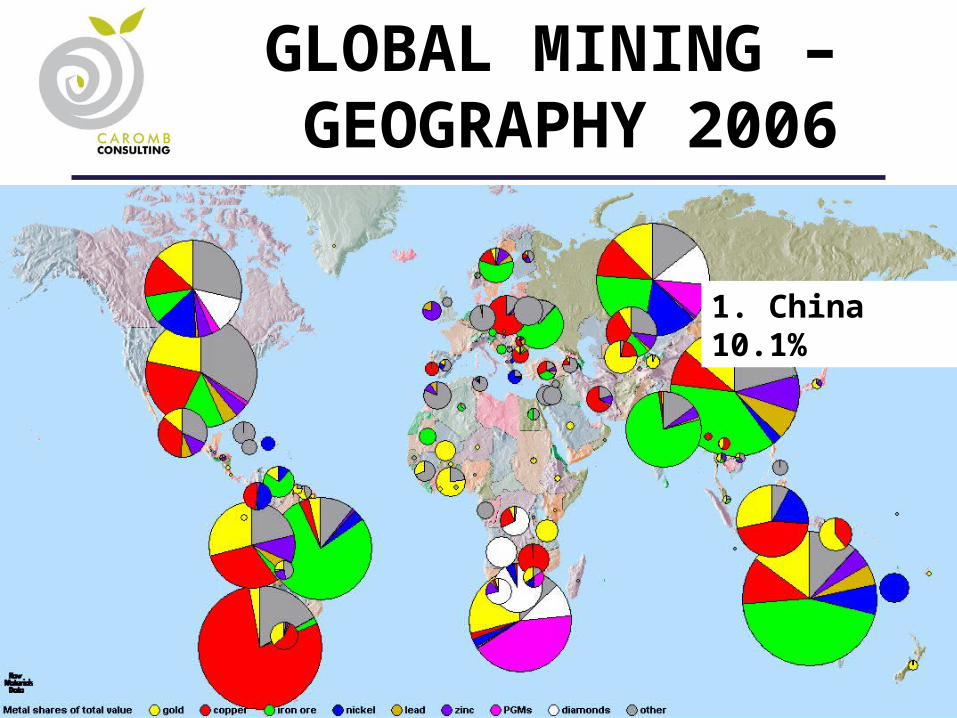
GLOBAL MINING – GEOGRAPHY 2006
1. China 10.1%
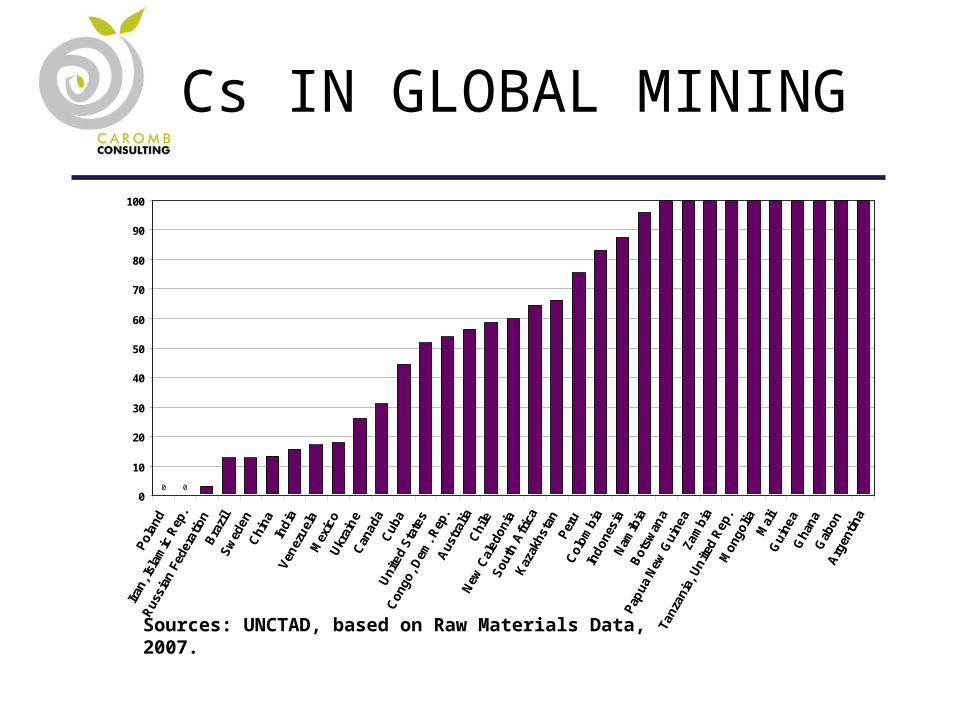
TNCs IN GLOBAL MINING
000
10
20
30
40
50
60
70
80
90
100
Pol
and
Iran
, Isl
amic
Rep
.
Rus
sian
Fed
erat
ion
Bra
zil
Sw
eden
Chi
naIn
dia
Ven
ezu
ela
Mex
ico
Ukr
ain
eC
anad
aC
uba
Uni
ted
Sta
tes
Con
go, D
em. R
ep.
Aus
tral
iaC
hile
New
Cal
edon
iaS
outh
Afr
ica
Kaz
akhs
tan
Per
uC
olom
bia
Ind
ones
iaN
amib
iaB
otsw
ana
Pap
ua N
ew G
uine
aZa
mbi
a
Tanz
ania
, Un
ited
Rep
.M
ongo
liaM
ali
Gui
nea
Gha
naG
abon
Arg
enti
na
Sources: UNCTAD, based on Raw Materials Data, 2007.
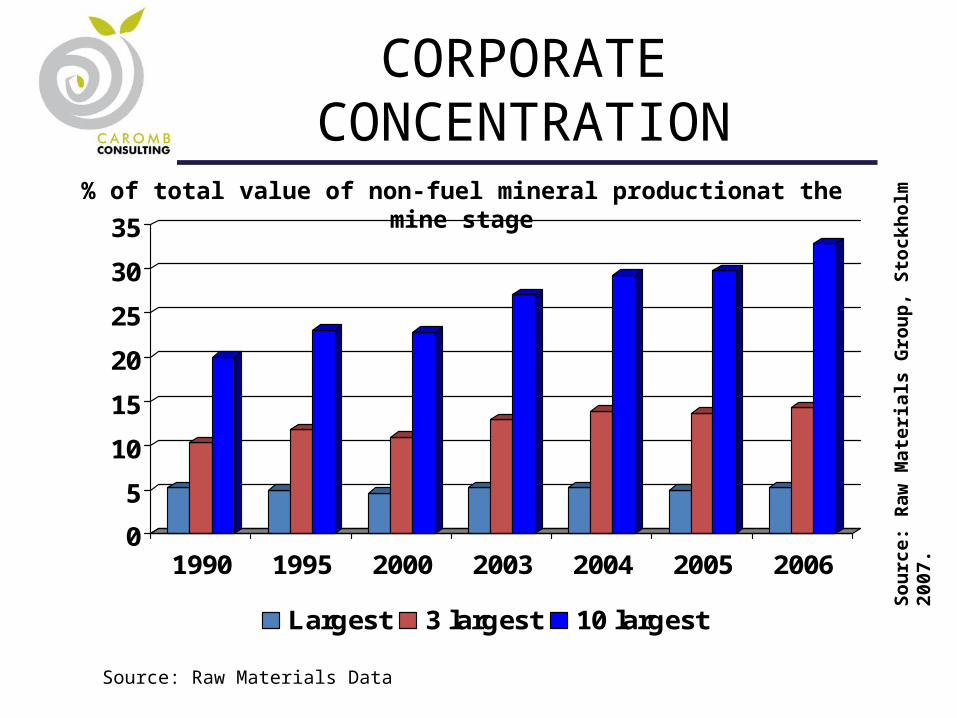
CORPORATE CONCENTRATION
0
5
10
15
20
25
30
35
1990 1995 2000 2003 2004 2005 2006
Largest 3 largest 10 largest
Sour
ce: R
aw M
ater
ials
Gro
up, S
tock
holm
200
7.
% of total value of non-fuel mineral productionat the mine stage
Source: Raw Materials Data
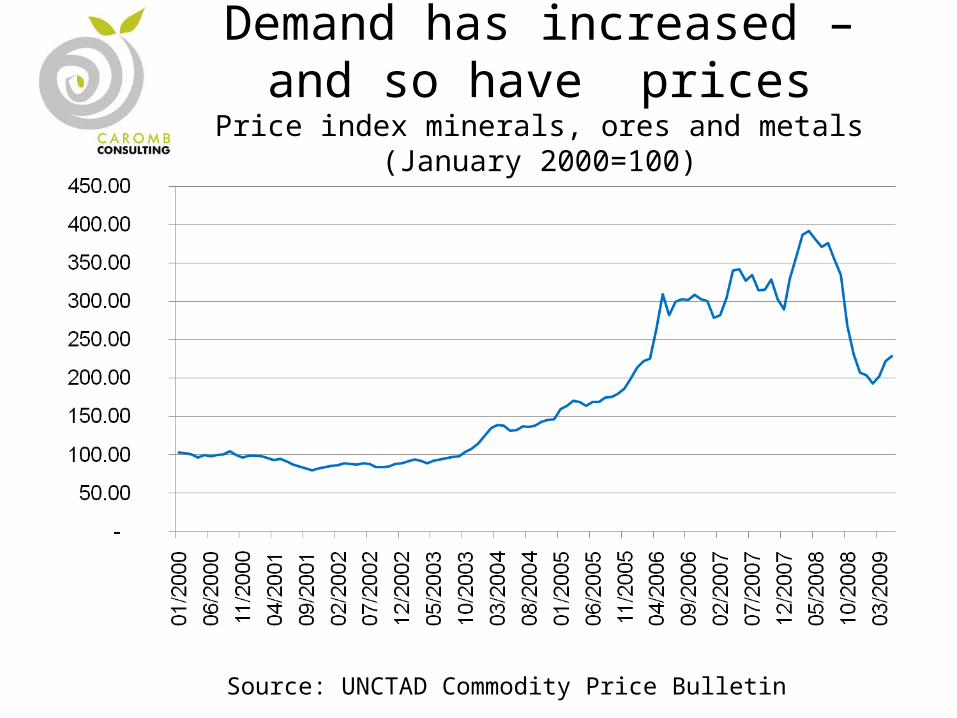
Demand has increased – and so have prices
Price index minerals, ores and metals (January 2000=100)
Source: UNCTAD Commodity Price Bulletin
Reasons• Asian minerals and metals demand has grown very rapidly
and Asian countries have accounted for almost all of the increase in demand over the past five years
• China is now the world’s largest steel producer, steel consumer, steel exporter and iron ore importer, the world’s third largest iron ore producer and the third largest steel importer
• Metals use per capita is still very low in countries such as China and India, but they are still at a stage where metals consumption relative to GDP is rising and large populations make them more than significant forces on the market
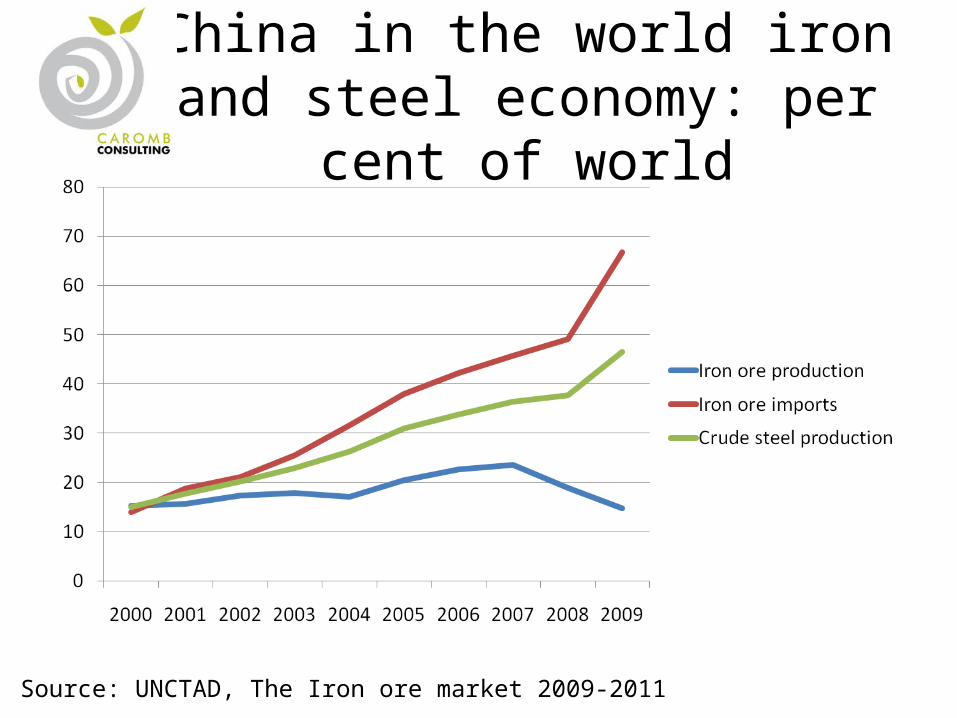
China in the world iron and steel economy: per cent of world
Source: UNCTAD, The Iron ore market 2009-2011
Outlook
• Demand will continue to be strongly linked to Asian growth and high rates of increase are expected
• Once the recovery from the recession is completed, capacity is expected to just keep up with growth in demand in the long term (next 8-10 years)
• A large share of output growth will take place in developing countries (Africa and Latin America), where there is now strong investor and exploration interest
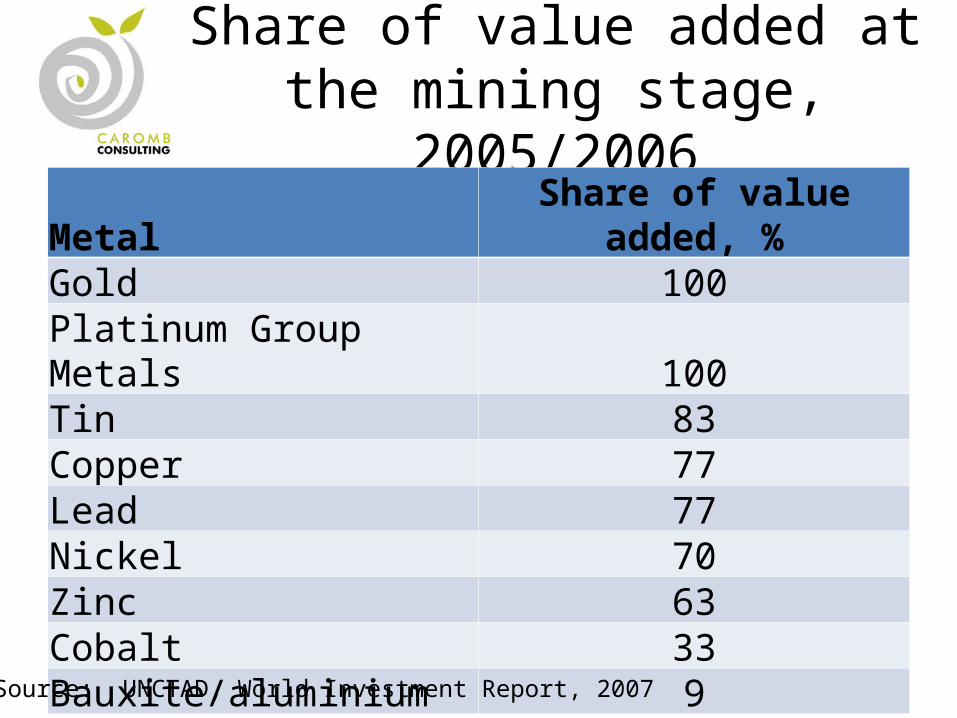
Share of value added at the mining stage, 2005/2006
Metal Share of value added, %Gold 100Platinum Group Metals 100Tin 83Copper 77Lead 77Nickel 70Zinc 63Cobalt 33Bauxite/aluminium 9
Source: UNCTAD, World Investment Report, 2007
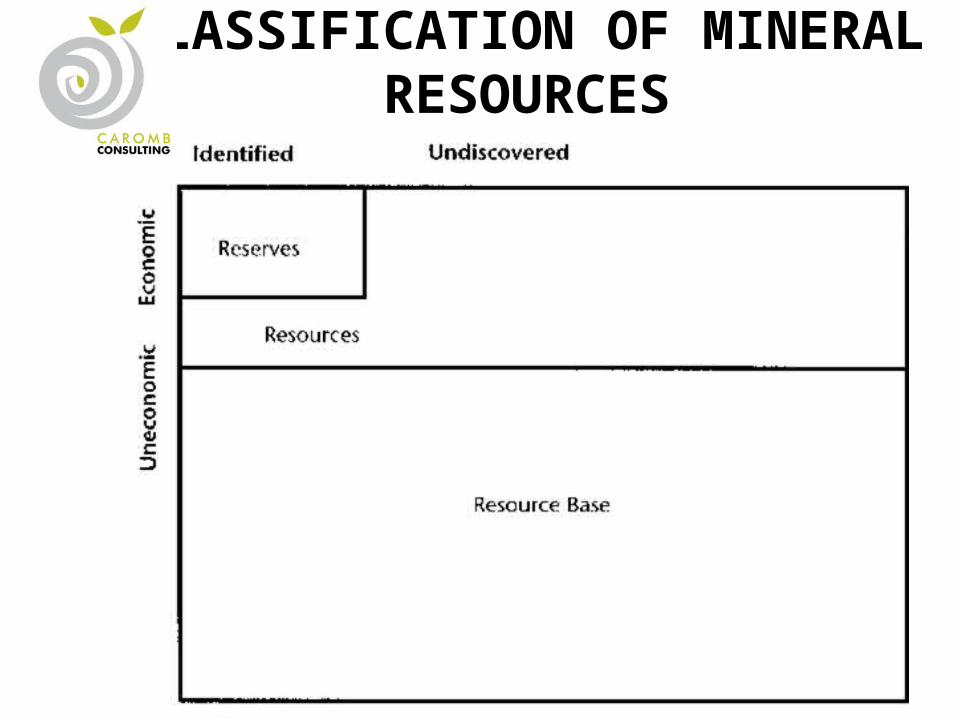
CLASSIFICATION OF MINERAL RESOURCES
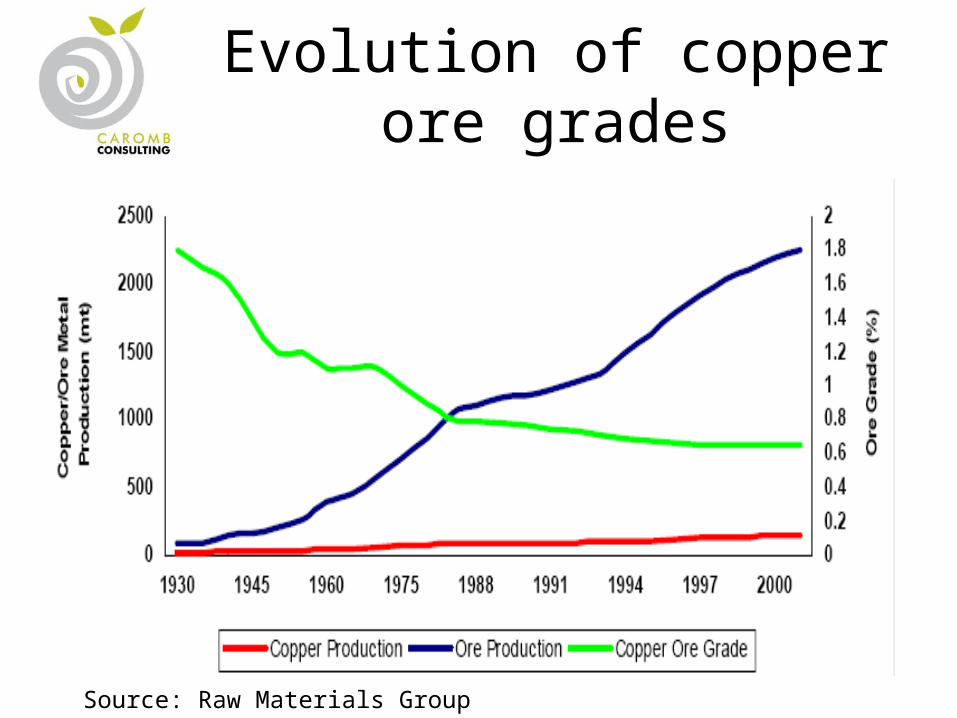
Evolution of copper ore grades
Source: Raw Materials Group
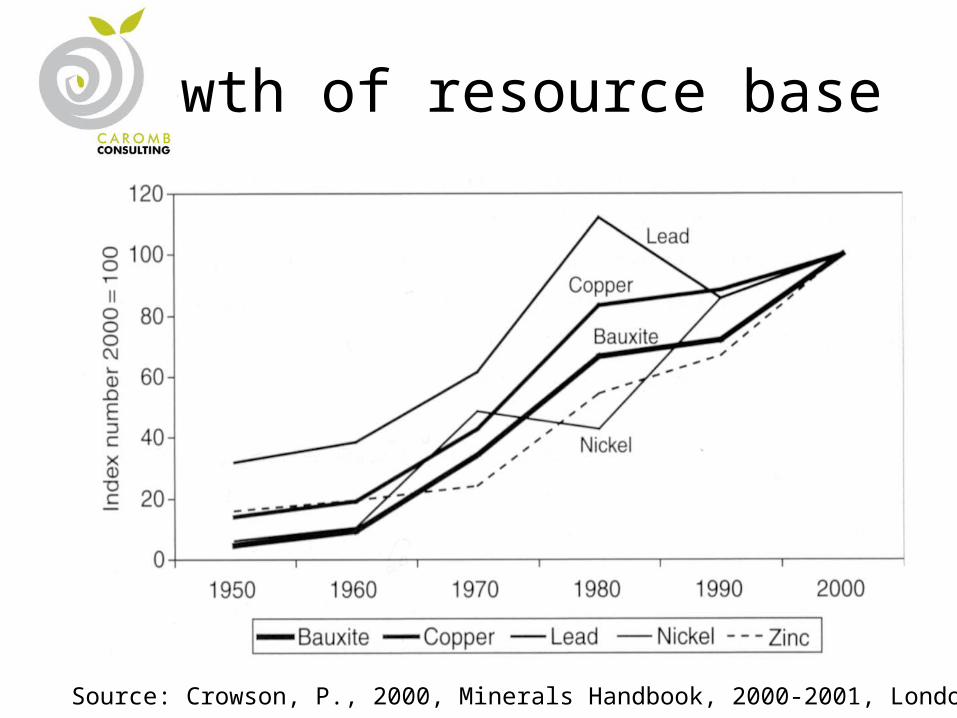
Growth of resource base
Source: Crowson, P., 2000, Minerals Handbook, 2000-2001, London
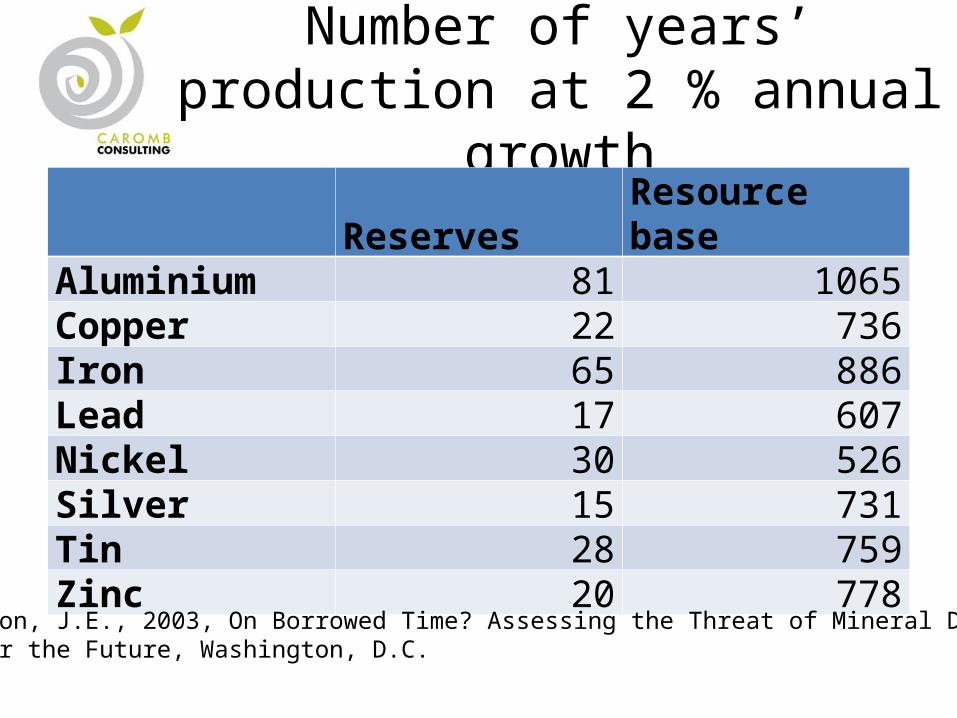
Number of years’ production at 2 % annual growth
Reserves Resource baseAluminium 81 1065Copper 22 736Iron 65 886Lead 17 607Nickel 30 526Silver 15 731Tin 28 759Zinc 20 778
Source: Tilton, J.E., 2003, On Borrowed Time? Assessing the Threat of Mineral Depletion, Resources for the Future, Washington, D.C.
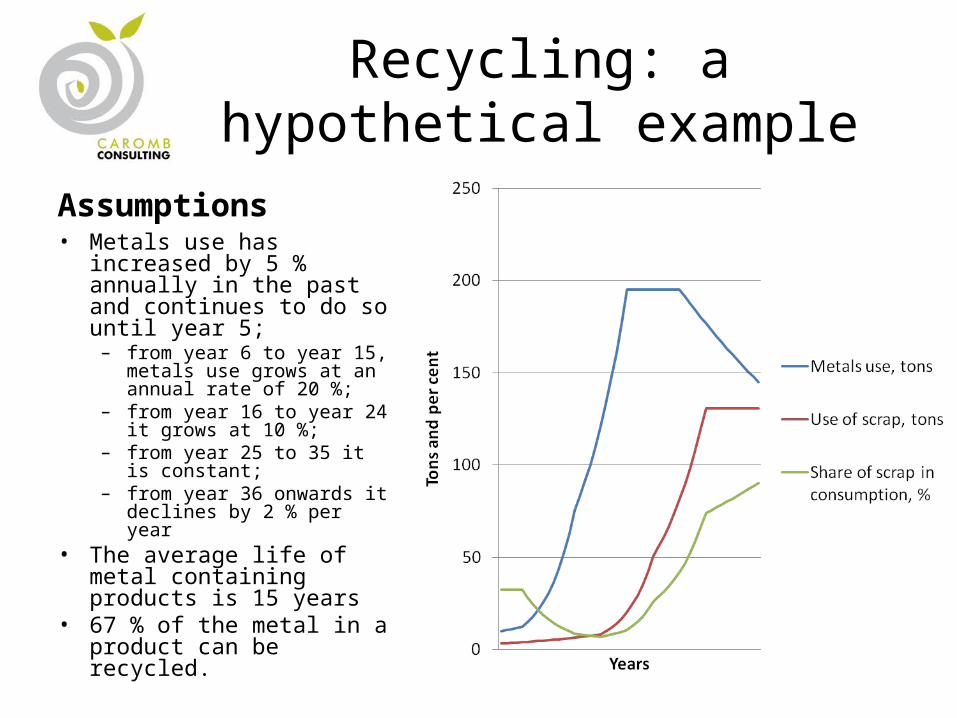
Recycling: a hypothetical example
Assumptions• Metals use has increased by
5 % annually in the past and continues to do so until year 5; – from year 6 to year 15,
metals use grows at an annual rate of 20 %;
– from year 16 to year 24 it grows at 10 %;
– from year 25 to 35 it is constant;
– from year 36 onwards it declines by 2 % per year
• The average life of metal containing products is 15 years
• 67 % of the metal in a product can be recycled.
Are mineral prices rising in the long term?
• Hotelling: Mineral prices should rise at the same annual rate as the rate of interest – if the price increase is lower, then more should be produced, if higher, resources should be left in the ground
• However, technology changes and new resources are discovered
• Over most of human history, real mineral prices have declined – technological progress has offset depletion
• Is the trend about to change?


