Misr J. Ag. Eng., January 2009 359 RHEOLOGICAL CONSTANTS OF THE FOUR ELEMENTS BURGERS MODEL FOR POTATO TUBERS AFFECTED BY VARIOUS FIXED LOADS UNDER DIFFERENT STORAGE CONDITIONS Abd El-Maksoud, M. A. * Gamea, G. R. * Abd El-Gawad, A. M. ** ABSTRACT The rheological constants of the four element Burgers model when potatoes (Diamont and Santana) were subjected to various fixed loads (stresses) on the main dimensions of the tubers were investigated .The rheological constants were K 1 (instantaneous elasticity ,N/mm)- K 2 (retarded elasticity ,N/mm)-C 1 (free viscous element ,N. min/mm and C 2 (retarded viscous element ,N. min/mm).The investigation was conducted for fresh and cured tubers as well as tubers under two different storage systems (trditional Nawalla at 16+ 3 o C ; 84% RH and Cold store at 4 o C ; 90% RH ). INTODUCTION otatoes are considering an agricultural biological material. Biological materials do not behave either as perfect elastic or perfect plastic materials. They exhibit both properties simultaneously. So, they are grouped under the definition of visco-elastic materials (Clevenger and Hamann, 1968-Mohsenin, 1970, Faborode and Callaphan ,1989.) In the same time, they show effects the dependent on time due to loading. The time dependent behavior of such viscoelastic materials may be described by constitutive equations whose variables are stress, deformation and time. These equations may be expressed by means of rheological models. Rheological models could describe and represent the behavior of biological materials. They help explain the stress, strain behavior of biological materials. The scope of the validity of such rheological models must be established by experiment. The most frequently applied quasistatic experimental methods, which can be utilized to determine viscoelastic properties of solid biological products like potatoes are creep and retardation and stress relaxation tests as well * Assoc. Prof. of Ag. Eng. Dep. Fac. Of Ag. Menoufiya U. ** Eng. of Ag. Eng. Res. Center P Misr J. Ag. Eng., 26(1): 359- 384 PROCESS ENGINEERING
Transcript
Misr J. Ag. Eng., January 2009
359
RHEOLOGICAL CONSTANTS OF THE FOUR ELEMENTS BURGERS MODEL FOR POTATO
TUBERS AFFECTED BY VARIOUS FIXED LOADS UNDER DIFFERENT STORAGE CONDITIONS
Abd El-Maksoud, M. A. * Gamea, G. R. * Abd El-Gawad, A. M. **
ABSTRACT The rheological constants of the four element Burgers model when potatoes (Diamont and Santana) were subjected to various fixed loads (stresses) on the main dimensions of the tubers were investigated .The rheological constants were K1(instantaneous elasticity ,N/mm)-K2(retarded elasticity ,N/mm)-C1(free viscous element ,N. min/mm and C2(retarded viscous element ,N. min/mm).The investigation was conducted for fresh and cured tubers as well as tubers under two different storage systems (trditional Nawalla at 16+3oC ; 84% RH and Cold store at 4oC ; 90% RH ).
INTODUCTION otatoes are considering an agricultural biological material. Biological materials do not behave either as perfect elastic or perfect plastic materials. They exhibit both properties
simultaneously. So, they are grouped under the definition of visco-elastic materials (Clevenger and Hamann, 1968-Mohsenin, 1970, Faborode and Callaphan ,1989.) In the same time, they show effects the dependent on time due to loading. The time dependent behavior of such viscoelastic materials may be described by constitutive equations whose variables are stress, deformation and time. These equations may be expressed by means of rheological models. Rheological models could describe and represent the behavior of biological materials. They help explain the stress, strain behavior of biological materials. The scope of the validity of such rheological models must be established by experiment. The most frequently applied quasistatic experimental methods, which can be utilized to determine viscoelastic properties of solid biological products like potatoes are creep and retardation and stress relaxation tests as well * Assoc. Prof. of Ag. Eng. Dep. Fac. Of Ag. Menoufiya U. ** Eng. of Ag. Eng. Res. Center
P
Misr J. Ag. Eng., 26(1): 359- 384 PROCESS ENGINEERING
Misr J. Ag. Eng., January 2009
360
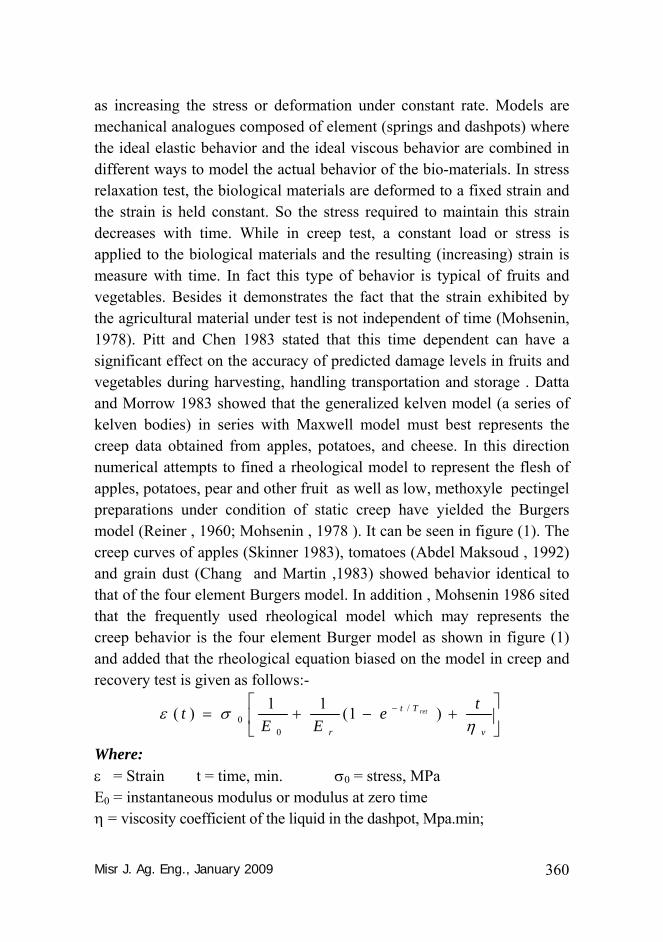
as increasing the stress or deformation under constant rate. Models are mechanical analogues composed of element (springs and dashpots) where the ideal elastic behavior and the ideal viscous behavior are combined in different ways to model the actual behavior of the bio-materials. In stress relaxation test, the biological materials are deformed to a fixed strain and the strain is held constant. So the stress required to maintain this strain decreases with time. While in creep test, a constant load or stress is applied to the biological materials and the resulting (increasing) strain is measure with time. In fact this type of behavior is typical of fruits and vegetables. Besides it demonstrates the fact that the strain exhibited by the agricultural material under test is not independent of time (Mohsenin, 1978). Pitt and Chen 1983 stated that this time dependent can have a significant effect on the accuracy of predicted damage levels in fruits and vegetables during harvesting, handling transportation and storage . Datta and Morrow 1983 showed that the generalized kelven model (a series of kelven bodies) in series with Maxwell model must best represents the creep data obtained from apples, potatoes, and cheese. In this direction numerical attempts to fined a rheological model to represent the flesh of apples, potatoes, pear and other fruit as well as low, methoxyle pectingel preparations under condition of static creep have yielded the Burgers model (Reiner , 1960; Mohsenin , 1978 ). It can be seen in figure (1). The creep curves of apples (Skinner 1983), tomatoes (Abdel Maksoud , 1992) and grain dust (Chang and Martin ,1983) showed behavior identical to that of the four element Burgers model. In addition , Mohsenin 1986 sited that the frequently used rheological model which may represents the creep behavior is the four element Burger model as shown in figure (1) and added that the rheological equation biased on the model in creep and recovery test is given as follows:-
⎥⎦
⎤⎢⎣
⎡+−+= −
v
Tt
r
teEE
t ret
ησε )1(11)( /
00
Where: ε = Strain t = time, min. σ0 = stress, MPa E0 = instantaneous modulus or modulus at zero time η = viscosity coefficient of the liquid in the dashpot, Mpa.min;
Misr J. Ag. Eng., January 2009
361
Load Removed
σ0/E0
σ0/Er
σ0 t/ηv
Time, minutes t
σ0/E0
ηv = Viscosity, Mpa.min and Tret = η/ Er The time of relaxation. This equation is based on the model consists of a Kelven model connected in series to a spring and a dashpot element. The model may thus be divided into three parts A, B and C as shown in figure (1)
Figure (1): 4-element model (Burgers model)
In the same time figure (2) shows the behavior of the four elements Burgers model.
Figure (2): Typical creep and recovery curve in a viscoelastic material exhibiting instantaneous elasticity, retarded elasticity and viscous flow.
Stra
in –
ε
σ 0/E
r
Er
ηv
σ0
E0
η
Misr J. Ag. Eng., January 2009
362
When the stress σ0 is removed at time t = t1 , the elastic component of deformation ceases instantly, while the creep deformation decreases with
time and tends asymptotically to the value σ0 / E0 and the recovery of strain during period t>t1 will be
( ) .11
0 rr Tt
Tt
r
eeE
t−
⎟⎟
⎠
⎞
⎜⎜
⎝
⎛−⎟⎟
⎠
⎞⎜⎜⎝
⎛=
σε
As shown in figure (2) the elements of the model may be determined from
the loading – unloading curve, using the values of the intercepts of the
vertical axis, the deformation at t=0 , ( ) ⎟⎟⎠
⎞⎜⎜⎝
⎛=
0
00Eσ
ε and the
deformation rate at t= ( )νη
σε 0, =∞∞ .
Mohsenin 1986 illustrated a typical curve for creep and recovery test of
Mackintosh apple as a relationship between deformation in inches and
time in minuets as shown in figure (3).
Figure (3): Distortion of McIntosh apple under dead load of 21 lbs
determined by axial creep and recovery test with ¼ inch rigid plunger.
Def
orm
atio
n(in
ch)
Misr J. Ag. Eng., January 2009
363
Similarly, Abd el Maksoud , 1992 and Sabbah et al.1994 used the four element Burgers model and the following equation as illustrated in figure (4) to determine the rheological constants of the model (K1, K2, C1, C2) and their relations with fruit (tomatoes ) parameters . They also reported results for predicting the fruit behavior under the effect of a static loading for a certain time in creep tests.
C2 = retarded viscous element, N.min/mm; and Tret = C2/ K2 The time of retardation.
Figure.(4): 4-element model (Burgers model) where deformations are additive while the force is the same in all the three units A, B, and C.
K1
K2 C2
C1
F0
Misr J. Ag. Eng., January 2009
364
Sabbah et al., 1994 reported that the deformation increases with increasing of loading level and stage of maturity .Generally, it was inversely proportional with fruit size under the same loading .Meanwhile ,they observed considerable variations throughout creep tests on individual fruits due to the non homogenous nature of tomatoes and the stress concentration set up by its irregular shape surface. Knowledge of the rheological model constants by creep test experiments helps in describing the behavior of the biological material under the static load applied. These are essential for the designer of harvesting and handling equipment to estimate and even predict the amount of material damaged an applied load or deformation. The specific objectives addressed by this investigation are: 1- Using the creep and recovery test to determine the viscoelastic properties of potato tubers
through the constants of the rheological Burgers model. 2- Studying the effect of the storage time under two different storage
systems and temperatures, potato tubers weight, the constant static load applied to tubers (constant stress) and the position of the effected load on the rheological constants of the model.
MATERIAL AND METHODS
180 for creep and recovery test experiments including, three load levels (10, 14 and 18N) two storage systems ( Nawalla at 16+3oC ; 84% RH and Cold store at 4oC ; 90% RH ), three loading positions ( L – longitudinal , D – radial and T – minimum axis ) and two potato verities ( Diamont and Santana ) where each treatment was replicated three times for fresh, cured and stored 25,50 and 75 days were conducted to study the rheological properties of potatoes during the mentioned stages. The procedure to conduct the creep test was run by using the creep test device. It was constructed specifically according to the creep test device used by (Abdel – Maksoud, 1992 and Sabah et al, 1994) as shown in figure (5). Experiments were run by placing the potato tuber between two parallel plates. The tuber was placed on the base of the apparatus in the considered position while, the crosshead was gust touching its surface at zero loading condition. The tuber was then loaded by the concerned fixed load. The instantaneous deformation with time was indicated by the dial micrometer and then recorded as illustrated in table (1). The total time of
Misr J. Ag. Eng., January 2009
365
y = 1.0215xR2 = 0.9995
0300
600900
1200
15001800
210024002700
30003300
0 300 600 900 1200 1500 1800 2100 2400
2700
3000
3300Affected load, g
Nom
inal
load
, g
every test was one hour. It divided into 30 minutes loading period and 30 minutes unloading period (retardation). The creep apparatus (Figure (5)) was calibrated before starting creep tests
and the calibration curve is as shown in figure (6).
Figure (5): Creep test apparatus photos: A) L = Longitudinal position.
B) D = Radial position. C) T = Minimum axis position. The obtained data from tests of this investigation were used for plotting creep curves for calculating the constants of the rheological Burgers model ( K1 , K2 , C1 , C2 ) as shown in figure (7) for potato tubers
CBA
Figure (6): Calibration curve of creep test apparatuses.
Misr J. Ag. Eng., January 2009
366
.Constants of the model were calculated by using the plotted curves and the following equation of the model,
⎥⎦
⎤⎢⎣
⎡+−+= −
1
/
210 )1(11)(
Cte
KKFtd retTt
Where:
d (t) = Deformation at any time t; mm;
F0 = Constant force, N ;
K1 = Instantaneous elasticity, N/mm;
K2 = Retarded elasticity, N/mm;
C1 = Free viscous element, N.min/mm;
C2 = Retarded viscous element, N.min/mm; and
Tret = C2/ K2 The time of retardation The method of estimating the rheological constants of Burgers model and its behavior is as shown in the following creep and recovery curve (fig. 7)
Fig. (7): Typical creep and recovery curve in a viscoelastic material
exhibiting instantaneous elasticity, retarded elasticity and viscous flow.
As shown in the figure an instantaneous deformation will happen in the spring (1) due to the instantaneous fixed load F0 and has the value F0/K1.
F0/K1
F 0/K
2
Def
orm
atio
n, m
m
F0/K2 F0/K1
F0 t/C1
Time, minutes
Load Removed
Misr J. Ag. Eng., January 2009
367
Knowing F0 the value of K1 can be calculated as K1= F0/d1. After the initial deformation, creep continues at a higher rate but gradually slows down due to the viscous effect attained by the dashpot C1. The value of C1 can be calculated by substituting the creep duration and the constant load in the flow
the loading portion of the curve.
The time of retardation can be estimated from the equation of Burgers
model as follows
Let M = F0/K2 ⎟⎟⎠
⎞⎜⎜⎝
⎛−
−Tret
t
eKF 1.
2
0 , and N = F0/K2.
⎟⎟⎠
⎞⎜⎜⎝
⎛−=
−Tret
t
e1.N MThen / N
M/N = ⎟⎟⎠
⎞⎜⎜⎝
⎛−
−Tret
t
e1. Then (1- M/N) = ⎟⎟⎠
⎞⎜⎜⎝
⎛ −Tret
t
e.
Ln (1-M/N) = Trett−
Then for various values of M at various times values of (t), the resulted
slope of the obtained linear regression will equal 1/(Tret) = -K2 /C1.
Knowing K2 then C1 can be calculated.
RESULTS AND DISCUSSIONS 180 Potato creep experiments with three replicates for each test were conducted in this investigation. Experiments included two potato varieties (Daimont and Santana), three separated static loads (10, 14 and 18 N), three loading position on potato tuber (L - longitudinal, D – radial and T – minimum axis) and two different storage system (Nawalla 16 + 3oC – 84% RH and cold store 4oC – 90% RH) .All experiments were achieved for fresh, cured and stored at 25, 50 and 75 days potato tubers. Figure (8) illustrates typical creep and retardation test curves for fresh Santana
.The retarded elasticity K2 can be evaluated from F0/K2 taken from
11
0.C
tF parameter
Misr J. Ag. Eng., January 2009
368
potato tubers variety due to the effect of a static load (fixed stress) of 10N. The static load continued affecting the whole tuber for 30 minuets and then recovered where, the test continued for 30 minuets without loading. The curves shown in the figure demonstrate the deformation behavior of the samples due to the static load and after the load was removed with time for every tuber sample position. It is cleared from the typical creep and recovery test curve that the deformation decreases as a function of time. The mean creep data obtained from tests were analyzed by the rheological Burgers model to determine model constants (K1 – instantaneous elasticity, N/mm); (K2 – retarded elasticity, N/mm); (C1 – free viscous element, N.min/mm) and (C2 – retarded viscous element, N.min/mm).as following :
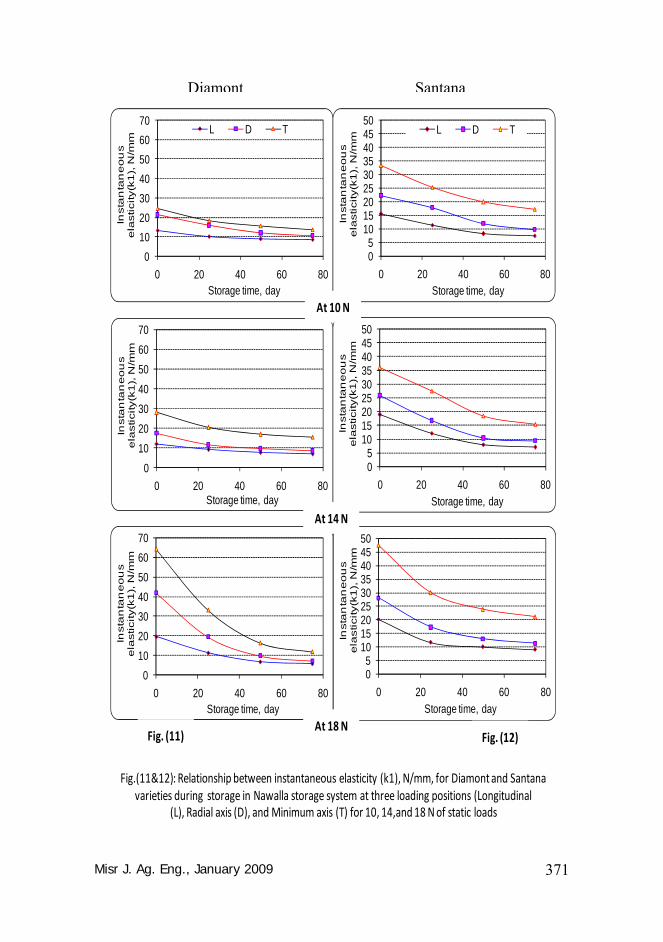
N/mm ) – 1(Kty Instantaneous elastici -1 The instantaneous elasticity (K1) versus time expressed by its beginning for fresh tubers curing time "after 15 days" and storage time is demonstrated in figures 9, 10, 11 and 12. It is cleared from the figures that the instantaneous elasticity K1 decreased with time especially, during curing and at the first 25 days of the storage period where the rate of
Fig. (8); typical curve of creep retardation test for fresh potato Santana variety at 10 N under room temperature.
Misr J. Ag. Eng., January 2009
369
decrement decreased until the end of storage period. This can be explained by the instantaneous deformation of the tuber when subjected to a certain constant load on the specific orientation increased with time especially storage time under the two storage systems. This led to a significant reduction in K1. The exerted reduction was slightly higher under Nawalla storage system (16 + 3oC, 84% RH) than in Cold storage system (4 oC, 90% RH). As shown in the figures, differences were found in the values of K1 when the orientations of load on the sample were considered where the narrow dimension of tuber has the bigger mean values of K1. Also, the fresh potatoes exhibited a straight line relationship, whereas the stored ones showed a curvilinear relationship. Another observation was that K1 increased slightly in its magnitude with increasing the static load. Multiple regression equations were determined to describe the relationship between the instantaneous elasticity (K1), N/mm and (ST), days; loading (F0), N; loading position index (Pi) where L=1, D=2 and T=3 and potato weight (W),g. The regression analyses were conducted for the two varieties in two storage system (Cold store- 4oC and 90% RH and Nawalla store -16 + 3oC and 84% RH.). The regression equations were as follows: a- Cold storage system:
b- Nawalla storage system:
Diamont K1 = 5.97 Pi - 0.23 ST + 0.43 Fo + 0.14 W +30.3 R2 = 0.78
Santana K1 = 8.39 Pi - 0.2 ST + 0.55 Fo + 0.1 W – 9.86 R2 = 0.88
It is observed from the linear regression equations that a negative relationship was occurred between K1 and storage time where the other factors affected positively with a satisfying values of (R2).An example form the resulted mean values of K1 were cleared that the decreasing rate of K1 for Santana variety tubers under the constant load of 10N on L position was 24.59% from harvesting to the end of 15 days curing period.
Diamont K1 = 7.15 Pi - 0.15 ST + 0.17 Fo + 0.2 W + 42.93 R2 = 0.82
Santana K1 = 8.27 Pi - 0.15 ST + 0.15 Fo + 0.03 W + 7.68 R2 = 0.86
Misr J. Ag. Eng., January 2009
370
05
101520253035404550
0 20 40 60 80
Insta
nta
ne
ou
s
ela
sticity(k
1),
N/m
m
Storage time, day
L D T
05
101520253035404550
0 20 40 60 80
Insta
nta
ne
ou
s e
lasticity
(k1
), N
/mm
Storage time, day
05
101520253035404550
0 20 40 60 80
Insta
nta
ne
ou
s
ela
sticity(k
1),
N/m
m
Storage time, day
05
10152025303540
0 20 40 60 80
Insta
nta
ne
ou
s e
lasticity
(k1
), N
/mm
Storage time, day
L D T
05
10152025303540
0 20 40 60 80
Insta
nta
ne
ou
s
ela
sticity(k
1),
N/m
m
Storage time, day
05
10152025303540
0 20 40 60 80
Insta
nta
ne
ou
s
ela
sticity(k
1),
N/m
m
Storage time, day
At 10 N
At 14 N
At 18 NFig. (9) Fig. (10)
Fig.(9&10 ): Relationship between instantaneous elasticity (k1), N/mm, for Diamont and Santana varieties during storage in Cold storage system at three loading positions (Longitudinal (L), Radial
axis (D), and Minimum axis (T) for 10, 14,and 18 N of static loads
Diamont Santana
Misr J. Ag. Eng., January 2009
371
010203040506070
0 20 40 60 80
Inst
an
tan
eo
us
ela
stic
ity(k
1),
N/m
m
Storage time, day
L D T
010203040506070
0 20 40 60 80
Inst
an
tan
eo
us
ela
stic
ity(k
1),
N/m
m
Storage time, day
010203040506070
0 20 40 60 80
Inst
an
tan
eo
us
ela
stic
ity(k
1),
N/m
m
Storage time, day
05
101520253035404550
0 20 40 60 80
Inst
an
tan
eo
us
ela
stic
ity(k
1),
N/m
m
Storage time, day
L D T
05
101520253035404550
0 20 40 60 80
Inst
an
tan
eo
us
ela
stic
ity(k
1),
N/m
m
Storage time, day
05
101520253035404550
0 20 40 60 80
Inst
an
tan
eo
us
ela
stic
ity(k
1),
N/m
m
Storage time, day
At 10 N
At 14 N
At 18 NFig. (11) Fig. (12)
Fig.(11&12): Relationship between instantaneous elasticity (k1), N/mm, for Diamont and Santana varieties during storage in Nawalla storage system at three loading positions (Longitudinal
(L), Radial axis (D), and Minimum axis (T) for 10, 14,and 18 N of static loads
Diamont Santana
Misr J. Ag. Eng., January 2009
372
In the same time, the total decreasing rate reached the magnitude of 41.9 % and 68.35% when tubers stored in Cold and Nawalla system respectively. The collected data and represented the mean values of K1 in the same conditions showed that the decreasing rate of K1 for Diamont variety tubers was 23.48% from harvesting till the tubers cured .Mean while, the total decreasing rate reached the values of 47.15 and 60.47 when tubers stored in Cold and Nawalla storage systems respectively. The demonstrated example shows progressively decreasing trends for the rheological parameter K1 with storage time for all varieties and at the two storage systems. 2-Retarded elasticity (K2 ), N/mm The results of the mean values of the retarded elasticity (K2) are presented in the figure 13 to 16. The results show that its magnitude decreases with increasing storage time in Nawalla and Cold storage systems for the two varieties. It is observed also that a significant reduction was happened in Nawalla storage system than in the Cold system where the storage temperature was higher. Another observation was noticed that the higher the values of the static load used the greater the values of the retarded elasticity even on the load positions of the tuber. Multiple linear regression equations were delivered to describe this significance between the storage time (ST), days – static load (Fo), N – loading position index (Pi), L=1, D=2 and T=3 – and potato weight (W). g and the retarded elasticity (K2), N. mm for the two varieties of tubers in the two different storage systems as follows: a- Cold storage system:
b- Nawalla storage system:
Diamont variety K2 = 13.3 Pi - 0.34 ST + 0.31 Fo + 0.08 W + 8.9 R2 = 0.84
Santana variety K2 = 13.7 Pi – 0.33 ST + 2.9 Fo + 0.25 W – 48.9 R2 = 0.90
Diamont variety
K2 = 14 Pi - 0.48 ST + 0.86 Fo + 0.2 W + 47.5 R2 = 0.92
Santana variety
K2 = 13 Pi – 0.46 ST + 0.95 Fo + 0.26 W + 51.2 R2 = 0.81
Misr J. Ag. Eng., January 2009
373
01020304050607080
0 20 40 60 80
Re
tard
ed
e
lasticity(K
2),
N/m
m
Storage time, day
L D T
01020304050607080
0 20 40 60 80
Re
tard
ed
e
lasticity(K
2),
N/m
m
Storage time, day
01020304050607080
0 20 40 60 80
Re
tard
ed
e
lasticity(K
2),
N/m
m
Storage time, day
L D T
0
20
40
60
80
100
120
0 20 40 60 80
Re
tard
ed
e
lasticity(K
2),
N/m
m
Storage time, day
L D T
0
20
40
60
80
100
120
0 20 40 60 80
Re
tard
ed
e
lasticity(K
2),
N/m
m
Storage time, day
0
20
40
60
80
100
120
0 20 40 60 80
Re
tard
ed
ela
sticity
(K2
), N
/mm
Storage time, day
At 10 N
At 14N
At 18 NFig. (13) Fig. (14)
Figures: (13&14) : Relationship between retarded elasticity (K2), N/mm, forDiamon and Santana t varieties during storage in cold storage system at three loading positions (Longitudinal (L), Radial
axis (D), and Minimum axis (T) for 10, 14,and 18 N of static loads
Diamont Santana
Misr J. Ag. Eng., January 2009
374
0102030405060708090
0 20 40 60 80
Re
tard
ed
e
last
icity
(K2
), N
/mm
Storage time, day
L D T
0102030405060708090
0 20 40 60 80
Re
tard
ed
e
last
icity
(K2
), N
/mm
Storage time, day
0102030405060708090
0 20 40 60 80
Re
tard
ed
e
last
icity(
K2
), N
/mm
Storage time, day
0
20
40
60
80
100
120
0 20 40 60 80
Re
tard
ed
e
last
icity(
K2
), N
/mm
Storage time, day
L D T
0
20
40
60
80
100
120
0 20 40 60 80
Re
tard
ed
e
last
icity(
K2
), N
/mm
Storage time, day
0
20
40
60
80
100
120
0 20 40 60 80
Re
tard
ed
e
last
icity
(K2
), N
/mm
Storage time, day
At 10 N
At 14 N
At 18 NFig. (15) Fig. (16)
Figures: (15&16) : Relationship between Retarded elasticity (K2), N/mm, for Diamon and Santana varieties during storage in Nawalla storage system at three loading positions (Longitudinal
(L), Radial axis (D), and Minimum axis (T) for 10, 14,and 18 N of static loads
Diamont Santana
Misr J. Ag. Eng., January 2009
375
The equations clarified that the storage time was inversely proportional with storage time, while the other parameters had nearly a positive effect on the retarded elasticity (K2). The behavior of the rheological constant (K2) when tubers were subjected to a constant load 10N on L position appeared a reduction in its magnitude. The values of (K2) decreased with respect to Santana and Diamont varieties by 13.72; % from harvesting to the end of the 15 days curing period. While, it decreased by (52; 599%) and ( ;%) as a total decrement till the end of storage time under the two storage conditions (Cold and Nawalla storage systems). It is apparent from the analyzed experimental data that the magnitude of K2 decreased during storage significantly as well as with the temperature of the storage condition. This can be noticed from the higher values of change percentage under storage tubers in Nawalla than Cold storage. 3-Free viscous element (C1) N.min/mm. Figures 17 – 20 illustrate the graphs of the mean values of C1 v.s. storage time for Diamont and Santana varieties under the conditions of storage in both Nawalla and Cold storage systems. Each figure shows both the effect of the static fixed load and the position of its effect on the tuber .The graphs show that the free viscous element (C1) decreases by increasing storage time for the two varieties of potato tubers stored in Nawalla and Cold store. Similarly, it decreases with all static levels of load and on the three positions of the tuber. Increasing the static load from 10 to 18N had a slight effect in the magnitude of C1 as a positive relationship. In this regard multiple linear regression analyses were achieved to yield functional equations. These equations expressed the relationship between the free viscous element (C1),N.min/mm versus storage time (ST),days; static load (Fo) N; position of load effect (index Pi ) where L=1, D = 2 and T= 3 and potato weight (W) g. The effect of the above mentioned parameters, involved in the equations, on C1 under the experimental conditions was analyzed for the potato varieties when stored in Nawalla (16 + 3oC,.84% RH ) and Cold store (4oC, 90% RH). The equations which provided the best fitting of data are:
Misr J. Ag. Eng., January 2009
376
a- Cold storage system:
Diamont variety
C1 = 335.2 Pi – 10.2 ST – 21.5 Fo - 3.4 W + 1439 R2 = 0.86
Santana variety
C1 = 398.3 Pi – 8.9 ST – 4.9 Fo - 3.96 W – 121.7 R2 = 0.83
b- Nawalla storage system:
Diamont variety
C1 = 345.7 Pi – 12.2 ST - 2.2 Fo - 4.9 W + 1343 R2 = 0.85
Santana variety
C1 = 422.1 Pi – 12 ST – 35 Fo – 15.2 W + 2942 R2 = 0.89
It can be concluded from the graphs and equations that (C1) is inversely proportional with storage time while it has a positive relationship with tuber weight. As for the dimensions it is appear that the greater the physical dimension, the lower magnitude of (C1) N.min/mm even during storage time. It is clear also that a slight increasing in C1 was found due to increasing the static load (fixed load). It is apparent from the curves that the mean values of the retarded viscous element (C1) decreased sharply during the first 25 days while, small decreasing rate was noticed after till the end of storage time in the two storage systems. According to exposure of L dimension of the tuber by 10N static load for the two varieties Santana and Diamont in the two storage systems Cold and Nawalla respectively the mean value of C1 for fresh tubers was 949.06 and 1066.1N.min/mm It decreased by (29.27%; 19.12%) from harvesting to the end of 15 days curing period. The total percentage of decrement was 60.67%; 62.48% and 72.51; 74.07%.
Misr J. Ag. Eng., January 2009
377
0
500
1000
1500
2000
2500
0 50 100
Fre
e v
isco
us
ele
me
nt(
C1
), N
.min
/mm
Storage time, day
L D T
0
500
1000
1500
2000
2500
0 50 100
Fre
e v
isco
us
ele
me
nt(
C1
), N
.min
/mm
Storage time, day
0
500
1000
1500
2000
2500
0 50 100
Fre
e v
isco
us
ele
me
nt(
C1
), N
.min
/mm
Storage time, day
0
500
1000
1500
2000
2500
0 50 100
Fre
e v
isco
us
ele
me
nt(
C1
), N
.min
/mm
Storage time, day
L D T
0
500
1000
1500
2000
2500
0 50 100
Fre
e v
isco
us
ele
me
nt(
C1
), N
.min
/mm
Storage time, day
0
500
1000
1500
2000
2500
0 50 100
Fre
e v
isco
us
ele
me
nt(
C1
), N
.min
/mm
Storage time, day
At 10 N
At 14N
At 18 NFig. (17) Fig. (18)
Figures(17&18) Relationship between free viscous element(C1), N.min/mm, for Diamon and Santana varieties during storage in Cold storage system at three loading positions (Longitudinal
(L), Radial axis (D), and Minimum axis (T) for 10, 14,and 18 N of static loads
Diamont Santana
Misr J. Ag. Eng., January 2009
378
0500
100015002000250030003500
0 20 40 60 80
Fre
e v
isco
us
ele
me
nt(
C1
), N
.min
/mm
storage time, day
L D T
0500
100015002000250030003500
0 20 40 60 80
Fre
e v
isco
us
ele
me
nt(
C1
), N
.min
/mm
Storage time, day
0500
100015002000250030003500
0 20 40 60 80
Fre
e v
isco
us
ele
me
nt(
C1
), N
.min
/mm
storage time, day
0
500
1000
1500
2000
2500
0 20 40 60 80
Fre
e v
isco
us
ele
me
nt(
C1
), N
.min
/mm
storage time, day
0
500
1000
1500
2000
2500
0 20 40 60 80
Fre
e v
isco
us
ele
me
nt(
C1
), N
.min
/mm
storage time, day
L D T
0
500
1000
1500
2000
2500
0 50 100
Fre
e v
isco
us
ele
me
nt(
C1
), N
.min
/mm
storage time, day
At 10 N
At 14 N
At 18 NFig. (19) Fig. (20)
Figures: (19&20): Relationship between free viscous element(C1), N.min/mm, for Diamon and Santana varieties during storage in Nawalla storae system at three loading positions (Longitudinal
(L), Radial axis (D), and Minimum axis (T) for 10, 14,and 18 N of static loads
Diamont Santana
Misr J. Ag. Eng., January 2009
379
. .min/mmN) 2Retarded viscous element (C-4
Figures 21 to 24show (C2) – storage time relation at various fixed loads on the three positions of the tuber for Diamont and Santana varieties stored in Cold and Nawalla storage systems. Firstly, it is cleared that retarded viscous element (C2) decreased with increasing storage time through the storage period in Cold and Nawalla storage conditions. The Cold system was at 4oC and 90% RH, where the storage conditions in
2and even K 2C and 84% RH. This reduction in C3 +Nawalla were at 16 was most probably due to the degradation of pectin substances, which make up 52% of potato cell wall, and are responsible for the bending of cells (Alvarez et al., 2000; and Scanlon et al., 1996). A positive relation was found from the figures between C2 and static load. Also the mean values of C2 for Santana variety which characterized by the big weight
and volume were found higher than in Diamont variety. Statistical equations based on multiple linear regression analysis were determined using the obtained data for the calculated values of C2 affected by storage time (ST), (days), tuber weight, (g), static load, F (N) and loading position index, Pi (L=1, D=2, and T=3) for the two potato varieties (Diamont and Santana) stored at two different storage conditions .The equations delivered were as follows:
a-Cold storage system:
Diamont C2 = 399.4 Pi - 10.1 ST + 9.2 Fo + 2.4 W +267.4 R2 = 0.84
Santana C2 = 409.8 Pi - 9.8 ST + 85.7 Fo + 7.5 W -14663 R2 = 0.90
b- Nawall storage system:
Diamont C2 = 421 Pi – 14.3 ST + 25.7 Fo + 5.8 W + 1426 R2 = 0.92
Santana C2 = 391 Pi – 13.9 ST + 28.5 Fo + 7.9 W + 1536 R2 = 0.81
A decreasing relation was clarified by the equations for C2 as affected by storage time The tubers weight was directly proportional with C2.In the same time, a positive relationship characterized the effect of static load on respect to loading tubers with a static load of 10 N on L position appeared
Misr J. Ag. Eng., January 2009
380
Diamont Santana
0
500
1000
1500
2000
2500
0 50 100
Re
tard
ed
vis
cou
s e
lem
en
t(C
2),
N.m
in/m
m
Storage time, day
L D T
0
500
1000
1500
2000
2500
٠ ٢٥ ٥٠ ٧٥
Re
tard
ed
vis
cou
s e
lem
en
t(C
2),
N.m
in/m
m
Storage time, day
0
500
1000
1500
2000
2500
0 20 40 60 80
Re
tard
ed
vis
cou
s e
lem
en
t(C
2),
N.m
in/m
m
Storage time, day
0500
100015002000250030003500
0 50 100
Re
tard
ed
vis
cou
s e
lem
en
t(C
2),
N.m
in/m
m
Storage time, day
L D T
0500
100015002000250030003500
0 20 40 60 80
Re
tard
ed
vis
co
us
ele
me
nt(
C2
), N
.min
/mm
Storage time, day
0500
100015002000250030003500
0 50 100
Re
tard
ed
vis
cou
s e
lem
en
t(C
2),
N.m
in/m
m
Storage time, day
At 10 N
At 14 N
At 18 NFig. (21) Fig. (22)
Figures: (21:22): Relationship between free viscous element(C1), N.min/mm, for Diamon and Santana varieties during storage in cold storage system at three loading positions (Longitudinal
(L), Radial axis (D), and Minimum axis (T) for 10, 14,and 18 N of static loads
Figures: (21&22): Relationship between free viscous element(C2), N.min/mm, for Diamon and Santana varieties during storage in cold
storage system at three loading positions (Longitudinal (L), Radial axis (D), and Minimum axis (T) for 10, 14,and 18 N of static loads
Misr J. Ag. Eng., January 2009
381
Diamont Santana
0
500
1000
1500
2000
2500
3000
0 50 100
Re
tard
ed
vis
cou
s
ele
me
nt(
C2
), N
.min
/mm
storage time, day
L D T
0
500
1000
1500
2000
2500
3000
0 50 100
Re
tard
ed
vis
cou
s
ele
me
nt(
C2
), N
.min
/mm
storage time, day
0
500
1000
1500
2000
2500
3000
0 20 40 60 80
Re
tard
ed
vis
cou
s
ele
me
nt(
C2
), N
.min
/mm
storage time, day
0500
100015002000250030003500
0 20 40 60 80
Re
tard
ed
vis
cou
s
ele
me
nt(
C2
), N
.min
/mm
storage time, day
L D T
0500
100015002000250030003500
0 20 40 60 80
Re
tard
ed
vis
cou
s
ele
me
nt(
C2
), N
.min
/mm
storage time, day
0500
100015002000250030003500
0 20 40 60 80
Re
tard
ed
vis
cou
s
ele
me
nt(
C2
), N
.min
/mm
storage time, day
At 10 N
At 14 N
At 18 NFig. (23) Fig. (24)
Figures: (23:24): Relationship between free viscous element(C1), N.min/mm, for Diamon and Santana varieties during storage in Nawalla storage system at three loading positions
(Longitudinal (L), Radial axis (D), and Minimum axis (T) for 10, 14,and 18 N of static loads
Figures: (23&24): Relationship between free viscous element(C2), N.min/mm, for Diamon and Santana varieties during storage in Nawalla storage system at three loading positions (Longitudinal (L), Radial axis (D), and Minimum axis
(T) for 10, 14,and 18 N of static loads
Misr J. Ag. Eng., January 2009
382
C2 .In the same direction, the mean values of data obtained for C2 with that C2 for fresh tubers was 1057.53 and 1532.44 N.min/mm for Santana and Daiamont varieties. After curing its value reached 912.45 and 1414.56 N.min/mm .It reduced by 52.58, 59.97 and 68.95, 74.58 % when tubers of the two varieties were stored 75 days in both Cold and Nawalla storage systems.
CONCLUSION The rheological model constants determined in this study cleared the following observations: The constants decreased significantly with storage time. The constants appeared a positive relation with potato tuber weight. The constants had a slight positive effect with increasing the static fixed load. Concerning temperature, the mean values of the rheological model constants were higher in magnitude when storing tubers in Nawalla storage system, 163; 85 %RH, where the higher storage temperature than in Cold storage system, 4oC; 90 % RH, where the lower storage temperature. It was observed from the creep and retardation test for potato tubers that, the instantaneous deformation of the tested potato tubers when subjected to the constant load increased with time and also with storage time under all storage conditions in the investigation. When the tuber unloaded, the deflection happened due to the effect of the static load divided to two portions .One is not recoverable due to the fluid which has moved out of the cells .The other is recoverable which is probably due to the elasticity of the cell walls of the tuber .This observation was also noticed and described by Finny and Hall, 1967.
REFERENCES
Abdelmaksoud,M.A.,1992.Rheological properties of tomatoes and their
dependence on maturity.M.Sc.thesis Ag.Eng.Dept;Fac.of
Ag.,Alexandria Univ.
Alvarez, M.D., Saunders, D.E., and Vineent, J.F. (2000). Effect of turgor
on the cutting energy of rtored potatoes. European Food
Research Technology, 210,331-339.
Misr J. Ag. Eng., January 2009
383
Chang,C.S.and C.R Martin,1983. Rheological properties of grain dust
,Trans. Of the ASAE.1249:1256.
Clevenger, J.J. and D.D. Haman, 1968. The behavior of apple skin under
tensile loading. Trans of The ASAE 11(1):34 – 37.
Faborode,M.O.and J.R..O Calla ghan (1989). A rheological model for the
compaction of fibrous agricultural material J.agric.Engn.Res.42:
165 – 178.
Finney,F.E. and CW. Hall, 1967. Elastic properties of potatoes.
TRANSACTIONS of ASAE : 10(1):4-8.
Mohsenin, N.N.1970. Physical properties of plant and animal materials
.Vol. 1.Gorden And Breach Science Publishers. New York.
Mohsenin, N.N.1978.
Pitt,R,E. and Chen,H.L.(1983). Time – dependent aspects of strength and
rheological of vegetative tissue Trans. Of the ASAE 26(5):1275
– 1280.
Sabbah,M.A.; Soliman S.N. and M.A.Abdelmaksoud,1994.Creep
properties of tomatoes and their dependence on
maturity.Mist,J.Ag.Eng,11(1).
Scanlon, M.G., Pang, C.H., and Billaderis, C.G.(1996). The effect of
osmotic adjustment on the mechanical, properties of potato
parenchyma. Food Research International 29,481-488.
Misr J. Ag. Eng., January 2009
384
الملخص العربي
درنات البطاطسلو الأربعة عناصر ذ الثوابت الريولولوجية لنموزج بيرجرز
مختلفة تخزين مختلفة تحت ظروف وأحمال ثابتة المتأثرة ب محمد عبد الجواد عبد الجواد.م** جامع رشاد جمال. د* مد عبد الفتاح عبد المقصود مح. د*
الزحف و اختبارستخدام لك باذو ت البطاطس صنفى دايمونت و سانتانا زج الريولوجى لدرنالبحث دراسة النمواا ذى ھتم فخلال مراحل جذج الدراسة و ايجاد ثوابت النموئحليل نتاالاسترجا ع و قد استخدم نموزج بارجر زو الأربغة عناصر لت
مستويات ثلاثة لك عندذو) يوم داخل نظامى التبريد ٢٥ت كل ث فترامخزنة على ثلا –لجة معا –طازجة (التداول للدرنات سلوك حصائص يعبر عن الذي و للدرنة لزوم اختبار الزحف و الاسترجاع الأساسية ادبعأثابتة علي الثلاث و تحميل مختلفة
..الثابت المرونة و اللزوجة للدرنات تحت تأثير الاجھاد :لك اشتملت الدراسة على الأتى ذب .) نيوتن ١٨- ١٤ - ١٠(مستويا ت للحمل الثابت ثلاث - ١ ) . السمك –العرض –الطول ( ثلاث اوضا ع اساسية لتأثير الحمل الثابت على الدرنة - ٢ .صنفان من الدرنات وھى دايمونت وسانتانا - ٣فى النوالة ، التخزين ) رطوبة نسبية % ٩٠- ئويةدرجات م٤(التخزين في الثلاجة : نظامين لتخزين درنات البطاطس - ٤
) .رطوبة نسبية % ٨٤ - درجات مئوية٣ ±١٦( –يوما تحزين ٥٠ بعد –يوم تخزين ٢٥بعد – يوما١٥معالجة لفترة –طازجة ( مراحل للدرنة ٥اجريت التجارب على - ٥
.يوما تخزين ٧٥بعد مكررات ٣ - ٦
دقيقة اخرى ٣٠دقيقة تحميل و ٣٠دقيقة قسمت الي ٦٠خلال تجربة ٥٤٠و عددھا اجريت جميع اختبارات الزحفقد و. ،حيث قد تم تصنيع وحدة لقياس اختبارات الزحف و معايرتھا لتقدير الفاقد في القوة با لإحتكاك للتجربة الواحدة استرجاع
ين رسم العلاقات ب قد تم لكذوك ج في جميع مراحل الدرنة الخمسةذتم ايجاد جميع القيم المتوسطة للثوابت الريولوجية للنمو .ة الثوابت ذالتخزين وتأثيرة على القييم المتوسطة لھزمن
ة الثوابت الريولوجية و كل من زمن التخزين با لأيام ذبين القيم المتوسطة لھ المتعدد وقد تم ايضا ايجاد علاقات الإنحدار الخطى .لك وزن الدرنة با لجرام ذالدرنة وك الأوضاع المختلفة لتأثير الحمل على - لنيوتن باقيمة الأحما ل الثابتة المختلفة –
:وقد تم التوصل الي النتائج و الملا حظات التاليةخزين في إزداد التمدد اللحظى للدرنات المختبرة عند تعرضھا للأحمال الثابتة المختلفة مع زمن التخزين تحت ظروف الت - ١
.كل من الثلاجة و النوالة الأول تم ازالتة وقد يرجع زلك إلي مرونة انقسم الإنبعاج الحادث فى الدرنة الى جزأين رئيسيين الثابت عند ازالة الحمل - ٢
سنة Hallو Finney لك العالمان ذلوقد ايد .جدار الخلية للدرنة و الثاني لم يزال نتيجة لخروج السائل من الخلايا للدرنة١٩٦٧.
.الأيا م الأولي من التخزين وبعد فترة المعالجة وخاصة في قلت الثوابت الريولوجية مع زمن التحزين - ٣ . أظھرت الثوابت الريولوجية علا قة موجبة مع وزن الدرنات - ٤ .إزدادت الثوابت الريولوجية زيادة طفيفة مع زيادة الحمل الثابت علي أوضاع الدرنة الثلاث - ٥ .عنھا في الثلاجة إزدادت القيم المتوسطة للثوابت الريولوجية في النوالة - ٦
.جامعة المنوفية –كلية الزراعة - أستاذ مساعد الھندسة الزراعية قسم الھندسة الزراعية *