8/7/2019 MITCHELL COUNTY - Westbrook ISD - 2010 Texas School Survey of Drug and Alcohol Use
http://slidepdf.com/reader/full/mitchell-county-westbrook-isd-2010-texas-school-survey-of-drug-and-alcohol 1/60
Westbrook
SPRING 2010
Texas School Survey
of Drug and Alcohol Use
2010
Westbrook ISD
Part I: District Results
Secondary
©Copyright 2010, Texas A&M University
All rights reserved.
Secondary Report-Page 1 of 60
8/7/2019 MITCHELL COUNTY - Westbrook ISD - 2010 Texas School Survey of Drug and Alcohol Use
http://slidepdf.com/reader/full/mitchell-county-westbrook-isd-2010-texas-school-survey-of-drug-and-alcohol 2/60
Westbrook
SPRING 2010
©Copyright 2010, Texas A&M University
All rights reserved.
Secondary Report-Page 2 of 60
8/7/2019 MITCHELL COUNTY - Westbrook ISD - 2010 Texas School Survey of Drug and Alcohol Use
http://slidepdf.com/reader/full/mitchell-county-westbrook-isd-2010-texas-school-survey-of-drug-and-alcohol 3/60
8/7/2019 MITCHELL COUNTY - Westbrook ISD - 2010 Texas School Survey of Drug and Alcohol Use
http://slidepdf.com/reader/full/mitchell-county-westbrook-isd-2010-texas-school-survey-of-drug-and-alcohol 4/60
Westbrook
SPRING 2010
©Copyright 2010, Texas A&M University
All rights reserved.
Secondary Report-Page 4 of 60
8/7/2019 MITCHELL COUNTY - Westbrook ISD - 2010 Texas School Survey of Drug and Alcohol Use
http://slidepdf.com/reader/full/mitchell-county-westbrook-isd-2010-texas-school-survey-of-drug-and-alcohol 5/60
Westbrook
SPRING 2010
1. General Substance Tables
©Copyright 2010, Texas A&M University
All rights reserved.
Secondary Report-Page 5 of 60
8/7/2019 MITCHELL COUNTY - Westbrook ISD - 2010 Texas School Survey of Drug and Alcohol Use
http://slidepdf.com/reader/full/mitchell-county-westbrook-isd-2010-texas-school-survey-of-drug-and-alcohol 6/60
Westbrook
SPRING 2010
©Copyright 2010, Texas A&M University
All rights reserved.
Secondary Report-Page 6 of 60
8/7/2019 MITCHELL COUNTY - Westbrook ISD - 2010 Texas School Survey of Drug and Alcohol Use
http://slidepdf.com/reader/full/mitchell-county-westbrook-isd-2010-texas-school-survey-of-drug-and-alcohol 7/60
Westbrook
SPRING 2010
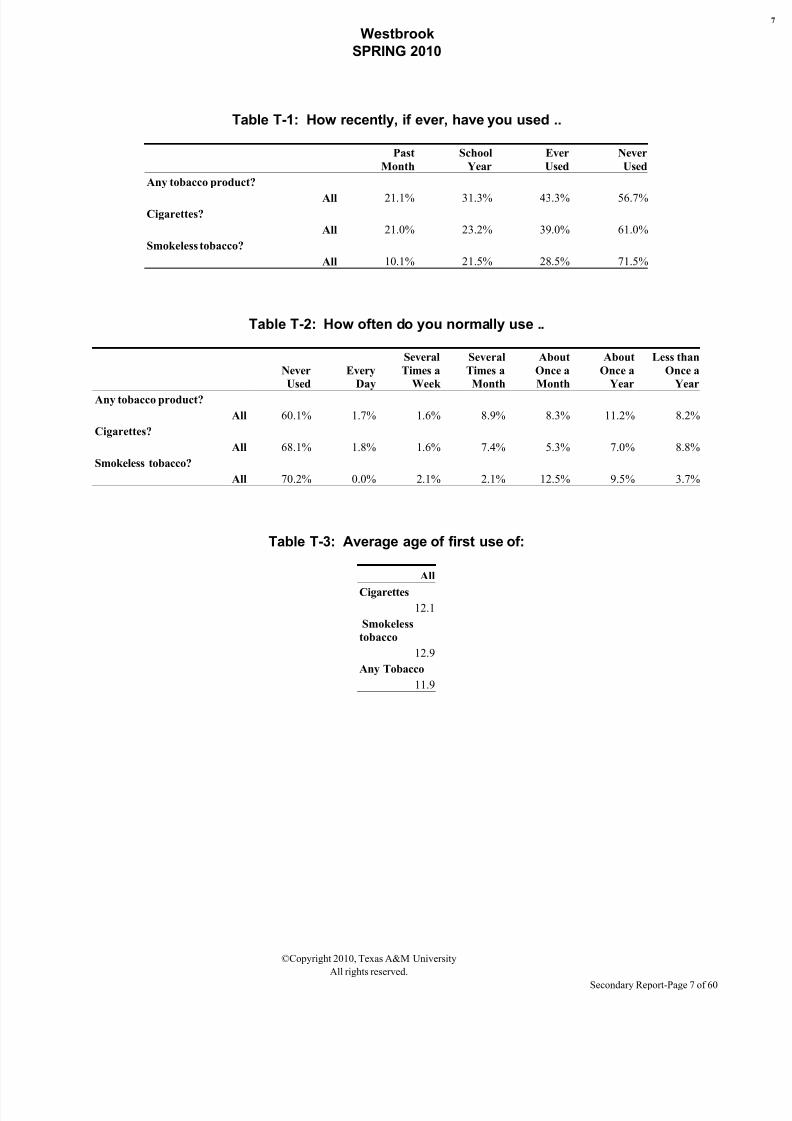
Table T-1: How recently, if ever, have you used ..
Past
Month
School
Year
Ever
Used
Never
Used
Any tobacco product?
All 21.1% 31.3% 43.3% 56.7%Cigarettes?
All 21.0% 23.2% 39.0% 61.0%
Smokeless tobacco?
All 10.1% 21.5% 28.5% 71.5%
Table T-2: How often do you normally use ..
Never
Used
Every
Day
Several
Times a
Week
Several
Times a
Month
About
Once a
Month
About
Once a
Year
Less than
Once a
Year
Any tobacco product?
All 60.1% 1.7% 1.6% 8.9% 8.3% 11.2% 8.2%
Cigarettes?
All 68.1% 1.8% 1.6% 7.4% 5.3% 7.0% 8.8%
Smokeless tobacco?
All 70.2% 0.0% 2.1% 2.1% 12.5% 9.5% 3.7%
Table T-3: Average age of first use of:
All
Cigarettes
12.1
Smokeless
tobacco
12.9
Any Tobacco
11.9
©Copyright 2010, Texas A&M University
All rights reserved.
Secondary Report-Page 7 of 60
8/7/2019 MITCHELL COUNTY - Westbrook ISD - 2010 Texas School Survey of Drug and Alcohol Use
http://slidepdf.com/reader/full/mitchell-county-westbrook-isd-2010-texas-school-survey-of-drug-and-alcohol 8/60
Westbrook
SPRING 2010
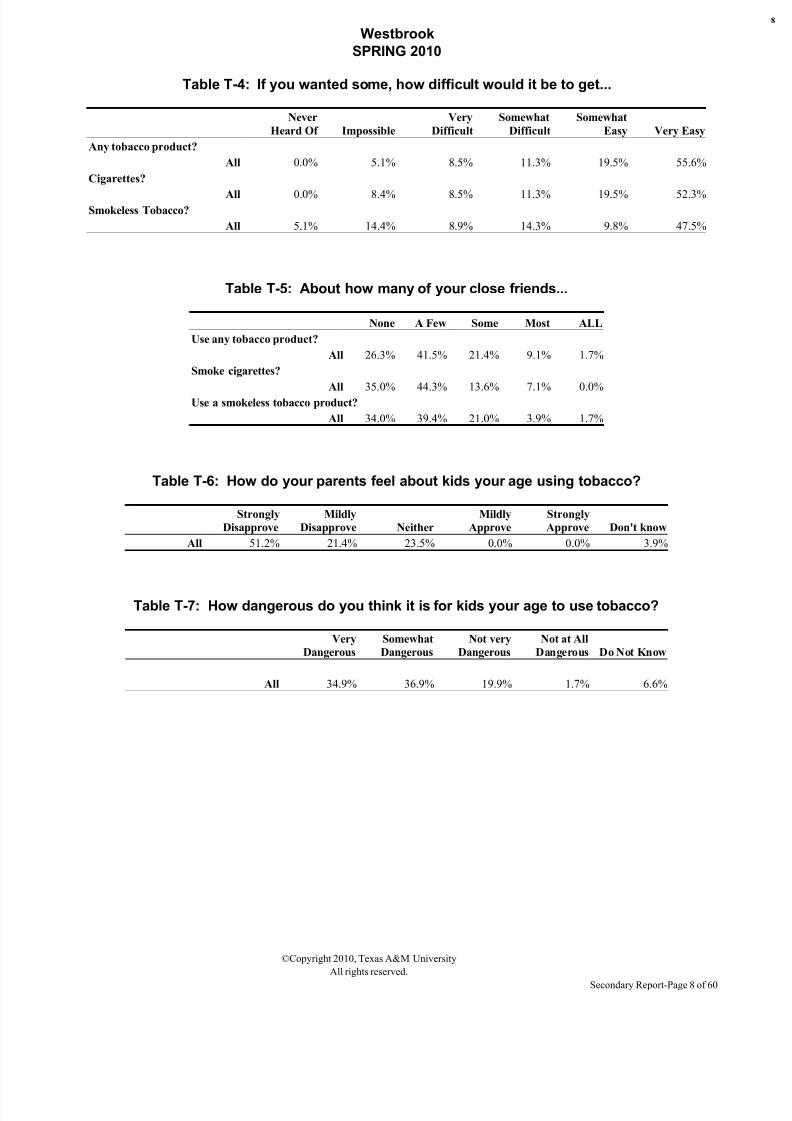
Table T-4: If you wanted some, how difficult would it be to get...
Never
Heard Of Impossible
Very
Difficult
Somewhat
Difficult
Somewhat
Easy Very Easy
Any tobacco product?
All 0.0% 5.1% 8.5% 11.3% 19.5% 55.6%
Cigarettes?
All 0.0% 8.4% 8.5% 11.3% 19.5% 52.3%Smokeless Tobacco?
All 5.1% 14.4% 8.9% 14.3% 9.8% 47.5%
Table T-5: About how many of your close friends...
None A Few Some Most ALL
Use any tobacco product?
All 26.3% 41.5% 21.4% 9.1% 1.7%
Smoke cigarettes?
All 35.0% 44.3% 13.6% 7.1% 0.0%Use a smokeless tobacco product?
All 34.0% 39.4% 21.0% 3.9% 1.7%
Table T-6: How do your parents feel about kids your age using tobacco?
Strongly
Disapprove
Mildly
Disapprove Neither
Mildly
Approve
Strongly
Approve Don't know
All 51.2% 21.4% 23.5% 0.0% 0.0% 3.9%
Table T-7: How dangerous do you think it is for kids your age to use tobacco?
Very
Dangerous
Somewhat
Dangerous
Not very
Dangerous
Not at All
Dangerous Do Not Know
All 34.9% 36.9% 19.9% 1.7% 6.6%
©Copyright 2010, Texas A&M University
All rights reserved.
Secondary Report-Page 8 of 60
8/7/2019 MITCHELL COUNTY - Westbrook ISD - 2010 Texas School Survey of Drug and Alcohol Use
http://slidepdf.com/reader/full/mitchell-county-westbrook-isd-2010-texas-school-survey-of-drug-and-alcohol 9/60
Westbrook
SPRING 2010
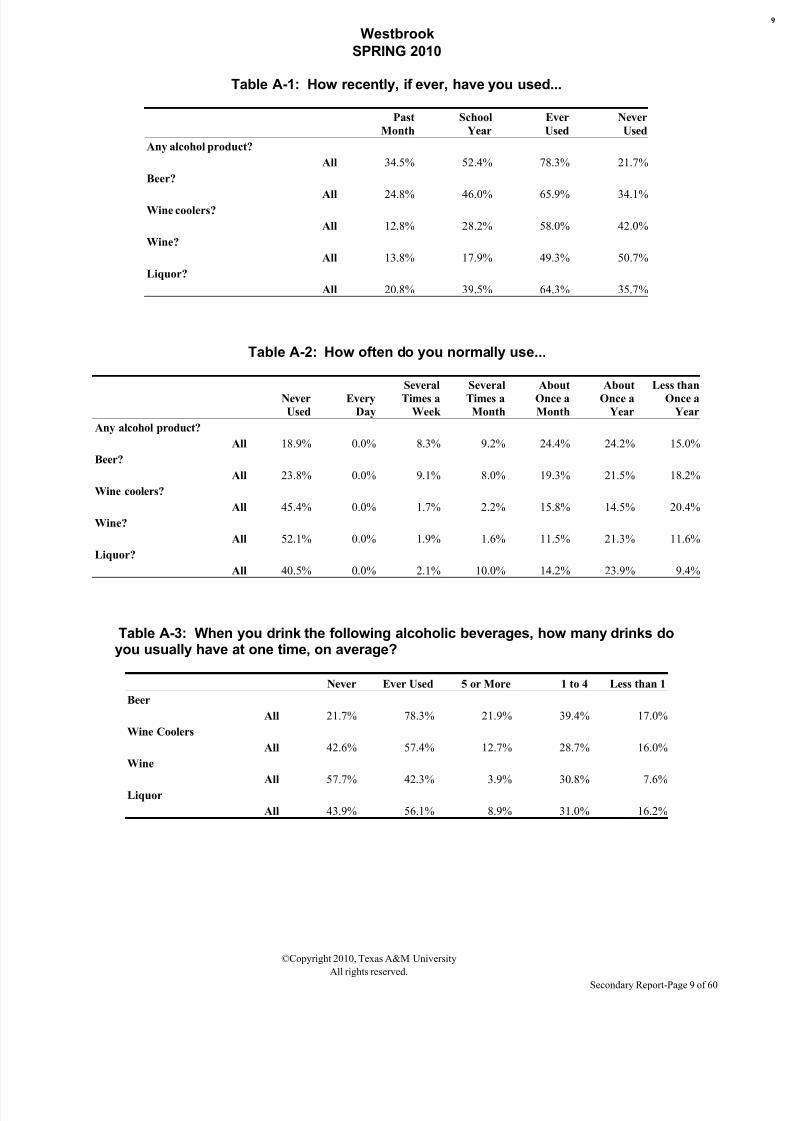
Table A-1: How recently, if ever, have you used...
Past
Month
School
Year
Ever
Used
Never
Used
Any alcohol product?
All 34.5% 52.4% 78.3% 21.7%
Beer?
All 24.8% 46.0% 65.9% 34.1%Wine coolers?
All 12.8% 28.2% 58.0% 42.0%
Wine?
All 13.8% 17.9% 49.3% 50.7%
Liquor?
All 20.8% 39.5% 64.3% 35.7%
Table A-2: How often do you normally use...
Never
Used
Every
Day
Several
Times a
Week
Several
Times a
Month
About
Once a
Month
About
Once a
Year
Less than
Once a
Year
Any alcohol product?
All 18.9% 0.0% 8.3% 9.2% 24.4% 24.2% 15.0%
Beer?
All 23.8% 0.0% 9.1% 8.0% 19.3% 21.5% 18.2%
Wine coolers?
All 45.4% 0.0% 1.7% 2.2% 15.8% 14.5% 20.4%
Wine?
All 52.1% 0.0% 1.9% 1.6% 11.5% 21.3% 11.6%
Liquor?
All 40.5% 0.0% 2.1% 10.0% 14.2% 23.9% 9.4%
Table A-3: When you drink the following alcoholic beverages, how many drinks doyou usually have at one time, on average?
Never Ever Used 5 or More 1 to 4 Less than 1
Beer
All 21.7% 78.3% 21.9% 39.4% 17.0%
Wine Coolers
All 42.6% 57.4% 12.7% 28.7% 16.0%
Wine
All 57.7% 42.3% 3.9% 30.8% 7.6%
Liquor
All 43.9% 56.1% 8.9% 31.0% 16.2%
©Copyright 2010, Texas A&M University
All rights reserved.
Secondary Report-Page 9 of 60
8/7/2019 MITCHELL COUNTY - Westbrook ISD - 2010 Texas School Survey of Drug and Alcohol Use
http://slidepdf.com/reader/full/mitchell-county-westbrook-isd-2010-texas-school-survey-of-drug-and-alcohol 10/60
Westbrook
SPRING 2010
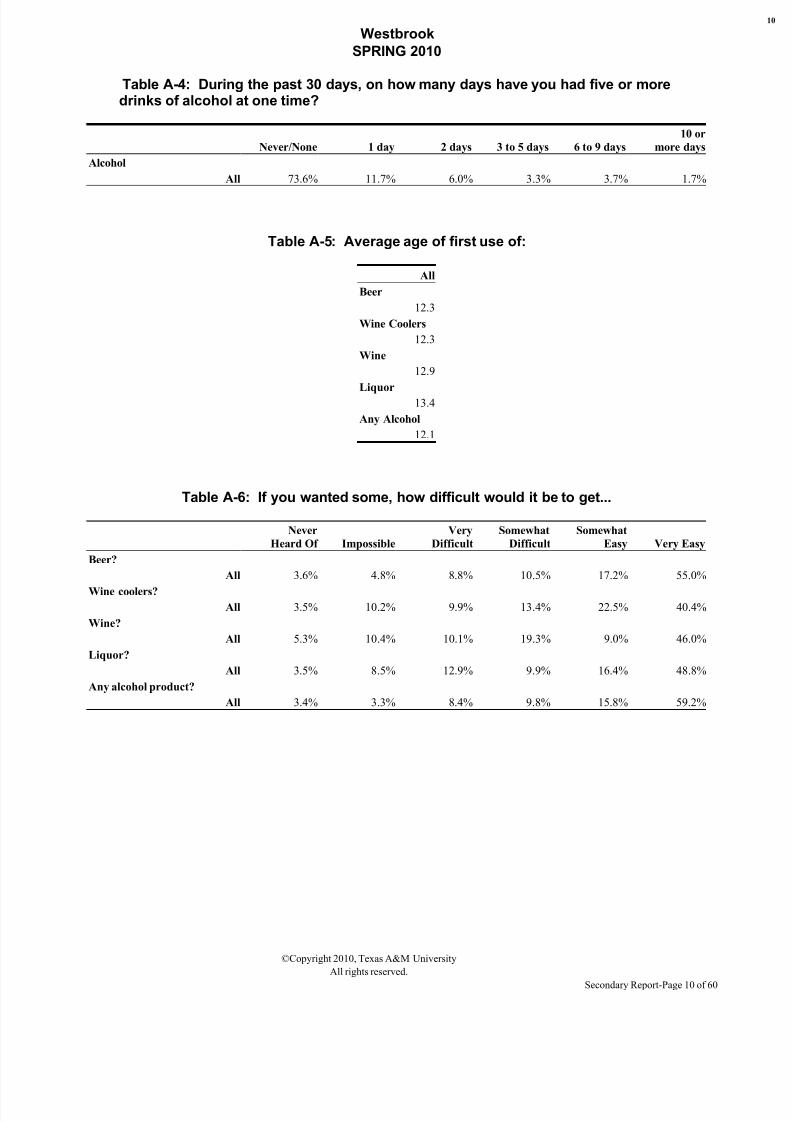
Table A-4: During the past 30 days, on how many days have you had five or moredrinks of alcohol at one time?
Never/None 1 day 2 days 3 to 5 days 6 to 9 days
10 or
more days
Alcohol
All 73.6% 11.7% 6.0% 3.3% 3.7% 1.7%
Table A-5: Average age of first use of:
All
Beer
12.3
Wine Coolers
12.3
Wine
12.9
Liquor13.4
Any Alcohol
12.1
Table A-6: If you wanted some, how difficult would it be to get...
Never
Heard Of Impossible
Very
Difficult
Somewhat
Difficult
Somewhat
Easy Very Easy
Beer?
All 3.6% 4.8% 8.8% 10.5% 17.2% 55.0%
Wine coolers?
All 3.5% 10.2% 9.9% 13.4% 22.5% 40.4%
Wine?
All 5.3% 10.4% 10.1% 19.3% 9.0% 46.0%
Liquor?
All 3.5% 8.5% 12.9% 9.9% 16.4% 48.8%
Any alcohol product?
All 3.4% 3.3% 8.4% 9.8% 15.8% 59.2%
©Copyright 2010, Texas A&M University
All rights reserved.
Secondary Report-Page 10 of 60
8/7/2019 MITCHELL COUNTY - Westbrook ISD - 2010 Texas School Survey of Drug and Alcohol Use
http://slidepdf.com/reader/full/mitchell-county-westbrook-isd-2010-texas-school-survey-of-drug-and-alcohol 11/60
Westbrook
SPRING 2010
Table A-7: Since school began in the fall, on how many days (if any) have you...
None 1-3 Times 4-9 Times 10+ Times
Attended class while drunk on alcohol?
All 88.4% 6.7% 1.7% 3.2%
Gotten into trouble with teachers because of your drinking?
All 95.1% 3.1% 0.0% 1.8%
Table A-8: School year use of alcohol by absences and conduct problems:
Average days absent due to
illness or other reasons
Alcohol Users: 5.8
Alcohol Non-use 6.2
Average days conduct problems
reported
Alcohol Users: 5.7
Alcohol Non-use 2.2
Table A-9: During the past twelve months, how many times have you...
None 1-3 Times 4-9 Times 10+ Times
Driven a car when you've had a good bit to drink?
All 97.2% 2.8% 0.0% 0.0%
Gotten into trouble with the police because of drinking?
All 98.3% 1.7% 0.0% 0.0%
©Copyright 2010, Texas A&M University
All rights reserved.
Secondary Report-Page 11 of 60
8/7/2019 MITCHELL COUNTY - Westbrook ISD - 2010 Texas School Survey of Drug and Alcohol Use
http://slidepdf.com/reader/full/mitchell-county-westbrook-isd-2010-texas-school-survey-of-drug-and-alcohol 12/60
Westbrook
SPRING 2010
Table A-10: About how many of your close friends use...
None A Few Some Most ALL
Any alcohol product?
All 14.6% 24.0% 26.2% 25.7% 9.6%
Beer?
All 14.8% 27.5% 25.2% 26.0% 6.5%
Wine coolers?
All 41.9% 25.8% 16.5% 12.7% 3.2%
Wine?
All 52.0% 29.2% 7.5% 8.1% 3.3%
Liquor?
All 25.6% 33.7% 22.3% 13.4% 5.0%
Table A-11: During the past twelve months, how many times have you...
None 1-3 Times 4-9 Times 10+ Times
Had difficulties of any kind with your friends because of your drinking?All 96.5% 3.5% 0.0% 0.0%
Been criticized by someone you were dating because of drinking?
All 94.6% 5.4% 0.0% 0.0%
Table A-12: Thinking of parties you attended this school year, how often wasalcohol used?
Never Seldom
Half
the Time
Most
of the Time Always Don't know
Didn't
attend
All 23.6% 16.8% 13.4% 15.2% 11.6% 1.8% 17.5%
©Copyright 2010, Texas A&M University
All rights reserved.
Secondary Report-Page 12 of 60
8/7/2019 MITCHELL COUNTY - Westbrook ISD - 2010 Texas School Survey of Drug and Alcohol Use
http://slidepdf.com/reader/full/mitchell-county-westbrook-isd-2010-texas-school-survey-of-drug-and-alcohol 13/60
Westbrook
SPRING 2010
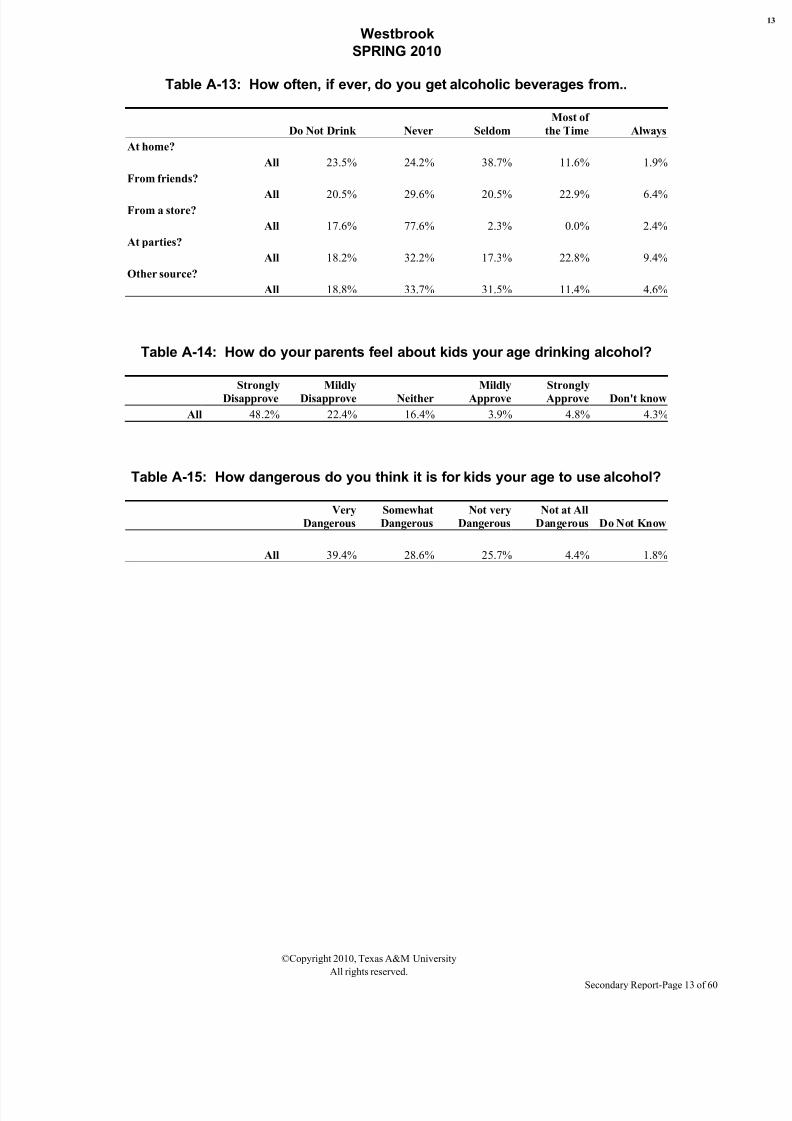
Table A-13: How often, if ever, do you get alcoholic beverages from..
Do Not Drink Never Seldom
Most of
the Time Always
At home?
All 23.5% 24.2% 38.7% 11.6% 1.9%
From friends?
All 20.5% 29.6% 20.5% 22.9% 6.4%From a store?
All 17.6% 77.6% 2.3% 0.0% 2.4%
At parties?
All 18.2% 32.2% 17.3% 22.8% 9.4%
Other source?
All 18.8% 33.7% 31.5% 11.4% 4.6%
Table A-14: How do your parents feel about kids your age drinking alcohol?
Strongly
Disapprove
Mildly
Disapprove Neither
Mildly
Approve
Strongly
Approve Don't know
All 48.2% 22.4% 16.4% 3.9% 4.8% 4.3%
Table A-15: How dangerous do you think it is for kids your age to use alcohol?
Very
Dangerous
Somewhat
Dangerous
Not very
Dangerous
Not at All
Dangerous Do Not Know
All 39.4% 28.6% 25.7% 4.4% 1.8%
©Copyright 2010, Texas A&M University
All rights reserved.
Secondary Report-Page 13 of 60
8/7/2019 MITCHELL COUNTY - Westbrook ISD - 2010 Texas School Survey of Drug and Alcohol Use
http://slidepdf.com/reader/full/mitchell-county-westbrook-isd-2010-texas-school-survey-of-drug-and-alcohol 14/60
Westbrook
SPRING 2010
Table D-1: How recently, if ever, have you used...
Past
Month
School
Year
Ever
Used
Never
Used
Marijuana?
All 7.6% 15.0% 24.8% 75.2%
Cocaine?
All 0.0% 4.1% 4.1% 95.9%Crack?
All 0.0% 0.0% 0.0% 100.0%
Hallucinogens?
All 4.1% 8.3% 10.1% 89.9%
Uppers?
All 2.0% 9.2% 14.3% 85.7%
Downers?
All 3.7% 8.2% 10.5% 89.5%
Rohypnol?
All 0.0% 0.0% 1.8% 98.2%
Steroids?
All 0.0% 0.0% 0.0% 100.0%
Ecstasy?
All 0.0% 2.0% 6.8% 93.2%
Heroin?
All 0.0% 0.0% 2.3% 97.7%
©Copyright 2010, Texas A&M University
All rights reserved.
Secondary Report-Page 14 of 60
8/7/2019 MITCHELL COUNTY - Westbrook ISD - 2010 Texas School Survey of Drug and Alcohol Use
http://slidepdf.com/reader/full/mitchell-county-westbrook-isd-2010-texas-school-survey-of-drug-and-alcohol 15/60
Westbrook
SPRING 2010
Table D-2: How often do you normally use...
Never
Used
Every
Day
Several
Times a
Week
Several
Times a
Month
About
Once a
Month
About
Once a
Year
Less than
Once a
Year
Marijuana?
All 73.9% 5.2% 0.0% 4.7% 0.0% 11.8% 4.4%
Cocaine?All 95.1% 0.0% 0.0% 0.0% 0.0% 2.5% 2.5%
Crack?
All 97.5% 0.0% 0.0% 0.0% 0.0% 0.0% 2.5%
Hallucinogens?
All 94.9% 0.0% 0.0% 0.0% 0.0% 5.1% 0.0%
Uppers?
All 91.0% 0.0% 0.0% 2.5% 1.9% 2.4% 2.2%
Downers?
All 93.4% 2.1% 0.0% 0.0% 2.1% 0.0% 2.4%
Rohypnol?
All 95.7% 0.0% 0.0% 0.0% 0.0% 2.4% 1.9%
Steroids?
All 100.0% 0.0% 0.0% 0.0% 0.0% 0.0% 0.0%
Ecstasy?
All 92.6% 0.0% 0.0% 2.9% 0.0% 2.2% 2.2%
Heroin?
All 100.0% 0.0% 0.0% 0.0% 0.0% 0.0% 0.0%
Table D-3: Average age of first use of:
All
Marijuana
13.4Cocaine
*
Crack
*
Hallucinogens
*
Uppers
*
Downers
*
Rohypnol
*Steroids
*
Ecstasy
*
Heroin
*
©Copyright 2010, Texas A&M University
All rights reserved.
Secondary Report-Page 15 of 60
8/7/2019 MITCHELL COUNTY - Westbrook ISD - 2010 Texas School Survey of Drug and Alcohol Use
http://slidepdf.com/reader/full/mitchell-county-westbrook-isd-2010-texas-school-survey-of-drug-and-alcohol 16/60
Westbrook
SPRING 2010
Table D-4: Age of first use of marijuana by family situation:
Never 9/Under 10 to 11 12 to 13 14 to 15 16 to 17 Over 17
Two parent family
All 79.4% 0.0% 0.0% 2.9% 17.8% 0.0% 0.0%
Other family situation
All 74.6% 3.5% 0.0% 9.9% 8.6% 3.4% 0.0%
Table D-5: If you wanted some, how difficult would it be to get..
Never
Heard Of Impossible
Very
Difficult
Somewhat
Difficult
Somewhat
Easy Very Easy
Marijuana?
All 7.0% 35.0% 3.4% 15.5% 17.0% 22.0%
Cocaine?
All 6.9% 47.7% 10.7% 23.5% 1.6% 9.7%
Crack?
All 6.8% 53.7% 10.2% 18.5% 1.3% 9.5%Hallucinogens?
All 22.1% 39.9% 16.7% 9.3% 5.7% 6.4%
Uppers?
All 31.7% 33.0% 7.8% 15.1% 1.3% 11.0%
Downers?
All 33.9% 33.9% 7.9% 11.8% 1.4% 11.1%
Rohypnol?
All 26.4% 33.2% 16.7% 9.8% 3.9% 10.0%
Steroids?
All 12.5% 51.2% 3.5% 19.5% 8.3% 5.0%
Ecstasy?
All 27.0% 39.0% 12.5% 6.4% 8.2% 6.9%
Heroin?
All 19.4% 53.5% 14.6% 4.5% 1.6% 6.4%
©Copyright 2010, Texas A&M University
All rights reserved.
Secondary Report-Page 16 of 60
8/7/2019 MITCHELL COUNTY - Westbrook ISD - 2010 Texas School Survey of Drug and Alcohol Use
http://slidepdf.com/reader/full/mitchell-county-westbrook-isd-2010-texas-school-survey-of-drug-and-alcohol 17/60
Westbrook
SPRING 2010
Table D-6: Since school began in the fall, on how many days (if any) have you..
None 1-3 Times 4-9 Times 10+ Times
Attended class while high from marijuana use?
All 85.5% 10.6% 0.0% 3.9%
Attended class while high from use of some other drug?
All 91.6% 6.4% 0.0% 2.0%
Gotten into trouble with teachers because of your drug use?
All 96.8% 1.4% 0.0% 1.8%
Table D-7: School year use of marijuana by absences and conduct problems:
Average days absent due to
illness or other reasons
Marijuana Users: 5.9
Marijuana Non-use 6.0
Average days conduct problems
reported
Marijuana Users: 11.7
Marijuana Non-use 2.7
Table D-8: During the past twelve months, how many times have you..
None 1-3 Times 4-9 Times 10+ Times
Driven a car when you've felt high from drugs?
All 91.3% 5.8% 2.9% 0.0%
Gotten into trouble with the police because of drug use?All 100.0% 0.0% 0.0% 0.0%
©Copyright 2010, Texas A&M University
All rights reserved.
Secondary Report-Page 17 of 60
8/7/2019 MITCHELL COUNTY - Westbrook ISD - 2010 Texas School Survey of Drug and Alcohol Use
http://slidepdf.com/reader/full/mitchell-county-westbrook-isd-2010-texas-school-survey-of-drug-and-alcohol 18/60
Westbrook
SPRING 2010
Table D-9: About how many of your close friends use marijuana?
None A Few Some Most ALL
All 53.7% 19.4% 17.2% 9.6% 0.0%
Table D-10: During the past twelve months, how many times have you..
None 1-3 Times 4-9 Times 10+ Times
Had difficulties of any kind with your friends because of your drug use?
All 100.0% 0.0% 0.0% 0.0%
Been criticized by someone you were dating because of drug use?
All 100.0% 0.0% 0.0% 0.0%
Table D-11: Thinking of parties you attended this school year, how often were
marijuana and/or other drugs used?
Never Seldom
Half
the Time
Most
of the Time Always Don't know
Didn't
attend
All 42.5% 22.1% 3.4% 3.4% 7.4% 4.0% 17.3%
Table D-12: How often, if ever, do you smoke marijuana in..
CATEGORY Never Seldom
Half
the Time
Most of
the Time Always Don't know
Joints? All 83.1% 6.2% 6.5% 2.2% 2.0% 0.0%
Blunts? All 87.4% 2.5% 5.0% 2.7% 2.4% 0.0%
Bongs or water pipes? All 84.5% 8.7% 2.3% 0.0% 4.6% 0.0%
Pipes? All 81.4% 0.0% 0.0% 8.0% 10.6% 0.0%
Some other way? All 90.0% 2.5% 2.7% 0.0% 2.4% 2.5%
©Copyright 2010, Texas A&M University
All rights reserved.
Secondary Report-Page 18 of 60
8/7/2019 MITCHELL COUNTY - Westbrook ISD - 2010 Texas School Survey of Drug and Alcohol Use
http://slidepdf.com/reader/full/mitchell-county-westbrook-isd-2010-texas-school-survey-of-drug-and-alcohol 19/60
Westbrook
SPRING 2010
Table D-13: How do your parents feel about kids your age using marijuana?
Strongly
Disapprove
Mildly
Disapprove Neither
Mildly
Approve
Strongly
Approve Don't know
All 78.5% 6.0% 4.6% 0.0% 7.0% 3.8%
Table D-14: How dangerous do you think it is for kids your age to use...
Very
Dangerous
Somewhat
Dangerous
Not very
Dangerous
Not at All
Dangerous Do Not Know
Marijuana?
All 58.5% 18.3% 13.6% 5.2% 4.4%
Cocaine?
All 80.0% 13.7% 0.0% 0.0% 6.2%
Crack?
All 80.8% 10.7% 0.0% 0.0% 8.5%
Ecstasy?
All 80.0% 10.6% 1.5% 1.5% 6.4%
Steroids?
All 61.1% 23.3% 3.7% 0.0% 11.9%
Heroin?
All 83.6% 5.2% 1.7% 0.0% 9.5%
©Copyright 2010, Texas A&M University
All rights reserved.
Secondary Report-Page 19 of 60
8/7/2019 MITCHELL COUNTY - Westbrook ISD - 2010 Texas School Survey of Drug and Alcohol Use
http://slidepdf.com/reader/full/mitchell-county-westbrook-isd-2010-texas-school-survey-of-drug-and-alcohol 20/60
Westbrook
SPRING 2010
Table D-15: How recently, if ever, have you taken...
Past
Month
School
Year
Ever
Used
Never
Used
Methamphetamine?
All 0.0% 1.7% 5.0% 95.0%
Table D-16: How recently, if ever, have you taken the following PRESCRIPTION DRUGS...
Past
Month
School
Year
Ever
Used
Never
Used
Codeine?
All 1.7% 4.9% 14.5% 85.5%
Oxycontin, Percodan or Percocet?
All 0.0% 0.0% 4.8% 95.2%
Vicodin, Lortab or Lorcet?
All 0.0% 1.9% 1.9% 98.1%
Valium or Diazepam?
All 0.0% 0.0% 0.0% 100.0%
Xanax or Alprazolam?
All 0.0% 0.0% 1.5% 98.5%
Table D-17: How recently, if ever, have you taken the following OVER-THE COUNTER drugs...
Past
Month
School
Year
Ever
Used
Never
Used
DXM, Triple C?
All 0.0% 1.6% 4.6% 95.4%
©Copyright 2010, Texas A&M University
All rights reserved.
Secondary Report-Page 20 of 60
8/7/2019 MITCHELL COUNTY - Westbrook ISD - 2010 Texas School Survey of Drug and Alcohol Use
http://slidepdf.com/reader/full/mitchell-county-westbrook-isd-2010-texas-school-survey-of-drug-and-alcohol 21/60
Westbrook
SPRING 2010
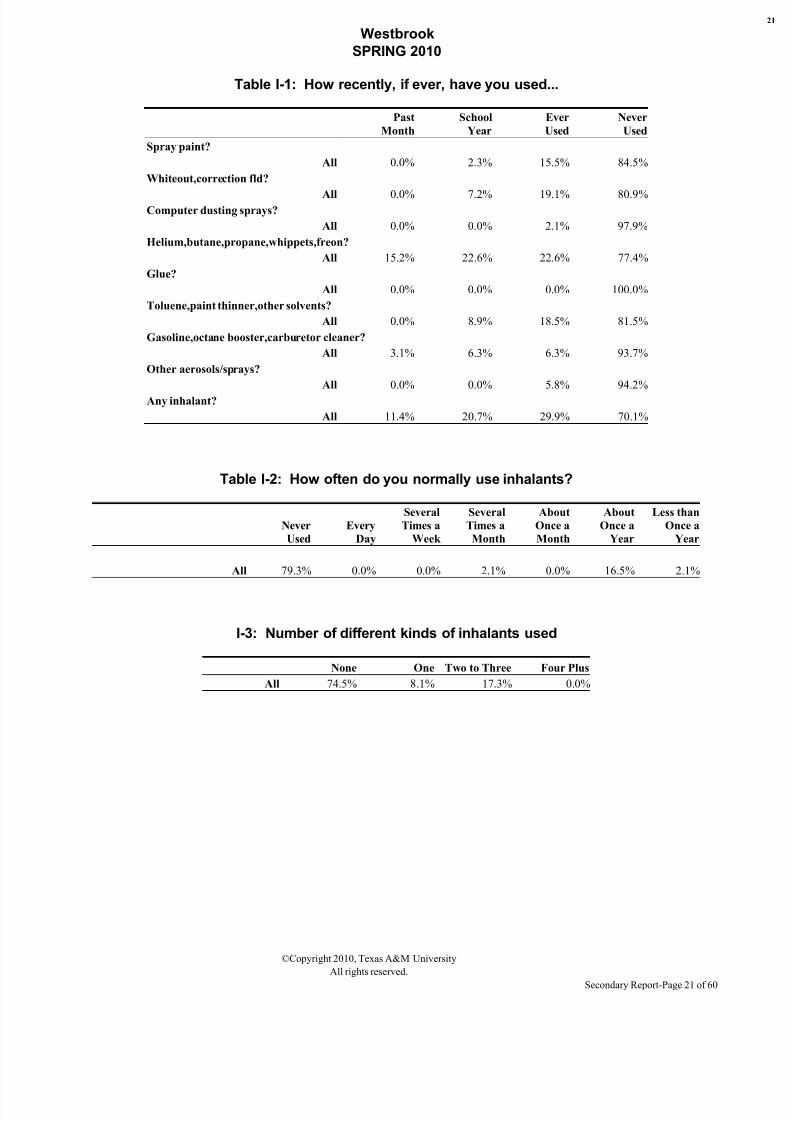
Table I-1: How recently, if ever, have you used...
Past
Month
School
Year
Ever
Used
Never
Used
Spray paint?
All 0.0% 2.3% 15.5% 84.5%
Whiteout,correction fld?
All 0.0% 7.2% 19.1% 80.9%Computer dusting sprays?
All 0.0% 0.0% 2.1% 97.9%
Helium,butane,propane,whippets,freon?
All 15.2% 22.6% 22.6% 77.4%
Glue?
All 0.0% 0.0% 0.0% 100.0%
Toluene,paint thinner,other solvents?
All 0.0% 8.9% 18.5% 81.5%
Gasoline,octane booster,carburetor cleaner?
All 3.1% 6.3% 6.3% 93.7%
Other aerosols/sprays?
All 0.0% 0.0% 5.8% 94.2%
Any inhalant?
All 11.4% 20.7% 29.9% 70.1%
Table I-2: How often do you normally use inhalants?
Never
Used
Every
Day
Several
Times a
Week
Several
Times a
Month
About
Once a
Month
About
Once a
Year
Less than
Once a
Year
All 79.3% 0.0% 0.0% 2.1% 0.0% 16.5% 2.1%
I-3: Number of different kinds of inhalants used
None One Two to Three Four Plus
All 74.5% 8.1% 17.3% 0.0%
©Copyright 2010, Texas A&M University
All rights reserved.
Secondary Report-Page 21 of 60
8/7/2019 MITCHELL COUNTY - Westbrook ISD - 2010 Texas School Survey of Drug and Alcohol Use
http://slidepdf.com/reader/full/mitchell-county-westbrook-isd-2010-texas-school-survey-of-drug-and-alcohol 22/60
Westbrook
SPRING 2010
Table I-4: Average age of first use of:
All
Inhalants
14.1
Table I-5: Since school began in the fall, on how many days (if any) have youattended class while high from inhalant use?
None 1-3 Times 4-9 Times 10+ Times
All 82.3% 12.0% 3.6% 2.1%
Table I-6: School year use of inhalants by absences and conduct problems:
Average days absent due toillness or other reasons
Inhalants Users: 6.2
Inhalants Non-use 6.0
Average days conduct problems
reported
Inhalants Users: 5.0
Inhalants Non-use 3.7
©Copyright 2010, Texas A&M University
All rights reserved.
Secondary Report-Page 22 of 60
8/7/2019 MITCHELL COUNTY - Westbrook ISD - 2010 Texas School Survey of Drug and Alcohol Use
http://slidepdf.com/reader/full/mitchell-county-westbrook-isd-2010-texas-school-survey-of-drug-and-alcohol 23/60
Westbrook
SPRING 2010
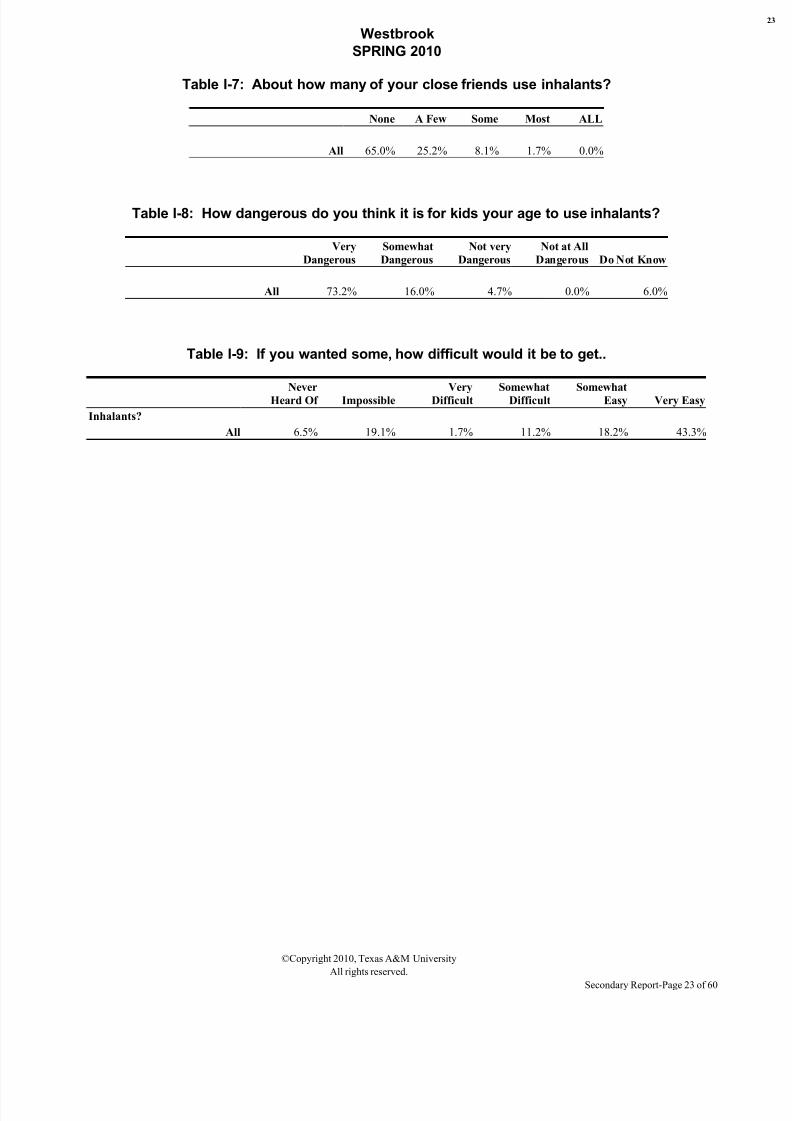
Table I-7: About how many of your close friends use inhalants?
None A Few Some Most ALL
All 65.0% 25.2% 8.1% 1.7% 0.0%
Table I-8: How dangerous do you think it is for kids your age to use inhalants?
Very
Dangerous
Somewhat
Dangerous
Not very
Dangerous
Not at All
Dangerous Do Not Know
All 73.2% 16.0% 4.7% 0.0% 6.0%
Table I-9: If you wanted some, how difficult would it be to get..
NeverHeard Of Impossible VeryDifficult SomewhatDifficult SomewhatEasy Very Easy
Inhalants?
All 6.5% 19.1% 1.7% 11.2% 18.2% 43.3%
©Copyright 2010, Texas A&M University
All rights reserved.
Secondary Report-Page 23 of 60
8/7/2019 MITCHELL COUNTY - Westbrook ISD - 2010 Texas School Survey of Drug and Alcohol Use
http://slidepdf.com/reader/full/mitchell-county-westbrook-isd-2010-texas-school-survey-of-drug-and-alcohol 24/60
Westbrook
SPRING 2010
Table X-1: Since school began in the fall, have you gotten any informationon drugs or alcohol from the following sources?
CATEGORY Yes
A school health class All 51.3%
An assembly program All 87.7%
Guidance counselor All 16.5%
Science class All 41.4%
Social studies class All 9.7%
Student group session All 7.6%
An invited school guest All 64.2%
Another source at school All 34.9%
Any school source All 74.0%
Table X-2: If you had a drug or alcohol problem and needed help, who would you go to?
CATEGORY Yes
Counselor/program in-school All 28.1%Another adult in school All 31.8%
Counselor/program outside-school All 26.2%
Your parents All 53.4%
A medical doctor All 34.7%
Your friends All 78.1%
Another adult All 63.4%
Table X-3: Since school began in the fall, have you sought help, other thanfrom family or friends, for problems in any way connected with your use of
alcohol, marijuana, or other drugs?
CATEGORY Yes
Seek Help All 6.1%
©Copyright 2010, Texas A&M University
All rights reserved.
Secondary Report-Page 24 of 60
8/7/2019 MITCHELL COUNTY - Westbrook ISD - 2010 Texas School Survey of Drug and Alcohol Use
http://slidepdf.com/reader/full/mitchell-county-westbrook-isd-2010-texas-school-survey-of-drug-and-alcohol 25/60
Westbrook
SPRING 2010
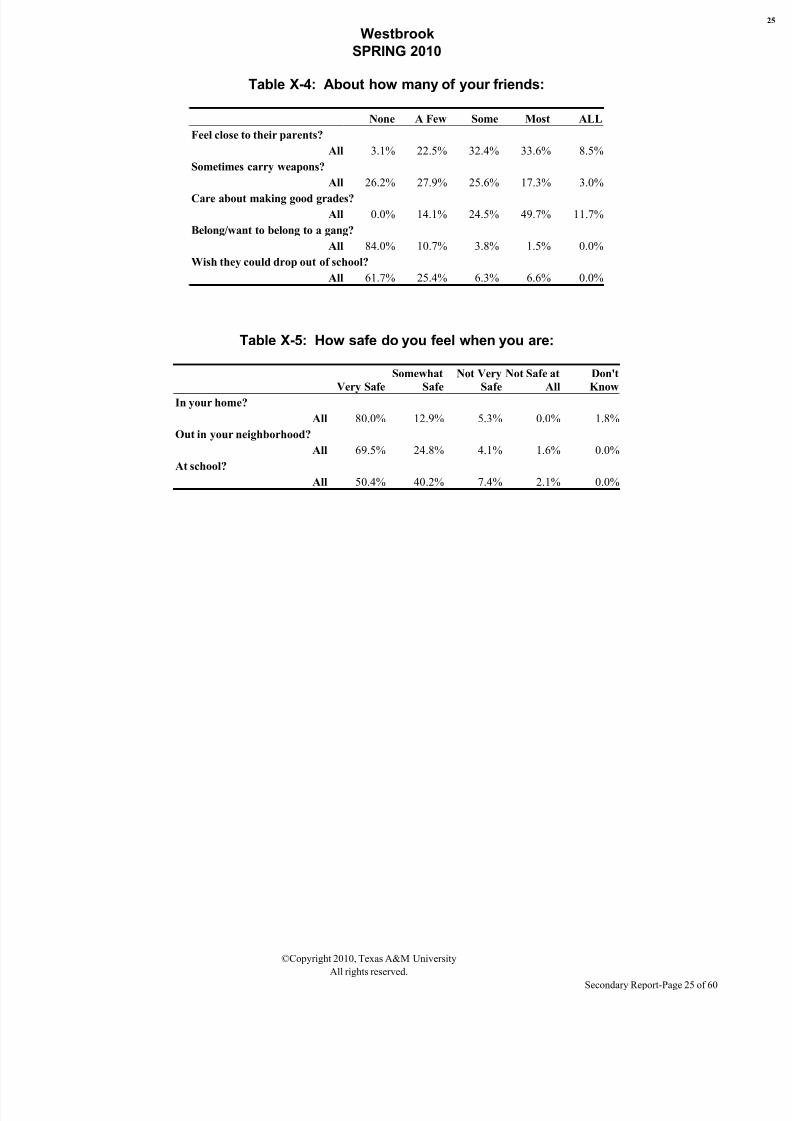
Table X-4: About how many of your friends:
None A Few Some Most ALL
Feel close to their parents?
All 3.1% 22.5% 32.4% 33.6% 8.5%
Sometimes carry weapons?
All 26.2% 27.9% 25.6% 17.3% 3.0%
Care about making good grades?
All 0.0% 14.1% 24.5% 49.7% 11.7%
Belong/want to belong to a gang?
All 84.0% 10.7% 3.8% 1.5% 0.0%
Wish they could drop out of school?
All 61.7% 25.4% 6.3% 6.6% 0.0%
Table X-5: How safe do you feel when you are:
Very Safe
Somewhat
Safe
Not Very
Safe
Not Safe at
All
Don't
KnowIn your home?
All 80.0% 12.9% 5.3% 0.0% 1.8%
Out in your neighborhood?
All 69.5% 24.8% 4.1% 1.6% 0.0%
At school?
All 50.4% 40.2% 7.4% 2.1% 0.0%
©Copyright 2010, Texas A&M University
All rights reserved.
Secondary Report-Page 25 of 60
8/7/2019 MITCHELL COUNTY - Westbrook ISD - 2010 Texas School Survey of Drug and Alcohol Use
http://slidepdf.com/reader/full/mitchell-county-westbrook-isd-2010-texas-school-survey-of-drug-and-alcohol 26/60
Westbrook
SPRING 2010
©Copyright 2010, Texas A&M University
All rights reserved.
Secondary Report-Page 26 of 60
8/7/2019 MITCHELL COUNTY - Westbrook ISD - 2010 Texas School Survey of Drug and Alcohol Use
http://slidepdf.com/reader/full/mitchell-county-westbrook-isd-2010-texas-school-survey-of-drug-and-alcohol 27/60
Westbrook
SPRING 2010
2. Prevalence Tables
©Copyright 2010, Texas A&M University
All rights reserved.
Secondary Report-Page 27 of 60
8/7/2019 MITCHELL COUNTY - Westbrook ISD - 2010 Texas School Survey of Drug and Alcohol Use
http://slidepdf.com/reader/full/mitchell-county-westbrook-isd-2010-texas-school-survey-of-drug-and-alcohol 28/60
8/7/2019 MITCHELL COUNTY - Westbrook ISD - 2010 Texas School Survey of Drug and Alcohol Use
http://slidepdf.com/reader/full/mitchell-county-westbrook-isd-2010-texas-school-survey-of-drug-and-alcohol 29/60
Westbrook
SPRING 2010
Table B1: Prevalence and recency of use of selected substances by gradeAll students
Past
Month
School
Year
Ever
Used
Never
Used
Tobacco
All 21.1% 31.3% 43.3% 56.7%
AlcoholAll 34.5% 52.4% 78.3% 21.7%
Inhalants
All 11.4% 20.7% 29.9% 70.1%
Any Illicit Drug
All 9.1% 18.4% 24.5% 75.5%
Marijuana
All 7.6% 15.0% 24.8% 75.2%
Marijuana Only
All 3.2% 4.8% 7.7% 92.3%
Cocaine or Crack
All 0.0% 3.9% 3.9% 96.1%
Cocaine
All 0.0% 4.1% 4.1% 95.9%
Crack
All 0.0% 0.0% 0.0% 100.0%
Hallucinogens
All 4.1% 8.3% 10.1% 89.9%
Uppers
All 2.0% 9.2% 14.3% 85.7%
Downers
All 3.7% 8.2% 10.5% 89.5%
Rohypnol
All 0.0% 0.0% 1.8% 98.2%
Steroids
All 0.0% 0.0% 0.0% 100.0%
Ecstasy
All 0.0% 2.0% 6.8% 93.2%
Heroin
All 0.0% 0.0% 2.3% 97.7%
©Copyright 2010, Texas A&M University
All rights reserved.
Secondary Report-Page 29 of 60
8/7/2019 MITCHELL COUNTY - Westbrook ISD - 2010 Texas School Survey of Drug and Alcohol Use
http://slidepdf.com/reader/full/mitchell-county-westbrook-isd-2010-texas-school-survey-of-drug-and-alcohol 30/60
Westbrook
SPRING 2010
Table B2: Prevalence and recency of use of selected substances by gradeMale students
Past
Month
School
Year
Ever
Used
Never
Used
Tobacco
All 33.6% 48.2% 69.2% 30.8%
AlcoholAll 41.5% 61.5% 81.9% 18.1%
Inhalants
All 20.4% 30.1% 39.5% 60.5%
Any Illicit Drug
All 17.0% 31.4% 40.4% 59.6%
Marijuana
All 14.3% 28.3% 43.9% 56.1%
Marijuana Only
All 6.0% 9.0% 11.9% 88.1%
Cocaine or Crack
All 0.0% 7.5% 7.5% 92.5%
Cocaine
All 0.0% 7.5% 7.5% 92.5%
Crack
All 0.0% 0.0% 0.0% 100.0%
Hallucinogens
All 8.4% 16.9% 20.7% 79.3%
Uppers
All 3.6% 12.7% 22.1% 77.9%
Downers
All 6.6% 10.7% 14.9% 85.1%
Rohypnol
All 0.0% 0.0% 3.7% 96.3%
Steroids
All 0.0% 0.0% 0.0% 100.0%
Ecstasy
All 0.0% 4.4% 14.7% 85.3%
Heroin
All 0.0% 0.0% 4.2% 95.8%
©Copyright 2010, Texas A&M University
All rights reserved.
Secondary Report-Page 30 of 60
8/7/2019 MITCHELL COUNTY - Westbrook ISD - 2010 Texas School Survey of Drug and Alcohol Use
http://slidepdf.com/reader/full/mitchell-county-westbrook-isd-2010-texas-school-survey-of-drug-and-alcohol 31/60
Westbrook
SPRING 2010
Table B3: Prevalence and recency of use of selected substances by gradeFemale students
Past
Month
School
Year
Ever
Used
Never
Used
Tobacco
All 4.7% 9.0% 9.0% 91.0%
AlcoholAll 26.5% 41.7% 74.1% 25.9%
Inhalants
All 0.0% 8.6% 17.5% 82.5%
Any Illicit Drug
All 0.0% 3.3% 6.1% 93.9%
Marijuana
All 0.0% 0.0% 3.2% 96.8%
Marijuana Only
All 0.0% 0.0% 2.8% 97.2%
Cocaine or Crack
All 0.0% 0.0% 0.0% 100.0%
Cocaine
All 0.0% 0.0% 0.0% 100.0%
Crack
All 0.0% 0.0% 0.0% 100.0%
Hallucinogens
All 0.0% 0.0% 0.0% 100.0%
Uppers
All 0.0% 5.0% 5.0% 95.0%
Downers
All 0.0% 5.0% 5.0% 95.0%
Rohypnol
All 0.0% 0.0% 0.0% 100.0%
Steroids
All 0.0% 0.0% 0.0% 100.0%
Ecstasy
All 0.0% 0.0% 0.0% 100.0%
Heroin
All 0.0% 0.0% 0.0% 100.0%
©Copyright 2010, Texas A&M University
All rights reserved.
Secondary Report-Page 31 of 60
8/7/2019 MITCHELL COUNTY - Westbrook ISD - 2010 Texas School Survey of Drug and Alcohol Use
http://slidepdf.com/reader/full/mitchell-county-westbrook-isd-2010-texas-school-survey-of-drug-and-alcohol 32/60
Westbrook
SPRING 2010
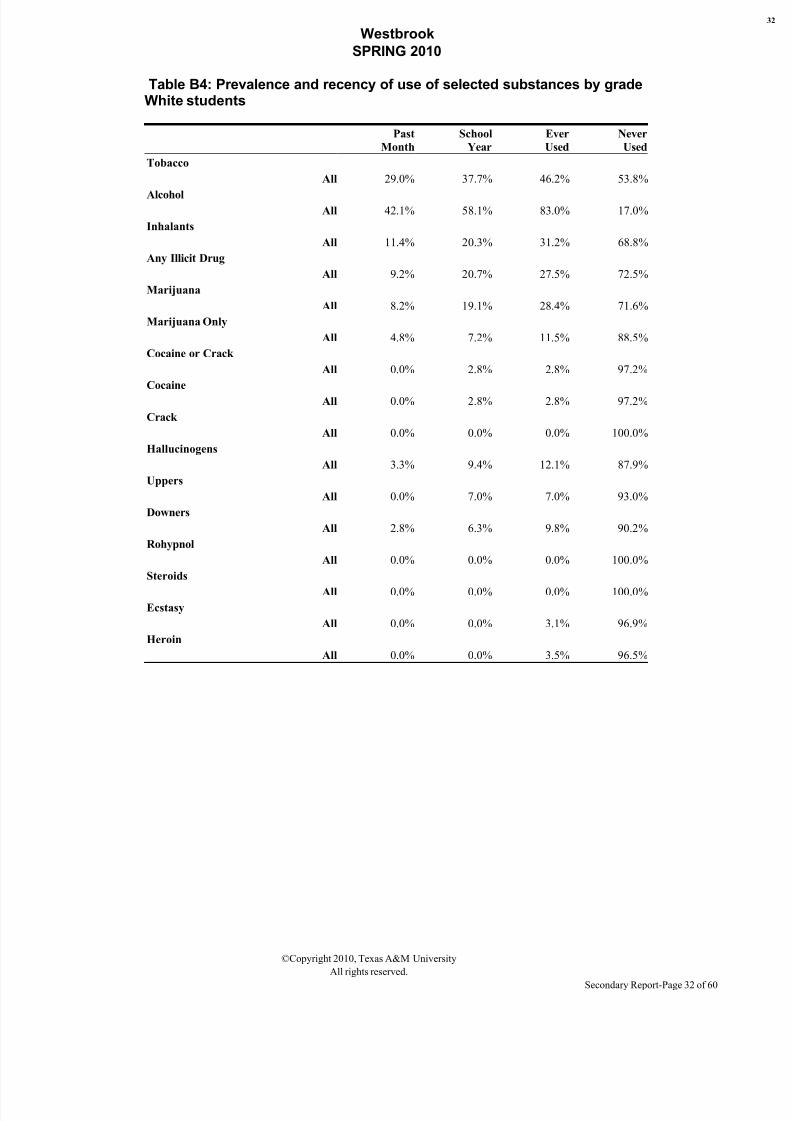
Table B4: Prevalence and recency of use of selected substances by gradeWhite students
Past
Month
School
Year
Ever
Used
Never
Used
Tobacco
All 29.0% 37.7% 46.2% 53.8%
AlcoholAll 42.1% 58.1% 83.0% 17.0%
Inhalants
All 11.4% 20.3% 31.2% 68.8%
Any Illicit Drug
All 9.2% 20.7% 27.5% 72.5%
Marijuana
All 8.2% 19.1% 28.4% 71.6%
Marijuana Only
All 4.8% 7.2% 11.5% 88.5%
Cocaine or Crack
All 0.0% 2.8% 2.8% 97.2%
Cocaine
All 0.0% 2.8% 2.8% 97.2%
Crack
All 0.0% 0.0% 0.0% 100.0%
Hallucinogens
All 3.3% 9.4% 12.1% 87.9%
Uppers
All 0.0% 7.0% 7.0% 93.0%
Downers
All 2.8% 6.3% 9.8% 90.2%
Rohypnol
All 0.0% 0.0% 0.0% 100.0%
Steroids
All 0.0% 0.0% 0.0% 100.0%
Ecstasy
All 0.0% 0.0% 3.1% 96.9%
Heroin
All 0.0% 0.0% 3.5% 96.5%
©Copyright 2010, Texas A&M University
All rights reserved.
Secondary Report-Page 32 of 60
8/7/2019 MITCHELL COUNTY - Westbrook ISD - 2010 Texas School Survey of Drug and Alcohol Use
http://slidepdf.com/reader/full/mitchell-county-westbrook-isd-2010-texas-school-survey-of-drug-and-alcohol 33/60
Westbrook
SPRING 2010
Table B5: Prevalence and recency of use of selected substances by gradeBlack students
Table skipped because an insufficient number of cases.
©Copyright 2010, Texas A&M University
All rights reserved.
Secondary Report-Page 33 of 60
8/7/2019 MITCHELL COUNTY - Westbrook ISD - 2010 Texas School Survey of Drug and Alcohol Use
http://slidepdf.com/reader/full/mitchell-county-westbrook-isd-2010-texas-school-survey-of-drug-and-alcohol 34/60
Westbrook
SPRING 2010
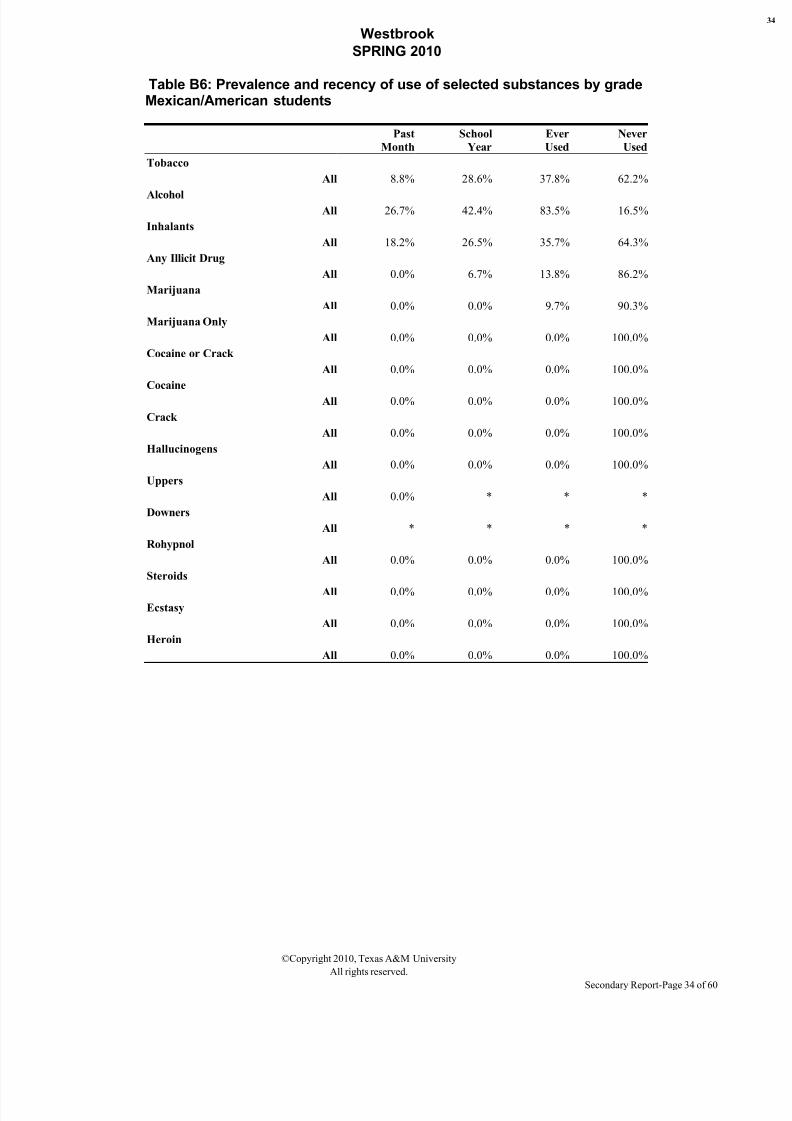
Table B6: Prevalence and recency of use of selected substances by gradeMexican/American students
Past
Month
School
Year
Ever
Used
Never
Used
Tobacco
All 8.8% 28.6% 37.8% 62.2%
AlcoholAll 26.7% 42.4% 83.5% 16.5%
Inhalants
All 18.2% 26.5% 35.7% 64.3%
Any Illicit Drug
All 0.0% 6.7% 13.8% 86.2%
Marijuana
All 0.0% 0.0% 9.7% 90.3%
Marijuana Only
All 0.0% 0.0% 0.0% 100.0%
Cocaine or Crack
All 0.0% 0.0% 0.0% 100.0%
Cocaine
All 0.0% 0.0% 0.0% 100.0%
Crack
All 0.0% 0.0% 0.0% 100.0%
Hallucinogens
All 0.0% 0.0% 0.0% 100.0%
Uppers
All 0.0% * * *
Downers
All * * * *
Rohypnol
All 0.0% 0.0% 0.0% 100.0%
Steroids
All 0.0% 0.0% 0.0% 100.0%
Ecstasy
All 0.0% 0.0% 0.0% 100.0%
Heroin
All 0.0% 0.0% 0.0% 100.0%
©Copyright 2010, Texas A&M University
All rights reserved.
Secondary Report-Page 34 of 60
8/7/2019 MITCHELL COUNTY - Westbrook ISD - 2010 Texas School Survey of Drug and Alcohol Use
http://slidepdf.com/reader/full/mitchell-county-westbrook-isd-2010-texas-school-survey-of-drug-and-alcohol 35/60
Westbrook
SPRING 2010
Table B7: Prevalence and recency of use of selected substances by gradeStudents reporting A grades
Past
Month
School
Year
Ever
Used
Never
Used
Tobacco
All 21.5% 30.3% 33.9% 66.1%
AlcoholAll 42.3% 60.1% 83.1% 16.9%
Inhalants
All 14.9% 25.5% 29.0% 71.0%
Any Illicit Drug
All 5.5% 15.1% 23.9% 76.1%
Marijuana
All 3.3% 13.6% 26.1% 73.9%
Marijuana Only
All 3.0% 6.1% 11.8% 88.2%
Cocaine or Crack
All 0.0% 3.5% 3.5% 96.5%
Cocaine
All 0.0% 3.6% 3.6% 96.4%
Crack
All 0.0% 0.0% 0.0% 100.0%
Hallucinogens
All 3.5% 7.8% 7.8% 92.2%
Uppers
All 3.8% 13.4% 18.1% 81.9%
Downers
All 3.3% 7.5% 11.6% 88.4%
Rohypnol
All 0.0% 0.0% 3.1% 96.9%
Steroids
All 0.0% 0.0% 0.0% 100.0%
Ecstasy
All 0.0% 3.9% 3.9% 96.1%
Heroin
All 0.0% 0.0% 0.0% 100.0%
©Copyright 2010, Texas A&M University
All rights reserved.
Secondary Report-Page 35 of 60
8/7/2019 MITCHELL COUNTY - Westbrook ISD - 2010 Texas School Survey of Drug and Alcohol Use
http://slidepdf.com/reader/full/mitchell-county-westbrook-isd-2010-texas-school-survey-of-drug-and-alcohol 36/60
Westbrook
SPRING 2010
Table B8: Prevalence and recency of use of selected substances by gradeStudents reporting grades lower than A
Past
Month
School
Year
Ever
Used
Never
Used
Tobacco
All 20.7% 32.4% 53.4% 46.6%
AlcoholAll 26.9% 44.9% 73.7% 26.3%
Inhalants
All 7.9% 15.6% 30.8% 69.2%
Any Illicit Drug
All 12.8% 21.8% 25.1% 74.9%
Marijuana
All 12.7% 16.7% 23.3% 76.7%
Marijuana Only
All 3.5% 3.5% 3.5% 96.5%
Cocaine or Crack
All 0.0% 4.4% 4.4% 95.6%
Cocaine
All 0.0% 4.6% 4.6% 95.4%
Crack
All 0.0% 0.0% 0.0% 100.0%
Hallucinogens
All 4.8% 8.7% 12.6% 87.4%
Uppers
All 0.0% 4.8% 10.1% 89.9%
Downers
All 4.2% 9.2% 9.2% 90.8%
Rohypnol
All 0.0% 0.0% 0.0% 100.0%
Steroids
All 0.0% 0.0% 0.0% 100.0%
Ecstasy
All 0.0% 0.0% 9.9% 90.1%
Heroin
All 0.0% 0.0% 4.7% 95.3%
©Copyright 2010, Texas A&M University
All rights reserved.
Secondary Report-Page 36 of 60
8/7/2019 MITCHELL COUNTY - Westbrook ISD - 2010 Texas School Survey of Drug and Alcohol Use
http://slidepdf.com/reader/full/mitchell-county-westbrook-isd-2010-texas-school-survey-of-drug-and-alcohol 37/60
Westbrook
SPRING 2010
Table B9: Prevalence and recency of use of selected substances by gradeStudents living with two parents
Past
Month
School
Year
Ever
Used
Never
Used
Tobacco
All 21.8% 31.0% 35.4% 64.6%
AlcoholAll 37.1% 47.5% 78.8% 21.2%
Inhalants
All 15.5% 19.1% 26.2% 73.8%
Any Illicit Drug
All 2.7% 12.4% 22.4% 77.6%
Marijuana
All 0.0% 7.6% 18.3% 81.7%
Marijuana Only
All 0.0% 3.3% 6.6% 93.4%
Cocaine or Crack
All 0.0% 0.0% 0.0% 100.0%
Cocaine
All 0.0% 0.0% 0.0% 100.0%
Crack
All 0.0% 0.0% 0.0% 100.0%
Hallucinogens
All 0.0% 0.0% 3.8% 96.2%
Uppers
All 0.0% 11.1% 16.9% 83.1%
Downers
All 3.8% 8.3% 13.1% 86.9%
Rohypnol
All 0.0% 0.0% 0.0% 100.0%
Steroids
All 0.0% 0.0% 0.0% 100.0%
Ecstasy
All 0.0% 0.0% 4.1% 95.9%
Heroin
All 0.0% 0.0% 0.0% 100.0%
©Copyright 2010, Texas A&M University
All rights reserved.
Secondary Report-Page 37 of 60
8/7/2019 MITCHELL COUNTY - Westbrook ISD - 2010 Texas School Survey of Drug and Alcohol Use
http://slidepdf.com/reader/full/mitchell-county-westbrook-isd-2010-texas-school-survey-of-drug-and-alcohol 38/60
Westbrook
SPRING 2010
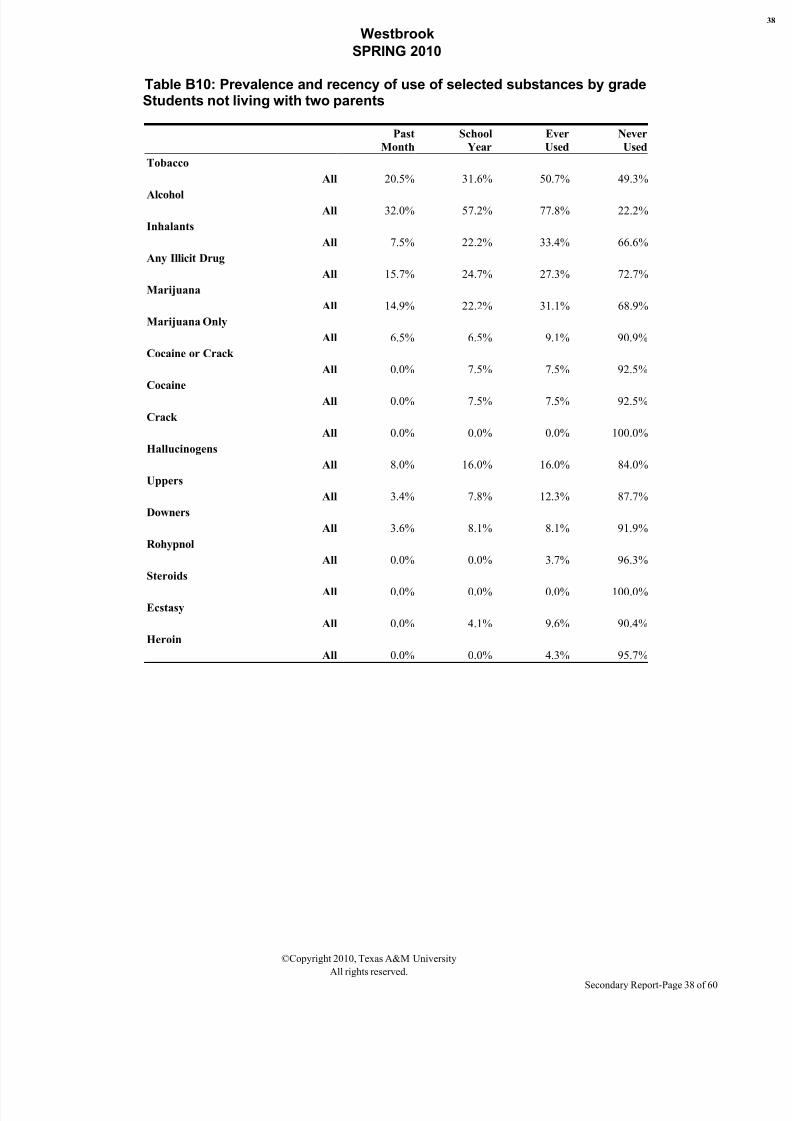
Table B10: Prevalence and recency of use of selected substances by gradeStudents not living with two parents
Past
Month
School
Year
Ever
Used
Never
Used
Tobacco
All 20.5% 31.6% 50.7% 49.3%
AlcoholAll 32.0% 57.2% 77.8% 22.2%
Inhalants
All 7.5% 22.2% 33.4% 66.6%
Any Illicit Drug
All 15.7% 24.7% 27.3% 72.7%
Marijuana
All 14.9% 22.2% 31.1% 68.9%
Marijuana Only
All 6.5% 6.5% 9.1% 90.9%
Cocaine or Crack
All 0.0% 7.5% 7.5% 92.5%
Cocaine
All 0.0% 7.5% 7.5% 92.5%
Crack
All 0.0% 0.0% 0.0% 100.0%
Hallucinogens
All 8.0% 16.0% 16.0% 84.0%
Uppers
All 3.4% 7.8% 12.3% 87.7%
Downers
All 3.6% 8.1% 8.1% 91.9%
Rohypnol
All 0.0% 0.0% 3.7% 96.3%
Steroids
All 0.0% 0.0% 0.0% 100.0%
Ecstasy
All 0.0% 4.1% 9.6% 90.4%
Heroin
All 0.0% 0.0% 4.3% 95.7%
©Copyright 2010, Texas A&M University
All rights reserved.
Secondary Report-Page 38 of 60
8/7/2019 MITCHELL COUNTY - Westbrook ISD - 2010 Texas School Survey of Drug and Alcohol Use
http://slidepdf.com/reader/full/mitchell-county-westbrook-isd-2010-texas-school-survey-of-drug-and-alcohol 39/60
Westbrook
SPRING 2010
Table B11: Prevalence and recency of use of selected substances by gradeStudents would seek help from adults for substance abuse problems
Past
Month
School
Year
Ever
Used
Never
Used
Tobacco
All 24.3% 32.6% 42.4% 57.6%
AlcoholAll 36.1% 52.2% 78.6% 21.4%
Inhalants
All 12.0% 18.7% 25.8% 74.2%
Any Illicit Drug
All 10.2% 16.3% 24.3% 75.7%
Marijuana
All 9.2% 13.8% 22.0% 78.0%
Marijuana Only
All 4.2% 4.2% 8.0% 92.0%
Cocaine or Crack
All 0.0% 2.5% 2.5% 97.5%
Cocaine
All 0.0% 2.6% 2.6% 97.4%
Crack
All 0.0% 0.0% 0.0% 100.0%
Hallucinogens
All 5.1% 5.1% 5.1% 94.9%
Uppers
All 2.5% 8.5% 14.9% 85.1%
Downers
All 2.4% 5.2% 8.1% 91.9%
Rohypnol
All 0.0% 0.0% 2.2% 97.8%
Steroids
All 0.0% 0.0% 0.0% 100.0%
Ecstasy
All 0.0% 2.5% 5.7% 94.3%
Heroin
All 0.0% 0.0% 3.0% 97.0%
©Copyright 2010, Texas A&M University
All rights reserved.
Secondary Report-Page 39 of 60
8/7/2019 MITCHELL COUNTY - Westbrook ISD - 2010 Texas School Survey of Drug and Alcohol Use
http://slidepdf.com/reader/full/mitchell-county-westbrook-isd-2010-texas-school-survey-of-drug-and-alcohol 40/60
8/7/2019 MITCHELL COUNTY - Westbrook ISD - 2010 Texas School Survey of Drug and Alcohol Use
http://slidepdf.com/reader/full/mitchell-county-westbrook-isd-2010-texas-school-survey-of-drug-and-alcohol 41/60
Westbrook
SPRING 2010
Table B13: Prevalence and recency of use of selected substances by gradeStudents living in town three years or less
Past
Month
School
Year
Ever
Used
Never
Used
Tobacco
All 16.8% 25.6% 34.5% 65.5%
AlcoholAll 46.9% 88.0% 100.0% *
Inhalants
All 6.8% 26.3% 33.2% 66.8%
Any Illicit Drug
All 11.8% 18.3% 42.5% 57.5%
Marijuana
All 7.2% 14.0% 38.6% 61.4%
Marijuana Only
All 0.0% 0.0% 11.4% 88.6%
Cocaine or Crack
All 0.0% 14.8% 14.8% 85.2%
Cocaine
All 0.0% 16.0% 16.0% 84.0%
Crack
All 0.0% 0.0% 0.0% 100.0%
Hallucinogens
All 7.4% 16.7% 16.7% 83.3%
Uppers
All 7.5% 16.8% 35.9% 64.1%
Downers
All 5.5% 12.3% 12.3% 87.7%
Rohypnol
All 0.0% 0.0% 5.5% 94.5%
Steroids
All 0.0% 0.0% 0.0% 100.0%
Ecstasy
All 0.0% 7.5% 17.3% 82.7%
Heroin
All 0.0% 0.0% 0.0% 100.0%
©Copyright 2010, Texas A&M University
All rights reserved.
Secondary Report-Page 41 of 60
8/7/2019 MITCHELL COUNTY - Westbrook ISD - 2010 Texas School Survey of Drug and Alcohol Use
http://slidepdf.com/reader/full/mitchell-county-westbrook-isd-2010-texas-school-survey-of-drug-and-alcohol 42/60
Westbrook
SPRING 2010
Table B14: Prevalence and recency of use of selected substances by gradeStudents living in town more than three years
Past
Month
School
Year
Ever
Used
Never
Used
Tobacco
All 22.5% 33.1% 46.0% 54.0%
AlcoholAll 30.1% 39.7% 70.6% 29.4%
Inhalants
All 13.2% 18.5% 28.6% 71.4%
Any Illicit Drug
All 8.3% 18.7% 18.7% 81.3%
Marijuana
All 7.9% 15.8% 20.0% 80.0%
Marijuana Only
All 4.4% 6.6% 6.6% 93.4%
Cocaine or Crack
All 0.0% 0.0% 0.0% 100.0%
Cocaine
All 0.0% 0.0% 0.0% 100.0%
Crack
All 0.0% 0.0% 0.0% 100.0%
Hallucinogens
All 3.0% 5.5% 7.9% 92.1%
Uppers
All 0.0% 6.5% 6.5% 93.5%
Downers
All 2.8% 6.1% 9.6% 90.4%
Rohypnol
All 0.0% 0.0% 0.0% 100.0%
Steroids
All 0.0% 0.0% 0.0% 100.0%
Ecstasy
All 0.0% 0.0% 2.8% 97.2%
Heroin
All 0.0% 0.0% 3.1% 96.9%
©Copyright 2010, Texas A&M University
All rights reserved.
Secondary Report-Page 42 of 60
8/7/2019 MITCHELL COUNTY - Westbrook ISD - 2010 Texas School Survey of Drug and Alcohol Use
http://slidepdf.com/reader/full/mitchell-county-westbrook-isd-2010-texas-school-survey-of-drug-and-alcohol 43/60
Westbrook
SPRING 2010
3. Margin Tables
©Copyright 2010, Texas A&M University
All rights reserved.
Secondary Report-Page 43 of 60
8/7/2019 MITCHELL COUNTY - Westbrook ISD - 2010 Texas School Survey of Drug and Alcohol Use
http://slidepdf.com/reader/full/mitchell-county-westbrook-isd-2010-texas-school-survey-of-drug-and-alcohol 44/60
Westbrook
SPRING 2010
©Copyright 2010, Texas A&M University
All rights reserved.
Secondary Report-Page 44 of 60
8/7/2019 MITCHELL COUNTY - Westbrook ISD - 2010 Texas School Survey of Drug and Alcohol Use
http://slidepdf.com/reader/full/mitchell-county-westbrook-isd-2010-texas-school-survey-of-drug-and-alcohol 45/60
Westbrook
Spring 2010
The FREQ Procedure
GENDER
q1 Frequency Percent
Female 29 46.34
Male 33 53.66
GRADE
q2 Frequency Percent
Grade 7 16 25.53
Grade 8 9 14.32
Grade 9 13 20.68
Grade 10 7 12.15
Grade 11 9 14.64
Grade 12 8 12.69
LIVE WITH BOTH
PARENTS
q3 Frequency PercentNo 31 50.68
Yes 30 49.32
Frequency Missing = 1.0035211268
AGE
q4 Frequency Percent
12 4 6.81
13 11 17.52
14 9 14.51
15 13 21.5516 11 17.17
17 7 11.88
18 7 10.57
ETHNICITY
q5 Frequency Percent
?? 1 1.52
African/American 2 3.00
Asian/American 1 2.11
Mexican/American 14 22.80
Native/American 2 3.82
White 41 66.74
ON AVERAGE WHAT
GRADES DO YOU GET
q6 Frequency Percent
Mostly A's 31 50.87
Mostly B's 25 39.94
Mostly C's 5 7.49
Mostly D's 1 1.70
LENGTH OF TIME IN
THIS DISTRICT
q7 Frequency Percent
<1 year 9 14.51
2-3 years 7 11.18
>4 years 45 74.31
Frequency Missing = 0.8028169014
DO YOU HAVE AJOB
q8 Frequency Percent
No 41 66.43
Yes 21 33.57
DO YOU GET AN
ALLOWANCE
q9 Frequency Percent
No 42 68.96
Yes 19 31.04
Frequency Missing = 0.8028169014
EITHER PARENT COLLEGE
GRADUATE
q10 Frequency Percent
Don't Know 9 14.49
No 22 36.69
Yes 30 48.82
Frequency Missing = 0.9812206573
QUALIFY FOR
FREE/REDUCED PRICE
LUNCH
q11 Frequency Percen
Don't Know 22 36.19
No 27 44.43
Yes 12 19.38
Frequency Missing = 0.98122065
PARTICIPATE IN
SCHOOL ATHLETICS
q12a Frequency Percent
No 2 3.11
Yes 60 96.89
PARTICIPATE IN
SCHOOL
BAND/ORCHESTRA
q12b Frequency Percent
No 52 100.00
Frequency Missing = 9.68355001
PARTICIPATE IN
SCHOOL CHOIR
q12c Frequency Percent
No 49 98.14
Yes 1 1.86
Frequency Missing = 11.4229866
PARTICIPATE IN
DRAMA/SPEECH/ART
CLUBS
q12d Frequency Percent
No 45 83.58
Yes 9 16.42
Frequency Missing = 8.10193210
The frequencies have been weighted so that the analysis reflects
the distribution of students by grade level in the district
©Copyright 2010, Texas A&M University
All rights reserved.
Page 45 of 60
8/7/2019 MITCHELL COUNTY - Westbrook ISD - 2010 Texas School Survey of Drug and Alcohol Use
http://slidepdf.com/reader/full/mitchell-county-westbrook-isd-2010-texas-school-survey-of-drug-and-alcohol 46/60
Westbrook
Spring 2010
PARTICIPATE IN DRILL
TEAM/CHEERLEADING
q12e Frequency Percent
No 40 73.94
Yes 14 26.06
Frequency Missing = 8.1096514987
PARTICIPATE IN
STUDENT
GOVERNMENT
q12f Frequency Percent
No 43 84.24
Yes 8 15.76
Frequency Missing = 10.163010112
PARTICIPATE IN SCHOOLNEWSPAPER/YEARBOOK
q12g Frequency Percent
No 44 79.79
Yes 11 20.21
Frequency Missing = 7.0743950885
PARTICIPATE IN
ACADEMIC
CLUBS/SOCIETIES
q12h Frequency PercentNo 41 78.03
Yes 12 21.97
Frequency Missing = 8.6800288913
PARTICIPATE IN
ACADEMIC
COMPETITION
GROUPS
q12i Frequency Percent
No 21 36.64
Yes 37 63.36
Frequency Missing = 3.9265980498
PARTICIPATE IN
SCHOOL SERVICE
CLUBS
q12j Frequency Percent
No 48 92.52
Yes 4 7.48
Frequency Missing = 9.4828457927
PARTICIPATE IN
OTHER SCHOOL
CLUBS OR GROUPS
q12k Frequency Percent
No 40 74.58
Yes 14 25.42
Frequency Missing = 7.6765077645
PARTICIPATE IN
ATHLETIC TEAMS
OUTSIDE OF SCHOOL
q12l Frequency Percent
No 22 38.45
Yes 34 61.55
Frequency Missing = 5.7123510293
PARTICIPATE IN
OTHER CLUBS OR
GROUPS OUTSIDE OF
SCHOOL
q12m Frequency Percent
No 29 54.73
Yes 24 45.27
Frequency Missing = 9.4605453232
DO YOU FEEL SAFE IN YOUR
HOME
q13a Frequency Percent
Very Safe 42 80.01
Somewhat Safe 7 12.91
Not Very Safe 3 5.29
Don't Know 1 1.79
Frequency Missing = 9.4553990
DO YOU FEEL SAFE IN YOU
NEIGHBORHOO
q13b Frequency Perce
Very Safe 35 69.
Somewhat Safe 12 24.
Not Very Safe 2 4.
Not Safe At All 1 1.
Frequency Missing = 11.7780787
DO YOU FEEL SAFE A
SCHOO
q13c Frequency Perce
Very Safe 26 50.
Somewhat Safe 21 40.
Not Very Safe 4 7.
Not Safe At All 1 2.
Frequency Missing = 10.605588
FRIENDS FEELING
CLOSE TO THEIR
PARENTS
q14a Frequency Percent
None 2 3.09
A Few 13 22.46
Some 19 32.41
Most 20 33.58
All 5 8.46
Frequency Missing = 1.80633802
HOW MANY FRIENDS
CARRY WEAPONS
q14b Frequency Percent
None 14 26.17
A Few 15 27.92
Some 14 25.59
Most 9 17.30All 2 3.03
Frequency Missing = 8.63028169
The frequencies have been weighted so that the analysis reflects
the distribution of students by grade level in the district
©Copyright 2010, Texas A&M University
All rights reserved.
Page 46 of 60
8/7/2019 MITCHELL COUNTY - Westbrook ISD - 2010 Texas School Survey of Drug and Alcohol Use
http://slidepdf.com/reader/full/mitchell-county-westbrook-isd-2010-texas-school-survey-of-drug-and-alcohol 47/60
Westbrook
Spring 2010
HOW MANY FRIENDS
CARE ABOUT GOOD
GRADES
q14c Frequency Percent
A Few 7 14.11
Some 12 24.51
Most 25 49.65
All 6 11.73
Frequency Missing = 10.882629108
HOW MANY FRIENDS
BELONG TO A GANG
q14d Frequency Percent
None 45 83.97
A Few 6 10.69
Some 2 3.83
Most 1 1.51
Frequency Missing = 8.6654478151
FRIENDS WISHING TO
DROP OUT OF
SCHOOL
q14e Frequency Percent
None 29 61.72
A Few 12 25.41
Some 3 6.31
Most 3 6.55
Frequency Missing = 14.675424341
PARENTS ATTEND
PTA/SCHOOL OPEN
HOUSES
q15 Frequency Percent
No 22 41.69
Yes 30 58.31
Frequency Missing = 9.5034308415
RECENT INHALANT USE - SPRAY
PAINT
Q16A Frequency Percent
Never Heard/Used 37 84.48
In Your Lifetime 6 13.25
Since School Began 1 2.27
Frequency Missing = 17.552184904
RECENT INHALANT USE -
WHITEOUT, CORRECTION FLUID,
MAGIC MARKERS
Q16B Frequency Percent
Never Heard/Used 33 80.90
In Your Lifetime 5 11.92
Since School Began 3 7.18
Frequency Missing = 21.246343445
RECENT INHALANT USE -
COMPUTER DUSTING SPRAYS
Q16C Frequency Percent
Never Heard/Used 37 97.86
In Your Lifetime 1 2.14
Frequency Missing = 24.10251896
RECENT INHALANT USE - HELIUM,
BUTANE, PROPANE, WHIPPETS,REFRIGERANTS/FREON
Q16D Frequency Percent
Never Heard/Used 30 77.38
Since School Began 3 7.39
In the Past Month 6 15.22
Frequency Missing = 22.418833514
RECENT INHALANT USE - GLUE
Q16E Frequency Percent
Never Heard/Used 35 100.00
Frequency Missing = 26.637053088
RECENT INHALANT U
TOLUENE, PAINT THINN
OTHER SOLVE
Q16F Frequency Per
Never Heard/Used 26 8
In Your Lifetime 3
Since School Began 3
Frequency Missing = 29.9932737
RECENT INHALANT U
GASOLINE, OCTANE BOOST
CARBURETOR CLEAN
Q16G Frequency Per
Never Heard/Used 30 9
Since School Began 1
In the Past Month 1
Frequency Missing = 30.1064915
RECENT INHALANT USE - OTH
AEROSOLS/SPRA
Q16H Frequency Per
Never Heard/Used 33 9
In Your Lifetime 2
Frequency Missing = 26.313696
RECENT CIGARETTE Q17A Frequency Per
Never Heard/Used 27 6
In Your Lifetime 7 1
Since School Began 1
In the Past Month 9 2
Frequency Missing = 17.8343716
RECENT SMOKELESS TOBAC
Q17B Frequency PerNever Heard/Used 32 7
In Your Lifetime 3
Since School Began 5 1
In the Past Month 5 1
The frequencies have been weighted so that the analysis reflects
the distribution of students by grade level in the district
©Copyright 2010, Texas A&M University
All rights reserved.
Page 47 of 60
8/7/2019 MITCHELL COUNTY - Westbrook ISD - 2010 Texas School Survey of Drug and Alcohol Use
http://slidepdf.com/reader/full/mitchell-county-westbrook-isd-2010-texas-school-survey-of-drug-and-alcohol 48/60
Westbrook
Spring 2010
Frequency Missing = 16.370260022
RECENT BEER USE
Q17C Frequency Percent
Never Heard/Used 16 34.15
In Your Lifetime 9 19.86
Since School Began 10 21.23In the Past Month 12 24.76
Frequency Missing = 14.809227158
RECENT WINE COOLER USE
Q17D Frequency Percent
Never Heard/Used 22 42.02
In Your Lifetime 16 29.75
Since School Began 8 15.39
In the Past Month 7 12.84
Frequency Missing = 9.198943662
RECENT WINE USE
Q17E Frequency Percent
Never Heard/Used 25 50.71
In Your Lifetime 15 31.39
Since School Began 2 4.06
In the Past Month 7 13.84
Frequency Missing = 13.326245937
RECENT LIQUOR USE
Q17F Frequency Percent
Never Heard/Used 17 35.68
In Your Lifetime 12 24.80
Since School Began 9 18.68
In the Past Month 10 20.85
Frequency Missing = 12.690682557
RECENT INHALANT USE
Q17G Frequency Percent
Never Heard/Used 36 76.83
In Your Lifetime 5 10.42
Since School Began 5 10.62
In the Past Month 1 2.12
Frequency Missing = 15.478241242
RECENT MARIJUANA USE
Q18A Frequency Percent
Never Heard/Used 40 75.16
In Your Lifetime 5 9.79
Since School Began 4 7.48
In the Past Month 4 7.57
Frequency Missing = 8.6114120621
RECENT COCAINE USE
Q18B Frequency Percent
Never Heard/Used 48 95.93
Since School Began 2 4.07
Frequency Missing = 11.218851571
RECENT CRACK USE
Q18C Frequency Percent
Never Heard/Used 42 100.00
Frequency Missing = 19.809678584
RECENT HALLUCINOGEN USE
Q18E Frequency Percent
Never Heard/Used 39 89.90
In Your Lifetime 1 1.85
Since School Began 2 4.15
In the Past Month 2 4.10
Frequency Missing = 18.204044782
RECENT UPPER
Q18F Frequency Per
Never Heard/Used 35 8
In Your Lifetime 2
Since School Began 3
In the Past Month 1
Frequency Missing = 20.9933188
RECENT DOWNER
Q18G Frequency Per
Never Heard/Used 39 8
In Your Lifetime 1
Since School Began 2
In the Past Month 2
Frequency Missing = 18.5479866
RECENT ROHYPNOL U
Q18H Frequency Per
Never Heard/Used 44 9
In Your Lifetime 1
Frequency Missing = 17.1319068
RECENT STEROID U
Q18I Frequency Per
Never Heard/Used 35 10
Frequency Missing = 26.8600577
RECENT ECSTASY
Q18J Frequency Per
Never Heard/Used 37 9
In Your Lifetime 2
Since School Began 1
Frequency Missing = 22.4968851
The frequencies have been weighted so that the analysis reflects
the distribution of students by grade level in the district
©Copyright 2010, Texas A&M University
All rights reserved.
Page 48 of 60
8/7/2019 MITCHELL COUNTY - Westbrook ISD - 2010 Texas School Survey of Drug and Alcohol Use
http://slidepdf.com/reader/full/mitchell-county-westbrook-isd-2010-texas-school-survey-of-drug-and-alcohol 49/60
Westbrook
Spring 2010
RECENT HEROIN USE
Q18K Frequency Percent
Never Heard/Used 41 97.68
In Your Lifetime 1 2.32
Frequency Missing = 19.382538823
TOBACCO USE IN PAST MONTH
q19a Frequency Percent
Never Heard/Used 49 79.64
1-2 times 8 13.40
3-10 times 1 1.59
11+ times 3 5.37
ALCOHOL USE IN PAST MONTH
q19b Frequency Percent
Never Heard/Used 28 44.80
1-2 times 24 38.283-10 times 7 10.88
11+ times 4 6.04
INHALANT USE IN PAST MONTH
q19c Frequency Percent
Never Heard/Used 57 94.99
1-2 times 2 3.36
3-10 times 1 1.64
Frequency Missing = 2.0310581437
MARIJUANA USE IN PAST
MONTH
q19d Frequency Percent
Never Heard/Used 55 90.11
1-2 times 2 3.27
11+ times 4 6.62
Frequency Missing = 0.9812206573
COCAINE USE IN PAST MONTHq19e Frequency Percent
Never Heard/Used 58 96.57
1-2 times 2 3.43
Frequency Missing = 1.7840375587
CRACK USE IN PAST MONTH
q19f Frequency Percent
Never Heard/Used 59 98.32
1-2 times 1 1.68
Frequency Missing = 2.0070422535
CLOSE FRIENDS USE
CIGARETTES
q20a Frequency Percent
Never heard/None 21 34.99
A few 26 44.29
Some 8 13.63
Most 4 7.09
Frequency Missing = 2.0533586132
CLOSE FRIENDS USE
SMOKELESS TOBACCO
q20b Frequency Percent
Never heard/None 20 33.98
A few 23 39.40
Some 12 20.98
Most 2 3.93
All 1 1.71
Frequency Missing = 2.967677862
CLOSE FRIENDS USE BEER
q20c Frequency Percent
Never heard/None 9 14.82
A few 16 27.47
Some 15 25.20
Most 16 26.00
All 4 6.50
Frequency Missing = 2.0310581437
CLOSE FRIENDS USE WI
COOLE
q20d Frequency Perc
Never heard/None 25 4
A few 16 2
Some 10 16
Most 8 12
All 2 3
Frequency Missing = 1.04983748
CLOSE FRIENDS USE WI
q20e Frequency Perc
Never heard/None 32 5
A few 18 29
Some 5 7
Most 5
All 2 3
Frequency Missing = 1.04983748
CLOSE FRIENDS USE LIQU
q20f Frequency Perc
Never heard/None 15 2
A few 20 33
Some 13 22
Most 8 13
All 3 4
Frequency Missing = 3.79279523
CLOSE FRIENDS USE INHALAN
q20g Frequency Perc
Never heard/None 38 6
A few 15 2
Some 5
Most 1
Frequency Missing = 2.83387504
The frequencies have been weighted so that the analysis reflects
the distribution of students by grade level in the district
©Copyright 2010, Texas A&M University
All rights reserved.
Page 49 of 60
8/7/2019 MITCHELL COUNTY - Westbrook ISD - 2010 Texas School Survey of Drug and Alcohol Use
http://slidepdf.com/reader/full/mitchell-county-westbrook-isd-2010-texas-school-survey-of-drug-and-alcohol 50/60
Westbrook
Spring 2010
CLOSE FRIENDS USE
MARIJUANA
q20h Frequency Percent
Never heard/None 30 53.71
A few 11 19.42
Some 10 17.24
Most 5 9.63
Frequency Missing = 4.9524196461
DIFFICULT TO GET
CIGARETTES
q21a Frequency Percent
Impossible 5 8.40
Very difficult 5 8.53
Somewhat diff 7 11.29
Somewhat easy 12 19.47
Very easy 32 52.31
Frequency Missing = 0.8028169014
DIFFICULT TO GET
SMOKELESS TOBACCO
q21b Frequency Percent
Never heard of 3 5.10
Impossible 9 14.37
Very difficult 5 8.94
Somewhat diff 9 14.26
Somewhat easy 6 9.80
Very easy 29 47.54
Frequency Missing = 0.8028169014
DIFFICULT TO GET BEER
q21c Frequency Percent
Never heard of 2 3.58
Impossible 3 4.84
Very difficult 5 8.78
Somewhat diff 6 10.53
Somewhat easy 10 17.25
Very easy 32 55.02
Frequency Missing = 3.110915493
DIFFICULT TO GET WINE
COOLERS
q21d Frequency Percent
Never heard of 2 3.51
Impossible 6 10.18
Very difficult 6 9.93
Somewhat diff 8 13.43
Somewhat easy 13 22.52Very easy 24 40.44
Frequency Missing = 1.8063380282
DIFFICULT TO GET WINE
q21e Frequency Percent
Never heard of 3 5.25
Impossible 6 10.43
Very difficult 6 10.06
Somewhat diff 11 19.28
Somewhat easy 5 9.01Very easy 27 45.97
Frequency Missing = 2.6091549296
DIFFICULT TO GET LIQUOR
q21f Frequency Percent
Never heard of 2 3.49
Impossible 5 8.51
Very difficult 8 12.86
Somewhat diff 6 9.89
Somewhat easy 10 16.39Very easy 29 48.85
Frequency Missing = 1.6056338028
DIFFICULT TO GET
INHALANTS
q21g Frequency Percent
Never heard of 4 6.49
Impossible 12 19.06
Very difficult 1 1.72
Somewhat diff 7 11.19Somewhat easy 11 18.21
Very easy 26 43.32
Frequency Missing = 0.8028169014
DIFFICULT TO GE
MARIJUAN
q21h Frequency Perce
Never heard of 4 7.
Impossible 21 35.
Very difficult 2 3.
Somewhat diff 9 15.Somewhat easy 10 16.
Very easy 13 22.
Frequency Missing = 2.74295774
DIFFICULT TO GET COCAIN
q21i Frequency Perce
Never heard of 4 6.
Impossible 29 47.
Very difficult 6 10.
Somewhat diff 14 23.Somewhat easy 1 1.
Very easy 6 9.
Frequency Missing = 1.78403755
DIFFICULT TO GET CRAC
q21j Frequency Perce
Never heard of 4 6.
Impossible 33 53.
Very difficult 6 10.
Somewhat diff 11 18.Somewhat easy 1 1.
Very easy 6 9.
Frequency Missing = 0.80281690
DIFFICULT TO GE
HALLUCINOGEN
q21l Frequency Perce
Never heard of 13 22.
Impossible 24 39.
Very difficult 10 16.Somewhat diff 6 9.
Somewhat easy 3 5.
Very easy 4 6.
Frequency Missing = 1.78403755
The frequencies have been weighted so that the analysis reflects
the distribution of students by grade level in the district
©Copyright 2010, Texas A&M University
All rights reserved.
Page 50 of 60
8/7/2019 MITCHELL COUNTY - Westbrook ISD - 2010 Texas School Survey of Drug and Alcohol Use
http://slidepdf.com/reader/full/mitchell-county-westbrook-isd-2010-texas-school-survey-of-drug-and-alcohol 51/60
Westbrook
Spring 2010
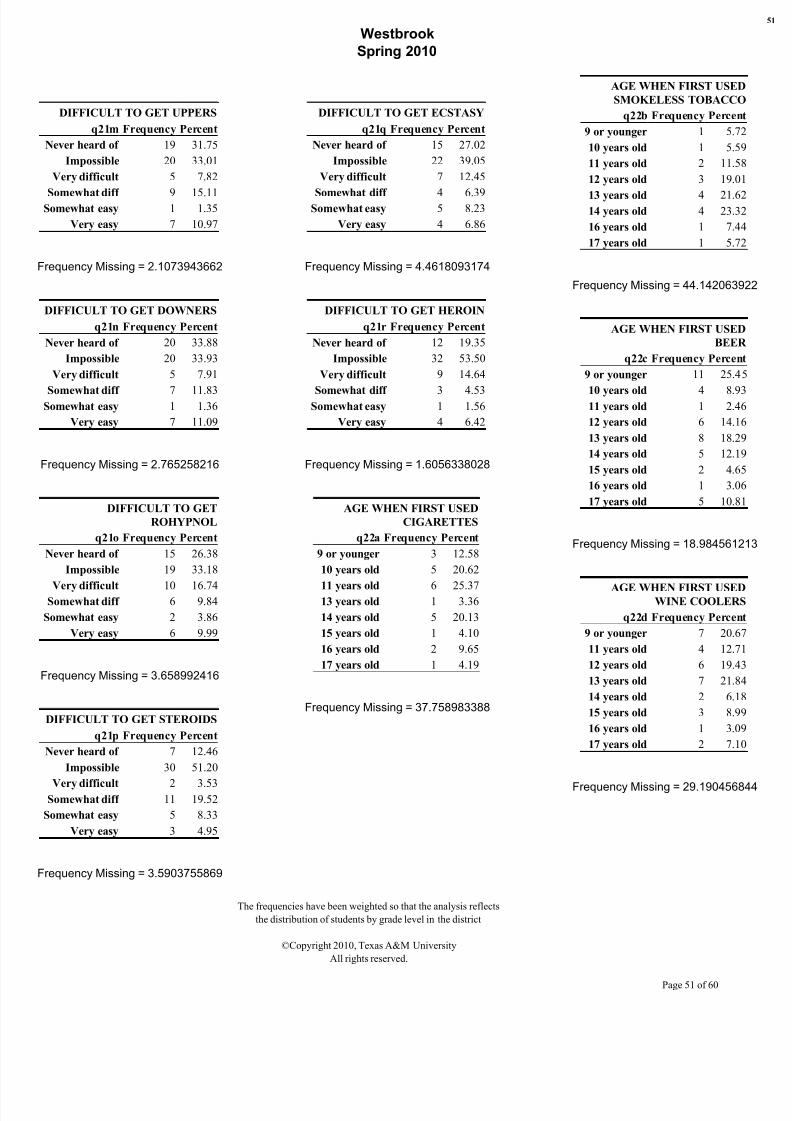
DIFFICULT TO GET UPPERS
q21m Frequency Percent
Never heard of 19 31.75
Impossible 20 33.01
Very difficult 5 7.82
Somewhat diff 9 15.11Somewhat easy 1 1.35
Very easy 7 10.97
Frequency Missing = 2.1073943662
DIFFICULT TO GET DOWNERS
q21n Frequency Percent
Never heard of 20 33.88
Impossible 20 33.93
Very difficult 5 7.91
Somewhat diff 7 11.83Somewhat easy 1 1.36
Very easy 7 11.09
Frequency Missing = 2.765258216
DIFFICULT TO GET
ROHYPNOL
q21o Frequency Percent
Never heard of 15 26.38
Impossible 19 33.18
Very difficult 10 16.74Somewhat diff 6 9.84
Somewhat easy 2 3.86
Very easy 6 9.99
Frequency Missing = 3.658992416
DIFFICULT TO GET STEROIDS
q21p Frequency Percent
Never heard of 7 12.46
Impossible 30 51.20
Very difficult 2 3.53Somewhat diff 11 19.52
Somewhat easy 5 8.33
Very easy 3 4.95
Frequency Missing = 3.5903755869
DIFFICULT TO GET ECSTASY
q21q Frequency Percent
Never heard of 15 27.02
Impossible 22 39.05
Very difficult 7 12.45
Somewhat diff 4 6.39Somewhat easy 5 8.23
Very easy 4 6.86
Frequency Missing = 4.4618093174
DIFFICULT TO GET HEROIN
q21r Frequency Percent
Never heard of 12 19.35
Impossible 32 53.50
Very difficult 9 14.64
Somewhat diff 3 4.53Somewhat easy 1 1.56
Very easy 4 6.42
Frequency Missing = 1.6056338028
AGE WHEN FIRST USED
CIGARETTES
q22a Frequency Percent
9 or younger 3 12.58
10 years old 5 20.62
11 years old 6 25.3713 years old 1 3.36
14 years old 5 20.13
15 years old 1 4.10
16 years old 2 9.65
17 years old 1 4.19
Frequency Missing = 37.758983388
AGE WHEN FIRST USED
SMOKELESS TOBACCO
q22b Frequency Percen
9 or younger 1 5.7
10 years old 1 5.5
11 years old 2 11.5
12 years old 3 19.0
13 years old 4 21.614 years old 4 23.3
16 years old 1 7.4
17 years old 1 5.7
Frequency Missing = 44.1420639
AGE WHEN FIRST USED
BEER
q22c Frequency Percen
9 or younger 11 25.4
10 years old 4 8.911 years old 1 2.4
12 years old 6 14.1
13 years old 8 18.2
14 years old 5 12.1
15 years old 2 4.6
16 years old 1 3.0
17 years old 5 10.8
Frequency Missing = 18.9845612
AGE WHEN FIRST USEDWINE COOLER
q22d Frequency Percen
9 or younger 7 20.6
11 years old 4 12.7
12 years old 6 19.4
13 years old 7 21.8
14 years old 2 6.1
15 years old 3 8.9
16 years old 1 3.0
17 years old 2 7.1
Frequency Missing = 29.1904568
The frequencies have been weighted so that the analysis reflects
the distribution of students by grade level in the district
©Copyright 2010, Texas A&M University
All rights reserved.
Page 51 of 60
8/7/2019 MITCHELL COUNTY - Westbrook ISD - 2010 Texas School Survey of Drug and Alcohol Use
http://slidepdf.com/reader/full/mitchell-county-westbrook-isd-2010-texas-school-survey-of-drug-and-alcohol 52/60
8/7/2019 MITCHELL COUNTY - Westbrook ISD - 2010 Texas School Survey of Drug and Alcohol Use
http://slidepdf.com/reader/full/mitchell-county-westbrook-isd-2010-texas-school-survey-of-drug-and-alcohol 53/60
Westbrook
Spring 2010
HOW OFTEN NORMALLY USE
CIGARETTES
q23a Frequency Percent
Every day 1 1.76
Several times/wk 1 1.64
Several times/mo 4 7.44
About once/month 3 5.31
About once/year 4 6.99< once/year 5 8.79
Never used 39 68.07
Frequency Missing = 4.5715962441
HOW OFTEN NORMALLY USE
SMOKELESS TOBACCO
q23b Frequency Percent
Several times/wk 1 2.05
Several times/mo 1 2.05
About once/month 6 12.53About once/year 5 9.54
< once/year 2 3.65
Never used 34 70.16
Frequency Missing = 12.837351029
HOW OFTEN NORMALLY USE
BEER
q23c Frequency Percent
Several times/wk 5 9.05
Several times/mo 4 8.05About once/month 10 19.33
About once/year 11 21.55
< once/year 10 18.23
Never used 12 23.79
Frequency Missing = 9.4605453232
HOW OFTEN NORMALLY USE
WINE COOLERS
q23d Frequency Percent
Several times/wk 1 1.69
Several times/mo 1 2.21
About once/month 8 15.81
About once/year 7 14.54
< once/year 10 20.37Never used 22 45.38
Frequency Missing = 14.143643915
HOW OFTEN NORMALLY USE
WINE
q23e Frequency Percent
Several times/wk 1 1.91
Several times/mo 1 1.56
About once/month 6 11.47
About once/year 11 21.35< once/year 6 11.60
Never used 27 52.12
Frequency Missing = 10.326832792
HOW OFTEN NORMALLY USE
LIQUOR
q23f Frequency Percent
Several times/wk 1 2.09
Several times/mo 5 10.04
About once/month 7 14.17About once/year 11 23.86
< once/year 4 9.35
Never used 19 40.49
Frequency Missing = 14.788642109
HOW OFTEN NORMALLY USE
INHALANTS
q23g Frequency Percent
Several times/mo 1 2.10
About once/year 8 16.50< once/year 1 2.14
Never used 37 79.26
Frequency Missing = 14.900144456
HOW OFTEN NORMALLY U
MARIJUAN
q23h Frequency Perc
Every day 2 5
Several times/mo 2 4
About once/year 5 11
< once/year 2 4Never used 30 73
Frequency Missing = 21.091955
HOW OFTEN NORMALLY U
COCAIN
q23i Frequency Perc
About once/year 1 2
< once/year 1 2
Never used 39 95
Frequency Missing = 21.023338
HOW OFTEN NORMALLY
USE CRACK
q23j Frequency Percent
< once/year 1 2.54
Never used 38 97.46
Frequency Missing = 22.2309949
HOW OFTEN NORMALLY U
HALLUCINOGE
q23l Frequency Perc
About once/year 2 5
Never used 45 94
Frequency Missing = 14.1419284
The frequencies have been weighted so that the analysis reflects
the distribution of students by grade level in the district
©Copyright 2010, Texas A&M University
All rights reserved.
Page 53 of 60
8/7/2019 MITCHELL COUNTY - Westbrook ISD - 2010 Texas School Survey of Drug and Alcohol Use
http://slidepdf.com/reader/full/mitchell-county-westbrook-isd-2010-texas-school-survey-of-drug-and-alcohol 54/60
Westbrook
Spring 2010
HOW OFTEN NORMALLY USE
UPPERS
q23m Frequency Percent
Several times/mo 1 2.49
About once/month 1 1.91
About once/year 1 2.38
< once/year 1 2.22
Never used 38 91.00
Frequency Missing = 19.554938606
HOW OFTEN NORMALLY USE
DOWNERS
q23n Frequency Percent
Every day 1 2.08
About once/month 1 2.08
< once/year 1 2.43
Never used 36 93.41
Frequency Missing = 23.11529433
HOW OFTEN NORMALLY USE
ROHYPNOL
q23o Frequency Percent
About once/year 1 2.39
< once/year 1 1.91
Never used 40 95.69
Frequency Missing = 19.742777176
HOW OFTEN NORMALLY
USE STEROIDS
q23p Frequency Percent
Never used 33 100.00
Frequency Missing = 28.233252077
HOW OFTEN NORMALLY USE
ECSTASY
q23q Frequency PercentSeveral times/mo 1 2.93
About once/year 1 2.24
< once/year 1 2.24
Never used 33 92.60
Frequency Missing = 25.811935717
HOW OFTEN NORMALLY
USE HEROIN
q23r Frequency Percent
Never used 39 100.00
Frequency Missing = 22.845973276
AMOUNT OF BEER AT ONE
TIME
q24a Frequency Percent
Never drink this 12 21.68
12+ drinks 4 7.20
9-11 drinks 2 4.23
5-8 drinks 6 10.47
3-4 drinks 5 9.51
2 drinks 6 11.39
1 drink 10 18.50
< 1 drink 9 17.01
Frequency Missing = 7.1584507042
AMOUNT OF WINE COOLERS
AT ONE TIME
q24b Frequency Percent
Never drink this 22 42.60
12+ drinks 3 5.69
5-8 drinks 4 7.03
3-4 drinks 2 3.95
2 drinks 5 9.55
1 drink 8 15.19
< 1 drink 8 16.00
Frequency Missing = 10.282231853
AMOUNT OF WINE AT ON
TIM
q24c Frequency Perc
Never drink this 30 57
5-8 drinks 2 3
3-4 drinks 3 6
2 drinks 5 9
1 drink 8 15< 1 drink 4 7
Frequency Missing = 10.2822318
AMOUNT OF LIQUOR AT ON
TIM
q24d Frequency Perc
Never drink this 20 43
12+ drinks 3 6
9-11 drinks 1 2
3-4 drinks 4 92 drinks 5 10
1 drink 5 11
< 1 drink 7 16
Frequency Missing = 17.0298392
HOW MANY 5+ DRINKS IN PA
30 DA
q25 Frequency Perc
Never 5+ at time 21 39
None 19 341 day 6 11
2 days 3 6
3 to 5 days 2 3
6 to 9 days 2 3
10 or more days 1 1
Frequency Missing = 7.31455399
The frequencies have been weighted so that the analysis reflects
the distribution of students by grade level in the district
©Copyright 2010, Texas A&M University
All rights reserved.
Page 54 of 60
8/7/2019 MITCHELL COUNTY - Westbrook ISD - 2010 Texas School Survey of Drug and Alcohol Use
http://slidepdf.com/reader/full/mitchell-county-westbrook-isd-2010-texas-school-survey-of-drug-and-alcohol 55/60
Westbrook
Spring 2010
GET ALCOHOLIC BEVERAGES
FROM HOME
q26a Frequency Percent
Do not Drink 12 23.50
Never 12 24.24
Seldom 20 38.73
Most of the Time 6 11.62
Always 1 1.91
Frequency Missing = 10.330263633
GET ALCOHOLIC BEVERAGES
FROM FRIENDS
q26b Frequency Percent
Do not Drink 9 20.51
Never 13 29.64
Seldom 9 20.53
Most of the Time 10 22.93
Always 3 6.40
Frequency Missing = 16.739933189
GET ALCOHOLIC
BEVERAGES FROM A STORE
q26c Frequency Percent
Do not Drink 8 17.62
Never 33 77.65
Seldom 1 2.29
Always 1 2.45
Frequency Missing = 18.752121705
GET ALCOHOLIC BEVERAGES
AT PARTIES
q26d Frequency Percent
Do not Drink 7 18.22
Never 13 32.24
Seldom 7 17.31
Most of the Time 9 22.84
Always 4 9.38
Frequency Missing = 21.270359336
GET ALCOHOLIC BEVERAGES
FROM OTHER SOURCES
q26e Frequency Percent
Do not Drink 8 18.83
Never 14 33.72
Seldom 13 31.50
Most of the Time 5 11.39
Always 2 4.56
Frequency Missing = 20.571325388
USE MARIJUANA AS JOINTS
q27a Frequency Percent
Never 38 83.15
Seldom 3 6.17
Half the time 3 6.46
Most of the time 1 2.18
Always 1 2.04
Frequency Missing = 15.75528169
USE MARIJUANA AS BLUNTS
q27b Frequency Percent
Never 34 87.42
Seldom 1 2.49
Half the time 2 5.04
Most of the time 1 2.67
Always 1 2.38
Frequency Missing = 22.320196822
USE MARIJUANA IN BONGS
OR WATER PIPES
q27c Frequency Percent
Never 37 84.47
Seldom 4 8.66
Half the time 1 2.31
Always 2 4.56
Frequency Missing = 18.168878657
USE MARIJUANA IN PIP
q27d Frequency Perc
Never 31 81
Most of the time 3 7
Always 4 10
Frequency Missing = 23.9558504
USE MARIJUANA OTHER
WAY
q27e Frequency Percen
Never 36 89.9
Seldom 1 2.5
Half the time 1 2.6
Always 1 2.3
Don't know 1 2.4
Frequency Missing = 22.1606626
USED METHAMPHETAM
EVEN ONE TI
q28 Frequency Per
Never heard/used 57 9
At least once/year 1
At least once/life 2
Frequency Missing = 1.85265438
RECENT PRECRIPTION DRUG
- CODE
q29a Frequency Per
Never heard/used 52 8
At least once/month 1
At least once/year 2
At least once/life 6
Frequency Missing = 1.04983748
RECENT PRECRIPTION DR
USE - OXYCONTIN E
q29b Frequency Perc
Never heard/used 55 95
At least once/life 3 4
The frequencies have been weighted so that the analysis reflects
the distribution of students by grade level in the district
©Copyright 2010, Texas A&M University
All rights reserved.
Page 55 of 60
8/7/2019 MITCHELL COUNTY - Westbrook ISD - 2010 Texas School Survey of Drug and Alcohol Use
http://slidepdf.com/reader/full/mitchell-county-westbrook-isd-2010-texas-school-survey-of-drug-and-alcohol 56/60
8/7/2019 MITCHELL COUNTY - Westbrook ISD - 2010 Texas School Survey of Drug and Alcohol Use
http://slidepdf.com/reader/full/mitchell-county-westbrook-isd-2010-texas-school-survey-of-drug-and-alcohol 57/60
Westbrook
Spring 2010
DANGEROUS FOR KIDS TO
USE METHAMPHETAMINE
q31j Frequency Percent
Very 47 78.09
Somewhat 4 6.36
Don't know 9 15.55
Frequency Missing = 2.0533586132
DAYS SKIPPED SINCE
SEPTEMBER
q32a Frequency Percent
None 28 46.19
1-3 days 29 48.30
4-9 days 2 3.75
10+ days 1 1.76
Frequency Missing = 1.9864572048
DAYS ILL SINCE
SEPTEMBER
q32b Frequency Percent
None 5 8.86
1-3 days 37 60.97
4-9 days 15 24.98
10+ days 3 5.19
Frequency Missing = 1.0498374865
OTHER REASON FOR
DAYS MISSED SINCE
SEPTEMBER
q32c Frequency Percent
None 7 12.26
1-3 days 41 69.23
4-9 days 7 12.26
10+ days 4 6.24
Frequency Missing = 2.0310581437
SENT TO
PRINCIPAL/DEAN SINCE
SEPTEMBER
q32d Frequency Percent
None 39 64.58
1-3 days 13 21.32
4-9 days 4 6.03
10+ days 5 8.06
Frequency Missing = 1.0498374865
SOMEONE CALLED
HOME SINCE
SEPTEMBER
q32e Frequency Percent
None 51 84.66
1-3 days 7 12.29
10+ days 2 3.06
Frequency Missing = 1.0498374865
IN TROUBLE FOR
DRINKING SINCE
SEPTEMBER
q32f Frequency Percent
None 56 95.13
1-3 days 2 3.08
10+ days 1 1.79
Frequency Missing = 3.0345792705
IN TROUBLE FOR DRUG
USE SINCE SEPTEMBER
q32g Frequency Percent
None 56 96.79
1-3 days 1 1.39
10+ days 1 1.82
Frequency Missing = 3.9711989888
TROUBLE WITH
FRIENDS BECAUSE OF
DRINKING
q33a Frequency Percent
None 59 96.52
1-3 times 2 3.48
Frequency Missing = 1.04983748
DRIVEN A CAR AFTER A
GOOD BIT TO DRINK
q33b Frequency Percent
None 58 98.33
1-3 times 1 1.67
Frequency Missing = 2.9676778
CRITICIZED BY DATEBECAUSE OF DRINKING
q33c Frequency Percent
None 54 94.57
1-3 times 3 5.43
Frequency Missing = 4.77401589
TROUBLE WITH POLICE
BECAUSE OF DRINKING
q33d Frequency Percent
None 58 98.301-3 times 1 1.70
Frequency Missing = 2.78927410
TROUBLE WITH
FRIENDS BECAUSE
OF DRUG USE
q33e Frequency Percent
None 58 100.00
Frequency Missing = 3.92659804
The frequencies have been weighted so that the analysis reflects
the distribution of students by grade level in the district
©Copyright 2010, Texas A&M University
All rights reserved.
Page 57 of 60
8/7/2019 MITCHELL COUNTY - Westbrook ISD - 2010 Texas School Survey of Drug and Alcohol Use
http://slidepdf.com/reader/full/mitchell-county-westbrook-isd-2010-texas-school-survey-of-drug-and-alcohol 58/60
Westbrook
Spring 2010
DRIVEN A CAR WHILE
HIGH FROM DRUGS
q33f Frequency Percent
None 54 93.01
1-3 times 3 5.25
4-9 times 1 1.74
Frequency Missing = 3.9265980498
CRITICIZED BY DATE
BECAUSE OF DRUG
USE
q33g Frequency Percent
None 59 100.00
Frequency Missing = 3.0345792705
TROUBLE WITHPOLICE BECAUSE OF
DRUG USE
q33h Frequency Percent
None 55 100.00
Frequency Missing = 6.5357529794
CLASS DAYS DRUNK ON
ALCOHOL SINCE SEPT
q34a Frequency Percent
None 51 88.351-3 days 4 6.73
4-9 days 1 1.73
10+ days 2 3.19
Frequency Missing = 3.6366919466
CLASS DAYS HIGH ON
MARIJUANA SINCE SEPT
q34b Frequency Percent
None 46 85.48
1-3 days 6 10.6210+ days 2 3.90
Frequency Missing = 7.9089472734
CLASS DAYS HIGH ON
INHALANTS SINCE SEPT
q34c Frequency Percent
None 41 82.33
1-3 days 6 11.97
4-9 days 2 3.60
10+ days 1 2.09
Frequency Missing = 11.567939689
CLASS DAYS HIGH ON
OTHER DRUG(S)
q34d Frequency Percent
None 49 91.63
1-3 days 3 6.39
10+ days 1 1.98
Frequency Missing = 8.6654478151
ALCOHOL USE AT PARTIES
THIS SCHOOL YEAR
q35a Frequency Percent
Never 13 23.60
Seldom 10 16.84
Half the time 8 13.42
Most of the time 9 15.18
Always 7 11.62
Don't know 1 1.85
Didn't attend 10 17.50
Frequency Missing = 4.8426327194
DRUG USE AT PARTIES THIS
SCHOOL YEAR
q35b Frequency Percent
Never 23 42.52
Seldom 12 22.11
Half the time 2 3.36
Most of the time 2 3.36
Always 4 7.39
Don't know 2 3.97Didn't attend 9 17.30
Frequency Missing = 8.5650957024
SOUGHT HELP FOR
DRUG/ALCOHOL
PROBLEM
q36 Frequency Percent
No 47 93.94
Yes 3 6.06
Frequency Missing = 11.6365565
WOULD SEEK HELP
FROM SCHOOL
COUNSELOR
q37a Frequency Percent
No 40 71.86
Yes 16 28.14
Frequency Missing = 5.80155290
WOULD SEEK HELP
FROM ANOTHER
ADULT IN SCHOOL
q37b Frequency Percent
No 38 68.16
Yes 18 31.84
Frequency Missing = 6.51345250
WOULD SEEK HELP
FROM COUNSELOR
OR PROGRAM
OUTSIDE SCHOOL
q37c Frequency Percent
No 35 73.84
Yes 12 26.16
Frequency Missing = 14.6917208
WOULD SEEK HELP
FROM PARENTS
q37d Frequency Percent
No 20 46.62
Yes 22 53.38
Frequency Missing = 19.5772390
The frequencies have been weighted so that the analysis reflects
the distribution of students by grade level in the district
©Copyright 2010, Texas A&M University
All rights reserved.
Page 58 of 60
8/7/2019 MITCHELL COUNTY - Westbrook ISD - 2010 Texas School Survey of Drug and Alcohol Use
http://slidepdf.com/reader/full/mitchell-county-westbrook-isd-2010-texas-school-survey-of-drug-and-alcohol 59/60
Westbrook
Spring 2010
WOULD SEEK HELP
FROM A MEDICAL
DOCTOR
q37e Frequency Percent
No 27 65.25
Yes 14 34.75
Frequency Missing = 20.043833514
WOULD SEEK HELP
FROM FRIENDS
q37f Frequency Percent
No 10 21.93
Yes 36 78.07
Frequency Missing = 15.940547129
WOULD SEEK HELPFROM ANOTHER
ADULT
q37g Frequency Percent
No 16 36.64
Yes 28 63.36
Frequency Missing = 17.590781871
WOULD NOT SEEK
HELP
q37h Frequency PercentNo 41 82.54
Yes 9 17.46
Frequency Missing = 11.599674973
DRUG/ALCOHOL
INFO--SCHOOL
HEALTH CLASS
q38a Frequency Percent
No 22 48.70
Yes 23 51.30
Frequency Missing = 16.654162152
DRUG/ALCOHOL
INFO--SCHOOL
ASSEMBLY PROGRAM
q38b Frequency Percent
No 5 12.32
Yes 35 87.68
Frequency Missing = 21.652898158
DRUG/ALCOHOL
INFO--SCHOOL
GUIDANCE
COUNSELOR
q38c Frequency Percent
No 34 83.49
Yes 7 16.51
Frequency Missing = 21.428178043
DRUG/ALCOHOL
INFO--SCIENCE CLASS
q38d Frequency Percent
No 21 58.60
Yes 15 41.40
Frequency Missing = 26.315411701
DRUG/ALCOHOL
INFO--SOCIAL
STUDIES CLASS
q38e Frequency Percent
No 28 90.33
Yes 3 9.67
Frequency Missing = 30.775505598
DRUG/ALCOHOL
INFO--SCHOOL
STUDENT GROUP OR
CLUB
q38f Frequency PercentNo 33 92.40
Yes 3 7.60
Frequency Missing = 25.611231492
DRUG/ALCOHOL
INFO--INVITED
SCHOOL GUEST
q38g Frequency Percent
No 13 35.79
Yes 24 64.21
Frequency Missing = 24.9087667
DRUG/ALCOHOL
INFO--ANOTHER
SCHOOL SOURCE
q38h Frequency Percent
No 21 65.07
Yes 11 34.93
Frequency Missing = 29.112405
PARENTS FEEL ABOUT K
SMOKING CIGARETT
q39a Frequency Per
Strong disapprove 28 5
Mild disapprove 12 2
Neither 13 2
Don't know 2
Frequency Missing = 7.43120260
PARENTS FEEL ABOUT K
DRINKING BE
q39b Frequency Per
Strong disapprove 24 4
Mild disapprove 11 2
Neither 8 1
Mildly approve 2
Strongly approve 2
Don't know 2
Frequency Missing = 12.8313470
The frequencies have been weighted so that the analysis reflects
the distribution of students by grade level in the district
©Copyright 2010, Texas A&M University
All rights reserved.
Page 59 of 60
8/7/2019 MITCHELL COUNTY - Westbrook ISD - 2010 Texas School Survey of Drug and Alcohol Use
http://slidepdf.com/reader/full/mitchell-county-westbrook-isd-2010-texas-school-survey-of-drug-and-alcohol 60/60
Westbrook
Spring 2010
PARENTS FEEL ABOUT KIDS
USING MARIJUANA
q39c Frequency Percent
Strong disapprove 38 78.48
Mild disapprove 3 6.00
Neither 2 4.64
Strongly approve 3 7.04
Don't know 2 3.83
Frequency Missing = 13.364842904
TESTED FOR DRUG
USE AT SCHOOL
q40 Frequency Percent
No 37 74.67
Yes 13 25.33
Frequency Missing = 11.928178043