1 RESEARCH PRESENTATION Mitigation of GHG and other harmful emissions from the power sector Vietnam case study 27 September, 2007 CNRS/CIRED laboratory Performed by NGUYEN Thanh Nhan, Ph.D student,
Transcript
1
RESEARCH PRESENTATION
Mitigation of GHG and other harmful emissions from the
power sector
Vietnam case study
27 September, 2007 CNRS/CIRED laboratory
Performed by NGUYEN Thanh Nhan, Ph.D student,
2
Introduction
Recently the need for a more efficient usage of more diverse energy sources in Vietnam, including more non-conventional sources has been seriously concerned by energy experts due to both economic and environmental reasons.
If this challenge is not met, it is estimated that after the year 2015, domestic sources of electricity energy supply could be unable to meet the growth in electricity demand. Fuels and electricity energy would need to be imported for electricity generation, even with the nuclear power option.
3
Outline of Presentation
1) Status of Vietnam power sector and its development until 2020. 2) The adoption of the analysis framework of the integrated resource planning for Vietnam power sector will be determinated.
3) Some previous analyses of Vietnam power sector development with problems of development & emissions mitigation. This focuses on the optimal selection of least cost technological options such as clean generation technologies, fuel switching for achieving a range of mitigation targets on CO2 emission from the power sector. As well, the implications of the introduction of carbon and energy taxes into power sector will be examined for achieving such mitigating targets.Key words: emissions mitigation in power sector, integrated resource planning, clean generation technologies.
4
Vietnam economy development & its
power sector
5
Vietnam economy development
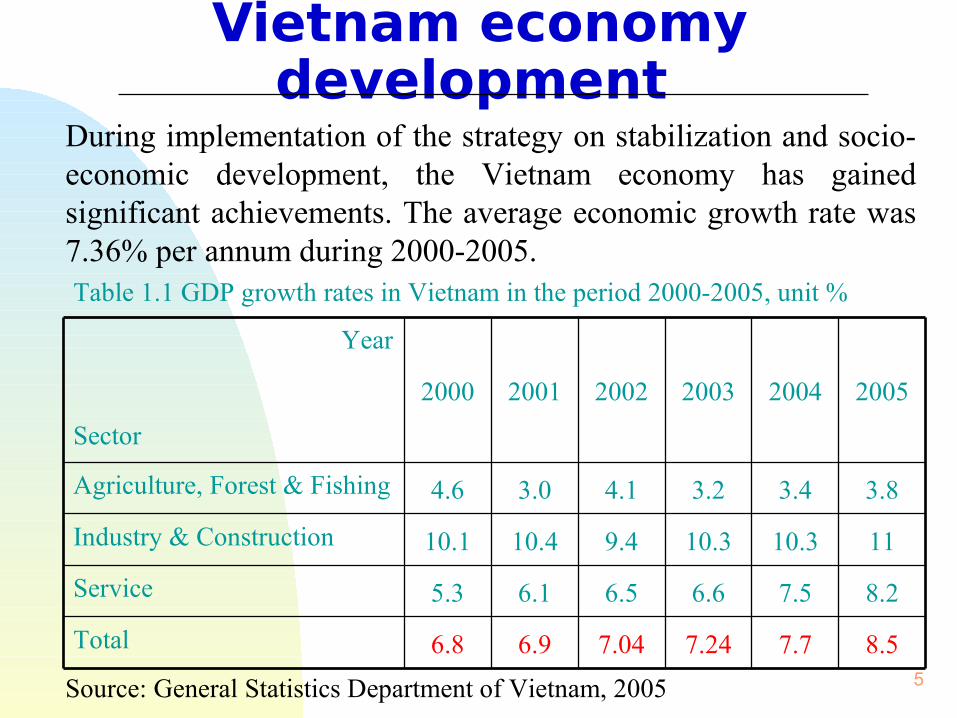
During implementation of the strategy on stabilization and socio-economic development, the Vietnam economy has gained significant achievements. The average economic growth rate was 7.36% per annum during 2000-2005.
8.57.77.247.046.96.8Total
8.27.56.66.56.15.3Service
1110.310.39.410.410.1Industry & Construction
3.83.43.24.13.04.6Agriculture, Forest & Fishing
200520042003200220012000
Year
Sector
Table 1.1 GDP growth rates in Vietnam in the period 2000-2005, unit %
Source: General Statistics Department of Vietnam, 2005
6
Vietnam economy development
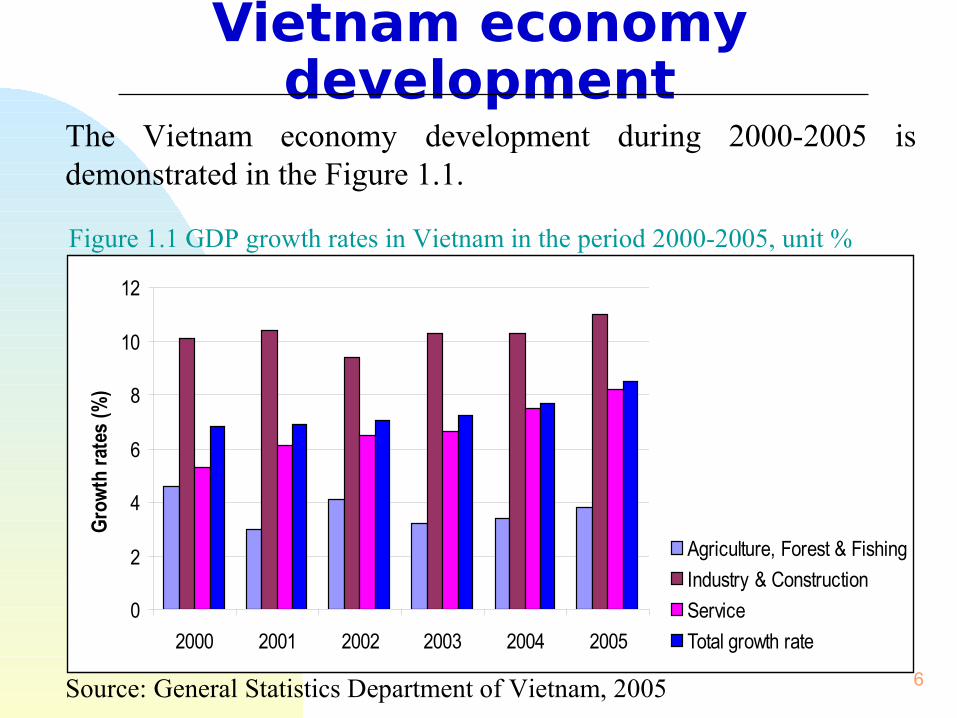
The Vietnam economy development during 2000-2005 is demonstrated in the Figure 1.1.
Figure 1.1 GDP growth rates in Vietnam in the period 2000-2005, unit %
Source: General Statistics Department of Vietnam, 2005
0
2
4
6
8
10
12
2000 2001 2002 2003 2004 2005
Gro
wth
rat
es (%
)
Agriculture, Forest & Fishing
Industry & Construction
Service
Total growth rate
7
Vietnam power sectorThe power sector of Vietnam is demonstrated in diverse characteristics in terms of electricity generation technologies, fuel use, total electricity generation capacity, load growth and load characteristics of the power system.
Table 1.2 Overview of electricity generation in Vietnam period 2000-2005, unit %
22.40%15.18%5205011340Vietnam
Thermal electricity generation
(2000-2005)
Total electricity generation
(2000-2005)
Average annual growth rateTotal Electricity generation
(GWh) (2005)
Total Installed power
generation capacity (MW)
(2005)
Country
Source: Institute of Energy of Vietnam, 2005 and EIA 2005
8
Vietnam power sectorFigures below demonstrate the structure of electricity capacity & electricity generation technologies of the power system in 2005.
Source: Institute of Energy of Vietnam, 2005
Capacity share (%)
36.64
10.9825.92
1.75
2.51
22.20Hydropower
Coal fired
Gas turbine (gas+oil)
Oil - fired
Diesel
IPP/BOT
Figure 1.2
Figure 1.3
Generation share (%)
30.99
15.6131.14
20.880.081.30
Hydropower
Coal fired
Gas turbine (gas+oil)
Oil - fired
Diesel
IPP/BOT
9
Vietnam power sector
Figure 1.4 demonstrate the evolution of Electricity Generation by fuel type from 2000 to 2005
Source: Institute of Energy of Vietnam, 2005
0
10000
20000
30000
40000
50000
60000
2000 2001 2002 2003 2004 2005
GW
h
Coal
Hydro
FO
External sources
Gas Turbine (Gas+DO)
10
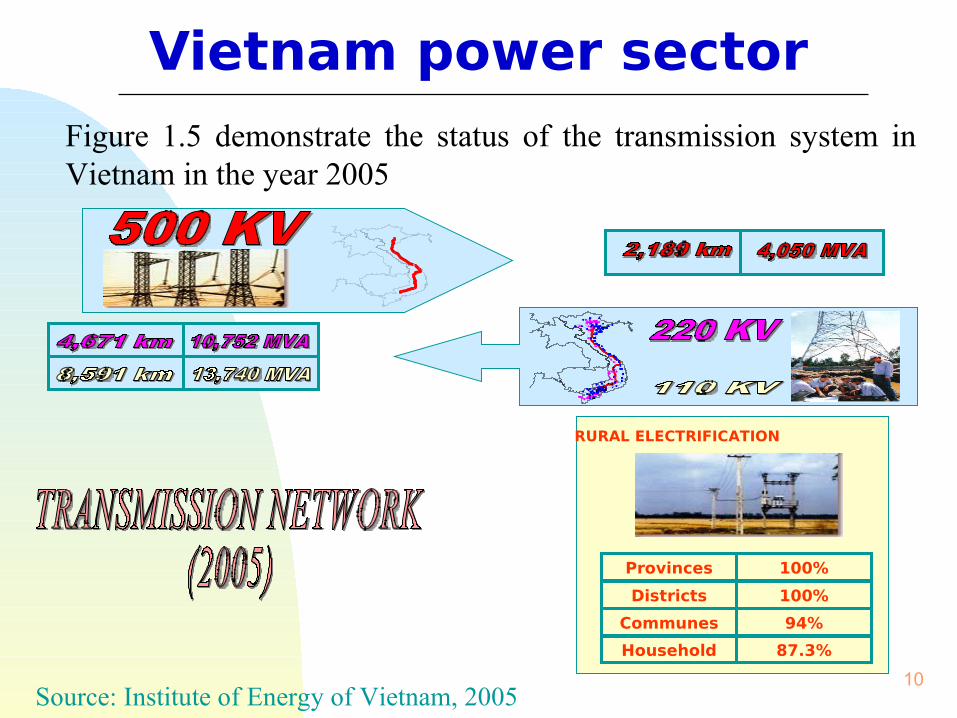
Vietnam power sectorFigure 1.5 demonstrate the status of the transmission system in Vietnam in the year 2005
Source: Institute of Energy of Vietnam, 2005
RURAL ELECTRIFICATION
U«ngBÝ
Ph í cLong
Provinces 100%
Districts 100%
Communes 94%
Household 87.3%
11
Vietnam power sector
Source: Institute of Energy of Vietnam, 2005
Table 1.3 Electricity consumption by sector in the period 2000-2005, TWh
Figure 1.8 Electricity generation sources distributed in Vietnam in 2005 - 2010
2
NGHI SON1(10)
SREPOK 3 (09)
AKHEKNA K (10)
CA ONGA N (05)CA MPHA (08)
NTRA CH(09-11)
OMON I (08)
QNINH (08)
HPHONG (08-09)
D.NINH (07)D.NA I 3 (09)
CUA DA T (10)
P. KRONG (08)
D. RINH (07)
Q. TRI (08)
A VUONG (08)
T.QUA NG (07)
B.KUOP (09)
T.KONTUM (10)
S. BA HA (08)
S.TRA NH 2 (10)
D.NA I 4 (10)
SESAN 3 (07)
B.TAUSRA (09)
BAN LA (09)
MAO KHE(09)
UBI MR (06)
NBINH II (09)
S.DONG (08)
THU DUC
BA RIAPHU MY
CA MA U (07)
North
+5251 MW
NA DUONG
Center & South
+6120 MW
HOA BINH
Distribution of Electricity Generation Sources in VN period 2005-2010
16
Vietnam power sector
Source: Institute of Energy of Vietnam, 2005
Table 1.6 Domestic energy fuel balance for electricity generation till the year 2020
-10 /-35 / -64+18 /+7 /-9Balance: surplus (+), short of (-)
176/201/230131/142/158Total electricity demand
166149Total electricity generation
3,21100MW1,5500MWRenewable energies
5815100MW4913000MWHydro
691814.33.7
671613.72.3
Gas (billion m3) - For electricity generation - For other sectors
363016.213.8
31.627.414.213.2
Coal (million tons) - For electricity generation - For other sectors
Electricity generation (TWh)
Supply potential
Electricity generation (TWh)
Supply potential
20202015
Energy sources
17
Power sector & its forthcoming challenge
Alternatives considered by Electricity of Vietnam (EVN) due the shortage possibility of domestic sources for electricity supply in period 2015-2020:
3) Electricity imported from neighbor countries4) Coal imported5) Gas imported via ASEAN gas pipe line system6) LNG imported. 7) Development of renewable energy sources: wind, geothermal, biogas, solar, small hydro8) Energy saving and improving efficiency energy use 9) Nuclear power option
Challenging question: How to achieve the economical and environmental targets in assuring stable electricity supply and national energy security?
18
Power sector & its forthcoming challenge
- High technology cost- Policy, financial barriers, technology transfers- Dependence on nature => un-dispachable sources => not big balanced source supply
- Environmental economics and benefits- Supply electricity for remote areas- CDM projects potential
Development of renewable energy sources: wind, geothermal, solar, biogas.
4
- Dependence on oil price on the world- High import price 1.25 more than gas import price => high electricity price- Import 1.3-2.4 billion USD/year
Table 1.7 Comparison of alternatives in balancing energy sources for electricity generation in period 2015 - 2020
19
Power sector & its forthcoming challenge
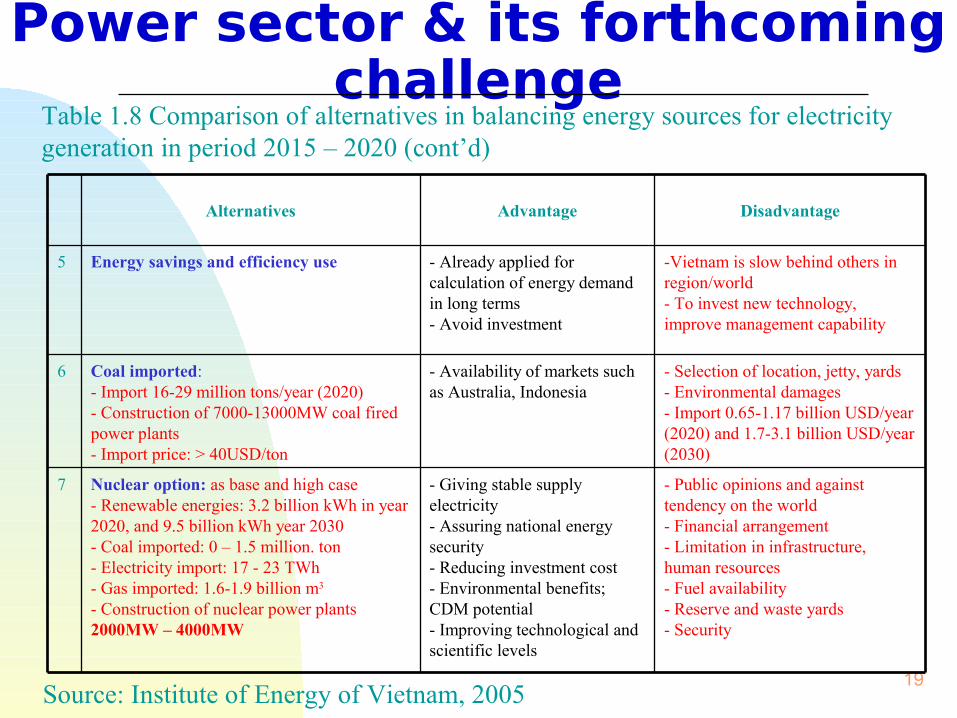
Table 1.8 Comparison of alternatives in balancing energy sources for electricity generation in period 2015 – 2020 (cont’d)
- Public opinions and against tendency on the world- Financial arrangement- Limitation in infrastructure, human resources- Fuel availability- Reserve and waste yards- Security
- Giving stable supply electricity- Assuring national energy security- Reducing investment cost- Environmental benefits; CDM potential- Improving technological and scientific levels
Nuclear option: as base and high case- Renewable energies: 3.2 billion kWh in year 2020, and 9.5 billion kWh year 2030 - Coal imported: 0 – 1.5 million. ton- Electricity import: 17 - 23 TWh- Gas imported: 1.6-1.9 billion m3
- Construction of nuclear power plants 2000MW – 4000MW
7
- Selection of location, jetty, yards- Environmental damages - Import 0.65-1.17 billion USD/year (2020) and 1.7-3.1 billion USD/year (2030)
- Availability of markets such as Australia, Indonesia
Coal imported: - Import 16-29 million tons/year (2020)- Construction of 7000-13000MW coal fired power plants- Import price: > 40USD/ton
6
-Vietnam is slow behind others in region/world- To invest new technology, improve management capability
- Already applied for calculation of energy demand in long terms- Avoid investment
Energy savings and efficiency use5
DisadvantageAdvantageAlternatives
Source: Institute of Energy of Vietnam, 2005
20
The analysis framework & modeling for sustainable power
sector developmentin Vietnam
21
The analysis framework
Vietnam has some models for power sector development such as WASP III (Wienna Automatic System Planning), PDPAT 2 (Power Development Planning Assistant Tool), PSS/E (Power System Simulator for Engineering), Strategist, IRP, and so on…
IRP (integrated resource planning) model is one of the best tools to analyze the important aspect of sustainable development of the power generation expansion planning. It can integrate both supply- and demand-side technology options into power generation expansion planning under the optimal objective of cost effective and friendly environment.
Also, IRP allows us to determine emissions mitigation mechanism (CDM) for long term sustainable power sector development.
22
The analysis framework
The integrated resource planning (IRP) model, developed by Energy Program of Asian Institute of Technology since 1998, is formulated as a mixed integer linear programming problem.
It finds out the least cost combination of electricity generation capacities of different types of plants and the level of end-use electrical appliances to be added and the level of power generated by different power plants in meeting electricity demand during a planning horizon.
Integer decision variables are the number of generation units to be installed in each year of the planning horizon. Other decision variables are generation of each power plant at each block of a season in a year, number of DSM appliances applied in each year and expected supply from external suppliers in each block.
23
IRP based Least-Cost Generation Planning Model
Capacity Mix
Optimal expansion plan
Technology generation mix
& Fuel mix
Emission Factors
Total Cost
CO2, SO2 and NOx Emissions
Electricity Generation Planning Model
Demand-sideData
Load curve & load demand
Emissions constraints
(CO2, SO2, NOx)
Supply-side Data Minimize: Total System Costs
{Capital + O&M +Fuel + DSM cost}
Subject to:
• Power demand constraints
• Annual energy constraints
• Hydro-energy constraints
• Reliability constraints
• Fuel or resource availability constraints
• Emission constraints
Figure 1.9 IRP - developed by Energy Program - AIT
24
IRP based Least-Cost Generation Planning Model
Capacity Mix
Optimal expansion plan
Technology generation mix
& Fuel mix
Emission Factors
Total Cost
CO2, SO2 and NOx Emissions
Electricity Generation Planning Model
Demand-sideData
Load curve & load demand
Emissions constraints
(CO2, SO2, NOx)
Supply-side Data Minimize: Total System Costs
{Capital + O&M +Fuel + DSM cost + Externality cost - cost of CO2 emission reduction}
Subject to:
• Power demand constraints
• Annual energy constraints
• Hydro-energy constraints
• Reliability constraints
• Fuel or resource availability constraints
• Emission constraints
CO2 Emissions credit
Externality cost
Figure 1.10 IRP - developed by Energy Program - AIT
25
IRP based Least-Cost Generation Planning Model
Carbon and energy tax
Fuel Price
IRP Model
Electricity Demand
Existing and Candidate Plant Data
Generation and Fuel Mix
Capacity Mix Total Cost
Electricity Price
CO2 Emission
Price Elasticity of Demand
Figure 1.11 Analysis framework with Carbon/Energy Tax
26
Some previous analyses of Mitigation of GHG and other
harmful emissions in power sector development
Case study of Vietnam
27
THE ROLE OF RENEWABLE ENERGY TECHNOLOGIES (RETs) IN VIETNAM POWER SECTOR UNDER CO2 REDUCTION TARGETS
(2006-2025)
ISSUE No.1
28
-To examine the effects of introducing CO2 emission reduction targets (5%, 10%, 15%, 20%, 30% annually) on the expansion electricity generation planning and the role of renewable energy generation technologies i.e. solar, wind, biomass integrated gasification combined cycle (BIGCC) in achieving such targets. - To address questions of at what CO2 emission reduction target, some of these technologies become cost effective and how much electricity would be generated cost effectively by using these technologies.
- To analyze effective technology costs for these technologies in power sector development in Vietnam.
Objectives
29
Candidate Supply Side Options
+ Candidate supply side options:+ Candidate supply side options:
- Small and mini hydro,- Small and mini hydro,- Wind & Solar- Wind & Solar- Biomass (wood residue, rice husk, bagasse)- Biomass (wood residue, rice husk, bagasse)
+ No DSM + No DSM + CO+ CO22 emission reduction targets: 5%, 10%, 15%, 20% and 30% emission reduction targets: 5%, 10%, 15%, 20% and 30%
per yearper year+ Planning horizon: 2006-2025+ Planning horizon: 2006-2025+ All prices in the study are based on price of 2000.+ All prices in the study are based on price of 2000.
30
TRP analysis framework
Total cost
Figure 1.12 TRP analysis with CO2 emission reduction targets
Existing & candidate plants data w/wo RETs
System Load Shape and Load Forecast
TRP Model
Optimal expansion plan
Emission factors
CO2, SO2 and NOx emission
Generation mix/Fuel mixCapacity mix
Annual CO2 emission reduction targets
31
0
500
1000
1500
2000
2500
0% 5% 10% 15% 20% 30%
CO2 emission reduction targets (%)
Ele
ctri
city
ge
ne
rati
on
(T
Wh
)
Hydro
Renewable energies
Coal
Gas
Oil
Total non renewable energies
Key FindingsInter-fuel and technology substitution effects (Figure 1.13): higher CO2 constraints push the power generation-mix towards less carbon intensive fuels and clean technologies such as natural gas, hydro and renewable energies (RETs)
Figure 1.13
32
As we can see in Table 1.9, it is quantified that: switching from coal to gas fired power plants was considerably significant
3373.145.121.0841.8812.8336.222.8730%
3380.5684.120.9439.4118.5736.030.9320%
3380.3473.130.9337.3921.6535.990.9215%
3381.0882.650.8735.1124.9635.920.5010%
3381.0932.120.8332.4628.4635.880.255%
3381.7151.900.8328.3633.6035.280.030% (Base
case)
OilGasCoal
ImportFossil fuel sources
HydroRenewable
sources
Total electricity generation
(TWh)
Share (%) of electricity generation during the planning horizon (TWh)
Share (%) of renewable electricity generation during the planning horizon (TWh)
Annual CO2
reduction target
Key Findings
Table 1.9 share of electricity generation by fuel types in period 2006 – 2025
331221.81496.718034.5154.5937.61530%
1217.91231.4960025.6685.82820%
1216.69731.07700.05824.2426.77715%
1214.3216.8020013.5473.25510%
1213.168.29004.9913.2995%
11931.0850001.0850% (Base case)
HydroSub total SolarWind BiomassSmall Hydro
Renewable sources
Total renewable electricity generation during the planning horizon (TWh)
Annual CO2
reduction target
Key FindingsAt what annual CO2 reduction target some of selected renewable generation technologies would become cost effective how much electricity would be generated cost effectively by using these technologies in TEP?Table 1.10 total electricity generation by RETs in period 2006 – 2025
34
0
20
40
60
80
100
120
0% 5% 10% 15% 20% 30%
CO2 emission reduction targets (%)
Ele
ctr
icit
y g
en
era
tio
n (
TW
h)
Small hydro
Biomass
Wind
Solar
Total renew able energy
- only small hydro would be the cost effective technologies at the current technology costs even at zero CO2 emission constraint- BIGCC and wind technologies would become cost effectively at 5% and 15% CO2 and at higher emission mitigation targets.- None of candidate solar-based power plants would be selected at all the specified CO2 emission reduction levels at all.
Key Findings
Figure 1.14 electricity generation by different RETs during 2006-2025
35
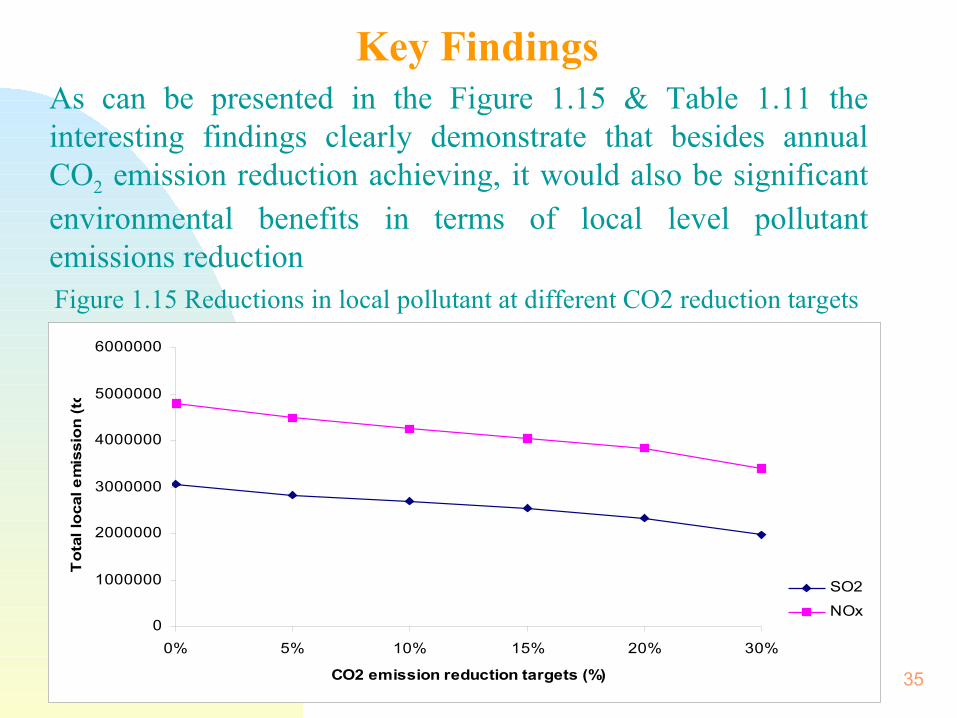
As can be presented in the Figure 1.15 & Table 1.11 the interesting findings clearly demonstrate that besides annual CO2 emission reduction achieving, it would also be significant environmental benefits in terms of local level pollutant emissions reduction
0
1000000
2000000
3000000
4000000
5000000
6000000
0% 5% 10% 15% 20% 30%
CO2 emission reduction targets (%)
To
tal lo
cal e
mis
sio
n (
ton
)
SO2
NOx
Key Findings
Figure 1.15 Reductions in local pollutant at different CO2 reduction targets
Total emissions emitted during 2006-2025CO2 emission
reduction targets (%)
Table 1.11 Percentage reductions in local pollutant at different CO2 reduction targets
Key Findings
37
Key FindingsThe electricity price in terms of long run average cost ($cent/kWh) and average incremental cost ($cent/kWh) would be increased with higher target rates of CO2 reduction (see Table 1.12).
2.972.3530%
2.912.2520%
2.922.2315%
2.922.2210%
2.932.215%
2.922.190%
Average incremental cost (cents/kWh)
Long run average cost (cents/kWh)
Electricity PricingCO2
emission reduction
targets
38
Key FindingsThe CO2 mitigation costs would increase at increasing CO2
emission reduction targets. The figures in Table 1.13 show that the CO2 mitigation costs in power sector in Vietnam would be significantly reduced with the adoption of selected renewable energy technologies as compared to the case without RETs.
51.0327.8417.0510.636.233.16MAC with RETs
-29.4818.7011.626.823.56MAC without RETs
30%25%20%15%10%5%
Marginal abatement cost (MAC) at different CO2 emission
reduction targets (US$/ton CO2)
Table 1.13 MAC at different CO2 emission reduction targets
39
Key Findings
Finally, it is interesting to find out the meaningfully lower CO2
marginal abatement costs in power sector as compared to Japan (US$ 159.2/ton CO2); European Union (US$74.5/ton CO2); USA (US$50.7/ton CO2); and OECD countries (US$ 63.6/ton CO2) implicate some power projects in Vietnam could be considerably effective for funding under the Clean Development Mechanism (CDM) as stipulated in the Kyoto Protocol of the United Nations Framework Convention on Climate Change (UNFCCC).
40
Analysis based renewable energy
technology cost There has been a meaningfully rapid innovation in advanced technology of small-scale power units that would make renewable energy technologies become more cost effective.
Thus the role of selected renewable energy technologies is examined and analyzed at different cost scenarios for these technologies from long term power development planning perspective. This obtains the following key findings:
Small hydro: some of small candidate hydro units got economically selected in the base case. The capacity cost of small hydro then was decreased by -10% to -20% of base case value then it was found that all small candidate hydro units got cost effectively selected. This indicates small hydro energy has attractive potential and effective possibility for CDM projects in Vietnam.
Key Findings
41
Analysis based renewable energy
technology cost Key Findings
Wood fired plant based BIGCC technology: not got cost effectively selected at the technology cost of 1365US$/kW in the base case. But all candidate wood fired plants would become economically selected at the decreasing technology cost of 10%. This implies the Wood fired plant based BIGCC technology has attractive potential and effective possibility for CDM projects in Vietnam
Wind: none of candidate wind farm plants got selected at the technology cost of 1700 $/kW. Results indicate that candidate wind farm plants would only be cost effectively generated at the technology cost of 1100 $/kW.
Rice husk plant based direct combustion, baggage plant based direct combustion, mini hydro and solar technologies: they are still not effectively competitive for electricity generation supply in Vietnam.
42
ISSUE No.2
Implications of Carbon & Energy Taxes as Instruments for GHG Reduction in the Power Sector
The Case of Vietnam
43
Candidate Supply Side Options + Candidate supply side options:+ Candidate supply side options:
1. Hydro plants1. Hydro plants
2. Coal & Oil fired power plants2. Coal & Oil fired power plants
3. High efficient technologies: 3. High efficient technologies:
- Gas turbine combined cycle plants- Gas turbine combined cycle plants
+ All prices in the study are based on price of 2000.+ All prices in the study are based on price of 2000.
+ Price Elasticity of demand estimated with - 0.3+ Price Elasticity of demand estimated with - 0.3
44
TRP analysis frameworkCarbon and energy tax
Fuel Price
TRP Model
Electricity Demand
Existing and Candidate Plant Data
Generation and Fuel MixCapacity Mix Total Cost
Electricity Price
CO2 Emission
Price Elasticity of Demand
Figure 1.16. Flowchart for analysis the implications of Carbon/Energy Tax
45
Key FindingsAt that higher level of carbon/energy tax would lead to less utilization of coal fired based power generation. Only 5.21% and 7.85% coal fired based power plants produced at highest rates of 200$/tC and 10$/Mbtu respectively. Share of gas based generation would increase from 21.95% in absence of carbon tax to 36.64% at carbon tax rate of US$200/tC while it would decrease to 10.45% at energy tax rate of US$10/Mbtu.
The result also presents the role of renewable energy based generation under carbon and energy tax in power sector would become economically attractive (wind and mini hydro) at tax rate of 25$/tC and beyond 1$/Mbtu.
No advanced technologies such as IGCC, FPBC; BIGCC would be economically effective in the expansion capacity generation planning in Vietnam even at highest studied tax rates of carbon and energy. This is because of the technology prices of these are still not enough competitively low to others, and RETs.
46
Key Findings
0
200000
400000
600000
800000
1000000
1200000
1400000
0 5 10 25 50 100 200
Ele
ctr
icity
gene
ratio
n (
GW
h)
Hydro
Coal
Gas
Import
FO & DO
RETs
Figure 1.17: Electricity generation (2006-2025) by fuel types at various carbon tax rates
47
Key Findings
Figure 1.18: Electricity generation (2006-2025) by fuel types at various energy tax rates
0
200000
400000
600000
800000
1000000
1200000
1400000
0 0.5 1 2 5 10
Elec
trici
ty g
ener
atio
n (G
Wh)
Hydro
Coal
Gas
Import
FO & DO
RETs
48
Key Findings
Technology Mix: Vietnam
0
4000
8000
12000
16000
20000
0 5 10 25 50 100 200 Tax ($/tc)
capa
city
add
ed (
MW
)
Conv. Coal GT Steam oil Import Hydro
NGCC Super critical Mini hydro Geothermal Wind
Technology Mix: Vietnam
0
4000
8000
12000
16000
0 0.5 1 2 5 10
Tax ($/ MBtu)hydro coal supercriticaloil GT NGCCImport Mini hydro GeothermalWind
Figure 1.19: Effects of carbon tax on generation technology mix during 2006-2025
Figure 1.20: Effects of energy tax on generation technology mix during 2006-2025
49
Key Findings
The study also shows that introduction of carbon/energy tax would not only reduce CO2 emission but also local pollutants as well.
The CO2 mitigation at all carbon tax rates is mainly due to the change in selection of power plant technology use rather than due to the change in electricity demand.
Introducing carbon and energy tax in Vietnam would definitely increase the average incremental cost (AIC).
It was found that for the same amount of CO2 emission reduction (10%), the average incremental cost (AIC) with carbon tax is lower than with energy tax in Vietnam. Also carbon tax is more cost effective than energy tax in mitigating CO2 emissions within the tax ranges studied.
50
Key Findings
77.1168.9078.110.0
55.3023.8447.75.0
31.0320.6426.12.0
18.8710.6215.31.0
10.496.958.80.5
NOxSO2CO2
Reduction (%)Energy tax(US$/MBtu)
Table 1.15: CO2 and local emissions mitigation reduction at different energy tax rates during the whole planning period, %
32.0562.345.35200
27.0855.540.04100
17.9719.8620.3550
12.2216.4515.3925
2.626.528.2610
1.143.575.085
NOxSO2CO2
Reduction (%)Carbon tax (US$/tC)
Table 1.14: CO2 and local emissions mitigation reduction at different carbon tax rates during the whole planning period, %
51
Key Findings
Table 1.17: The share of supply side effect and demand side effect to the total CO2
mitigation during the planning horizon at selected energy tax rates, %
Table 1.16: The share of supply side effect and demand side effect to the total CO2
mitigation during the planning horizon at selected carbon tax rates, %
Note: SSE = CO2 mitigation due to supply side effect
DSE = CO2 mitigation due to demand side effect
4.0795.93200
3.1496.86100
3.6396.3750
5.9894.0225
8.3091.7010
8.5391.475
DSESSE
Share (%)Carbon tax (US$/tC)
Note:SSE = CO2 mitigation due to supply side effect
DSE = CO2 mitigation due to demand side effect
65.2934.7110.0
62.3237.685.0
37.5862.422.0
52.7347.271.0
52.7147.290.5
DSESSE
Share (%)Energy tax(US$/MBtu)
52
Key Findings
3.62200
3.22100
3.0550
2.8925
2.7810
2.735
2.700
VietnamCarbon tax(US$/tC)
7.7010.0
5.435.0
4.042.0
3.361.0
3.040.5
2.700
VietnamEnergy tax(US$/MBtu)
Table 1.18: Average incremental cost during 2006-2025 at carbon tax rates (US¢/kWh)
Table 1.19: Average incremental cost during 2006-2025 at energy tax rates (US¢/kWh)
53
Key Findings
0
1
2
3
4
5
6
7
8
9
0 10 20 30 40 50 60 70 80 90
% CO2 Reduction
AIC
(U
Sc/
kWh)
Carbon tax Energy tax
Figure 21: CO2 emission reduction related to the AIC in Vietnam