Modelling long-term blanket peatland developmentin eastern ScotlandWard Swinnen1,2, Nils Broothaerts1, and Gert Verstraeten1
1Division of Geography and Tourism, Department of Earth and Environmental Sciences, KU Leuven, Leuven, 3000, Belgium2Research Foundation – Flanders (FWO), Brussels, 1000, Belgium
Received: 6 June 2019 – Discussion started: 14 June 2019Revised: 30 August 2019 – Accepted: 4 September 2019 – Published: 17 October 2019
Abstract. Blanket peatlands constitute a rare ecosystem ona global scale, but blanket peatland is the most importantpeatland type on the British Isles. Most long-term peatlanddevelopment models have focussed on peat bogs and high-latitude regions. Here, we present a process-based 2-D hills-lope model to simulate long-term blanket peatland develop-ment along complex hillslope topographies. To calibrate themodel, the peatland architecture was assessed along 56 hill-slope transects in the headwaters of the river Dee (633 km2)in eastern Scotland, resulting in a dataset of 866 soil pro-file descriptions. The application of the calibrated model us-ing local pollen-based land cover and regional climate re-constructions (mean annual temperature and mean monthlyprecipitation) over the last 12 000 years shows that the EarlyHolocene peatland development was largely driven by a tem-perature increase. An increase in woodland cover only hasa slight positive effect on the peat growth potential contra-dicting the hypothesis that blanket peatland developed as aresponse to deforestation. Both the hillslope measurementsand the model simulations demonstrate that the blanket peat-land cover in the study area is highly variable both in extentand peat thickness stressing the need for spatially distributedpeatland modelling. At the landscape scale, blanket peatlandswere an important atmospheric carbon sink during the period9.5–6 kyr BP. However, during the last 6000 years, the blan-ket peatlands were in a state of dynamic equilibrium withminor changes in the carbon balance.
1 Introduction
Peatlands occur across the globe and contain up to one thirdof the global soil carbon stock, despite covering approxi-mately less than 3 % of the Earth’s surface (Gorham, 1991;Xu et al., 2018). Especially at higher latitudes, peatlands arean important ecosystem type, and their dynamics have pro-foundly influenced the terrestrial carbon cycle throughout theHolocene (Yu et al., 2011). Unfortunately, little is knownabout long-term peatland dynamics and their response to cli-matic and land cover changes (Wu, 2012).
Blanket peatlands are spreads of peat of varying thickness,covering the underlying topography, thus “blanketing” thelandscape (Lindsay, 1995). This peatland type occurs in hy-peroceanic climates with cool and moist conditions through-out the year, and it is mostly confined to the maritime edgesof the continents (Gallego-Sala and Prentice, 2013). Due toits location in the landscape, blanket peatland formation ismore controlled by topography, compared to other peatlandtypes (Parry et al., 2012). Although rare on a global scale, upto 6 % of the area of the United Kingdom is covered by blan-ket peatland (Jones et al., 2003). The large area of the Scot-tish blanket peatlands, covering 23 % of the country, com-pared to the international rarity of these environments, makesthe Scottish peatlands a high-value target for conservation ef-forts (Fyfe et al., 2013; Tipping, 2008).
During the Holocene, large areas of blanket peatland havedeveloped throughout the Scottish Highlands, and this shiftfrom mineral to waterlogged and nutrient-poor organic soilsis one of the most important Holocene landscape changesin Scotland. Different hypotheses have been raised regardingthe cause of this peatland development (Tipping, 2008). Theoriginal hypothesis, as proposed by Moore, linked the blan-
Published by Copernicus Publications on behalf of the European Geosciences Union.
3978 W. Swinnen et al.: Modelling long-term blanket peatland development in eastern Scotland
ket peatland initiation to human impact, where anthropogenicland use change and increased grazing during the Neolithicperiod led to a shift in the hillslope hydrology resulting inthe paludification of the upland soils (Moore, 1973). Whilethis hypothesis has been supported by local studies through-out the British Isles, other authors have suggested that, atleast for Scotland, the initiation of blanket peatlands resultedfrom climatic changes during the Atlantic period (Ellis andTallis, 2000; Huang, 2002; Simmons and Innes, 1988; Tip-ping, 2008). A recent study based on a database of basalradiocarbon dates shows regional differences in the timingof the blanket peatland development with an earlier timingfor central and southern Scotland, compared to the other re-gions of the British Isles (Gallego-Sala et al., 2016). Mostof the case studies studying the blanket peatland initiationare based on field data such as pollen cores and radiocar-bon dating, but studying causalities based on timing aloneis difficult (Gallego-Sala et al., 2016). Process-based mod-elling of this landscape transformation could prove to be auseful technique, complementary to the field data, to provideinsight into the underlying processes and mechanisms.
In recent decades, several peatland models have beendeveloped, varying in spatial and temporal scale and inmodel complexity (Frolking et al., 2010). A good overviewof the models developed for simulating long-term peatlandbehaviour is given by Baird et al. (2012). Currently, sev-eral long-term peatland models such as DigiBog and theHolocene Peatland Model (HPM) allow for simulations ofpeatland processes and the feedbacks between ecology, hy-drology and peat properties over Holocene timescales (Bairdet al., 2012; Frolking et al., 2010). These models have beenapplied successfully within the context of peat bogs, but theyare difficult to transfer to blanket peatlands for two reasons.Firstly, these models are developed as cohort models, whereeach year a new peat layer is added to the soil profile and in-cluded in the calculations for the remaining part of the sim-ulations. As a result, these allow for the simulation of tem-poral changes in peat properties such as hydraulic conduc-tivity within the peat profile, but as the simulated time pe-riod increases, these models become computationally expen-sive, especially when a spatial dimension is added. Secondly,these models have been developed for peat bogs, which havea different peatland architecture compared to blanket peat-lands, and they are therefore not always adapted to simulat-ing peatland processes along complex hillslope topographies.These issues have been partially resolved by the MILLEN-NIA model, which has been designed specifically for blanketpeatlands (Heinemeyer et al., 2010). This model is also a co-hort model but incorporates additional processes which arespecific to blanket peat such as runoff-driven peat erosion.However, the high degree of detail in the model domain andthe representation of the processes make it difficult to applycohort models at the landscape scale.
In this study, a process-based peatland model is presentedwhich is able to simulate the hillslope hydrology and peat-
land dynamics along topographically complex hillslopes onHolocene timescales. Additionally, the representation of themodel domain is relatively simple using a diplotelmic peatprofile, making it computationally feasible to study peatlanddevelopment on a landscape scale by simulating a large num-ber of hillslope cross sections. The model is applied to theUpper Dee area in the Cairngorms National Park in easternScotland. The goal of this study is twofold: firstly, to applya relatively simple process-based peatland model to studythe long-term blanket peatland development in the ScottishHighlands on a landscape scale and secondly, to identify therelative importance of climatic and land cover changes forlong-term blanket peatland development.
2 Materials and methods
2.1 Study area
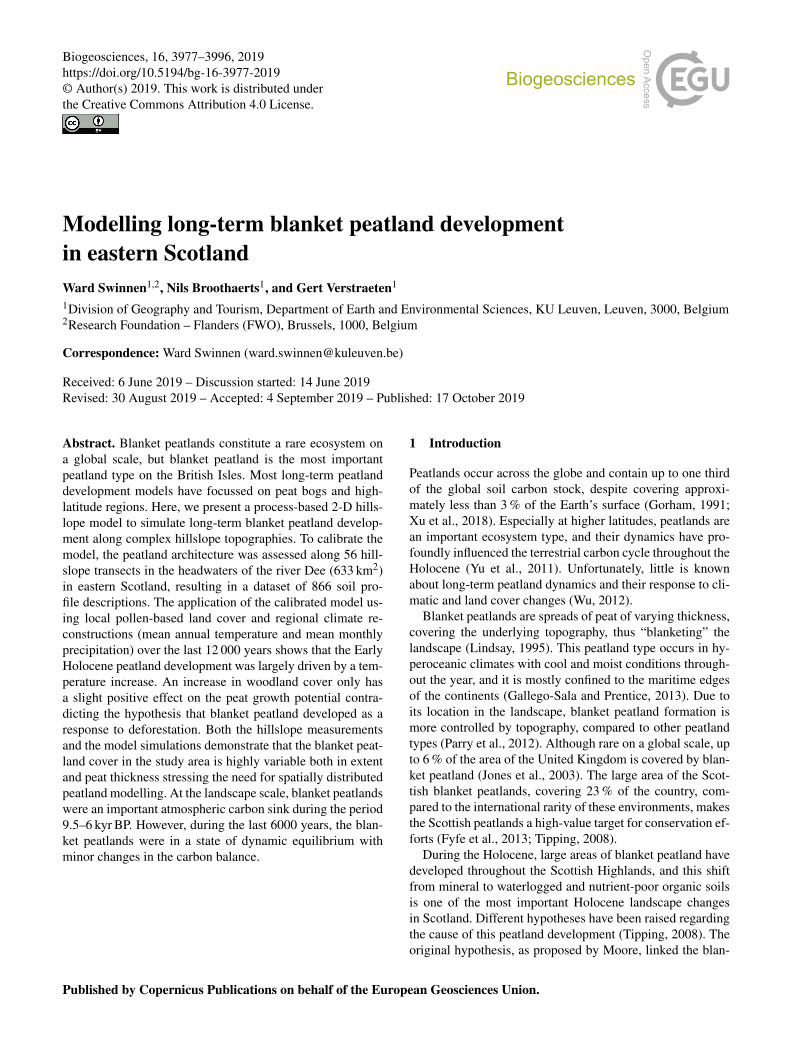
The study area consists of the headwaters of the river Deein eastern Scotland, with an elevation ranging from 322 to1309 m a.s.l. The area lies in the centre of the CairngormsNational Park and is managed by the Mar Lodge, Invercauldand Mar estates (Fig. 1). The geology of the Dee catch-ment is characterized by metamorphic and igneous rocks,with schists and granulites in the southern part of the studyarea and granite batholith intrusions in the north (Maizels,1985). The entire area was glaciated by the Scottish icesheet during the last ice age, which retreated between ap-proximately 16 kyr and 13.6 kyr BP. In contrast to the west-ern Highlands, the Cairngorms massif was not subjectedto widespread glacial expansion during the Younger Dryas(Loch Lomond Stadial). During this period, the glacial ac-tivity remained largely restricted to the cirques (Everest andKubik, 2006). The development of the current landscapeand soils in the Upper Dee area has been influenced bythe deglaciation, forming a wide variety of glacial and flu-vioglacial landforms (Ballantyne, 2008). In many parts of thestudy area, the bedrock is covered by glacial till of varyingthicknesses (Maizels, 1985). The summits and ridges mostlycarry skeletal soils and bedrock outcrops, while the slopes arecovered by blanket peat and alpine podzols (Smith, 1985).The peat deposits are found both lying directly on bedrockand overlying a layer of mineral sediment. This mineral sub-strate consists of gravel-rich silt loam and sandy loam in thesouthern part of the study area and sandy loam to loamy sandin the northern part.
Currently, the area is dominated by semi-natural landcover, including alpine and montane heath vegetation on thehighest summits, heather moorland, and small pockets of nat-ural forest (Tetzlaff and Soulsby, 2008). The total annual pre-cipitation ranges from 800 mm in the eastern part of the studyarea to almost 2000 mm on the mountain tops, with a sig-nificant proportion of the precipitation falling as snow dur-ing the winter months (Dunn et al., 2001). The temperature
W. Swinnen et al.: Modelling long-term blanket peatland development in eastern Scotland 3979
regimes can vary considerably within the study area. Thetown of Braemar (339 m a.s.l.) has a mean annual tempera-ture of 6.8 ◦C, ranging from 1.6 ◦C as a mean winter tem-perature (December–January–February; DJF) to 12.8 ◦C as amean summer temperature (June–July–August; JJA). In con-trast, the summit of Cairn Gorm (1245 m a.s.l.) has a meanannual temperature of 0.6 ◦C and ranges from a mean wintertemperature (DJF) of−2.6 ◦C to a mean summer temperature(JJA) of 5.3 ◦C.
Early Holocene traces of human presence have been foundwithin the study area, with archaeological evidence indicat-ing the presence of Mesolithic hunter–gatherer structures asearly as 8.2 cal kyr BP in the western part of the study area(Warren et al., 2018). The first traces of permanent settlementin the Upper Dee are from the village of Braemar around1000 CE (Paterson, 2011). In contrast to the western part ofScotland, the study area shows no traces of large scale peatextraction, which is probably due to the relatively thin peatprofiles and difficult access to the area (Maurer, 2015).
2.2 Field data
For the study area, the blanket peatland architecture wasassessed along 56 hillslope transects across the study areaduring field campaigns in 2015 and 2017 using soil cor-ings, laboratory analysis of peat samples and pollen cores(Fig. 1). The soil corings were taken along the hillslope tran-sects with a spacing of approximately 50 m using a gaugeauger. The hillslope topography was measured using post-processing real-time kinematic (RTK) GPS measurements.The transect locations were selected in order to include awide variety of lithologies, elevation zones and topographicparameters such as aspect, slope and curvature. Additionally,the carbon content, dry bulk density and water content of thepeat deposits were derived from 35 field samples, collectedas core sections with a length of 5 cm. These samples werecollected at random coring locations and at depths rangingfrom 5 to 165 cm below the surface. The regional vegetationevolution over the past 12 000 years was reconstructed basedon seven pollen cores located within the study area (Fig. 1).These cores provide vegetation information from differentelevation zones with varying distances to the low-lying val-leys of the Dee and the Spey (Birks, 1969; Hunter, 2016;Huntley, 1994; Paterson, 2011). Using the REVEALS (Re-gional Estimates of Vegetation Abundance from Large Sites)model (Sugita, 2007), the pollen percentages were convertedto regional vegetation fractions. REVEALS was developedto reconstruct regional vegetation composition using pollendata from large lakes, but previous studies has shown thata group of sites can also be used to estimate regional vege-tation cover (Fyfe et al., 2013; Mazier et al., 2012; Trond-man et al., 2016). Pollen type parameters (pollen produc-tivity and fall speed) were based on the standardized set ofMazier et al. (2012). The regional vegetation fractions weregrouped in five classes (coniferous trees, deciduous trees,
shrubs, heather, grasses and herbs) and used as land cover in-put in the hillslope model. As the land cover reconstructionfor Scotland based on REVEALS by Fyfe et al. does not in-clude pollen data from high-elevation sites, a new land coverreconstruction was made by Hunter for this study using localpollen data (Fyfe et al., 2013; Hunter, 2016).
At all coring locations, the soil profiles were describedbased on visual inspection, analysing the colour, texture andpossible presence of macroscopic remains (charcoal, wood,etc.). Based on the coring descriptions, the peat thicknesscould be derived. In this study, peat is defined as a darkorganic-rich layer of at least 10 cm thick without or with aminimal presence of mineral material based on visual inspec-tion. Organic-rich horizons with a clear presence of mineralmaterial were not classified as peat.
In total, 34 peat samples were radiocarbon dated at 17 lo-cations throughout the study area, encompassing a rangeof topographic situations and peat thicknesses (see Ap-pendix A2 for dating details). All radiocarbon dates were per-formed by the Belgian Royal Institute for Cultural Heritageand calibrated using the software OxCal 4.3 and the IntCal13calibration curve (Bronk Ramsey, 2009; Reimer et al., 2013).
2.3 Model outline
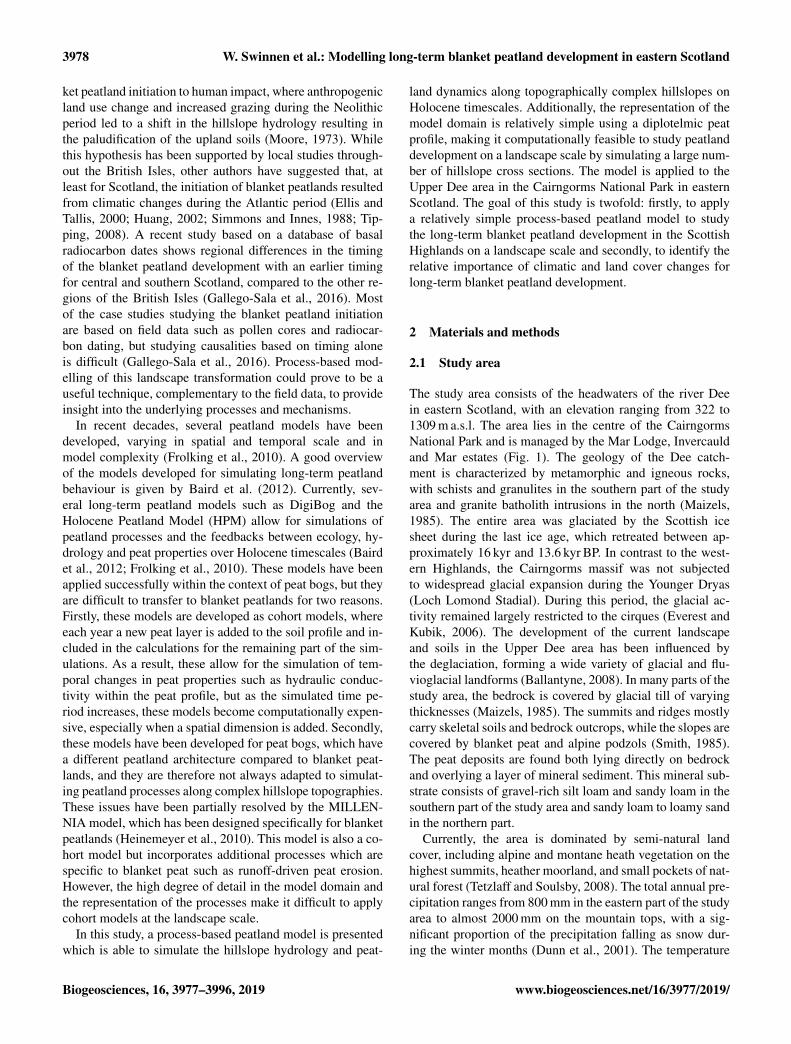
The model presented here is based on the concept of im-peded drainage, where environmental conditions such asbedrock topography can cause waterlogging and peat forma-tion (Alexandrov et al., 2016; Clymo, 1984; Ingram, 1982).The basic structure of the hillslope peatland model consistsof a hydrology module simulating the water table behaviouralong the hillslope, which is coupled to a peat growth modulesimulating biomass production and decomposition (Fig. 2).The model domain consists of a two-dimensional hillslopecross section, which is discretized in a series of model gridpoints. The stratigraphy consists of impermeable bedrock,overlain by a layer of glacial till, which is assumed to beporous. Over time, a peat profile can develop on top of this tillsubstrate when the right environmental conditions are met.The hillslope topography is based on the detailed GPS mea-surements for each coring location.
2.3.1 Hillslope hydrology module
The water table dynamics are modelled using a variant of theBoussinesq equation for a non-constant slope (Hilberts et al.,2004):
ε∂S
∂t=k
εcos i(x)
[B∂S
∂x+ S
∂B
∂x+ εS
∂i(x)
∂x
]+k
εsin i(x)
[ε∂S
∂x− SB
∂i(x)
∂x
]+ εN, (1)
with B = ∂∂xS, x as the distance to the hillslope bottom (m),
ε as the soil porosity (m m−1), S as the actual water storage(m), k as the hydraulic conductivity (m s−1), i as the bedrock
3980 W. Swinnen et al.: Modelling long-term blanket peatland development in eastern Scotland
Figure 1. Location of the Upper Dee area, with an indication of the hillslope transects and the pollen sites used for the land cover reconstruc-tion.
Figure 2. General model workflow. For a more detailed description of the model structure, the reader is referred to the text.
slope (m m−1), and N as the rainfall recharge or infiltration(m) (Hilberts et al., 2004). The Boussinesq equation is a sim-plified form of the full Richards equation for unsaturatedsoils by excluding a representation of the unsaturated zone.This simplification can be justified for peat soils given the of-ten shallow position of the water table in peatlands (Ballardet al., 2011; Paniconi et al., 2003). As a result, the Boussinesqequation assumes an instantaneous exchange of water (e.g.infiltration and evapotranspiration) between the surface andthe saturated zone of the soil profile. This simplified repre-sentation leads to a significant reduction of the computationaltime (Ballard et al., 2011). To enable the use of the Boussi-nesq equation for the simulation of the hillslope hydrology,local topographic depressions are filtered out. In this study,the Boussinesq equation is discretized using a forward-timecentral-space finite-difference scheme for the diffusion com-ponent and a 1st-order upwind finite-difference scheme forthe advection component (Campforts and Govers, 2015).
The diplotelmic nature of the model is represented bythe depth-integrated saturated hydraulic conductivity. Eachstratigraphic unit (mineral substrate, catotelm and acrotelm)has a specific saturated hydraulic conductivity value. Thebedrock is excluded from the water table depth calculationsas it is assumed to be impermeable.
A simple snow module is included in the hydrologicalmodel, with precipitation falling as snow during periods withsub-zero temperatures. The amount of melt is based on adegree day factor model. Snow sublimation is not explic-itly represented in the model. For each time step, infiltra-tion and saturation excess overland flow is calculated. Theproduced runoff is assumed to leave the hillslope beforethe next time step. For open peatland vegetation types, allrainfall is assumed to be able to infiltrate for intensities be-low 2 mm h−1. For higher intensities, the infiltration rate in-creases with higher precipitation rates.
W. Swinnen et al.: Modelling long-term blanket peatland development in eastern Scotland 3981
with “ir” as the infiltration rate (mm h−1) and p as the precip-itation rate (mm h−1) (Holden and Burt, 2002). For woodlandpeatlands, infiltration rates of up to 30 mm h−1 are reported(Cairns et al., 1978). In the model, this maximal infiltrationrate of 30 mm h−1 is used for a fully forested peatland. Thefinal infiltration rate at a certain location is determined basedon linear interpolation between the infiltration rates of openand forested peatland based on the percentage of woodlandcover at each model grid point.
The potential plant transpiration and soil evaporation(mm d−1) are calculated separately based on the leaf area in-dex (LAI), which enables differentiation based on the vege-tation cover (Eq. 3) (Williams et al., 1983).
Esoil = Epote(−0.4LAI)
Eplant =EpotLAI
3, 0 ≤ LAI ≤ 3
Eplant = Epot− Esoil, LAI > 3, (3)
with Esoil as the soil evaporation rate (mm d−1), Eplant as theplant transpiration rate (mm d−1) and Epot as the potentialevapotranspiration rate (mm d−1), which is calculated usingthe Thornthwaite equation based on the mean monthly tem-perature.
The actual evapotranspiration rate (AET) (mm d−1) is cal-culated as a function of the water table depth (Eq. 4). If agrid point consists of glacial till without a peat cover, theAET is at the potential rate when the water table is at the sur-face (z1 = 0) and decreases linearly until depth z2. If peat ispresent, the actual evapotranspiration is assumed to be at thepotential rate if the water table is located in the upper hori-zon (z1 is the acrotelm thickness) and decreases linearly untildepth z2 (m) (Frolking et al., 2010; Lafleur et al., 2005). Inthis study, z2 is set to 1 m for both the glacial till and peatsoils. In contrast to more detailed peatland models such asthe MILLENNIA model, the relationship of the AET to thewater table depth is not influenced by changes in vegetationgroups and their root properties, resulting in constant valuesfor z1 and z2 throughout the simulations (Carroll et al., 2015).
AETt =(Esoil+ Eplant
) z2−wt
z2− z1, for z1 ≤ wt ≤ z2. (4)
Since detailed local climate reconstructions are scarce,several peatland modelling studies have used continentalor at best regional climate reconstructions (mostly pollen-based) which were fine-tuned using local climate informa-tion (Frolking et al., 2010; Heinemeyer et al., 2010; Morriset al., 2015). Here, a similar approach is used. Input data fortemperature and precipitation values are based on a Euro-pean gridded dataset of mean annual temperature and meanmonthly precipitation anomalies for the last 12 000 years de-rived from pollen data with a spatial resolution of 1◦× 1◦
and a temporal resolution of 500 years (Fig. 3) (Mauri etal., 2015). As total annual precipitation amounts and meanannual temperatures vary considerably throughout the study
area, the precipitation and temperature data were correctedfor orographic effects. Data from eight meteorological sta-tions in the vicinity of the study area were used to constructlinear regression models, correcting the mean daily precipi-tation amount and mean annual temperature for each locationbased on the elevation (Eqs. 5–6) (see Appendix A1 for theweather station details).
P = (0.003776 ·E) + 1.669 (5)
and
MAT= (−0.0083 ·E)+ 13.2839, (6)
with P as the mean daily precipitation amount (mm), E asthe elevation (m a.s.l.) and MAT as the mean annual temper-ature (◦C). Additional local climate information was addedto the climate reconstruction data by incorporating randomvariability to the reconstructed temperature and precipitationdata, based on the variability as observed in the weather sta-tion of Braemar for the period 1853–2010. The relativelylow spatial and temporal resolution of the continental-scaleclimate reconstruction will probably lead to the underrepre-sentation of short-lived events and local climate variability.However, by incorporating the orographic corrections andrandom variability, local climate information is used to fine-tune the records and increase both the spatial and temporalvariability. The time series used as model inputs are basedon daily temperature and hourly precipitation data from theweather station of Braemar, which are rescaled using both theregression equations for elevation effects and the long-termanomalies for temperature and precipitation (Fig. 3). As a re-sult, precipitation and temperature series with a high tempo-ral resolution are used throughout the entire studied period.The model is run with a spatial resolution of 50 m, similarto the average coring distance. The time resolution is set to400 s for the hillslope hydrology module and 1 year for thepeat growth module to ensure model stability.
2.3.2 Peat growth module
The peat accumulation at each grid point is calculated asthe balance between biomass production and decomposition.In the literature, several relatively simple equations can befound to calculate the net primary production (NPP) based onclimatic data (mean annual temperature, total annual rainfallor potential evapotranspiration) such as the Miami model orthe Thornthwaite memorial model of which some have beenimplemented in peatland models (Heinemeyer et al., 2010;Lieth, 1973; Lieth and Box, 1972). In some cases, such asthe Miami model, the NPP is calculated based on multipleclimatic variables (rainfall and temperature), using the min-imum value of both equations as the final NPP value. How-ever, given the climatic conditions of the Scottish Highlands,precipitation is not a limiting factor for biomass production.As a consequence, the biomass production is simulated as
3982 W. Swinnen et al.: Modelling long-term blanket peatland development in eastern Scotland
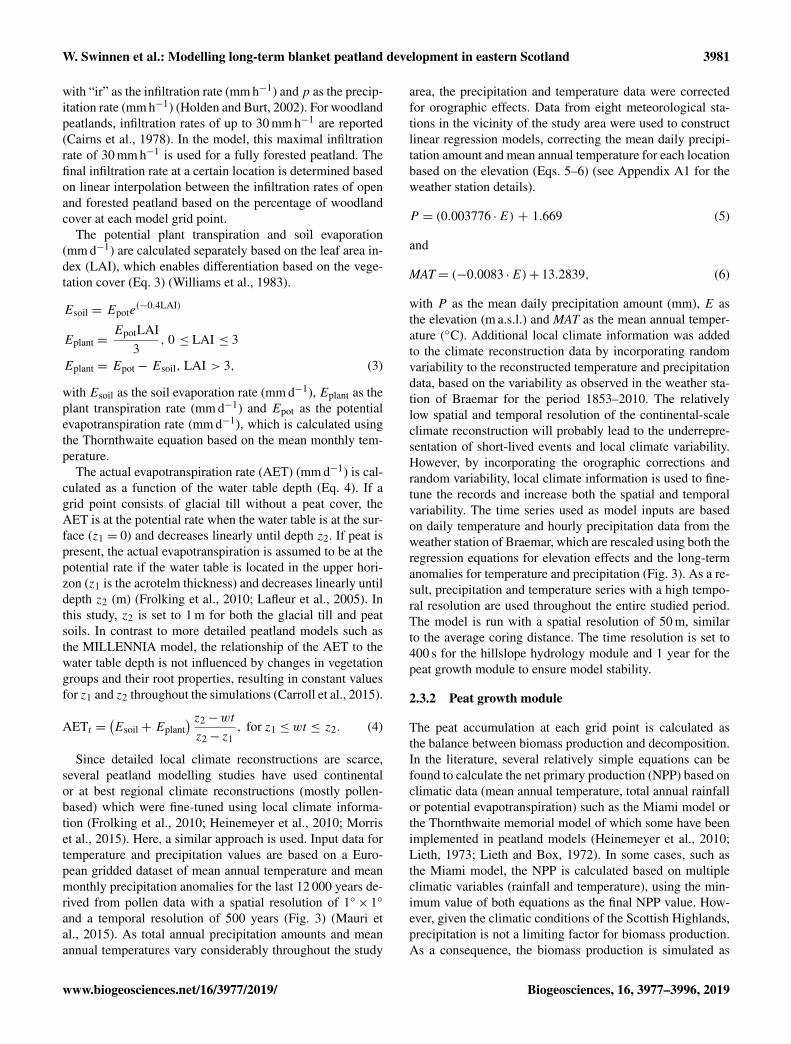
Figure 3. Reconstructed mean annual temperature (◦C) and mean monthly precipitation (mm month−1) anomalies for the period 12 kyr–100 BP with a 500-year interval for the location of Braemar. Values extracted from a gridded European dataset with a spatial resolution of1◦× 1◦ (Mauri et al., 2015).
a function of the mean annual temperature using a powerfunction regression equation based on field data for the MoorHouse–Upper Teesdale National Nature Reserve in northernEngland (Garnett, 1998), corrected for the woodland cover.A possible disadvantage of this simple approach is the depen-dence of the biomass production calculations on the qualityof the climate and land cover reconstructions.
NPP= 60.06(
MAT1.134)·
(1+
(wc
wcmax·wi
)), (7)
with NPP as the net primary production (g m−2 a−1), MAT asthe mean annual temperature at the grid point location (◦C),wct as the woodland fraction, wcmax as the woodland per-centage of a fully forested peatland, and wi as the percent-age increase in NPP between an open and wooded peatland.In general, the NPP is higher for wooded peatland comparedto open peatland vegetation, with reported values of a 12 %increase for bogs and 17 % for fens (Beilman and Yu, 2001;Szumigalski and Bayley, 1997). In this study, wi is set to15 % and wcmax to 40 %.
The peat column at each grid point is divided in an oxicand anoxic zone based on the calculated mean annual watertable height. The total decomposition can thus be written as
D = k1 ·wt + k2 · (h−wt), (8)
with D as the total decomposition (m a−1), k1 and k2 asthe rates of decomposition under anoxic and oxic conditions(yr−1), h as the thickness of the soil profile above the bedrock(m), andwt as the height of the water table above the bedrock(m) (Hilbert et al., 2000). The decomposition rates are depen-dent on the mean annual air temperature using a Q10 tem-perature multiplier, which is the ratio by which the biomassrespiration rate increases under a 10 ◦C temperature increase.The range in Q10 values mentioned in the literature is large,but Chapman and Thurlow demonstrated that Q10 values aregenerally higher for temperatures between 0 and 5 ◦C (Chap-man and Thurlow, 1998). This effect can be attributed to the
fact that as temperatures rise above the freezing point, moremicrobial groups will become active, leading to relativelylarge changes in respiration rates for small changes in tem-perature. As a result, twoQ10 values are used in this study. AQ10 value of 2.2 is used for temperatures above 5 ◦C, and 3.7is used for temperatures between−4 and 5 ◦C. Below−4 ◦C,the decomposition is assumed to cease completely (Chapmanand Thurlow, 1998; Rosswall, 1973 as cited by Clymo, 1984;Wieder and Yavitt, 1994; Wu, 2012). The biological moduleruns on an annual timescale. Based on the calculated peataccumulation rate, the hillslope topography is updated annu-ally.
2.3.3 Peatland initiation
Simulations start with a hillslope consisting of an imperme-able bedrock covered by glacial till. As the thickness of thetill is not known at each location, it is assumed to have a con-stant thickness of 50 cm. Over time, the organic matter ac-cumulates within the upper 30 cm of the mineral soil form-ing an organic-rich horizon based on the balance betweenbiomass production and decomposition. When a threshold isexceeded, additional organic matter which is produced startsto accumulate as peat at that location, with the properties ofan acrotelm. In this study, the threshold is set at an amountof organic matter equivalent to a peat layer with a thicknessof 10 cm using the median dry bulk density and organic-carbon percentage of the 35 peat samples collected in thefield. This ensures that a similar definition for peat is usedboth for the hillslope corings as for the model simulations.Once the peat thickness exceeds the thickness of the acrotelmlayer, the peat layer becomes diplotelmic, with the peat be-low the acrotelm having the properties of the catotelm. Oncethe biomass within the simulated peat profile decreases be-low the biomass threshold, the grid point is no longer con-sidered to be covered by a peat layer and only mineral soilproperties are taken into account.
W. Swinnen et al.: Modelling long-term blanket peatland development in eastern Scotland 3983
2.3.4 Boundary conditions
The impermeable bedrock below the glacial till is used asa zero-flux boundary condition at the bottom of the modeldomain. At several locations throughout the study area, rivershave eroded the stream bank, exposing the peat. At the lowerend of the hillslope, the water storage is thus set to a fixedvalue, representing the depth of the river. For the grid point atthe top of the hillslope transect, a lateral zero-flux boundaryis assumed.
2.4 Model calibration and validation
Model calibration is based on the measured mean peat thick-ness per topographic class. In total, nine topographic classeswere defined by dividing both the measured slope and cur-vature at each coring location into three classes, resultingin nine possible combinations. The calibration procedure re-sulted in topographic class limits of 0.098 and 0.135 m m−1
for the slope and −0.184×10⁻³ m−1 and 0.184×10⁻³ m−1
for the curvature. For all 56 hillslope transects, the modelledmean peat thickness per topographic class after 12 000 yearsof simulation is compared to the mean peat thickness mea-sured in the field. In total, three model parameters were cal-ibrated: the decomposition rates under oxic and anoxic con-ditions and the acrotelm thickness. The goodness of fit ofeach parameter combination was evaluated based on the min-imization of the root mean square error (RMSE) between themean modelled and measured peat thickness per topographicclass. Out of the 866 hillslope corings, 433 were selectedrandomly to be used as calibration points and the others asvalidation points. Since the spacing between the soil coringsis slightly variable, the model results were resampled to thelocations of the soil corings using linear interpolation.
As an additional validation of the model behaviour, thesimulated peat growth initiation dates for all model gridpoints can be evaluated against a dataset of basal radiocarbondates for blanket peat deposits in the upland regions of Scot-land with an elevation above 300 m a.s.l. (n= 30) (Gallego-Sala et al., 2016). The dataset was expanded by incorporat-ing 17 additional basal radiocarbon dates on peat depositsfrom within the study area (see Appendix A2 for dating de-tails). For each of the 17 locations within the study area forwhich radiocarbon dates were available, the basal age wasestimated using the clam (Classical Age–Depth Modellingof Cores from Deposits) 2.2 software package to constructage–depth models and extrapolate to the bottom of the peatlayer (Blaauw, 2010). As the available initiation dates basedon radiocarbon dating were not necessarily taken at the mod-elled transect locations, the comparison between modelledand observed peat growth initiation is based on the probabil-ity density curves using a bin width of 500 years. Depend-ing on the amount of available radiocarbon dates at eachlocation, some estimates of the peat growth initiation datewere based on the extrapolation of the age–depth model over
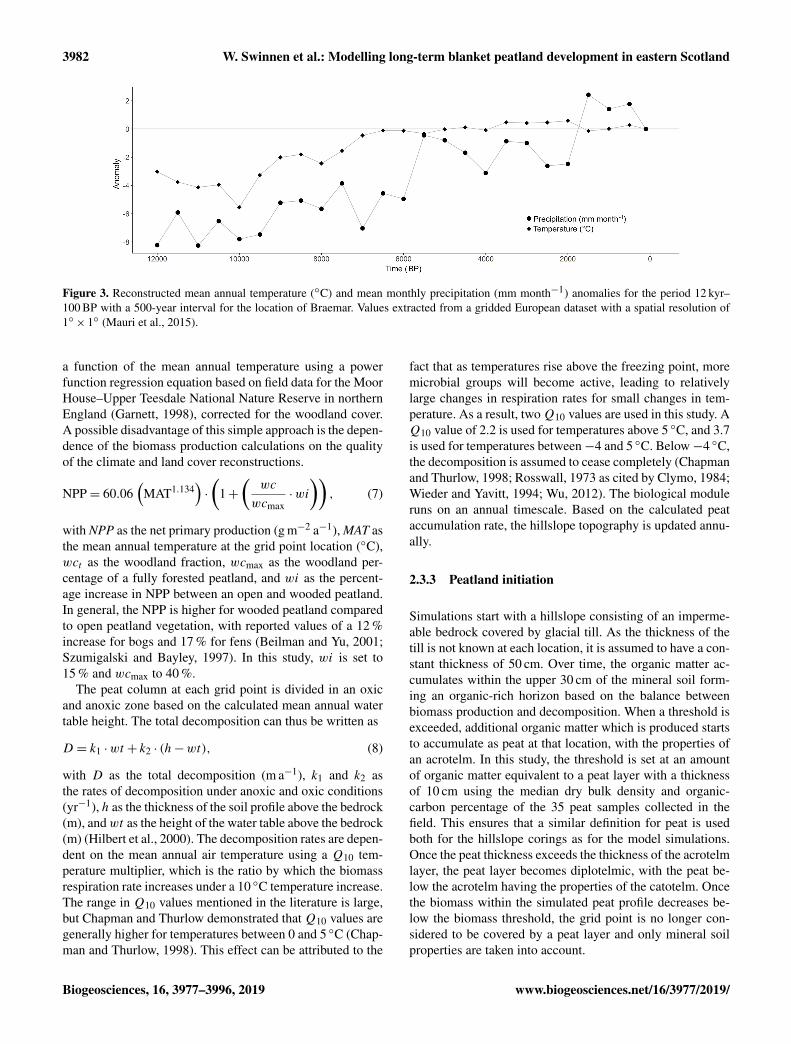
Figure 4. Mean measured peat thickness at the hillslope transects(n= 56).
large sections of the peat profile. To analyse the effect of theage–depth model extrapolation on the resultant probabilitydensity curve, an additional probability density curve wasconstructed containing only those radiocarbon dated sampleswhich were directly measured at the bottom of a peat layer(n= 20).
3 Results
3.1 Field measurements
In total, soil coring descriptions were made at 866 locationsthroughout the study area (detailed descriptions and locationdata can be found in the data availability section, Swinnen,2019a, b). Based on the definition of peat used in this study,57 % of the coring locations contained a surface peat layer,with a mean measured peat thickness over all coring loca-tions of 36 cm and a maximal value of 3 m. The mean mea-sured peat thickness per hillslope transect varies between 0and 96 cm (Fig. 4). Overall, the transects with a high meanpeat thickness can be found in the upstream parts of tribu-taries of the river Dee. Strong spatial variability occurs, evenat small distances, making the peat cover throughout the areahighly variable in both occurrence and mean thickness. Themean measured peat thickness per topographic class rangesfrom 23.6±31.9 cm for the class with a moderate slope and aconvex curvature to 54.1± 65.3 cm for the topographic classwith a low slope and a straight curvature. Based on 35 ran-domly selected soil samples, which were identified in thefield as peat, the median organic-carbon percentage was cal-culated to be 51.9± 7.3 % and the dry bulk density was cal-culated to be 0.128± 0.063 g cm−3.
3984 W. Swinnen et al.: Modelling long-term blanket peatland development in eastern Scotland
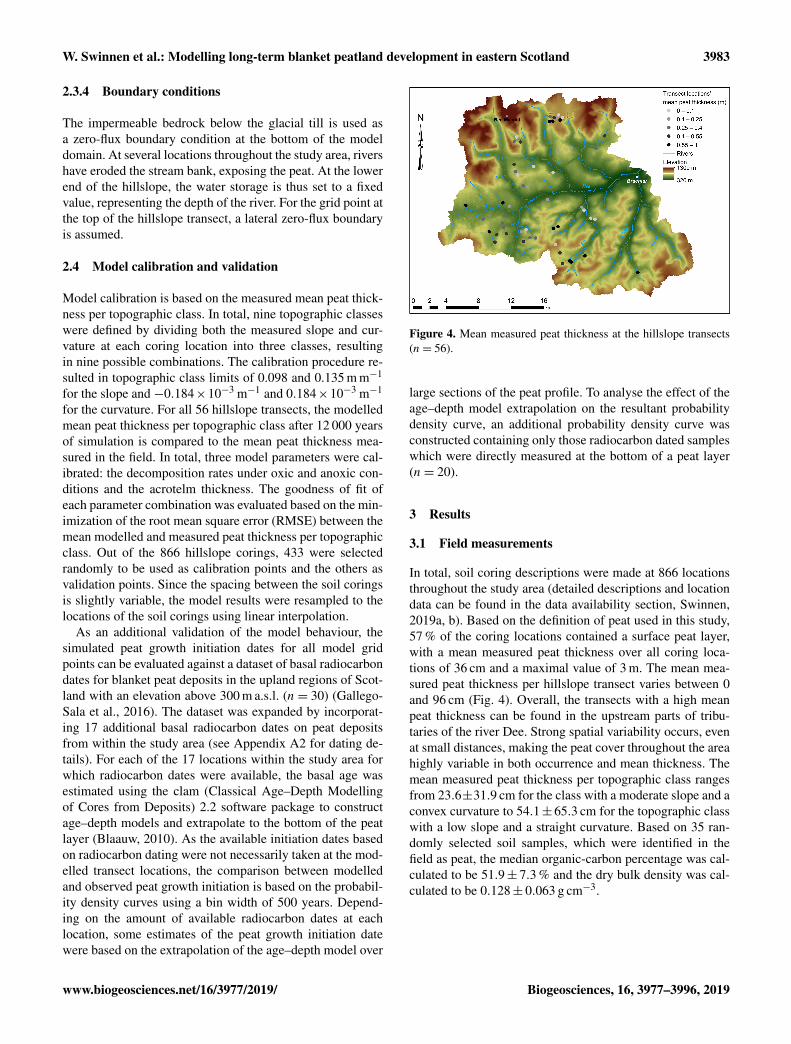
Figure 5. (a) Scatterplot of the measured peat thickness (m) as afunction of the bedrock slope (%) and (b) scatterplot of the surfaceslope (%) as a function of the bedrock slope (%) for all coring loca-tions (n= 866). The slope calculations are based on the measuredcoordinates of the coring locations.
As the model is based on the principle of impededdrainage, there is an assumed relationship between thebedrock slope and the peat thickness at a certain location.The peat thickness data indicate that this relationship ispresent, showing a clear decrease in the maximum thicknesswith an increasing bedrock slope. However, the variability,especially at lower slope angles, indicates that shallow peatlayers or even the absence of peat is observed for every slopevalue (Fig. 5a). In the Boussinesq equation, the bedrock slopeis used instead of the surface slope. One could argue that thebedrock slope might not relate directly to the surface slopein, for example, local depressions filled with peat. However,the comparison of the bedrock slope and surface slope for allcoring locations indicate a clear and strong relationship be-tween both, with the observed range in slope values stronglyexceeding the differences between the bedrock and surfaceslope at a single location (Fig. 5b). As a result, the use ofthe bedrock slope is thus unlikely to introduce a bias in themodelled peat thickness values.
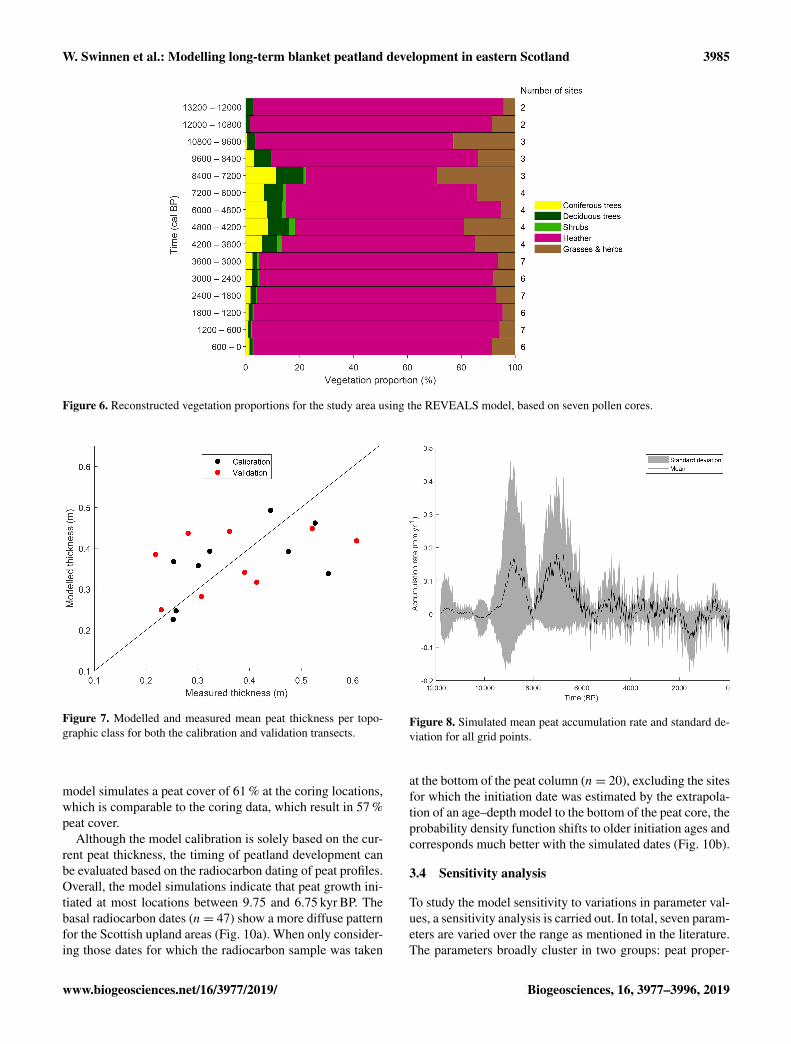
The pollen-based reconstructed land cover shows anEarly Holocene woodland increase until the period 8.4–7.2 cal kyr BP (Fig. 6). This period is followed by a generalwoodland decline, with the woodland cover dropping below5 % from 3.6 cal kyr BP onwards. The reconstructions for theindividual pollen cores show an important east–west gradi-ent in terms of maximal forest cover, with higher woodlandpercentages for the eastern and lower-lying part of the studyarea (Paterson, 2011). The woodland is a mixed type con-taining both coniferous species (Scots pine) and deciduousspecies (birch, rowan and aspen). A study by Fyfe et al. re-constructed the Holocene vegetation over Scotland using theREVEALS model for seven sites across the Scottish main-land, resulting in a maximal forest extent by 6.7 cal kyr BP(Fyfe et al., 2013). The data presented here show an earlierwoodland cover decline around 7.2 cal kyr BP and a largerproportion of coniferous species in the forest composition.
In comparison to the sites of Fyfe et al., the woodland coverappears to be relatively low, with an open heather landscapeprevailing during the period under study, which can be at-tributed to the relatively high elevation of the study area.
3.2 Model calibration
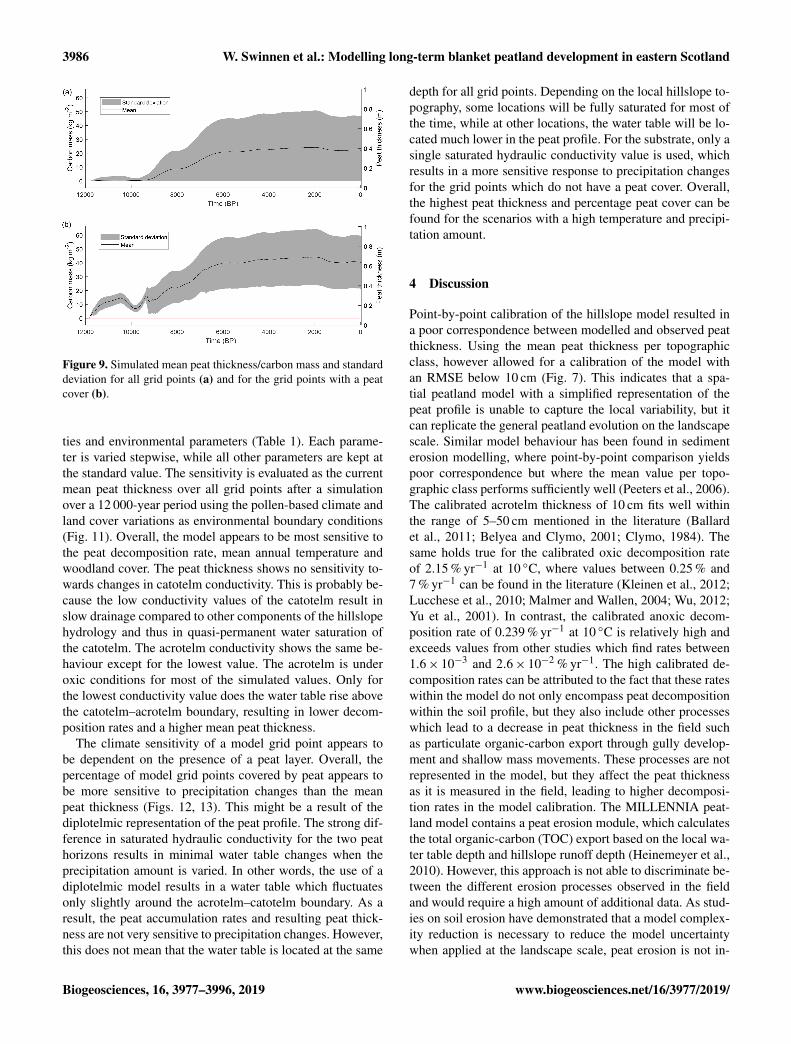
Point-by-point calibration resulted in poor correspondencebetween the modelled and observed peat thickness. As aconsequence, the model parameters were calibrated basedon the mean peat thickness per topographic class. In total,nine topographic classes were constructed by classifying allcoring locations based on the slope and the hillslope cur-vature. The best fitting parameter combination results in anacrotelm thickness of 10 cm, an oxic decomposition rate at10 ◦C of 2.15 % yr−1 and an anoxic decomposition rate at10 ◦C of 0.24 % yr−1, which corresponds to an oxic/anoxicdecomposition ratio of 9. These values correspond largely tothose reported in the literature (Ballard et al., 2011; Clymo,1984; Wu, 2012; Yu et al., 2001). The RMSE on the meanpeat thickness for the best fitting parameter combination is9.53 cm (Fig. 7).
3.3 Blanket peatland development
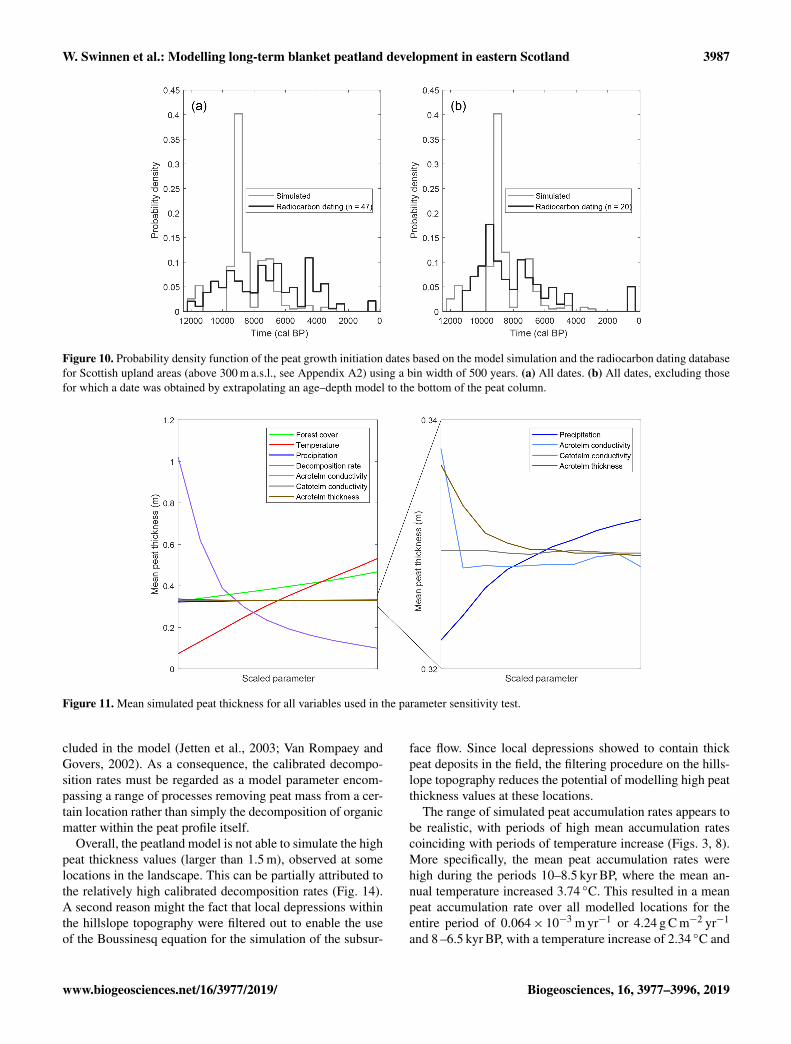
The calibrated model was run to simulate the long-term blan-ket peatland development since 12 kyr BP for the 56 hills-lope transects using the calibrated parameter values. The re-constructed land cover history (Fig. 6) is used for vegeta-tion evolution throughout the simulations. Overall, the modelsimulations indicate that mean peat accumulation rates werelow until 9.5 kyr BP, with small variations between the dif-ferent grid points (Fig. 8). Later, the accumulation ratesincreased and were high during two phases in the EarlyHolocene: 9.5–8.5 and 8–6.5 kyr BP. From 6 to 2 kyr BP, therates were relatively stable and slightly positive on average.A long-term decrease in accumulation rates occurred be-tween 2 and 1 kyr BP, which increased again to positive val-ues around 0.5 kyr BP. The mean peat and carbon accumula-tion rate over all grid points and for the entire studied periodis 0.03× 10⁻³ m yr−1 and 1.79 g C m−2 yr−1. The maximalmean peat and carbon accumulation rate over the entire stud-ied period is 0.18×10⁻³ m yr−1 and 11.95 g C m−2 yr−1 andoccurs at 7050 BP.
Figure 9 indicates the evolution of the mean peat thicknessand corresponding organic-carbon mass over all hillslopetransects. The mean peat thickness reaches a maximal valueof 0.36 m around 2 kyr BP and declines slightly afterwardsto the current value of 0.33 m or 22.04 kg C m−2. Overall,the peatland development occurs mostly before 6 kyr BP andshows limited variations afterwards, with a slight decline inmean peat thickness between 2 and 1 kyr BP. When only themodel grid points with peat cover are considered, the max-imal value for the modelled mean thickness is 0.66 m, de-clining to 0.61 m nowadays or 40.25 kg C m−2. In total, the
W. Swinnen et al.: Modelling long-term blanket peatland development in eastern Scotland 3985
Figure 6. Reconstructed vegetation proportions for the study area using the REVEALS model, based on seven pollen cores.
Figure 7. Modelled and measured mean peat thickness per topo-graphic class for both the calibration and validation transects.
model simulates a peat cover of 61 % at the coring locations,which is comparable to the coring data, which result in 57 %peat cover.
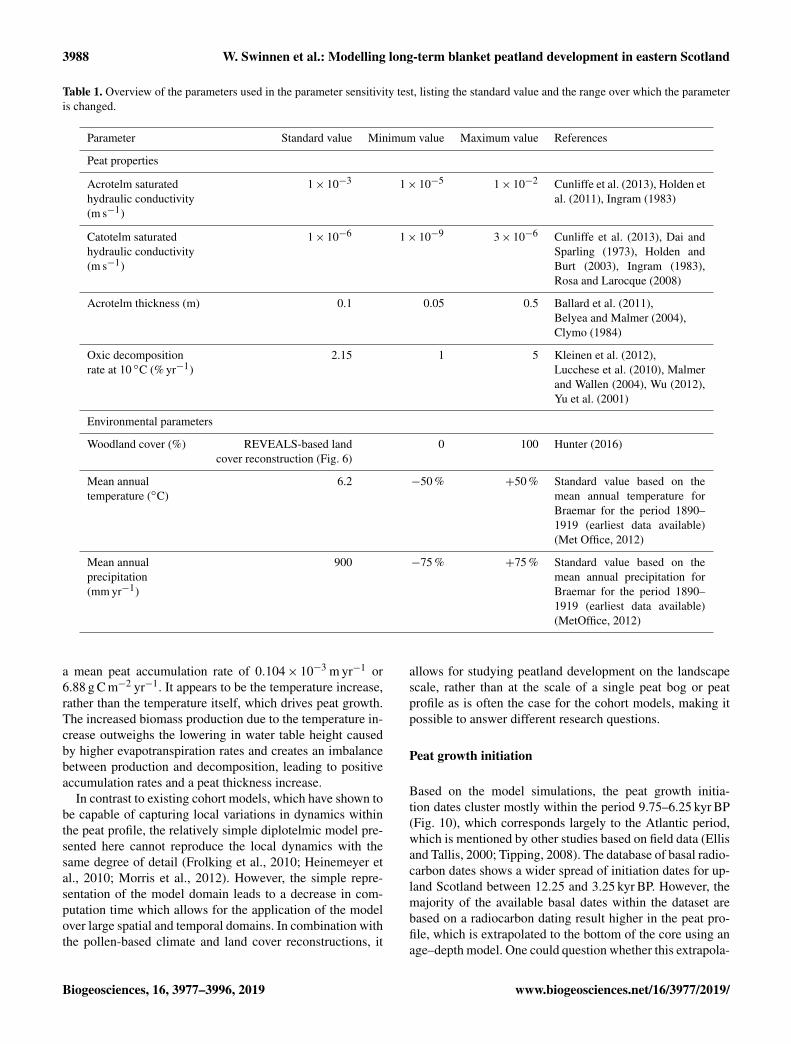
Although the model calibration is solely based on the cur-rent peat thickness, the timing of peatland development canbe evaluated based on the radiocarbon dating of peat profiles.Overall, the model simulations indicate that peat growth ini-tiated at most locations between 9.75 and 6.75 kyr BP. Thebasal radiocarbon dates (n= 47) show a more diffuse patternfor the Scottish upland areas (Fig. 10a). When only consider-ing those dates for which the radiocarbon sample was taken
Figure 8. Simulated mean peat accumulation rate and standard de-viation for all grid points.
at the bottom of the peat column (n= 20), excluding the sitesfor which the initiation date was estimated by the extrapola-tion of an age–depth model to the bottom of the peat core, theprobability density function shifts to older initiation ages andcorresponds much better with the simulated dates (Fig. 10b).
3.4 Sensitivity analysis
To study the model sensitivity to variations in parameter val-ues, a sensitivity analysis is carried out. In total, seven param-eters are varied over the range as mentioned in the literature.The parameters broadly cluster in two groups: peat proper-
3986 W. Swinnen et al.: Modelling long-term blanket peatland development in eastern Scotland
Figure 9. Simulated mean peat thickness/carbon mass and standarddeviation for all grid points (a) and for the grid points with a peatcover (b).
ties and environmental parameters (Table 1). Each parame-ter is varied stepwise, while all other parameters are kept atthe standard value. The sensitivity is evaluated as the currentmean peat thickness over all grid points after a simulationover a 12 000-year period using the pollen-based climate andland cover variations as environmental boundary conditions(Fig. 11). Overall, the model appears to be most sensitive tothe peat decomposition rate, mean annual temperature andwoodland cover. The peat thickness shows no sensitivity to-wards changes in catotelm conductivity. This is probably be-cause the low conductivity values of the catotelm result inslow drainage compared to other components of the hillslopehydrology and thus in quasi-permanent water saturation ofthe catotelm. The acrotelm conductivity shows the same be-haviour except for the lowest value. The acrotelm is underoxic conditions for most of the simulated values. Only forthe lowest conductivity value does the water table rise abovethe catotelm–acrotelm boundary, resulting in lower decom-position rates and a higher mean peat thickness.
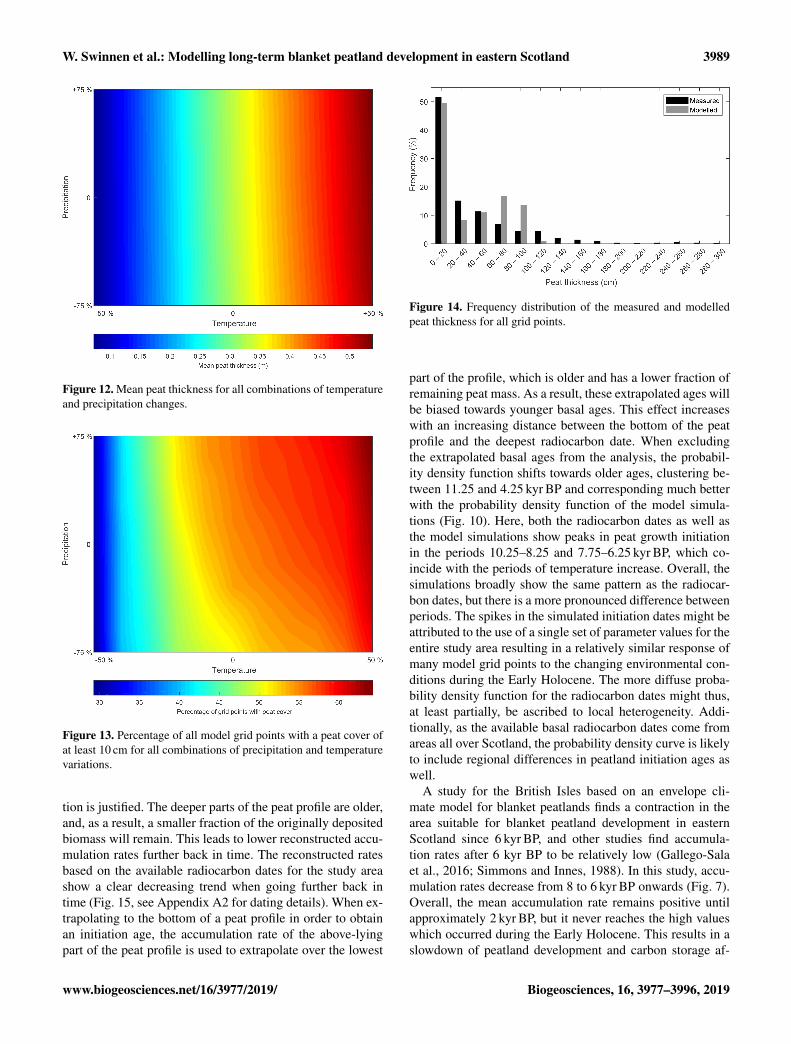
The climate sensitivity of a model grid point appears tobe dependent on the presence of a peat layer. Overall, thepercentage of model grid points covered by peat appears tobe more sensitive to precipitation changes than the meanpeat thickness (Figs. 12, 13). This might be a result of thediplotelmic representation of the peat profile. The strong dif-ference in saturated hydraulic conductivity for the two peathorizons results in minimal water table changes when theprecipitation amount is varied. In other words, the use of adiplotelmic model results in a water table which fluctuatesonly slightly around the acrotelm–catotelm boundary. As aresult, the peat accumulation rates and resulting peat thick-ness are not very sensitive to precipitation changes. However,this does not mean that the water table is located at the same
depth for all grid points. Depending on the local hillslope to-pography, some locations will be fully saturated for most ofthe time, while at other locations, the water table will be lo-cated much lower in the peat profile. For the substrate, only asingle saturated hydraulic conductivity value is used, whichresults in a more sensitive response to precipitation changesfor the grid points which do not have a peat cover. Overall,the highest peat thickness and percentage peat cover can befound for the scenarios with a high temperature and precipi-tation amount.
4 Discussion
Point-by-point calibration of the hillslope model resulted ina poor correspondence between modelled and observed peatthickness. Using the mean peat thickness per topographicclass, however allowed for a calibration of the model withan RMSE below 10 cm (Fig. 7). This indicates that a spa-tial peatland model with a simplified representation of thepeat profile is unable to capture the local variability, but itcan replicate the general peatland evolution on the landscapescale. Similar model behaviour has been found in sedimenterosion modelling, where point-by-point comparison yieldspoor correspondence but where the mean value per topo-graphic class performs sufficiently well (Peeters et al., 2006).The calibrated acrotelm thickness of 10 cm fits well withinthe range of 5–50 cm mentioned in the literature (Ballardet al., 2011; Belyea and Clymo, 2001; Clymo, 1984). Thesame holds true for the calibrated oxic decomposition rateof 2.15 % yr−1 at 10 ◦C, where values between 0.25 % and7 % yr−1 can be found in the literature (Kleinen et al., 2012;Lucchese et al., 2010; Malmer and Wallen, 2004; Wu, 2012;Yu et al., 2001). In contrast, the calibrated anoxic decom-position rate of 0.239 % yr−1 at 10 ◦C is relatively high andexceeds values from other studies which find rates between1.6× 10−3 and 2.6× 10⁻² % yr−1. The high calibrated de-composition rates can be attributed to the fact that these rateswithin the model do not only encompass peat decompositionwithin the soil profile, but they also include other processeswhich lead to a decrease in peat thickness in the field suchas particulate organic-carbon export through gully develop-ment and shallow mass movements. These processes are notrepresented in the model, but they affect the peat thicknessas it is measured in the field, leading to higher decomposi-tion rates in the model calibration. The MILLENNIA peat-land model contains a peat erosion module, which calculatesthe total organic-carbon (TOC) export based on the local wa-ter table depth and hillslope runoff depth (Heinemeyer et al.,2010). However, this approach is not able to discriminate be-tween the different erosion processes observed in the fieldand would require a high amount of additional data. As stud-ies on soil erosion have demonstrated that a model complex-ity reduction is necessary to reduce the model uncertaintywhen applied at the landscape scale, peat erosion is not in-
W. Swinnen et al.: Modelling long-term blanket peatland development in eastern Scotland 3987
Figure 10. Probability density function of the peat growth initiation dates based on the model simulation and the radiocarbon dating databasefor Scottish upland areas (above 300 m a.s.l., see Appendix A2) using a bin width of 500 years. (a) All dates. (b) All dates, excluding thosefor which a date was obtained by extrapolating an age–depth model to the bottom of the peat column.
Figure 11. Mean simulated peat thickness for all variables used in the parameter sensitivity test.
cluded in the model (Jetten et al., 2003; Van Rompaey andGovers, 2002). As a consequence, the calibrated decompo-sition rates must be regarded as a model parameter encom-passing a range of processes removing peat mass from a cer-tain location rather than simply the decomposition of organicmatter within the peat profile itself.
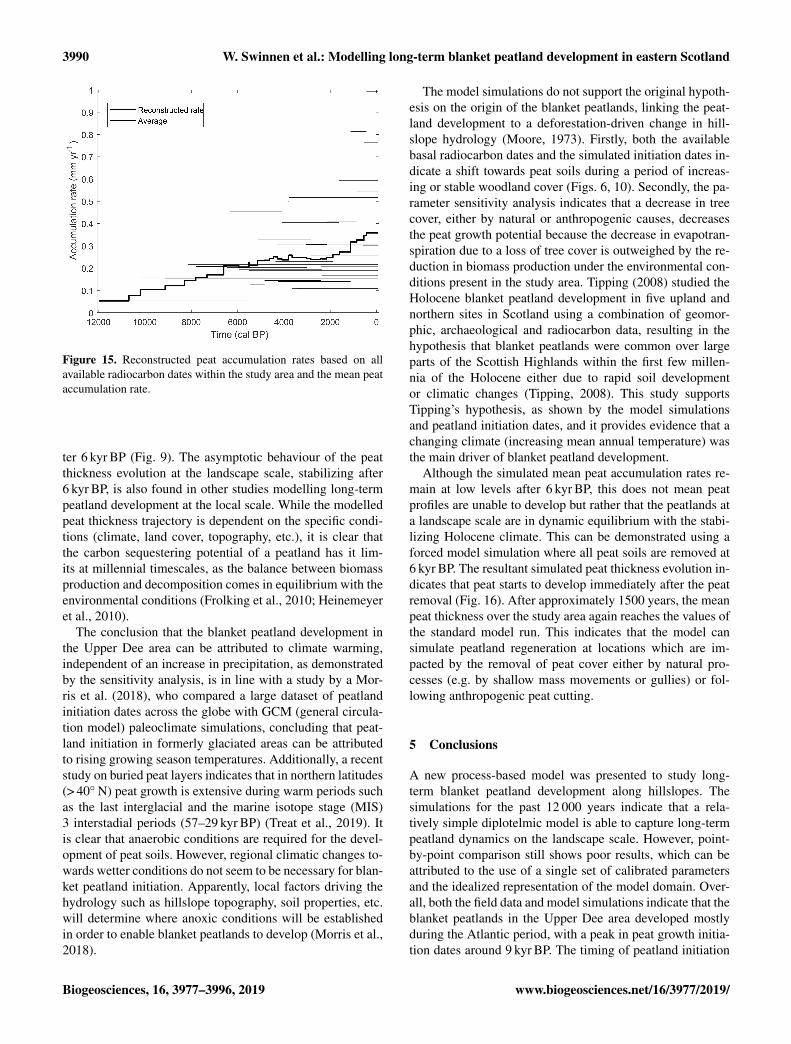
Overall, the peatland model is not able to simulate the highpeat thickness values (larger than 1.5 m), observed at somelocations in the landscape. This can be partially attributed tothe relatively high calibrated decomposition rates (Fig. 14).A second reason might the fact that local depressions withinthe hillslope topography were filtered out to enable the useof the Boussinesq equation for the simulation of the subsur-
face flow. Since local depressions showed to contain thickpeat deposits in the field, the filtering procedure on the hills-lope topography reduces the potential of modelling high peatthickness values at these locations.
The range of simulated peat accumulation rates appears tobe realistic, with periods of high mean accumulation ratescoinciding with periods of temperature increase (Figs. 3, 8).More specifically, the mean peat accumulation rates werehigh during the periods 10–8.5 kyr BP, where the mean an-nual temperature increased 3.74 ◦C. This resulted in a meanpeat accumulation rate over all modelled locations for theentire period of 0.064× 10⁻³ m yr−1 or 4.24 g C m−2 yr−1
and 8 –6.5 kyr BP, with a temperature increase of 2.34 ◦C and
3988 W. Swinnen et al.: Modelling long-term blanket peatland development in eastern Scotland
Table 1. Overview of the parameters used in the parameter sensitivity test, listing the standard value and the range over which the parameteris changed.
Parameter Standard value Minimum value Maximum value References
6.2 −50 % +50 % Standard value based on themean annual temperature forBraemar for the period 1890–1919 (earliest data available)(Met Office, 2012)
Mean annualprecipitation(mm yr−1)
900 −75 % +75 % Standard value based on themean annual precipitation forBraemar for the period 1890–1919 (earliest data available)(MetOffice, 2012)
a mean peat accumulation rate of 0.104× 10⁻³ m yr−1 or6.88 g C m−2 yr−1. It appears to be the temperature increase,rather than the temperature itself, which drives peat growth.The increased biomass production due to the temperature in-crease outweighs the lowering in water table height causedby higher evapotranspiration rates and creates an imbalancebetween production and decomposition, leading to positiveaccumulation rates and a peat thickness increase.
In contrast to existing cohort models, which have shown tobe capable of capturing local variations in dynamics withinthe peat profile, the relatively simple diplotelmic model pre-sented here cannot reproduce the local dynamics with thesame degree of detail (Frolking et al., 2010; Heinemeyer etal., 2010; Morris et al., 2012). However, the simple repre-sentation of the model domain leads to a decrease in com-putation time which allows for the application of the modelover large spatial and temporal domains. In combination withthe pollen-based climate and land cover reconstructions, it
allows for studying peatland development on the landscapescale, rather than at the scale of a single peat bog or peatprofile as is often the case for the cohort models, making itpossible to answer different research questions.
Peat growth initiation
Based on the model simulations, the peat growth initia-tion dates cluster mostly within the period 9.75–6.25 kyr BP(Fig. 10), which corresponds largely to the Atlantic period,which is mentioned by other studies based on field data (Ellisand Tallis, 2000; Tipping, 2008). The database of basal radio-carbon dates shows a wider spread of initiation dates for up-land Scotland between 12.25 and 3.25 kyr BP. However, themajority of the available basal dates within the dataset arebased on a radiocarbon dating result higher in the peat pro-file, which is extrapolated to the bottom of the core using anage–depth model. One could question whether this extrapola-
W. Swinnen et al.: Modelling long-term blanket peatland development in eastern Scotland 3989
Figure 12. Mean peat thickness for all combinations of temperatureand precipitation changes.
Figure 13. Percentage of all model grid points with a peat cover ofat least 10 cm for all combinations of precipitation and temperaturevariations.
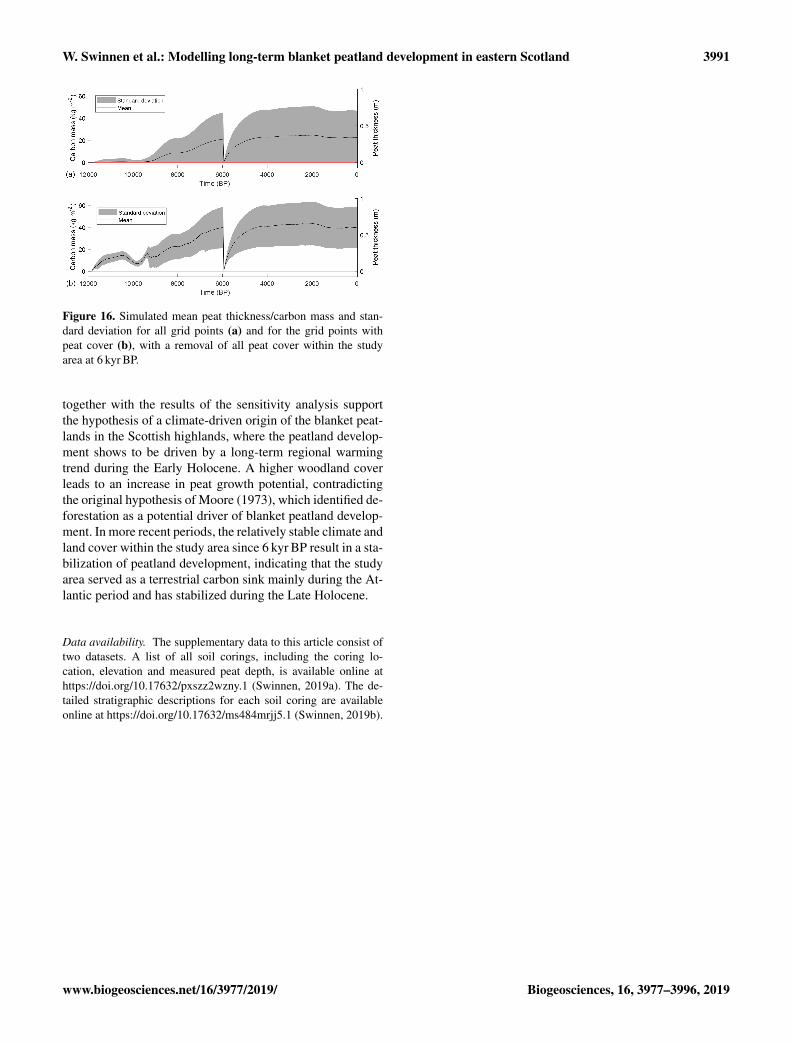
tion is justified. The deeper parts of the peat profile are older,and, as a result, a smaller fraction of the originally depositedbiomass will remain. This leads to lower reconstructed accu-mulation rates further back in time. The reconstructed ratesbased on the available radiocarbon dates for the study areashow a clear decreasing trend when going further back intime (Fig. 15, see Appendix A2 for dating details). When ex-trapolating to the bottom of a peat profile in order to obtainan initiation age, the accumulation rate of the above-lyingpart of the peat profile is used to extrapolate over the lowest
Figure 14. Frequency distribution of the measured and modelledpeat thickness for all grid points.
part of the profile, which is older and has a lower fraction ofremaining peat mass. As a result, these extrapolated ages willbe biased towards younger basal ages. This effect increaseswith an increasing distance between the bottom of the peatprofile and the deepest radiocarbon date. When excludingthe extrapolated basal ages from the analysis, the probabil-ity density function shifts towards older ages, clustering be-tween 11.25 and 4.25 kyr BP and corresponding much betterwith the probability density function of the model simula-tions (Fig. 10). Here, both the radiocarbon dates as well asthe model simulations show peaks in peat growth initiationin the periods 10.25–8.25 and 7.75–6.25 kyr BP, which co-incide with the periods of temperature increase. Overall, thesimulations broadly show the same pattern as the radiocar-bon dates, but there is a more pronounced difference betweenperiods. The spikes in the simulated initiation dates might beattributed to the use of a single set of parameter values for theentire study area resulting in a relatively similar response ofmany model grid points to the changing environmental con-ditions during the Early Holocene. The more diffuse proba-bility density function for the radiocarbon dates might thus,at least partially, be ascribed to local heterogeneity. Addi-tionally, as the available basal radiocarbon dates come fromareas all over Scotland, the probability density curve is likelyto include regional differences in peatland initiation ages aswell.
A study for the British Isles based on an envelope cli-mate model for blanket peatlands finds a contraction in thearea suitable for blanket peatland development in easternScotland since 6 kyr BP, and other studies find accumula-tion rates after 6 kyr BP to be relatively low (Gallego-Salaet al., 2016; Simmons and Innes, 1988). In this study, accu-mulation rates decrease from 8 to 6 kyr BP onwards (Fig. 7).Overall, the mean accumulation rate remains positive untilapproximately 2 kyr BP, but it never reaches the high valueswhich occurred during the Early Holocene. This results in aslowdown of peatland development and carbon storage af-
3990 W. Swinnen et al.: Modelling long-term blanket peatland development in eastern Scotland
Figure 15. Reconstructed peat accumulation rates based on allavailable radiocarbon dates within the study area and the mean peataccumulation rate.
ter 6 kyr BP (Fig. 9). The asymptotic behaviour of the peatthickness evolution at the landscape scale, stabilizing after6 kyr BP, is also found in other studies modelling long-termpeatland development at the local scale. While the modelledpeat thickness trajectory is dependent on the specific condi-tions (climate, land cover, topography, etc.), it is clear thatthe carbon sequestering potential of a peatland has it lim-its at millennial timescales, as the balance between biomassproduction and decomposition comes in equilibrium with theenvironmental conditions (Frolking et al., 2010; Heinemeyeret al., 2010).
The conclusion that the blanket peatland development inthe Upper Dee area can be attributed to climate warming,independent of an increase in precipitation, as demonstratedby the sensitivity analysis, is in line with a study by a Mor-ris et al. (2018), who compared a large dataset of peatlandinitiation dates across the globe with GCM (general circula-tion model) paleoclimate simulations, concluding that peat-land initiation in formerly glaciated areas can be attributedto rising growing season temperatures. Additionally, a recentstudy on buried peat layers indicates that in northern latitudes(> 40◦ N) peat growth is extensive during warm periods suchas the last interglacial and the marine isotope stage (MIS)3 interstadial periods (57–29 kyr BP) (Treat et al., 2019). Itis clear that anaerobic conditions are required for the devel-opment of peat soils. However, regional climatic changes to-wards wetter conditions do not seem to be necessary for blan-ket peatland initiation. Apparently, local factors driving thehydrology such as hillslope topography, soil properties, etc.will determine where anoxic conditions will be establishedin order to enable blanket peatlands to develop (Morris et al.,2018).
The model simulations do not support the original hypoth-esis on the origin of the blanket peatlands, linking the peat-land development to a deforestation-driven change in hill-slope hydrology (Moore, 1973). Firstly, both the availablebasal radiocarbon dates and the simulated initiation dates in-dicate a shift towards peat soils during a period of increas-ing or stable woodland cover (Figs. 6, 10). Secondly, the pa-rameter sensitivity analysis indicates that a decrease in treecover, either by natural or anthropogenic causes, decreasesthe peat growth potential because the decrease in evapotran-spiration due to a loss of tree cover is outweighed by the re-duction in biomass production under the environmental con-ditions present in the study area. Tipping (2008) studied theHolocene blanket peatland development in five upland andnorthern sites in Scotland using a combination of geomor-phic, archaeological and radiocarbon data, resulting in thehypothesis that blanket peatlands were common over largeparts of the Scottish Highlands within the first few millen-nia of the Holocene either due to rapid soil developmentor climatic changes (Tipping, 2008). This study supportsTipping’s hypothesis, as shown by the model simulationsand peatland initiation dates, and it provides evidence that achanging climate (increasing mean annual temperature) wasthe main driver of blanket peatland development.
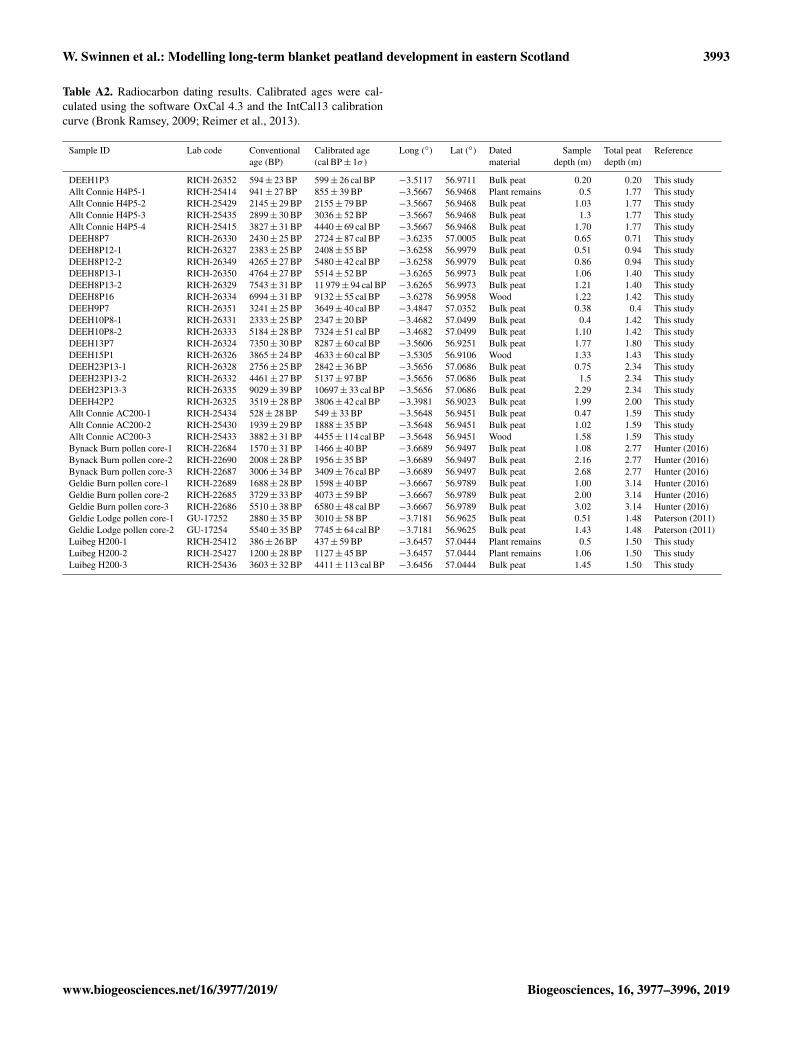
Although the simulated mean peat accumulation rates re-main at low levels after 6 kyr BP, this does not mean peatprofiles are unable to develop but rather that the peatlands ata landscape scale are in dynamic equilibrium with the stabi-lizing Holocene climate. This can be demonstrated using aforced model simulation where all peat soils are removed at6 kyr BP. The resultant simulated peat thickness evolution in-dicates that peat starts to develop immediately after the peatremoval (Fig. 16). After approximately 1500 years, the meanpeat thickness over the study area again reaches the values ofthe standard model run. This indicates that the model cansimulate peatland regeneration at locations which are im-pacted by the removal of peat cover either by natural pro-cesses (e.g. by shallow mass movements or gullies) or fol-lowing anthropogenic peat cutting.
5 Conclusions
A new process-based model was presented to study long-term blanket peatland development along hillslopes. Thesimulations for the past 12 000 years indicate that a rela-tively simple diplotelmic model is able to capture long-termpeatland dynamics on the landscape scale. However, point-by-point comparison still shows poor results, which can beattributed to the use of a single set of calibrated parametersand the idealized representation of the model domain. Over-all, both the field data and model simulations indicate that theblanket peatlands in the Upper Dee area developed mostlyduring the Atlantic period, with a peak in peat growth initia-tion dates around 9 kyr BP. The timing of peatland initiation
W. Swinnen et al.: Modelling long-term blanket peatland development in eastern Scotland 3991
Figure 16. Simulated mean peat thickness/carbon mass and stan-dard deviation for all grid points (a) and for the grid points withpeat cover (b), with a removal of all peat cover within the studyarea at 6 kyr BP.
together with the results of the sensitivity analysis supportthe hypothesis of a climate-driven origin of the blanket peat-lands in the Scottish highlands, where the peatland develop-ment shows to be driven by a long-term regional warmingtrend during the Early Holocene. A higher woodland coverleads to an increase in peat growth potential, contradictingthe original hypothesis of Moore (1973), which identified de-forestation as a potential driver of blanket peatland develop-ment. In more recent periods, the relatively stable climate andland cover within the study area since 6 kyr BP result in a sta-bilization of peatland development, indicating that the studyarea served as a terrestrial carbon sink mainly during the At-lantic period and has stabilized during the Late Holocene.
Data availability. The supplementary data to this article consist oftwo datasets. A list of all soil corings, including the coring lo-cation, elevation and measured peat depth, is available online athttps://doi.org/10.17632/pxszz2wzny.1 (Swinnen, 2019a). The de-tailed stratigraphic descriptions for each soil coring are availableonline at https://doi.org/10.17632/ms484mrjj5.1 (Swinnen, 2019b).
3992 W. Swinnen et al.: Modelling long-term blanket peatland development in eastern Scotland
Appendix A
Table A1. MIDAS (Met Office Integrated Data Archive System)weather stations used for the construction of the regression equa-tions for orographic temperature and precipitation corrections.
Station name MIDAS station Elevation Latitude Longitudecode (m a.s.l.) (◦N) (◦W)
W. Swinnen et al.: Modelling long-term blanket peatland development in eastern Scotland 3993
Table A2. Radiocarbon dating results. Calibrated ages were cal-culated using the software OxCal 4.3 and the IntCal13 calibrationcurve (Bronk Ramsey, 2009; Reimer et al., 2013).
Sample ID Lab code Conventional Calibrated age Long (◦) Lat (◦) Dated Sample Total peat Referenceage (BP) (cal BP± 1σ ) material depth (m) depth (m)
DEEH1P3 RICH-26352 594± 23 BP 599± 26 cal BP −3.5117 56.9711 Bulk peat 0.20 0.20 This studyAllt Connie H4P5-1 RICH-25414 941± 27 BP 855± 39 BP −3.5667 56.9468 Plant remains 0.5 1.77 This studyAllt Connie H4P5-2 RICH-25429 2145± 29 BP 2155± 79 BP −3.5667 56.9468 Bulk peat 1.03 1.77 This studyAllt Connie H4P5-3 RICH-25435 2899± 30 BP 3036± 52 BP −3.5667 56.9468 Bulk peat 1.3 1.77 This studyAllt Connie H4P5-4 RICH-25415 3827± 31 BP 4440± 69 cal BP −3.5667 56.9468 Bulk peat 1.70 1.77 This studyDEEH8P7 RICH-26330 2430± 25 BP 2724± 87 cal BP −3.6235 57.0005 Bulk peat 0.65 0.71 This studyDEEH8P12-1 RICH-26327 2383± 25 BP 2408± 55 BP −3.6258 56.9979 Bulk peat 0.51 0.94 This studyDEEH8P12-2 RICH-26349 4265± 27 BP 5480± 42 cal BP −3.6258 56.9979 Bulk peat 0.86 0.94 This studyDEEH8P13-1 RICH-26350 4764± 27 BP 5514± 52 BP −3.6265 56.9973 Bulk peat 1.06 1.40 This studyDEEH8P13-2 RICH-26329 7543± 31 BP 11 979± 94 cal BP −3.6265 56.9973 Bulk peat 1.21 1.40 This studyDEEH8P16 RICH-26334 6994± 31 BP 9132± 55 cal BP −3.6278 56.9958 Wood 1.22 1.42 This studyDEEH9P7 RICH-26351 3241± 25 BP 3649± 40 cal BP −3.4847 57.0352 Bulk peat 0.38 0.4 This studyDEEH10P8-1 RICH-26331 2333± 25 BP 2347± 20 BP −3.4682 57.0499 Bulk peat 0.4 1.42 This studyDEEH10P8-2 RICH-26333 5184± 28 BP 7324± 51 cal BP −3.4682 57.0499 Bulk peat 1.10 1.42 This studyDEEH13P7 RICH-26324 7350± 30 BP 8287± 60 cal BP −3.5606 56.9251 Bulk peat 1.77 1.80 This studyDEEH15P1 RICH-26326 3865± 24 BP 4633± 60 cal BP −3.5305 56.9106 Wood 1.33 1.43 This studyDEEH23P13-1 RICH-26328 2756± 25 BP 2842± 36 BP −3.5656 57.0686 Bulk peat 0.75 2.34 This studyDEEH23P13-2 RICH-26332 4461± 27 BP 5137± 97 BP −3.5656 57.0686 Bulk peat 1.5 2.34 This studyDEEH23P13-3 RICH-26335 9029± 39 BP 10697± 33 cal BP −3.5656 57.0686 Bulk peat 2.29 2.34 This studyDEEH42P2 RICH-26325 3519± 28 BP 3806± 42 cal BP −3.3981 56.9023 Bulk peat 1.99 2.00 This studyAllt Connie AC200-1 RICH-25434 528± 28 BP 549± 33 BP −3.5648 56.9451 Bulk peat 0.47 1.59 This studyAllt Connie AC200-2 RICH-25430 1939± 29 BP 1888± 35 BP −3.5648 56.9451 Bulk peat 1.02 1.59 This studyAllt Connie AC200-3 RICH-25433 3882± 31 BP 4455± 114 cal BP −3.5648 56.9451 Wood 1.58 1.59 This studyBynack Burn pollen core-1 RICH-22684 1570± 31 BP 1466± 40 BP −3.6689 56.9497 Bulk peat 1.08 2.77 Hunter (2016)Bynack Burn pollen core-2 RICH-22690 2008± 28 BP 1956± 35 BP −3.6689 56.9497 Bulk peat 2.16 2.77 Hunter (2016)Bynack Burn pollen core-3 RICH-22687 3006± 34 BP 3409± 76 cal BP −3.6689 56.9497 Bulk peat 2.68 2.77 Hunter (2016)Geldie Burn pollen core-1 RICH-22689 1688± 28 BP 1598± 40 BP −3.6667 56.9789 Bulk peat 1.00 3.14 Hunter (2016)Geldie Burn pollen core-2 RICH-22685 3729± 33 BP 4073± 59 BP −3.6667 56.9789 Bulk peat 2.00 3.14 Hunter (2016)Geldie Burn pollen core-3 RICH-22686 5510± 38 BP 6580± 48 cal BP −3.6667 56.9789 Bulk peat 3.02 3.14 Hunter (2016)Geldie Lodge pollen core-1 GU-17252 2880± 35 BP 3010± 58 BP −3.7181 56.9625 Bulk peat 0.51 1.48 Paterson (2011)Geldie Lodge pollen core-2 GU-17254 5540± 35 BP 7745± 64 cal BP −3.7181 56.9625 Bulk peat 1.43 1.48 Paterson (2011)Luibeg H200-1 RICH-25412 386± 26 BP 437± 59 BP −3.6457 57.0444 Plant remains 0.5 1.50 This studyLuibeg H200-2 RICH-25427 1200± 28 BP 1127± 45 BP −3.6457 57.0444 Plant remains 1.06 1.50 This studyLuibeg H200-3 RICH-25436 3603± 32 BP 4411± 113 cal BP −3.6456 57.0444 Bulk peat 1.45 1.50 This study
3994 W. Swinnen et al.: Modelling long-term blanket peatland development in eastern Scotland
Author contributions. The conceptualization and methodology de-velopment of this project was carried out by WS, NB and GV. Thefield work was performed by WS, NB and GV. WS carried out thelab work, developed the model code and performed the model sim-ulations. GV and NB supervised the research. The writing of thepaper was carried out by WS, NB and GV.
Competing interests. The authors declare that they have no conflictof interest.
Acknowledgements. The authors thank the Mar Estate, Mar LodgeEstate and Invercauld Estate for permission to access the area.The authors thank Teun Daniëls, Sofie De Geeter, Yasmine Hunter,Ellen Jennen, Vincent Lenaerts and Remi Swinnen for their as-sistance during the field campaigns. Danny Paterson and RichardTipping are thanked for sharing their pollen data from the Up-per Dee area. The pollen data of Birks (1969) and Huntley (1994)were extracted from the European Pollen Database (EPD; http://www.europeanpollendatabase.net/, last access: 1 June 2018), andthe work of the data contributors and the EPD community is grate-fully appreciated.
Financial support. This research has been supported by theFonds Wetenschappelijk Onderzoek (grant nos. 1167019N andG0A6317N).
Review statement. This paper was edited by Alexey V. Eliseev andreviewed by Andreas Heinemeyer and one anonymous referee.
References
Alexandrov, G. A., Brovkin, V. A., and Kleinen, T.: The in-fluence of climate on peatland extent in Western Siberiasince the Last Glacial Maximum, Sci. Rep., 6, 6–11,https://doi.org/10.1038/srep24784, 2016.
Baird, A. J., Morris, P. J., and Belyea, L. R.: The Digi-Bog peatland development model 1: rationale, conceptualmodel, and hydrological basis, Ecohydrology, 5, 242–255,https://doi.org/10.1002/eco.2, 2012.
Ballantyne, C. K.: After the ice: Holocene geomorphic activ-ity in the Scottish Highlands, Scottish Geogr. J., 124, 8–52,https://doi.org/10.1080/14702540802300167, 2008.
Ballard, C. E., McIntyre, N., Wheater, H. S., Holden,J., and Wallage, Z. E.: Hydrological modelling ofdrained blanket peatland, J. Hydrol., 407, 81–93,https://doi.org/10.1016/j.jhydrol.2011.07.005, 2011.
Beilman, D. W. and Yu, Z.: Differential Response of Peatland Typesto Climate: Modeling Peat Accumulation in Continental WesternCanada, 38–86, 2001.
Belyea, L. R. and Clymo, R. S.: Feedback control of therate of peat formation, P. R. Soc. B, 268, 1315–1321,https://doi.org/10.1098/rspb.2001.1665, 2001.
Belyea, L. R. and Malmer, N.: Carbon sequestration in peatland?:patterns and mechanisms of response to climate change, Glob.Change Biol., 10, 1043–1052, 2004.
Birks, H. H.: Studies in the vegetational history of Scotland, Uni-versity of Cambridge, 1969.
Blaauw, M.: Methods and code for “classical” age-modellingof radiocarbon sequences, Quat. Geochronol., 5, 512–518,https://doi.org/10.1016/j.quageo.2010.01.002, 2010.
Cairns, A., Dutch, M. E., Guy, E. M., and Stout, J. D.: Effectof irrigation with municipal water or sewage effluent on thebiology of soil cores: I. Introduction, total microbial popula-tions, and respiratory activity, New Zeal. J. Agr. Res., 21, 1–9,https://doi.org/10.1080/00288233.1978.10427377, 1978.
Campforts, B. and Govers, G.: Keeping the edge: A numeri-cal method that avoids knickpoint smearing when solving thestream power law, J. Geophys. Res.-Earth, 120, 1189–1205,https://doi.org/10.1002/2014JF003376, 2015.
Carroll, M. J., Heinemeyer, A., Pearce-Higgins, J. W., Den-nis, P., West, C., Holden, J., Wallage, Z. E., and Thomas,C. D.: Hydrologically driven ecosystem processes deter-mine the distribution and persistence of ecosystem-specialistpredators under climate change, Nat. Commun., 6, 1–10,https://doi.org/10.1038/ncomms8851, 2015.
Chapman, S. J. and Thurlow, M.: Peat respiration atlow temperatures, Soil Biol. Biochem., 30, 1013–1021,https://doi.org/10.1016/S0038-0717(98)00009-1, 1998.
Clymo, R. S.: The Limits to Peat Bog Growth, Philos. T. R. Soc. B,303, 605–654, https://doi.org/10.1098/rstb.1984.0002, 1984.
Cunliffe, A. M., Baird, A. J., and Holden, J.: Hydrological hotspotsin blanket peatlands: Spatial variation in peat permeabilityaround a natural soil pipe, Water Resour. Res., 49, 5342–5354,https://doi.org/10.1002/wrcr.20435, 2013.
Dai, T. S. and Sparling, J. H.: Measurement of hydraulic conductiv-ity of peats, Can. J. Soil Sci., 53, 21–26, 1973.
Dunn, S. M., Langan, S. J., and Colohan, R. J. E.: Theimpact of variable snow pack accumulation on a majorScottish water resource, Sci. Total Environ., 265, 181–194,https://doi.org/10.1016/S0048-9697(00)00658-6, 2001.
Ellis, C. J. and Tallis, J. H.: Climatic control of blanket mire devel-opment at Kentra Moss, north-west Scotland, J. Ecol., 88, 869–889, https://doi.org/10.1046/j.1365-2745.2000.00495.x, 2000.
Everest, J. and Kubik, P.: The deglaciation of eastern Scotland: Cos-mogenic 10Be evidence for a Lateglacial stillstand, J. Quat. Sci.,21, 95–104, https://doi.org/10.1002/jqs.961, 2006.
Frolking, S., Roulet, N. T., Tuittila, E., Bubier, J. L., Quillet, A.,Talbot, J., and Richard, P. J. H.: A new model of Holocenepeatland net primary production, decomposition, water bal-ance, and peat accumulation, Earth Syst. Dynam., 1, 1–21,https://doi.org/10.5194/esd-1-1-2010, 2010.
Fyfe, R. M., Twiddle, C., Sugita, S., Gaillard, M. J., Bar-ratt, P., Caseldine, C. J., Dodson, J., Edwards, K. J., Far-rell, M., Froyd, C., Grant, M. J., Huckerby, E., Innes, J. B.,Shaw, H., and Waller, M.: The Holocene vegetation cover ofBritain and Ireland: Overcoming problems of scale and discern-ing patterns of openness, Quaternary Sci. Rev., 73, 132–148,https://doi.org/10.1016/j.quascirev.2013.05.014, 2013.
W. Swinnen et al.: Modelling long-term blanket peatland development in eastern Scotland 3995
Gallego-Sala, A. V., Charman, D. J., Harrison, S. P., Li, G.,and Prentice, I. C.: Climate-driven expansion of blanket bogsin Britain during the Holocene, Clim. Past, 12, 129–136,https://doi.org/10.5194/cp-12-129-2016, 2016.
Gallego-Sala, A. V. and Prentice, I. C.: Blanket peat biome en-dangered by climate change, Nat. Clim. Change, 3, 152–155,https://doi.org/10.1038/nclimate1672, 2013.
Garnett, M. H.: Carbon storage in Pennine moorland and responseto change, University of Newcastle upon Tyne, 302 pp., 1998.
Gorham, E.: Northern Peatlands?: Role in the Carbon Cycle andProbable Responses to Climatic Warming, Ecol. Appl., 1, 182–195, 1991.
Heinemeyer, A., Croft, S., Garnett, M. H., Gloor, E., Holden, J., Lo-mas, M. R., and Ineson, P.: The MILLENNIA peat cohort model:Predicting past, present and future soil carbon budgets and fluxesunder changing climates in peatlands, Clim. Res., 45, 207–226,https://doi.org/10.3354/cr00928, 2010.
Hilbert, D. W., Roulet, N., and Moore, T.: Modelling and analysisof peatlands as dynamical systems, J. Ecol., 88, 230–242, 2000.
Hilberts, A. G. J., van Loon, E. E., Troch, P. A., and Pan-iconi, C.: The hillslope-storage Boussinesq model fornon-constant bedrock slope, J. Hydrol., 291, 160–173,https://doi.org/10.1016/J.JHYDROL.2003.12.043, 2004.
Holden, J. and Burt, T. P.: Infiltration, runoff and sediment produc-tion in blanket peat catchments: Implications of field rainfall sim-ulation experiments, Hydrol. Process., 16, 2537–2557, 2002.
Holden, J. and Burt, T. P.: Hydraulic conductivity in upland blanketpeat: measurement and variability, Hydrol. Process., 17, 1227–1237, https://doi.org/10.1002/hyp.1182, 2003.
Holden, J., Wallage, Z. E., Lane, S. N., and McDonald,A. T.: Water table dynamics in undisturbed, drainedand restored blanket peat, J. Hydrol., 402, 103–114,https://doi.org/10.1016/j.jhydrol.2011.03.010, 2011.
Huang, C. C.: Holocene landscape development and human impactin the Connemara Uplands, Western Ireland, J. Biogeogr., 29,153–165, 2002.
Hunter, Y.: A Holocene paleo-ecological analysis of peat stratigra-phy in the Upper-Dee valley (Scotland) and the Dijle catchment(Belgium), KU Leuven, 86 pp., 2016.
Huntley, B.: Late Devensian and Holocene palaeoecology andpalaeoenvironments of the Morrone Birkwoods, Aberdeenshire,Scotland, J. Quaternary Sci., 9, 311–336, 1994.
Ingram, H. A. P.: Size and shape in raised mire ecosys-tems: a geophysical model, Nature, 297, 300–303,https://doi.org/10.1038/297300a0, 1982.
Ingram, H. A. P.: Hydrology, in: Mires: Swamp, Bog, Fen and Moor,A. General Studies, edited by: Gore, A. J. P., Elsevier ScientificPublishing Company, Amsterdam, 67–158, 1983.
Jetten, V., Govers, G., and Hessel, R.: Erosion models: Qual-ity of spatial predictions, Hydrol. Process., 17, 887–900,https://doi.org/10.1002/hyp.1168, 2003.
Jones, P. S., Stevens, D. P., Blackstock, T. H., Burrows, C. R.,and Howe, E. A. (Eds.): Priority Habitats of Wales: A Techni-cal Guide, Bangor, 140 pp., 2003.
Kleinen, T., Brovkin, V., and Schuldt, R. J.: A dynamic model ofwetland extent and peat accumulation: Results for the Holocene,Biogeosciences, 9, 235–248, https://doi.org/10.5194/bg-9-235-2012, 2012.
Lafleur, P. M., Hember, R. A., Admiral, S. W., and Roulet, N. T.:Annual and seasonal variability in evapotranspiration and watertable at a shrub-covered bog in southern Ontario, Canada, Hy-drol. Process., 19, 3533–3550, https://doi.org/10.1002/hyp.5842,2005.
Lieth, H. and Box, E. O.: Evapotranspiration and primary produc-tivity, Publ. Climatol., 25, 37–46, 1972.
Lindsay, R.: Bogs: The Ecology, Classification and Conservation ofOmbrotrophic Mires, 124 pp., 1995.
Lucchese, M., Waddington, J. M., Poulin, M., Pouliot, R.,Rochefort, L., and Strack, M.: Organic matter accumulation in arestored peatland: Evaluating restoration success, Ecol. Eng., 36,482–488, https://doi.org/10.1016/j.ecoleng.2009.11.017, 2010.
Maizels, J.: The physical background of the River Dee, in: The bi-ology and management of the river Dee, edited by: Jenkins, D.,Huntingdon, 7–22, 1985.
Malmer, N. and Wallen, B.: Input rates, decay losses and accumula-tion rates of carbon in bogs during the last millennium: internalprocesses and environmental changes, The Holocene, 14, 111–117, 2004.
Maurer, E.: Spatial variation in organic carbon storage in Holocenefloodplain soils, Msc thesis, 132 pp., 2015.
Mauri, A., Davis, B. A. S., Collins, P. M., and Kaplan,J. O.: The climate of Europe during the Holocene:A gridded pollen-based reconstruction and its multi-proxy evaluation, Quaternary Sci. Rev., 112, 109–127,https://doi.org/10.1016/j.quascirev.2015.01.013, 2015.
Mazier, F., Gaillard, M. J., Kuneš, P., Sugita, S., Trond-man, A. K., and Broström, A.: Testing the effect of siteselection and parameter setting on REVEALS-model esti-mates of plant abundance using the Czech Quaternary Pa-lynological Database, Rev. Palaeobot. Palynol., 187, 38–49,https://doi.org/10.1016/j.revpalbo.2012.07.017, 2012.
Met Office: Met Office Integrated Data Archive System (MI-DAS) Land and Marine Surface Stations Data (1853-current), available at: http://catalogue.ceda.ac.uk/uuid/220a65615218d5c9cc9e4785a3234bd0 (last access: 16 Jan-uary 2019), 2012.
Moore, P. D.: The Influence of Prehistoric Cultures upon the Initi-ation and Spread of Blanket Bog in Upland Wales, Nature, 241,350–353, 1973.
Morris, P. J., Baird, A. J., and Belyea, L. R.: The DigiBog peat-land development model 2: ecohydrological simulations in 2D,Ecohydrology, 5, 256–268, https://doi.org/10.1002/eco.2, 2012.
Morris, P. J., Baird, A. J., Young, D. M., and Swindles, G. T.: Un-tangling climate signals from autogenic changes in long-termpeatland development, Geophys. Res. Lett., 42, 10788–10797,https://doi.org/10.1002/2015GL066824, 2015.
Morris, P. J., Swindles, G. T., Valdes, P. J., Ivanovic, R. F., Gre-goire, L. J., Smith, M. W., Tarasov, L., Haywood, A. M., and Ba-con, K. L.: Global peatland initiation driven by regionally asyn-chronous warming, P. Natl. Acad. Sci. USA, 115, 4851–4856,https://doi.org/10.1073/pnas.1717838115, 2018.
Paniconi, C., Troch, P. A., Van Loon, E. E., and Hilberts, A. G.J.: Hillslope-storage Boussinesq model for subsurface flow andvariable source areas along complex hillslopes: 2. Intercompar-ison with a three-dimensional Richards equation model, Water
Parry, L. E., Charman, D. J., and Noades, J. P. W.: A method formodelling peat depth in blanket peatlands, Soil Use Manag.,28, 614–624, https://doi.org/10.1111/j.1475-2743.2012.00447.x,2012.
Paterson, D.: The Holocene history of Pinus sylvestris woodland inthe Mar Lodge Estate, Cairngorms, Eastern Scotland, Universityof Stirling, 363 pp., 2011.
Peeters, I., Rommens, T., Verstraeten, G., Govers, G., VanRompaey, A., Poesen, J., and Van Oost, K.: Reconstructing an-cient topography through erosion modelling, Geomorphology,78, 250–264, https://doi.org/10.1016/j.geomorph.2006.01.033,2006.
Reimer, P. J., Bard, E., Bayliss, A., Beck, J. W., Blackwell, P. G.,Ramsey, C. B., Buck, C. E., Cheng, H., Edwards, R. L., Friedrich,M., Grootes, P. M., Guilderson, T. P., Haflidason, H., Hajdas, I.,Hatté, C., Heaton, T. J., Hoffmann, D. L., Hogg, A. G., Hughen,K. A., Kaiser, K. F., Kromer, B., Manning, S. W., Niu, M.,Reimer, R. W., Richards, D. A., Scott, E. M., Southon, J. R.,Staff, R. A., Turney, C. S. M., and van der Plicht, J.: IntCal13 andMarine13 Radiocarbon Age Calibration Curves 0–50,000 Yearscal BP, Radiocarbon, 55, 1869–1887, 2013.
Rosa, E. and Larocque, M.: Investigating peat hydrological prop-erties using field and laboratory methods: application to theLanoraie peatland complex (southern Quebec, Canada), Hydrol.Process., 22, 1866–1875, https://doi.org/10.1002/hyp, 2008.
Rosswall, T.: Decomposition of plant litter at Stordalen – a sum-mary, in: International Biological Programme: Swedish tundrabiome progress report 14, 124–133, 1973.
Simmons, I. G. and Innes, J. B.: Late Quaternary vegetational his-tory of the North York Moors. VIII. Correlation of Flandrian IIlitho- and pollen stratigraphy at North Gill, Glaisdale Moor, J.Biogeogr., 15, 249–272, 1988.
Smith, J. S.: Land use within the catchment of the river Dee, in: Thebiology and management of the river Dee, edited by: D. Jenkins,Huntingdon, 29–33, 1985.
Sugita, S.: Theory of quantitative reconstruction of veg-etation I: Pollen from large sites REVEALS re-gional vegetation composition, Holocene, 17, 229–241,https://doi.org/10.1177/0959683607075837, 2007.
Szumigalski, A. R. and Bayley, S. E.: Net aboveground pri-mary production along a peatland gradient in central Albertain relation to environmental factors, Ecoscience, 4, 385–393,https://doi.org/10.1080/11956860.1997.11682417, 1997.
Tetzlaff, D. and Soulsby, C.: Sources of baseflow in largercatchments – Using tracers to develop a holistic under-standing of runoff generation, J. Hydrol., 359, 287–302,https://doi.org/10.1016/j.jhydrol.2008.07.008, 2008.
Tipping, R.: Blanket peat in the Scottish Highlands: Timing, cause,spread and the myth of environmental determinism, Biodivers.Conserv., 17, 2097–2113, https://doi.org/10.1007/s10531-007-9220-4, 2008.
Treat, C. C., Kleinen, T., Broothaerts, N., Dalton, A. S., Dommain,R., Douglas, T. A., Drexler, J. Z., Finkelstein, S. A., Grosse, G.,Hope, G., Hutchings, J., Jones, M. C., Kuhry, P., Lacourse, T.,Lähteenoja, O., Loisel, J., Notebaert, B., Payne, R. J., Peteet, D.M., Sannel, A. B. K., Stelling, J. M., Strauss, J., Swindles, G.T., Talbot, J., Tarnocai, C., Verstraeten, G., Williams, C. J., Xia,Z., Yu, Z., Väliranta, M., Hättestrand, M., Alexanderson, H., andBrovkin, V.: Widespread global peatland establishment and per-sistence over the last 130,000 y, P. Natl. Acad. Sci. USA, 116,4822–4827, https://doi.org/10.1073/pnas.1813305116, 2019.
Trondman, A. K., Gaillard, M. J., Sugita, S., Björkman, L., Greis-man, A., Hultberg, T., Lagerås, P., Lindbladh, M., and Mazier,F.: Are pollen records from small sites appropriate for RE-VEALS model-based quantitative reconstructions of past re-gional vegetation? An empirical test in southern Sweden, Veg.Hist. Archaeobot., 25, 131–151, https://doi.org/10.1007/s00334-015-0536-9, 2016.
Van Rompaey, A. J. J. and Govers, G.: Data qualityand model complexity for regional scale soil ero-sion prediction, Int. J. Geogr. Inf. Sci., 16, 663–680,https://doi.org/10.1080/13658810210148561, 2002.
Warren, G., Fraser, S., Clarke, A., Driscoll, K., Mitchell, W.,Noble, G., Paterson, D., Schulting, R., Tipping, R., Verbaas,A., Wilson, C., and Wickham-Jones, C.: Little House in theMountains? A small Mesolithic structure from the CairngormMountains, Scotland, J. Archaeol. Sci. Rep., 18, 936–945,https://doi.org/10.1016/j.jasrep.2017.11.021, 2018.
Wieder, R. K. and Yavitt, J. B.: Peatlands and global cli-mate change: Insights from comparative studies of sites sit-uated along a latitudinal gradient, Wetlands, 14, 229–238,https://doi.org/10.1007/BF03160660, 1994.
Williams, J. R., Dyke, P. T., and Jones, C. A.: EPIC – A model forassessing the effects of erosion on soil productivity, in: Analysisof Ecological Systems: State-of-the-Art in Ecological Modelling,edited by: Lauenroth, W. K., Skogerboe, G. V., and Flug, M.,Elsevier, p. 971, 1983.
Wu, J.: Response of peatland development and carbon cycling toclimate change: A dynamic system modeling approach, Env-iron. Earth Sci., 65, 141–151, https://doi.org/10.1007/s12665-011-1073-1, 2012.
Xu, J., Morris, P. J., Liu, J., and Holden, J.: PEATMAP:Refining estimates of global peatland distributionbased on a meta-analysis, Catena, 160, 134–140,https://doi.org/10.1016/j.catena.2017.09.010, 2018.
Yu, Z., Turetsky, M. R., Campbell, I. D., and Vitt, D. H.: Mod-elling long-term peatland dynamics. II. Processes and rates asinferred from litter and peat-core data, Ecol. Modell., 145, 159–173, https://doi.org/10.1016/S0304-3800(01)00387-8, 2001.
Yu, Z., Beilman, D. W., Frolking, S., MacDonald, G. M., Roulet, N.T., Camill, P., and Charman, D. J.: Peatlands and Their Role inthe Global Carbon Cycle, Eos, Trans. Am. Geophys. Union, 92,97, https://doi.org/10.1029/2011EO120001, 2011.