Webinar for the Northern Rockies Fire Science Network February 6, 2013 Monitoring Trends in Burn Severity (MTBS) Project Overview Adrian Grell US Forest Service Remote Sensing Applications Center MTBS Objective • Consistently map… 1. Location 2. Extent 3. Burn severity • …of large fires on all lands in the United States from 1984 thru 2010 (and beyond) – CONUS, AK, HI & Puerto Rico – > 1,000 acres in the western United States – > 500 acres in the eastern United States West East
Transcript
Webinar for the Northern Rockies Fire Science Network
February 6, 2013
Monitoring Trends in Burn Severity (MTBS) Project Overview
Adrian Grell US Forest Service
Remote Sensing Applications Center
MTBS Objective
• Consistently map… 1. Location
2. Extent
3. Burn severity
• …of large fires on all lands in the United States from 1984 thru 2010 (and beyond)
– CONUS, AK, HI & Puerto Rico
– > 1,000 acres in the western United States
– > 500 acres in the eastern United States
West East
MTBS Background
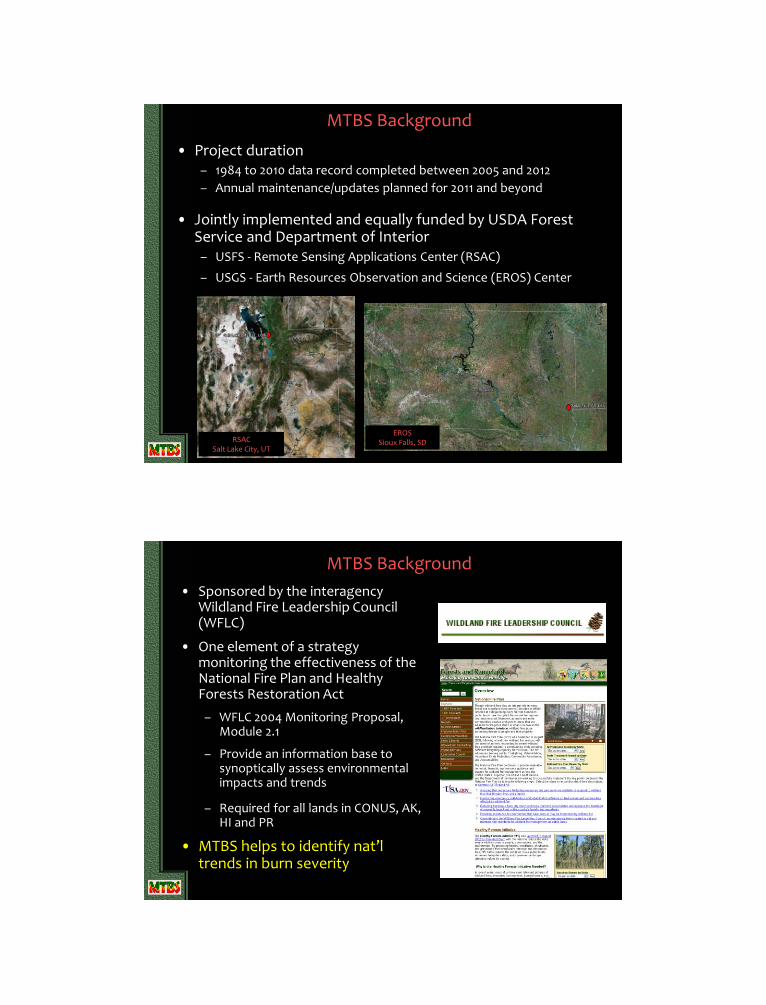
• Project duration – 1984 to 2010 data record completed between 2005 and 2012
– Annual maintenance/updates planned for 2011 and beyond
• Jointly implemented and equally funded by USDA Forest Service and Department of Interior
– USFS - Remote Sensing Applications Center (RSAC)
– USGS - Earth Resources Observation and Science (EROS) Center
RSAC Salt Lake City, UT
EROS Sioux Falls, SD
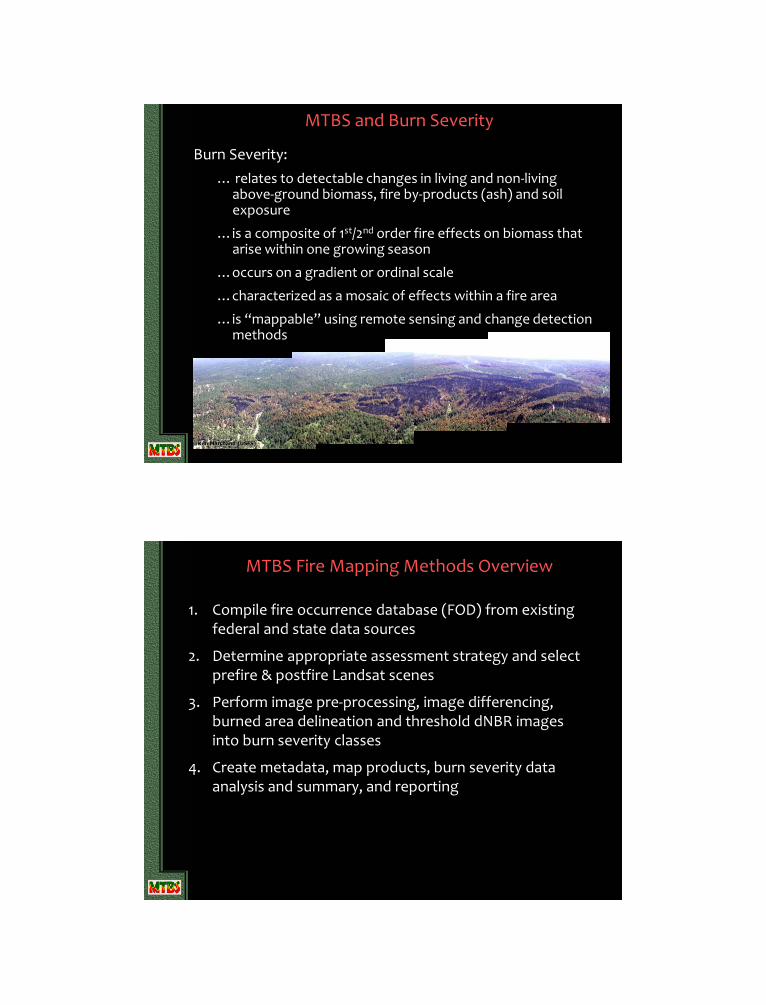
• Sponsored by the interagency Wildland Fire Leadership Council (WFLC)
• One element of a strategy monitoring the effectiveness of the National Fire Plan and Healthy Forests Restoration Act
– WFLC 2004 Monitoring Proposal, Module 2.1
– Provide an information base to synoptically assess environmental impacts and trends
– Required for all lands in CONUS, AK, HI and PR
• MTBS helps to identify nat’l trends in burn severity
MTBS Background
Ken Marchand (USFS)
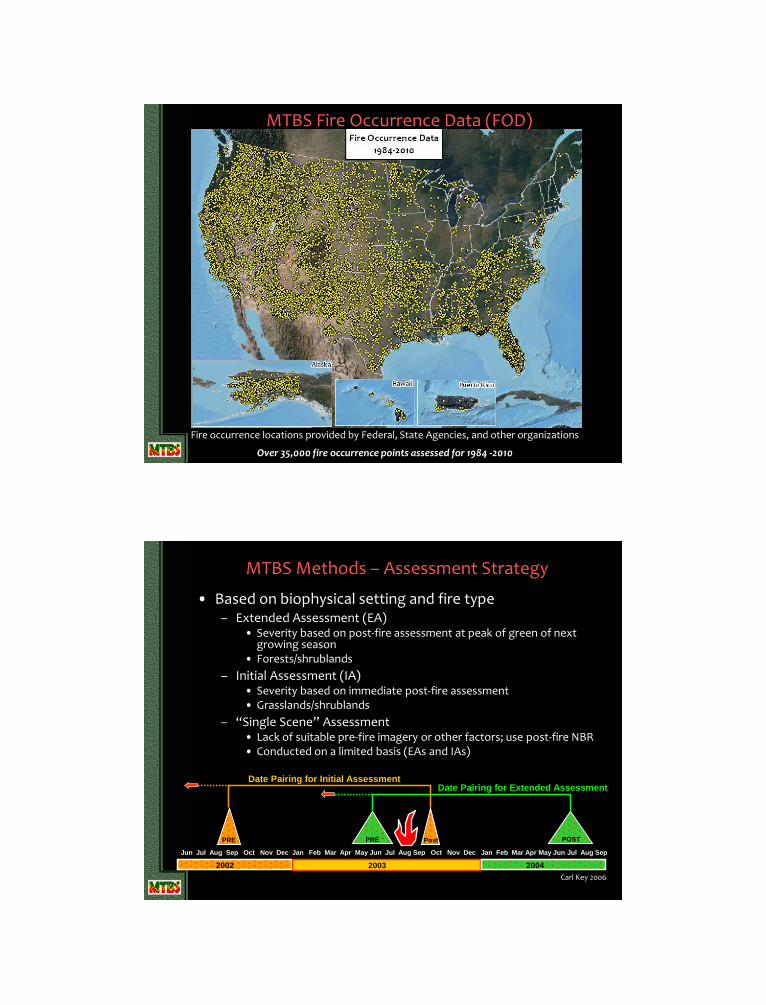
MTBS and Burn Severity
Burn Severity:
… relates to detectable changes in living and non-living above-ground biomass, fire by-products (ash) and soil exposure
…is a composite of 1st/2nd order fire effects on biomass that arise within one growing season
…occurs on a gradient or ordinal scale
…characterized as a mosaic of effects within a fire area
…is “mappable” using remote sensing and change detection methods
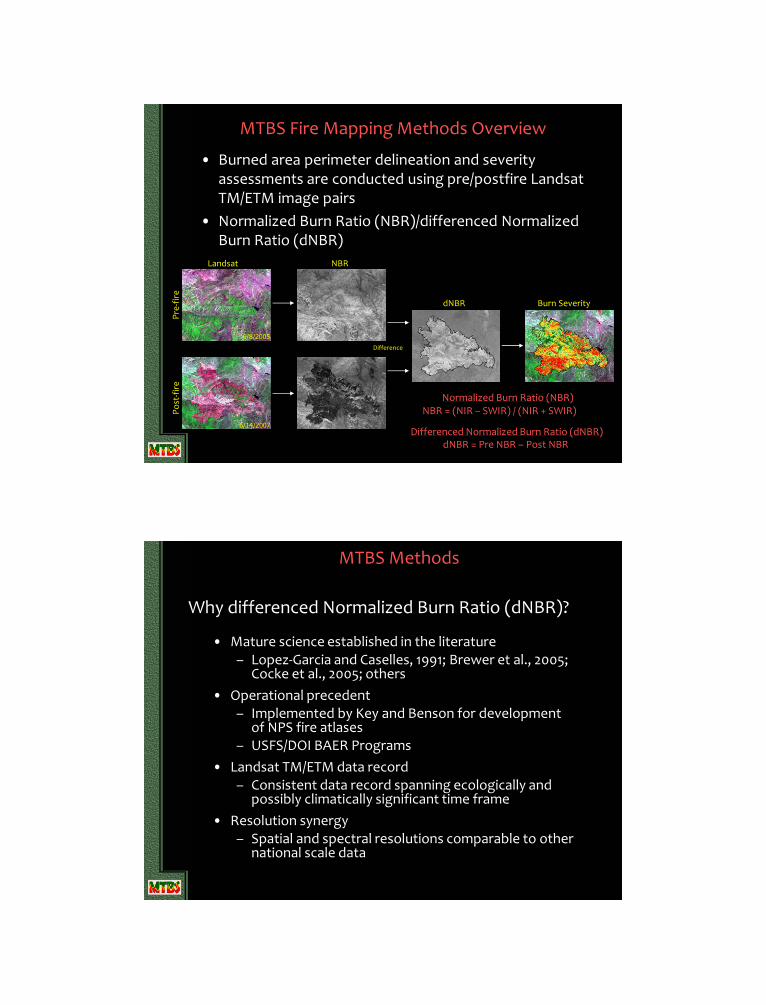
MTBS Fire Mapping Methods Overview
1. Compile fire occurrence database (FOD) from existing federal and state data sources


![Evaluation and Comparison of the IRS- P6 AWiFS …lcluc.umd.edu/sites/default/files/lcluc_documents/c...MTBS dNBR Burn Severity Maps: Arizona, Warm Fire [July 06, 2006] Official TM](https://static.documents.pub/doc/80x56/5c8248af09d3f2a1038bcb19/evaluation-and-comparison-of-the-irs-p6-awifs-lclucumdedusitesdefaultfileslclucdocumentscmtbs.jpg)


