Morphotectonic expression of geological structures in the eastern part of the South East Deccan Volcanic Province (around Nanded, Maharashtra, India) R. D. KAPLAY 1 *, MD. BABAR 2 , SOUMYAJIT MUKHERJEE 3 & T. VIJAY KUMAR 1 1 School of Earth Sciences, S.R.T.M.University, Nanded-431606, Maharashtra, India 2 Department of Geology, Dnyanopasak College, Parbhani-431401, Maharashtra, India 3 Department of Earth Sciences, Indian Institute of Technology, Bombay, Powai, Mumbai-400076, Maharashtra, India *Correspondence: [email protected]Abstract: We geomorphometrically characterize the tectonics near the microseismically active Nanded region, Maharashtra, India. We used the geomorphic indices of active tectonics in 32 sub-basins to evaluate the relationship between tectonics and basin morphology. The area is divided into three different zones (1, 2 and 3). Microseismicity is concentrated along the NW– SE-trending Urvashi Ghat Lineament. The anomalous drainages and lineaments are also confined to the region where microseismicity is associated with thrust. Spatial analysis of the elongation ratio and hypsometric integral of the basins provide valuable information on their distribution and relationship to the structure and tectonics. This study suggests neotectonic control on the evo- lution of the basins close to Nanded City. We have focused on the eastern part of the Deccan Volcanic Province (DVP) (Fig. 1a) around the Nanded and Parbhani districts, Maharashtra, India. The Nanded region has been experiencing micro-earthquake activity since November 2006 (Table 1). The seismic data are documented on seis- momemeters at the School of Earth Sciences, S.R.T.M. University, Nanded, approximately 8 km south of the Urvashi Ghat Lineament (UG Linea- ment) and at 1.5 km NE of the UG Lineament. The third one is located 1.4 km NNE to the UG Lin- eament. Local shocks, some of which were accom- panied by subterranean sounds up to 3.1 coda magnitude, were reported during 2006 – 2013 with- out any damage, with the epicentre located in the heart of the city of Nanded (Fig. 1b). Kaplay et al. (2013) reported deformation from Nanded that supports micro-earthquakes from the SE Deccan Volcanic Province (SEDVP). These include: (i) brittle fracturing and displacement of pipe amygdules (minor faults); (ii) antiformal folds with associated brittle/brittle – ductile faults dipping towards the east; (iii) ramps with flat planes dipping towards the east; and (iv) ductile shear of basaltic veins. Stream characteristics in reference to anomalous drainage patterns are also studied. We report here new deformation features from the Quaternary deposits in the SEDVP. Rajaguru & Kale (1985) and Rajaguru et al. (1993) studied fluvial systems in the upland areas of the Deccan Trap, from the western coastal area and the Western Ghat. Kale & Shejwalkar (2008) carried out geomorphological analyses in the West- ern Deccan Basalt Province (Western Ghat). The authors have concluded that ‘during last 1.4 m.y. the geomorphologically stable channels were found prone to Quaternary climatic changes which is evi- dent from the synchronous pattern of depositional events’ (Rajaguru et al. 1993, p. 817). Kale & Shej- walkar (2008) concluded that geomorphic indices of active tectonics (GAT) do not help in detect- ing the subtle imprints of the tectonic activity, even if the DVP has undergone significant uplift in recent times. Tectonics may leave only faint imprints on the present-day landscape (Kale & Shej- walkar 2008). Geomorphometric characterization of the tec- tonic properties of a landscape is not straightfor- ward. Geomorphic indices can reveal relationships between basin morphology and tectonics (Keller & Pinter 1996; Burbank & Anderson 2001). This part of the DVP is suitable for such geomorphometric analyses, and to compare basins and fluvial sys- tems (Kaplay et al. 2013). Bearing in mind the evidence of faults from the Deccan Trap in the Nanded region, efforts are made in this study to From:Mukherjee, S., Misra, A. A., Calve `s, G. & Nemc ˇok, M. (eds) 2017. Tectonics of the Deccan Large Igneous Province. Geological Society, London, Special Publications, 445, 317–335. First published online November 8, 2016, https://doi.org/10.1144/SP445.12 # 2017 The Author(s). Published by The Geological Society of London. All rights reserved. For permissions: http://www.geolsoc.org.uk/permissions. Publishing disclaimer: www.geolsoc.org.uk/pub_ethics by guest on March 29, 2017 http://sp.lyellcollection.org/ Downloaded from
Transcript
Morphotectonic expression of geological structures in the eastern
part of the South East Deccan Volcanic Province
(around Nanded, Maharashtra, India)
R. D. KAPLAY1*, MD. BABAR2, SOUMYAJIT MUKHERJEE3 & T. VIJAY KUMAR1
1School of Earth Sciences, S.R.T.M.University, Nanded-431606,
Maharashtra, India2Department of Geology, Dnyanopasak College, Parbhani-431401,
Maharashtra, India3Department of Earth Sciences, Indian Institute of Technology, Bombay, Powai,
Abstract: We geomorphometrically characterize the tectonics near the microseismically activeNanded region, Maharashtra, India. We used the geomorphic indices of active tectonics in 32sub-basins to evaluate the relationship between tectonics and basin morphology. The area isdivided into three different zones (1, 2 and 3). Microseismicity is concentrated along the NW–SE-trending Urvashi Ghat Lineament. The anomalous drainages and lineaments are also confinedto the region where microseismicity is associated with thrust. Spatial analysis of the elongationratio and hypsometric integral of the basins provide valuable information on their distributionand relationship to the structure and tectonics. This study suggests neotectonic control on the evo-lution of the basins close to Nanded City.
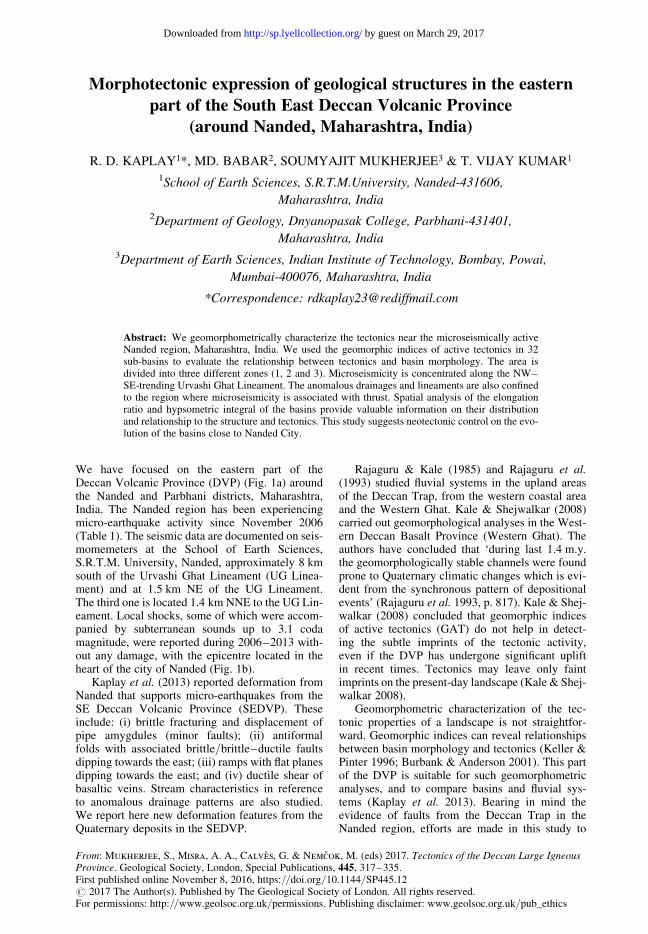
We have focused on the eastern part of theDeccan Volcanic Province (DVP) (Fig. 1a) aroundthe Nanded and Parbhani districts, Maharashtra,India. The Nanded region has been experiencingmicro-earthquake activity since November 2006(Table 1). The seismic data are documented on seis-momemeters at the School of Earth Sciences,S.R.T.M. University, Nanded, approximately 8 kmsouth of the Urvashi Ghat Lineament (UG Linea-ment) and at 1.5 km NE of the UG Lineament.The third one is located 1.4 km NNE to the UG Lin-eament. Local shocks, some of which were accom-panied by subterranean sounds up to 3.1 codamagnitude, were reported during 2006–2013 with-out any damage, with the epicentre located in theheart of the city of Nanded (Fig. 1b).
Kaplay et al. (2013) reported deformation fromNanded that supports micro-earthquakes from theSE Deccan Volcanic Province (SEDVP). Theseinclude: (i) brittle fracturing and displacement ofpipe amygdules (minor faults); (ii) antiformalfolds with associated brittle/brittle–ductile faultsdipping towards the east; (iii) ramps with flat planesdipping towards the east; and (iv) ductile shear ofbasaltic veins. Stream characteristics in referenceto anomalous drainage patterns are also studied.We report here new deformation features from theQuaternary deposits in the SEDVP.
Rajaguru & Kale (1985) and Rajaguru et al.(1993) studied fluvial systems in the upland areasof the Deccan Trap, from the western coastal areaand the Western Ghat. Kale & Shejwalkar (2008)carried out geomorphological analyses in the West-ern Deccan Basalt Province (Western Ghat). Theauthors have concluded that ‘during last 1.4 m.y.the geomorphologically stable channels were foundprone to Quaternary climatic changes which is evi-dent from the synchronous pattern of depositionalevents’ (Rajaguru et al. 1993, p. 817). Kale & Shej-walkar (2008) concluded that geomorphic indicesof active tectonics (GAT) do not help in detect-ing the subtle imprints of the tectonic activity,even if the DVP has undergone significant upliftin recent times. Tectonics may leave only faintimprints on the present-day landscape (Kale & Shej-walkar 2008).
Geomorphometric characterization of the tec-tonic properties of a landscape is not straightfor-ward. Geomorphic indices can reveal relationshipsbetween basin morphology and tectonics (Keller &Pinter 1996; Burbank & Anderson 2001). This partof the DVP is suitable for such geomorphometricanalyses, and to compare basins and fluvial sys-tems (Kaplay et al. 2013). Bearing in mind theevidence of faults from the Deccan Trap in theNanded region, efforts are made in this study to
From: Mukherjee, S., Misra, A. A., Calves, G. & Nemcok, M. (eds) 2017. Tectonics of the Deccan Large IgneousProvince. Geological Society, London, Special Publications, 445, 317–335.First published online November 8, 2016, https://doi.org/10.1144/SP445.12# 2017 The Author(s). Published by The Geological Society of London. All rights reserved.For permissions: http://www.geolsoc.org.uk/permissions. Publishing disclaimer: www.geolsoc.org.uk/pub_ethics
by guest on March 29, 2017http://sp.lyellcollection.org/Downloaded from
find the tectonic nature of the basins around theGodavari River that cover the districts of Nandedand Parbhani.
Study area
The study area, which covers a stretch of the Goda-vari River 292.88 km in length, includes 32 sub-basins (Fig. 2). The study area is located along theboundary of the SEDVP (Fig. 1) and is mostlyDeccan basalts.
Geology
The region dominantly comprises compact, amyg-daloidal and vesicular basalt. The basalt flows havebeen assigned to the Ajanta Formation, which isthe stratigraphic equivalent of the Upper RatangadFormation of the Wai sub-group of west Maharash-tra comprising compound flows (Godbole et al.1996). The compound (pahoehoe) flows are formedby the outpouring of low-viscousity lava through alarge number of outlets (Bondre et al. 2000, 2004;
Duraiswami et al. 2003, 2008). Consequently, theyare large, irregular and have a greater lateral extent(Duraiswami et al. 2001, 2002).
The traps are approximately 200 m thick, green-ish-grey and medium grained. They contain typicalsegregation of circular/lenticular/short bandedvesicles. The amygdules are filled with chlorite,calcite, zeolite and chalcedony. The traps containdevitrified glasses and secondary zeolites, and areoverlain by 5–15 m-thick alluvium along the Goda-vari River, which is flowing towards the east and SE.The maximum thickness of the Quaternary depositon the northern bank of the Godavari River is42 m in the Nanded district, with a gravel bed atthe base above massive (aa) basalt (Tiwari 1999).
The Nanded district is mainly underlain byunclassified crystalline rocks, viz. granites andgneisses, along with pegmatite, ultrabasic dykes andquartz veins of Archaean–Palaeo-proterozoic age,Late Cretaceous–Early Eocene basalts and (sub)recent alluvium (Table 2) (Nanded District Gazet-teer 1971; Madhnure 2006, 2014; CGWB 2012).Basaltic rocks occupy most of the places overlying
Fig. 1. (a) Location map of the study area. (b) Map showing the shift in microseismicity towards the west nearer tothe UG Lineament (black line). The solid black circle is a site where granite is encountered at a depth of 200 m.
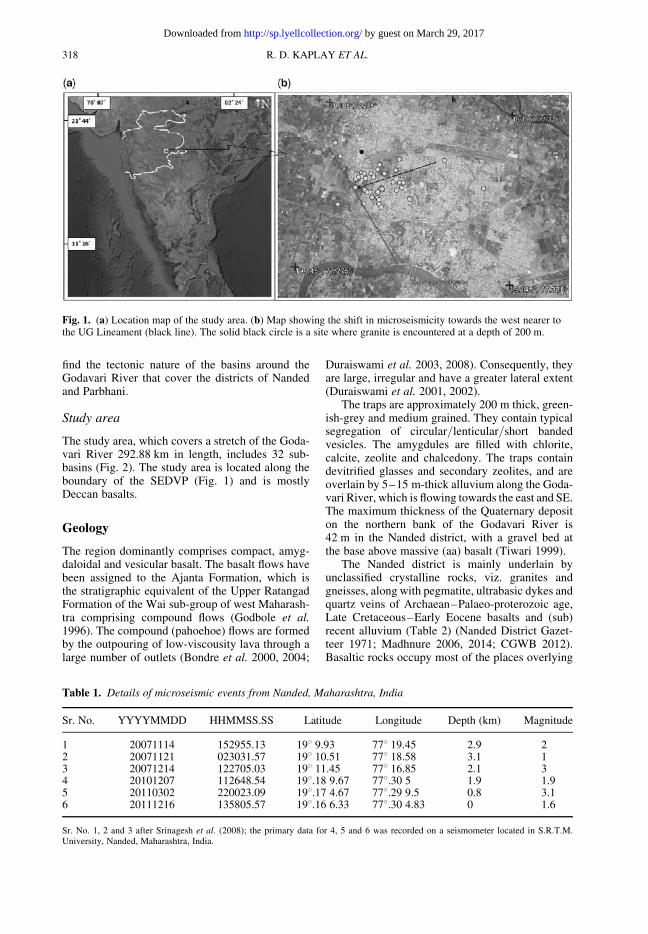
Table 1. Details of microseismic events from Nanded, Maharashtra, India
Sr. No. YYYYMMDD HHMMSS.SS Latitude Longitude Depth (km) Magnitude
Sr. No. 1, 2 and 3 after Srinagesh et al. (2008); the primary data for 4, 5 and 6 was recorded on a seismometer located in S.R.T.M.University, Nanded, Maharashtra, India.
R. D. KAPLAY ET AL.318
by guest on March 29, 2017http://sp.lyellcollection.org/Downloaded from
granites. The traps are massive, fine-grained, blackgrey to brown, and are of both ‘pahoehoe’ and ‘aa’types. The pahoehoe type is predominantly vesicular
basalt with very thin massive portions. The ‘aa’ flowof thick massive basalt shows columnar joints andspheroidal weathering, with an upper vesicular
Fig. 2. Drainage map of the 32 sub-basins in the SEDVP area along the Godavari River. The locations of thesub-basins marked as 1–32 in the figure and in Table 1 are: (1) Jamb; (2) Ashti; (3) Zari; (4) Masala; (5) Loni;(6) Vajhur; (7) Indrayani; (8) Khadki (Vajhur); (9) Pingalgad; (10) Khadki; (11) Alegaon; (12) Sugaon; (13) UrvashiGhat; (14) Asna; (15) Barod; (16) Sita; (17) Kankadi; (18) Dhangarwadi; (19) Bhanagi; (20) Sangvi; (21) Jhod;(22) Dhond; (23) Galati; (24) Macchhali; (25) Borna; (26) Dhamunwadi; (27) Lingi; (28) Gunwara; (29) Sarasvati;(30) Abujwadi; (31) Padmavati; and (32) Waghora. The study area shows sub-basins on the northern and southernsides of the Godavari River. It also shows three different zones (1–3), which are used for the study of spatialanalysis. The zones are further classified as the northern side (A, C and E) and the southern side (B, D and F).Numbers i–xx along the Godavari River are the segments for determination of the valley floor width to valleyheight ratios. Location names are given in Table 5.
Table 2. Generalized geological succession in Nanded district
Stratigraphic units Rock Formations Age
Alluvium Clay mixed with silt, sand and gravel Recent–sub-RecentDeccan traps Black, grey, vesicular amygdaloidal, massive basalt with
portion brecciated. Secondary porosity reduces withdepth, and the groundwater storage and circulationare limited to a depth of 177 m.
The easternmost part of the study area is charac-terized by structural depression identified here as afault-line scarp, which is aligned along the micro-seismically active UG Thrust.
Methodology
We selected 32 sub-basins along the Godavari Riverfor geomorphometric analysis (Fig. 2). Geomorphicindices for active tectonics (GAT) were also deter-mined, which include the basin asymmetry factor,the stream gradient to length ratio, the basin elon-gation ratio and the hypsometric integral. The areais divided into three zones (Fig. 2): Zone 1 trendsNW (the Godavari Zone); Zone 2 trends east; andZone 3 is delineated based on an approximatelyeast-trending course of the Godavari River, forapproximately .3 km, which then takes a sharpturn towards the north following a straight course(L5) and then turns towards the SE (Singh 2008b).Zone 3 is characterized by definite structural charac-ters, which include the orientation of the UG ThrustLineament and related features such as the Kamthathrusts.
The spatial distribution of the elongation ratioand the hypsometric integral for all the basins stud-ied, initially gave a definite pattern. While the elon-gation ratio on the northern side is more than on thesouthern side, the southern part has lower averagehypsometric integral values than the northern part.Then, to find the influence of structures on thebasins, the two parameters are compared zone-wise.It shows the influence of structures on basins locatedon one side of the river, as the elongation ratio on thenorthern side is more than that on the southern side.
The lineament study was carried out using topo-sheets and was well supported by Google images, aswell as by field checks. Lineaments on the imagerywere identified based on recognition elements, suchas a sharp contrast in tone and structures. Areasaround Urvashi Ghat (Figs 1b & 3) and other linea-ments were also studied.
Deformation
Srinagesh et al. (2012) identified the UG Lineamentin the study area from satellite images from the Geo-logical Survey of India (GSI). They also carried outmicroseismic studies in the Nanded area and sug-gested that the microseismicity is related to thrust-ing along a NW–SE fault that coincides with alocal stream that joins the Godavari River south ofthe city of Nanded.
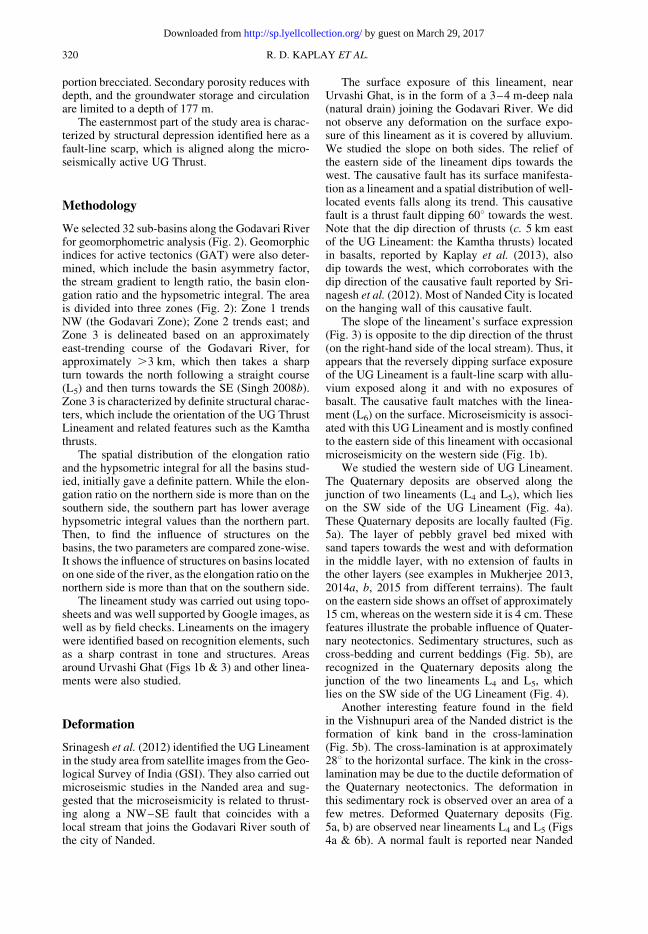
The surface exposure of this lineament, nearUrvashi Ghat, is in the form of a 3–4 m-deep nala(natural drain) joining the Godavari River. We didnot observe any deformation on the surface expo-sure of this lineament as it is covered by alluvium.We studied the slope on both sides. The relief ofthe eastern side of the lineament dips towards thewest. The causative fault has its surface manifesta-tion as a lineament and a spatial distribution of well-located events falls along its trend. This causativefault is a thrust fault dipping 608 towards the west.Note that the dip direction of thrusts (c. 5 km eastof the UG Lineament: the Kamtha thrusts) locatedin basalts, reported by Kaplay et al. (2013), alsodip towards the west, which corroborates with thedip direction of the causative fault reported by Sri-nagesh et al. (2012). Most of Nanded City is locatedon the hanging wall of this causative fault.
The slope of the lineament’s surface expression(Fig. 3) is opposite to the dip direction of the thrust(on the right-hand side of the local stream). Thus, itappears that the reversely dipping surface exposureof the UG Lineament is a fault-line scarp with allu-vium exposed along it and with no exposures ofbasalt. The causative fault matches with the linea-ment (L6) on the surface. Microseismicity is associ-ated with this UG Lineament and is mostly confinedto the eastern side of this lineament with occasionalmicroseismicity on the western side (Fig. 1b).
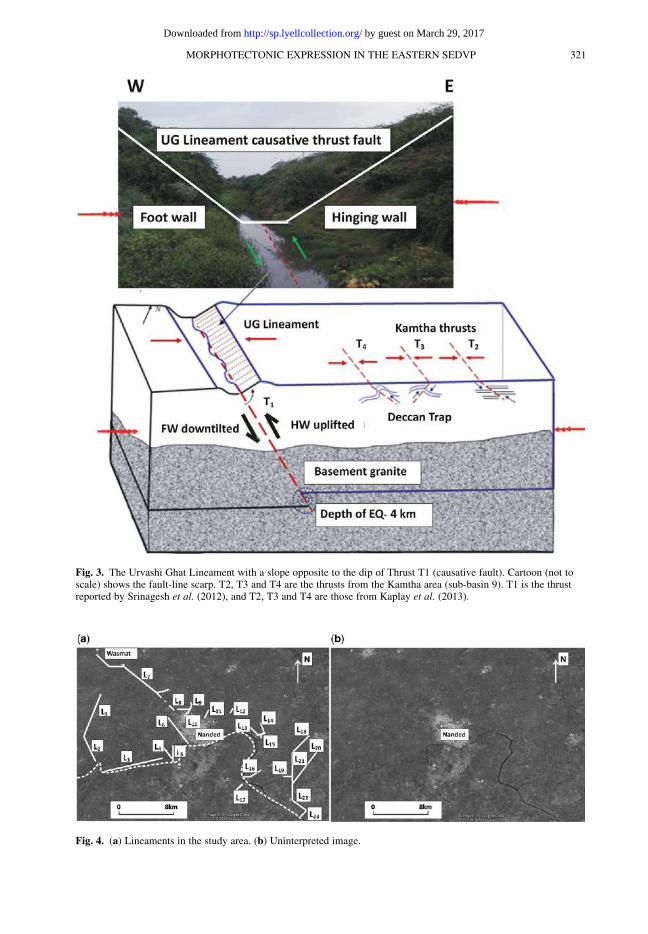
We studied the western side of UG Lineament.The Quaternary deposits are observed along thejunction of two lineaments (L4 and L5), which lieson the SW side of the UG Lineament (Fig. 4a).These Quaternary deposits are locally faulted (Fig.5a). The layer of pebbly gravel bed mixed withsand tapers towards the west and with deformationin the middle layer, with no extension of faults inthe other layers (see examples in Mukherjee 2013,2014a, b, 2015 from different terrains). The faulton the eastern side shows an offset of approximately15 cm, whereas on the western side it is 4 cm. Thesefeatures illustrate the probable influence of Quater-nary neotectonics. Sedimentary structures, such ascross-bedding and current beddings (Fig. 5b), arerecognized in the Quaternary deposits along thejunction of the two lineaments L4 and L5, whichlies on the SW side of the UG Lineament (Fig. 4).
Another interesting feature found in the fieldin the Vishnupuri area of the Nanded district is theformation of kink band in the cross-lamination(Fig. 5b). The cross-lamination is at approximately288 to the horizontal surface. The kink in the cross-lamination may be due to the ductile deformation ofthe Quaternary neotectonics. The deformation inthis sedimentary rock is observed over an area of afew metres. Deformed Quaternary deposits (Fig.5a, b) are observed near lineaments L4 and L5 (Figs4a & 6b). A normal fault is reported near Nanded
R. D. KAPLAY ET AL.320
by guest on March 29, 2017http://sp.lyellcollection.org/Downloaded from
Fig. 4. (a) Lineaments in the study area. (b) Uninterpreted image.
Fig. 3. The Urvashi Ghat Lineament with a slope opposite to the dip of Thrust T1 (causative fault). Cartoon (not toscale) shows the fault-line scarp. T2, T3 and T4 are the thrusts from the Kamtha area (sub-basin 9). T1 is the thrustreported by Srinagesh et al. (2012), and T2, T3 and T4 are those from Kaplay et al. (2013).
MORPHOTECTONIC EXPRESSION IN THE EASTERN SEDVP 321
by guest on March 29, 2017http://sp.lyellcollection.org/Downloaded from
Airport. Here, the red bole basalt layer is displacedby up to 2.21 m (Fig. 5c). The red bole layer is fol-lowed by a green bole basalt layer, which is alsodeformed. The fault plane dips 788 towards thesouth. However, the fault could not be traced as itis covered with black cotton soil.
Geomorphic indices of active tectonics
The general morphometric attributes of the 32selected drainage sub-basins along the mid reachesof Godavari River in the Parbhani and Nandeddistricts (Fig. 2) were determined, including thebasin area, the total length of streams, the higheststream order, the length of the trunk stream, andthe maximum, minimum and mean basin elevations(Table 3). The analysis of the geomorphic indices ofactive tectonics (GAT) of 32 sub-basins was carriedout to find out whether the sub-basins are tectoni-cally active. The GAT analysis includes area, thebasin elongation ratio, the basin asymmetry factor,hypsometric integral, the stream gradient to lengthratio (Table 4) and the valley floor width to valleyheight ratio (Table 5).
Basin elongation ratio (Re)
The basin elongation ratio (Re) quantitatively des-cribes the planimetric shape of a basin and, thus,represents the degree of maturity of the basin land-scape. It is calculated using the formula Re ¼ (2pA:pp)/L, where A is the area of the basin area
and L is the length of the basin (Bull & McFadden1977; Babar et al. 2011; Farooq et al. 2015). Inthe present study, the Re ranges from 0.43 to 0.79.The value of Re, except for the Gunawara (0.43)and Pingalgad (0.46) sub-basins, exceeds 0.50(Table 4), indicating that the sub-basins are moder-ately elongated (Schumm 1956; Farooq et al. 2015).Singh (2008a) and Singh & Jain (2009) foundthat the larger watersheds (sub-basins) are poorlyelongated (high elongation ratio), whereas thesmaller watersheds are highly elongate (low elonga-tion ratio).
Basin asymmetry factor (AF)
The influence of tectonics on the drainage pat-tern is also reflected by the asymmetry of thedrainage basins (Molin et al. 2004). AF is an
Fig. 5. (a) Quaternary deposits near Vishnupuri showing deformation in a pebbly gravel bed mixed with sand. Acoin with a diameter of 2.5 cm is used for scale. (b) Ductile deformation in a sandy silt deposit showing a kinkbandin cross-bedding at Vishnupuri in the Nanded district. (c) High-angle ‘normal fault’ with a throw of 2.21 m. 1, blackcotton soil (BCS); 2, red bole bed, 3, greenish tachylitic (bole) basalt layer.
R. D. KAPLAY ET AL.322
by guest on March 29, 2017http://sp.lyellcollection.org/Downloaded from
areal morphometric variable that deciphers thepresence/absence of regional tilt in a basin (Keller& Pinter 1996). It is obtained from the formula AF¼ 100(Ar/At), where Ar is the area of the basin tothe right (facing downstream) of the trunk streamand At is the total area of the drainage basin (Kel-ler & Pinter 1996). A stream network through atectonically stable crust and a uniform lithologyshows a AF value of approximately 50. The mag-nitude is diffident in unstable regions (Keller &Pinter 1996). The study area is of uniform lithol-ogy and, therefore, AF is expected to be approxi-mately 50. The values of the asymmetry factorare calculated for the 32 sub-basins (Table 4). Itis observed that 10 sub-basins (i.e. 31.25% of thesub-basins analysed) were found to have AF valuesranging from 45 to 55, we considered these valuesas the near-normal values; 18.75% of the basinsshow a value of between 26 and 45; and 21.88%have a value of between 56 and 65. However,
the remaining 28.12% of the sub-basins showanomalous values (9.37% show AF , 26 and18.75% with AF . 66). Out of these 32 sub-basins, 16 are located on the northern side of theGodavari River and the rest in the southern part(Fig. 2). The drainage anomalies are associatedwith a WNW trend (e.g. the Ashti, Vazur andKhadki sub-basins), whereas the Asna and Sita riv-ers follow the NW-trending lineament in themicroseismically active area of the city of Nanded.The basins of Asna and Sita (sub-basins 14 and 16,respectively) also show anomalous values of AF.Hare & Garner (1985) found that AF can detecttectonic tilt.
Hypsometric analysis
In the present study of the percentage hypsometricintegral method, two ratios are computed fromcontour map measurements. The first one is a/A,
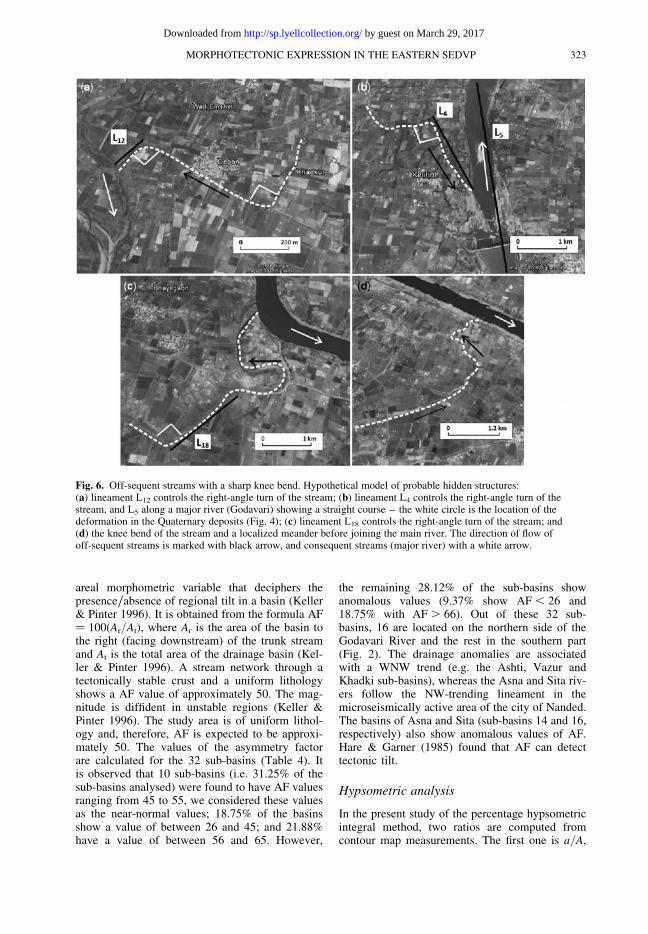
Fig. 6. Off-sequent streams with a sharp knee bend. Hypothetical model of probable hidden structures:(a) lineament L12 controls the right-angle turn of the stream; (b) lineament L4 controls the right-angle turn of thestream, and L5 along a major river (Godavari) showing a straight course – the white circle is the location of thedeformation in the Quaternary deposits (Fig. 4); (c) lineament L18 controls the right-angle turn of the stream; and(d) the knee bend of the stream and a localized meander before joining the main river. The direction of flow ofoff-sequent streams is marked with black arrow, and consequent streams (major river) with a white arrow.
MORPHOTECTONIC EXPRESSION IN THE EASTERN SEDVP 323
by guest on March 29, 2017http://sp.lyellcollection.org/Downloaded from
where a is the area enclosed between a given con-tour within the basin and basin boundary, and A isthe total area of the basin. The second ratio is h/H, where h is the height of the contour above thebase level of the stream mouth and H is the totalheight of the basin with reference to the same base.
The hypsometric integral (H ) was calculated asfollows:
H = (elevation mean − elevation minimum)/
(elevation maximum − elevation mean)
(Keller & Pinter 1996).
The hypsometric integrals calculated for the32 sub-basins of Godavari River in the Parbhaniand Nanded area are presented in Table 4. The mag-nitude range is 0.25–0.64. The mean H value for thesub-basins in the northern part of the river is 0.45,which is marginally lower than that of the sub-basins in the southern part (0.44). The H values ofthe Asna and Sita sub-basins, which are locatedaround the NW–SE-trending lineament (Babaret al. 2011), are 0.41 and 0.42, respectively. It wasnoticed that the moderate–high values in the middlepart of the study area coincide with the SL anoma-lies, whereas those for the eastern part correspond
Table 3. Morphometric attributes of the Godavari River Basin in the Parbhani and Nanded districts ofMaharashtra
to the NW–SE-trending lineament. However, thereare sub-basins with moderate and high values otherthan those of the above-mentioned area. Singh(2008b) argued that H is a useful parameter forassessing the nature of active tectonic deformation.Whether tectonics or erosion shapes the watershedsis also revealed.
Stream gradient to length ratio (SL)
This is the ratio of (H1 2H2) to (ln L2 2 lnL1),where H1 and H2 are the elevations of each end ofa given reach, and L1 and L2 are the distancesfrom each end of the reach to the source (Hack1973). The SL index can point out areas of
anomalous uplift. The SL values for the 32 sub-basins ranges from 2.24 to 9.05. The mean for therivers north of the Godavari River is 4.17, whichis lower than that of the rivers in the south (5.85)(Table 4).
Valley floor width to valley height ratio
The ratio of valley floor width to valley height (Vf)is expressed as:
Vf = 2Vfw/(Eld− Esc) + (Erd− Esc)
where Vfw is the width of valley floor, and Eld andErd are the ‘elevations of the left and right valley
Table 4. Morphometric attributes for geomorphic indices of active tectonics of sub-basins of the GodavariRiver Basin in the Parbhani and Nanded districts of Maharashtra
Sub-basinNo.
Name ofsub-basin/watershed
Elongationratio
Asymmetryfactors
Stream gradientto length ratio
Hypsometricintegral
Sub-basins in the northern part of the Godavari River1 Jamb 0.79 48.93 4.85 0.332 Ashti 0.66 46.71 3.95 0.643 Zari 0.98 71.29 3.59 0.274 Masala 0.64 34.59 3.42 0.635 Loni 0.62 53.02 3.12 0.586 Vazur 0.68 67.52 2.24 0.467 Indrayani 0.62 57.73 5.65 0.268 Khadki (Vajhur) 0.67 46.04 2.85 0.479 Pingalgad 0.46 66.06 2.92 0.38
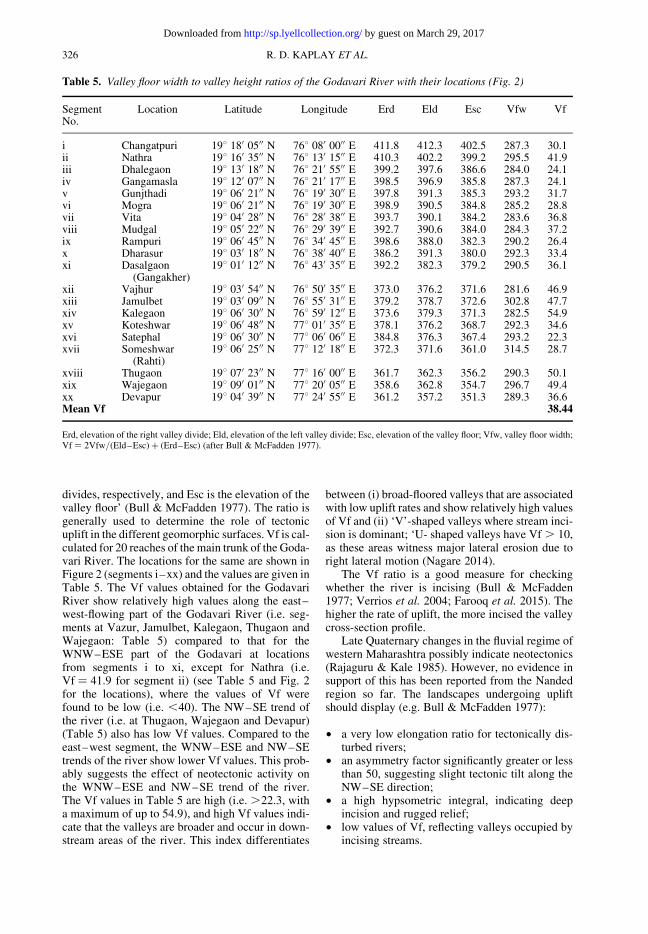
divides, respectively, and Esc is the elevation of thevalley floor’ (Bull & McFadden 1977). The ratio isgenerally used to determine the role of tectonicuplift in the different geomorphic surfaces. Vf is cal-culated for 20 reaches of the main trunk of the Goda-vari River. The locations for the same are shown inFigure 2 (segments i–xx) and the values are given inTable 5. The Vf values obtained for the GodavariRiver show relatively high values along the east–west-flowing part of the Godavari River (i.e. seg-ments at Vazur, Jamulbet, Kalegaon, Thugaon andWajegaon: Table 5) compared to that for theWNW–ESE part of the Godavari at locationsfrom segments i to xi, except for Nathra (i.e.Vf ¼ 41.9 for segment ii) (see Table 5 and Fig. 2for the locations), where the values of Vf werefound to be low (i.e. ,40). The NW–SE trend ofthe river (i.e. at Thugaon, Wajegaon and Devapur)(Table 5) also has low Vf values. Compared to theeast–west segment, the WNW–ESE and NW–SEtrends of the river show lower Vf values. This prob-ably suggests the effect of neotectonic activity onthe WNW–ESE and NW–SE trend of the river.The Vf values in Table 5 are high (i.e. .22.3, witha maximum of up to 54.9), and high Vf values indi-cate that the valleys are broader and occur in down-stream areas of the river. This index differentiates
between (i) broad-floored valleys that are associatedwith low uplift rates and show relatively high valuesof Vf and (ii) ‘V’-shaped valleys where stream inci-sion is dominant; ‘U- shaped valleys have Vf . 10,as these areas witness major lateral erosion due toright lateral motion (Nagare 2014).
The Vf ratio is a good measure for checkingwhether the river is incising (Bull & McFadden1977; Verrios et al. 2004; Farooq et al. 2015). Thehigher the rate of uplift, the more incised the valleycross-section profile.
Late Quaternary changes in the fluvial regime ofwestern Maharashtra possibly indicate neotectonics(Rajaguru & Kale 1985). However, no evidence insupport of this has been reported from the Nandedregion so far. The landscapes undergoing upliftshould display (e.g. Bull & McFadden 1977):
† a very low elongation ratio for tectonically dis-turbed rivers;
† an asymmetry factor significantly greater or lessthan 50, suggesting slight tectonic tilt along theNW–SE direction;
† a high hypsometric integral, indicating deepincision and rugged relief;
† low values of Vf, reflecting valleys occupied byincising streams.
Table 5. Valley floor width to valley height ratios of the Godavari River with their locations (Fig. 2)
SegmentNo.
Location Latitude Longitude Erd Eld Esc Vfw Vf
i Changatpuri 198 18′ 05′′ N 768 08′ 00′′ E 411.8 412.3 402.5 287.3 30.1ii Nathra 198 16′ 35′′ N 768 13′ 15′′ E 410.3 402.2 399.2 295.5 41.9iii Dhalegaon 198 13′ 18′′ N 768 21′ 55′′ E 399.2 397.6 386.6 284.0 24.1iv Gangamasla 198 12′ 07′′ N 768 21′ 17′′ E 398.5 396.9 385.8 287.3 24.1v Gunjthadi 198 06′ 21′′ N 768 19′ 30′′ E 397.8 391.3 385.3 293.2 31.7vi Mogra 198 06′ 21′′ N 768 19′ 30′′ E 398.9 390.5 384.8 285.2 28.8vii Vita 198 04′ 28′′ N 768 28′ 38′′ E 393.7 390.1 384.2 283.6 36.8viii Mudgal 198 05′ 22′′ N 768 29′ 39′′ E 392.7 390.6 384.0 284.3 37.2ix Rampuri 198 06′ 45′′ N 768 34′ 45′′ E 398.6 388.0 382.3 290.2 26.4x Dharasur 198 03′ 18′′ N 768 38′ 40′′ E 386.2 391.3 380.0 292.3 33.4xi Dasalgaon
(Gangakher)198 01′ 12′′ N 768 43′ 35′′ E 392.2 382.3 379.2 290.5 36.1
xii Vajhur 198 03′ 54′′ N 768 50′ 35′′ E 373.0 376.2 371.6 281.6 46.9xiii Jamulbet 198 03′ 09′′ N 768 55′ 31′′ E 379.2 378.7 372.6 302.8 47.7xiv Kalegaon 198 06′ 30′′ N 768 59′ 12′′ E 373.6 379.3 371.3 282.5 54.9xv Koteshwar 198 06′ 48′′ N 778 01′ 35′′ E 378.1 376.2 368.7 292.3 34.6xvi Satephal 198 06′ 30′′ N 778 06′ 06′′ E 384.8 376.3 367.4 293.2 22.3xvii Someshwar
(Rahti)198 06′ 25′′ N 778 12′ 18′′ E 372.3 371.6 361.0 314.5 28.7
xviii Thugaon 198 07′ 23′′ N 778 16′ 00′′ E 361.7 362.3 356.2 290.3 50.1xix Wajegaon 198 09′ 01′′ N 778 20′ 05′′ E 358.6 362.8 354.7 296.7 49.4xx Devapur 198 04′ 39′′ N 778 24′ 55′′ E 361.2 357.2 351.3 289.3 36.6Mean Vf 38.44
Erd, elevation of the right valley divide; Eld, elevation of the left valley divide; Esc, elevation of the valley floor; Vfw, valley floor width;Vf ¼ 2Vfw/(Eld–Esc) + (Erd–Esc) (after Bull & McFadden 1977).
R. D. KAPLAY ET AL.326
by guest on March 29, 2017http://sp.lyellcollection.org/Downloaded from
Lineaments in the study area appear as, or in termsof, linear stream channels, the alignment of darktone and the alignment of vegetation observed inimages. These are, linear to slightly curvilinear,geological features of local or regional extent, andare considered to be zones of structural weaknessthat are of geological, geomorphological and hydro-logical relevance. Usually, streams are sinuous:hence, the lineaments are identified when thestreams, tributaries or rivers in the area exhibitstraighter courses (Fig. 6). The straight courses areconfirmed in the field. A brief description of theselineaments is provided in Table 6. The lineamentscould either be faults or dykes (see Misra &Mukherjee 2015a, b for a different context). Thedyke lineaments could not be traced on images asthese, unlike those from other parts of the DeccanTrap, are of smaller length and are not exposed aselevated ridges. Most of the dykes fed the overlyingbasaltic flow. The length of the lineaments variesfrom 0.2 (L15) to 9.4 km (L7).
Preferred stream orientations are used to recon-struct neotectonics (Cantamore et al. 1996). Struc-tural features ( joints, faults and lineaments) mayproduce essentially straight rivers with minimummeandering (Twidale 2004). Joints and faults mayproduce short linear sections of rivers, typically a
few tens of metres long. Thus, it is interpreted thatthe major orientation of the straight course of theUG stream, with limited meander, is (thrust) fault-controlled (L6).
Minor deformation is observed in the Quaternarydeposits along the junction of L4 and L5 (Fig. 5a, b).The deformation is not observed along other linea-ments, as the other lineaments are covered byblack cotton soil. Hence, detailed geophysical sur-veys along these lineaments would be required
Geomorphometric characterization: stream
characters
The response of streams to tectonic deformation isdemonstrated by channel deflections (Whitney &Hengesh 2015). We have observed deflection ofstreams, such as sharp knee-bend turns, off-sequentstreams and a few anomalous features of streams, inthe study region.
Off-sequent streams
These streams drain to the SE following thegeneral slope. Figure 6a–d shows evidence of off-sequent streams. In particular, the stream at Degaon(Fig. 6a) flows approximately 1 km in the oppositedirection to the flow of the major tributary andtwice has right angled bends: one between Khadkut
Table 6. Description of the lineaments in brief
Sr. No Lineament Length (km) Direction Name of the stream (if any)
1 L1 6.9 N018 E–S018 W Son Nadi (local name)2 L2 4.1 N258 W–S 258 E Son Nadi (local name)3 L3 8.5 N788 E–S 788 W Godavari River4 L4 0.8 N308 W–S308 E Kottirth Nala5 L5 2.5 N058 W–S058 E Godavari River6 L6 6.0 N388 W–S388 E Urvashi Ghat Nala7 L7 9.4 N388 W–S388 E Asna Asegaon (Extension of
Urvashi Ghat Lineament)8 L8 2.2 N708 E–S708 W Asna Hadidapur9 L9 1.3 N788 W–S788 E Puyni Nala
10 L10 1.4 N298 E–S298 W Taroda Khurd Nala11 L11 0.9 N258 E–S258 W Sangvi Buzurg Nala12 L12 0.3 N388 E–S388 W Degaon Nala13 L13 0.8 N358 W–S358 E Bramhanwada Nala14 L14 0.4 N108 W–S108 E Bramhanwada Nala15 L15 0.2 N408 E–S408 W Amdura Nala16 L16 1.0 N758 W–S758 E Wasri Nala17 L17 0.8 N408 E–S408 W Kikki Nala18 L18 4.6 N458 E–S458 W Sita Nala19 L19 1.6 N688 W–S688 E –20 L20 5.5 N348 E–S34 8W –21 L21 7.5 N128 E–S128 W Sita Nala22 L22 1.9 N328 W–S328 E Sita Nala23 L23 0.7 N488 E–S488 W Sita Nala
MORPHOTECTONIC EXPRESSION IN THE EASTERN SEDVP 327
by guest on March 29, 2017http://sp.lyellcollection.org/Downloaded from
and Degaon, and other just before joining the majorriver. The lower right-angled bend of the stream iscontrolled by lineament L12. Similarly, the right-angled turn (knee bend) of the stream in Figure 6bis controlled by lineament L4, and in Figure 6c itis controlled by lineament L18. The off-sequentstream in Figure 6d is not associated with linea-ments, but all the streams show right-angle turnsand localized meanders before joining the mainriver. Twidale (2004) concluded that straight chan-nels imply control by fractures, either exposed orinduced by underprinting.
Sharp knee-bend turns of streams: distorted
streams
Some of the streams, which are not off-sequentstreams, show sharp knee-bend turns. Usually,streams flow sinuously. Streams flowing in analmost straight direction indicate that they are con-trolled by a discontinuity or hidden linear structure.Streams in Figure 7a–c show a straight course withsharp knee-bend turns. In Figure 7d, two streams
flow in opposite directions to one another in astraight line before they meet.
In Figure 7, two streams converge and diverge.Streams in the NW corner flow towards the SE,and the streams in the SE corner flow towards thewest. However, the former stream suddenly changesdirection and flows towards the SW, while the latter,instead of flowing towards the west, goes towardsthe south.
Discussion
Field evidence
Tectonic features in the form of thrusts associatedwith antiform and fault-related folds, reportedfrom the northern part of the Godavari River, arereported from Zone 3 (Kaplay et al. 2013). Notethat the dip direction of these thrusts (such as theKamtha thrusts) is also towards the west, whichcorroborates with that of the causative fault reportedby Srinagesh et al. (2012). Most of Nanded City islocated on the estern side of this causative fault.
Fig. 7. Sharp knee-bend turn and anomalous behaviour of streams: (a) lineament L16; (b) lineament L11;(c) lineaments L21–L23 control the straight course of the streams; (d) lineament L13 and L14 control the knee-bendturn of streams; and (e) anomalous behaviour of streams (convergence and divergence of streams before joining themain stream). The arrows indicate the direction of the flow of streams.
R. D. KAPLAY ET AL.328
by guest on March 29, 2017http://sp.lyellcollection.org/Downloaded from
Deformation in Quaternary deposits. The deforma-tion observed at the junction of L4 and L5 (Fig. 4a, b)is neotectonic, as it is reported in Quaternary depos-its. These areas of deformation are reported fromZone 3 and are located on the northern side of theGodavari River. The straight course of the UrvashiGhat stream that flows through the UG Lineament(which itself is a manifestation of a thrust) and theoccurrence of deformation at the junction of linea-ments L4 and L5 suggest neotectonics of the drain-age system in Zone 3. Normal faults, with off-setcutting through the black cotton soil (Fig. 5c), arealso reported in Zone 3.
Anomalous drainage, lineaments and microseis-micity. Anomalous drainage patterns can indicateobscure geological structures and neotectonics(Jackson et al. 1998; Goldsworthy & Jackson 2000;Burrato et al. 2003; Vannoli et al. 2004; Delcaillauet al. 2006; Hodgkinson et al. 2006). Turns of 908and anomalous behaviour of streams in generalindicate that the drainage pattern of the region iscontrolled by subsurface discontinuities or struc-tures (Babar et al. 2000). In the study region, chan-nel anomalies are observed that could mean hiddenrift or subsurface fault(s) (Fig. 7). Anomalous drain-age, which includes off-sequent streams, sharpknee-bend turns and straight courses (Fig. 7), is con-fined on the northern side of the Godavari River inZone 3. No anomalous drainage features areobserved on the southern side of the Godavari River.
The microseismicity observed in the Nandedregion is also confined to the northern side of theGodavari River, with no event reported from thesouthern. The microseismicity is restricted to within10 km2 and focal depths of these earthquakes rangefrom 0 to 2 km, indicating that the hypocentres ofquakes extend into the granitic basement. The recentdigging of deep bore wells for groundwater, nearerto the UG Lineament, revealed that granite occursapproximately 200 m below the basalt (Fig. 1b).The spatial distribution of the microseismicity isshown in Figure 1b. The earlier events in 2006–2007 took place on the eastern side and the laterevents happened towards the south. Thus, the micro-seismicity shifted from the east towards the west:that is, towards the straight course of the stream,here named here as the Uravashi Ghat stream.This straight course of the stream is inferred fromsatellite images as NW-trending lineaments (Srivas-tava 2007), and we refer this lineament as the UGLineament.
The UG lineament (L6) in the study area isapproximately 6 km long. It passes through theWadi and Jangamwadi areas, and joins the GodavariRiver near the Urvashi Ghat. Google Earth Imageenabled us to trace L6 further NW for up to9.4 km, and it is marked as L7 in Figure 4. The
lineament thus continues up to Wasamat, approxi-mately 25 km from Nanded. Interestingly, an earth-quake in 1942 with a magnitude of 3.7 (intensityIV), with an epicentre location of 198 30′ Nlatitude and 778 0′ E longitude, was reported by Ras-togi (2001). Thus, it is interesting to note that micro-seismicity is reported at the SE end of the UGLineament (near Nanded) and past seismicity isreported nearer to the NW end of this lineament(near Wasmat: the dashed circle in the top left-handcorner of Fig. 4a). However, no field evidence ofdeformation has been observed in the alluviumdeposits.
Srinagesh et al. (2012) interpreted that thrustingalong a NW-trending fault coincides with a localstream that joins the Godavari River, south ofNanded City. This fault can be correlated with theUrvashi Ghat Lineament. The depth of the UG Lin-eament is interpreted to be 4 km along its SE end(Srinagesh et al. 2012). The straight course of theUrvashi Ghat stream (Fig. 3) suggests the presenceof a subsurface discontinuity. The UG Lineamentcontinues in the underlying granite basement:hence, it can be interpreted as a basement lineament,the manifestation of which is expressed in the over-lying Deccan basalt.
Prior to this activity in Nanded, in the proximityof Nanded City, at a distance of about 146 km SEof Nanded, a devastating earthquake of magnitude6.3 struck the Killari region on 30 September 1993along a hidden fault that coincides with the TirnaLineament (Babar et al. 2000; Chetty 2006; Mukho-padhyay et al. 2006).
The trend of most of the lineaments (52%)observed in the study area is NE, whereas 48%trend to the NW (Fig. 4a). The regional lineamenttrends worked out by earlier workers are as follows.Two NE–SW lineaments, one between Khandwaand Edlabad, and the other one between Partur andKurudwadi (Harinarayana et al. 2007). The TaptiLineament, traceable from Ambikapur in MadhyaPradesh to Daman on the Indian western coast,trends NE (Powar & Patil 1980). The Koyna Linea-ment, a surface manifestation of the Koyna Rift,trends NE. The Panvel Lineament, from Silvassato Panvel, that corresponds to the Panvel flexurealso shows a similar trend (Powar & Patil 1980).NE–SW lineaments have also been reported nearMumbai at Salher and Ratanagarh by Misra et al.(2014).
NE–SW lineaments from the study area matchthose reported between Khandwa and Edlabad, Par-tur and Kurudwadi (Harinarayana et al. 2007), atSalher and Ratanagarh near Mumbai (Misra et al.2014), and the Panvel and the Tapti lineaments(Powar & Patil 1980).
The Godavari lineaments (lineaments in theGodavari Basin) trend NW and correspond to the
MORPHOTECTONIC EXPRESSION IN THE EASTERN SEDVP 329
by guest on March 29, 2017http://sp.lyellcollection.org/Downloaded from
margins of the Godavari Rift (Powar & Patil 1980).The Mahanadi Lineament, with a NW trend, cutsacross the Deccan Volcanic Province at its easternextremity (Powar & Patil 1980). A NW-trendinglineament, the Kurudwadi Lineament (about240 km SW of the study area), can be traced nearGulbarga, Kurudwadi and extends north to Mumbai(Harinarayana et al. 2007). Structural disturbancesat deep crustal depth are speculated along thislineament (Peshwa & Kale 1997) from observa-tions of satellite imagery and field verification. SixNW–SE fault/lineament zones, with known tec-tonic features in-between Kurudwadi and Partur,have been reported (Patro 2002; Harinarayanaet al. 2007). NW–SE-trending Kaddam fault line-aments (about 100 km NE of the study area: San-gode et al. 2013) can be traced near Kinwat,Maharashtra.
The NW-trending lineaments from the studyarea match with the Godavari Lineament (Powar& Patil 1980), the Kurudwadi Lineament (Peshwa& Kale 1997), fault lineaments (Patro 2002; Hari-narayana et al. 2007), lineaments from Karlareported by Misra et al. (2014) and the Kaddamfault lineaments (Sangode et al. 2013). Also notedwas that the NW trend of the UG Lineamentmatches with the direction of the seismically activeTirna tributary (Killari), 140 km SW of the UGLineament.
The north trend of the L5 lineament (Figs 4a &6b) from the study area matches with the Trans-Deccan Lineament, which is a conspicuous linea-ment that follows an arcuate north–south trendfrom Kota in the north to Kurudwadi in the south(Powar & Patil 1980), and the dominant north–south-orientated lineaments from strike-slip faultzones near the west coast reported by Misra et al.(2014) (see also Misra & Mukherjee 2015a, b;Misra et al. 2015 for the regional geology). TheGodavari River here flows along an almost straightcourse for approximately 2.5 km. The width ofthe Godavari River along this section is approxi-mately 220 m. Interestingly, the off-sequent stream(Fig. 6b) is sub-parallel to the north–south-trendingGodavari River. The north–south-trending Goda-vari River in this section matches with the trend ofthe lineaments of the West Deccan Strike-slipZone (Misra et al. 2014). Thus, the trends of the lin-eaments from the study area show a similar trend tothat shown by the lineaments of the Deccan Volca-nic Province.
Morphometric analysis
Morphometric data, combined with seismic andgeomorphic data, is a valuable tool in determiningrelative levels of neotectonic activity and in pro-viding data for seismic hazard assessment. The
elongation ratio constrains the elongate nature ofthe basin. The hypsometric integral quantifies activetectonics (Singh 2008b).
Spatial analysis of basins. A basin elongation ratio,0.5 indicates the basin is tectonically active, val-ues ranging between 0.5 and 0.75 reflect slightly/moderately active basins, and those .0.75 reflectinactive basins (Cuong & Zuchiewicz 2001). Theelongation ratio, for most of the sub-basins (24 outof 32), is in the range 0.5–0.75, indicating thatmost of the sub-basins are slightly/moderately tec-tonically active. As the entire study area showsthat the elongation ratio is poorly related to tecton-ics, the area was divided into the northern andsouthern sides.
The value of mean elongation ratio for sub-basins in the northern part of the Godavari River isslightly more (0.67) than that in the southern part(0.65). Basins in southern part of the GodavariRiver are more elongate (low values of the elonga-tion ratio) than in the northern part (Fig. 8a).
Hypsometric data acquired from the ShuttleRadar Topography Mission digital elevation model(SRTM DEM) and other sources can be utilizedfor analysis of the watershed or basins of any dimen-sions (Rosenblatt & Pinet 1994; Hurtez et al. 1999).It is one of the significant tools in assessing andcomparing the geomorphic evolution of variouslandforms. The present analysis covers basins wherethrusts have been ascertained from geophysicalstudies (e.g. the UG Lineament) and fieldwork(Kamtha thrusts).
The southern part has slightly lower averagehypsometric integral values (0.45) than the northernpart (0.44). The entire area can further be subclassi-fied into six zones (Figs 2, 8 & 9): three on the north-ern side of the Godavari River, and the other threeon the southern side. Spatial analysis was carriedout on these zones in the line of Singh (2008b).This was undertaken to find out the specific influ-ence of the structures in particular areas:
† Zone 1: the elongation ratio on the northern sidein this zone is higher (average: 0.72) than on thesouthern side (average: 0.529), and the hypso-metric integral on the northern side is the same(average: 0.49) as that on the southern side (aver-age: 0.49).
† Zone 2: the elongation ratio on the northern sidein this zone is higher (average: 0.61) than on thesouthern side (average: 0.58), and the hypsomet-ric integral on the northern side is slightly higher(average: 0.41) than on the the southern side(average: 0.39)
† Zone 3: the class named here as the NandedStructural Class shows the exact opposite trendof elongation ratio and hypsometric integral tothat of the entire basins in the study area. The
R. D. KAPLAY ET AL.330
by guest on March 29, 2017http://sp.lyellcollection.org/Downloaded from
elongation ratio of the northern side is slightlyless (average: 0.63) than on the southern side(average: 0.64). The low values of elongationratio on the northern side suggest that this side(i.e. the northern side) is more elongate thanthe southern part. This is attributed to structuraldeformation observed in the northern region.Further, the northern part has a lower range ofhypsometric integral values (average: 0.45)than the southern part (0.50) (Fig. 8b), indicat-ing that a comparatively lesser proportion ofthe area is elevated in the southern part of thestudy area. North of this zone, the UG Lineamentbasin shows the highest hypsometric integralvalue (0.60).
We filtered out sub-basins 12, 13 and 14 onnorthern side, and 17, 18 and 19 on the southernside to find out whether there were any strong corre-lations, as sub-basins 12, 13 and 14 show deforma-tion (Kaplay et al. 2013) but 17, 18 and 19 do not.We found that the elongation ratio for sub-basins12, 13 and 14 (on the northern side) shows an aver-age magnitude of 45.75, while for sub-basins 17, 18
and 19 (on the southern side) it is 63.39. The strongdifference between the values across the river maybe attributed to the UG Lineament, and the associ-ated seismicity and deformation. This type of filter-ing was also performed for the hypsometric integraland asymmetry factor but did not bring to light anymajor differences.
Sub-basin 14, on the northern side in Zone 3, hasthe largest area. This is the sub-basin where theKamtha thrusts are reported. This is also the zonewhere deformation in the Black Cotton Soil (BCS)has been observed. The UG fault lineament falls insub-basin 13. Sub-basin 12 contains deformed Qua-ternary deposits. The microseismicity mostly coverssub-basins 13 and 14.
The influence of tectonics is variable on bothflanks around Nanded. It is more pronounced onthe northern side than on the southern side, asshown by the higher values of the hypsometric inte-gral. This is supported by the presence of the UGThrust Lineament (L6) and the Kamtha thrusts inthe basalts on the northern side. Minor deformation,observed in Quaternary deposits near the junction oftwo lineaments (L4 & L5), also falls on the northern
Fig. 8. (a) Basin area, (b) elongation ratios, (c) the hypsometric integral and (d) the basin asymmetry factor.
MORPHOTECTONIC EXPRESSION IN THE EASTERN SEDVP 331
by guest on March 29, 2017http://sp.lyellcollection.org/Downloaded from
side. The northern side of this zone is characterizedby lineaments and the anomalous stream courses.
The influence of tectonics is less on the southernside, as indicated by a comparatively high elonga-tion ratio. This is also well supported by the absenceof lineaments and anomalous stream courses on thisside. Furthermore, no deformation is observed here.
In addition to the elongation ratio and hypsomet-ric integral, the asymmetry factor was also first ana-lysed for the entire study area then for the threezones. The average asymmetry factor for the north-ern side is lower (48.34) than on the southern side(55.35).
The asymmetry factor was then studied for dif-ferent zones (Fig. 8d). In Zone 1, the average valuefor the asymmetry factor on the northern side(53.15) is less than on the southern side (63.50). InZone 2, its average value on the northern side ishigher (48.89) than on the southern side (47.23). InZone 3, the average value on the northern side is less(42.87) than on the southern side (63.40). However,the average value for the asymmetry factor on thenorthern side in Zone 3 is the lowest value obtained(42.87). The asymmetry of the drainage basins on
the northern side thus reflects the influence of tec-tonics on the drainage pattern. Anomalous drainagepatterns are confined to this zone.
A comparison of the morphometric parametersfor the entire study area shows that when the data-set is subdivided into classes (as per Singh 2008bin a different study area), a better relationship arisesbetween the parameters. This is clearly evident fromthe above observations. Thus, it may be inferredthat, although the study area is similar in terms oflithology, the geological structure is significantlydifferent in the eastern part (Zone 3), which isreflected in the different geomorphic parameters.In the northern part of the area, SL values are less(Table 4), even though the rock is basalt. The reasonfor this is the intense weathering of the rocks. In thesouthern part of the area with less tectonic activity,the SL values are higher. This means that within thearea of same/similar lithology and slope, the SLindex fluctuates. The SL index is roughly relatedto the stream power, while is particularly sensitiveto changes in slope and lithology. This sensitivityallows an evaluation to be made of the relation-ship between possible tectonic activity and rock
Fig. 9. Stream gradient to length ratio.
R. D. KAPLAY ET AL.332
by guest on March 29, 2017http://sp.lyellcollection.org/Downloaded from
resistance (Keller & Pinter 1996). Therefore, theindex is high in places with resistant rocks/activetectonics. Thus, anomalously high SL values or itsfluctuation in rock of uniform resistance is a possi-ble indicator of active tectonics (Keller 1986).Higher values of SL are concentrated in the southernand western zones of the area around Nanded dis-trict (Fig. 9).
The area north of Godavari is more deformedthan the southern area. Pronounced microseismicityis also found on the northern side of the GodavariRiver.
Conclusions
The elongation ratio and hypsometric integralhave been found to be useful parameters for assess-ing the nature of active tectonic deformation (Singh2008b); we found the same to be true in this study.The major conclusions derived are as follows:
† In and around the Nanded region (Maharashtra,India), which has been microseismically activesince 2006, tectonics are more pronounced onthe northern side than on the southern side.
† The influence of tectonics is more prominentin Zone 3 (Figs 2, 8 & 9) on the northern side ofthe Godavari River, where microseismic activ-ity, the UG Thrust Lineament, the Kamthathrusts, deformation in Quaternary deposits, andother lineaments and anomalous drainage areconfined.
† The influence of tectonics in Zone 3 has alsobeen ascertained by reference to anomalousasymmetry factor values.
This work has been improved enormously by three roundsof critical reviews by three reviewers. We also thankMr Sumeet Chavan, M.Phil. student, for his support inpreparing GIS images for the morphometric parameters.We thank Angharad Hills, Tamzin Anderson, RachaelKriefman and Phil Leat (Geol Soc London) for support.
References
Babar, M.D., Kaplay, R.D. & Panaskar, D.B. 2000.Structural control on drainage pattern in the TirnaRiver Catchment, Central west India. Indian Journalof Geomorphology, 5, 126–133.
Babar, M.D., Ghute, B.B. & Chunchekar, R.V. 2011.Geomorphic indicators of Neotectonics from theDeccan Basaltic Province: a study from the UpperGodavari River Basin, Maharashtra, India. Interna-tional Journal of Earth Science and Engineering, 4,297–308.
Bondre, N.R., Duraiswami, R.A., Dole, G., Phadnis,V.M. & Kale, V.S. 2000. Inflated pahoehoe lavasfrom the Sangamner area of the western Deccan Volca-nic Province. Current Science, 78, 1004–1007.
Bondre, N.R., Duraiswami, R.A. & Dole, G. 2004. Mor-phology and emplacement of flows from the DeccanVolcanic Province, India. Bulletin of Volcanology,66, 29–45.
Bull, W.B. & McFadden, L.D. 1977. Tectonic Geo-morphology north and south of Garlock Fault, Califor-nia. In: Doehring, D.O. (ed.) Geomorphology inArid Regions Eighth Annual Geomorphology Sympo-sium. State University New York, Binghamton, NY,115–138.
Burrato, P., Ciucci, F. & Valensise, G. 2003. An inven-tory of river anomalies in the Po Plain, Northern Italy:evidence for active blind thrust faulting. Annals ofGeophysics, 46, 865–882.
Cantamore, E., Ciccacci, S., Montedel, M., Fredt, P.& Lupia Palmieri, E. 1996. Morphological and mor-phometric approach to the study of the structuralarrangements of northeastern Abruzzo (Central Italy).Geomorphology, 16, 127–137.
CENTRAL GROUND WATER BOARD (CGWB). 2012. Guide-lines for Aquifer Mapping. Government of India,Faridabad.
Chetty, T.R.K. 2006. Contrasting deformational systemsand associated seismic patterns in Precambrian penin-sular India. Current Science, 90, 942–951.
Cuong, N.Q. & Zuchiewicz, W. 2001. Morphotectonicproperties of the Red River Fault Zone in Vietnam: ageomorphic perspective. Natural Hazards and EarthSystem Sciences, 1, 15–22.
Delcaillau, B., Carozza, J.M. & Laville, E. 2006.Recent fold growth and drainage development: theJanauri and Chandigarh anticlines in the Siwalik foot-hills, northwest India. Geomorphology, 76, 241–256.
Duraiswami, R.A., Bondre, N.R., Dole, G., Phadnis,V.M. & Kale, V.S. 2001. Tumuli and associated fea-tures from the western Deccan Volcanic Province,India. Bulletin of Volcanology, 63, 435–442.
Duraiswami, R.A., Bondre, N.R., Dole, G. & Phadnis,V.M. 2002. Morphology and structure of flow-lobetumuli from the western Deccan Volcanic Province,India. Journal of Geological Society of India, 60,57–65.
Duraiswami, R.A., Dole, G. & Bondre, N.R. 2003.Slabby pahoehoe from the western Deccan VolcanicProvince: evidence for incipient pahoehoe-aa transi-tions. Journal of Volcanology and GeothermalResearch, 121, 195–217.
Duraiswami, R.A., Bondre, N.R. & Managave, S. 2008.Morphology of rubbly pahoehoe (simple) flows fromthe Deccan volcanic province: implications for styleof emplacement. Journal of Volcanology and Geother-mal Research, 177, 822–836.
Farooq, S., Nazish Khan, M. & Sharma, I. 2015.Assessment of active tectonics in Eastern KumaonHimalaya on the basis of morphometric parametersof Goriganga River Basin. International Journal ofAdvancement in Earth and Environmental Sciences,3, 14–21.
Godbole, S.M., Rana, R.S. & Natu, S.R. 1996. Lavastratigraphy of Deccan basalts of Western Maharash-tra. Gondwana Geological Magazine, Special Publica-tions, 2, 125–134.
MORPHOTECTONIC EXPRESSION IN THE EASTERN SEDVP 333
by guest on March 29, 2017http://sp.lyellcollection.org/Downloaded from
Goldsworthy, M. & Jackson, J. 2000. Active normalfault evolution in Greece revealed by geomorphologyand drainage patterns. Journal of the Geological Soci-ety, London, 157, 967–981, https://doi.org/10.1144/jgs.157.5.967
Hack, J. 1973. Drainage adjustment in the Appalachians.In: Morisawa, M. (ed.) Fluvial Geomorphology.George Allen & Unwin, London, 51–69.
Hare, P.W. & Garner, T.W. 1985. Geomorphic indica-tors of vertical Neotectonics along converging platemargins, Nicoya Peninsula, Costa Rica. In: Morisawa,M. & Hack, J.T. (eds) Tectonic Geomorphology. Pro-ceedings of the 15th Annual Binghamton Geomorphol-ogy Symposium, September 1985. Allen & Unwin,Boston, MA, 75–104.
Harinarayana, T., Patro, B.P.K., Veeraswamy, K.,Manoj, C., Naganjaneyulu, K., Murthy, D.N. &Virupakshi, G. 2007. Regional geoelectric structurebeneath Deccan Volcanic Province of the Indian sub-continent using magnetotellurics. Tectonophysics,445, 66–80.
Hodgkinson, J.H., Mcloughlin, S. & Cox, M.2006. The correlation between physiography andneotectonism in southeast Queensland. In: Proceed-ings of the Earthquake Engineering ConferenceAEES2006, Canberra, ACT, Australia. AustralianEarthquake Engineering Society, Sydney, Australia,195–202.
Hurtez, J.E., Sol, C. & Lucazeau, F. 1999. Effect ofdrainage area on hypsometry from an analysis of small-scale drainage basins in the Siwalik Hills (CentralNepal). Earth Surface Processes and Landforms, 24,799–808.
Jackson, J., Van Dissen, R. & Berryman, K. 1998. Tilt-ing of active folds and faults in the Manawatu region,New Zealand: evidence from surface drainage patterns.New Zealand Journal of Geology and Geophysics, 41,377–385.
Kale, V.S. & Shejwalkar, N. 2008. Uplift along thewestern margin of the Deccan Basalt Province: isthere any geomorphic evidence? Journal of Earth Sys-tem Sciences, 117, 959–971.
Kaplay, R.D., Vijay Kumar, T. & Sawant, R.N. 2013.Field evidence for deformation in Deccan traps inmicroseismically active Nanded area, Maharashtra.Current Science, 105, 1051–1052.
Keller, E.A. 1986. Investigation of active tectonics: useof surficial Earth processes. In: Wallace, R.E. (eds)Active Tectonics Studies in Geophysics. National Aca-demic Press, Washington, DC, 136–147.
Keller, E.A. & Pinter, N. 1996. Active Tectonics Earth-quakes, Uplift and Landscape. Prentice-Hall, Engle-wood Cliffs, New Jersey.
Madhnure, P. 2006. A Report of Groundwater Survey inNanded District, Maharashtra. Central Region. Cen-tral Groundwater Board, Nagpur, India.
Madhnure, P. 2014. Groundwater exploration and drill-ing problems encountered in basaltic and graniticterrain of Nanded district, Maharashtra. Journal Geo-logical Society of India, 84, 341–351.
Misra, A.A. & Mukherjee, S. 2015a. Tectonic Inheri-tance in Continental Rifts and Passive Margins.Springer Briefs in Earth Sciences. Springer, Cham,Switzerland.
Misra, A.A. & Mukherjee, S. 2015b. Dyke–brittle shearrelation in the western Deccan Traps near Mumbai,India. Paper presented at the Tectonic Studies GroupAnnual Meeting, 6–8 January 2015, Grant Institute,University of Edinburgh, UK.
Misra, A.A., Bhattacharya, G., Mukherjee, S. &Bose, N. 2014. Near N–S paleo–extension in thewestern Deccan region, India: does it link strike–sliptectonics with India–Seychelles rifting? InternationalJournal of Earth Sciences, 103, 1645–1680.
Misra, A.A., Sinha, N. & Mukherjee, S. 2015. Repeatridge jumps and microcontinent separation: insightsfrom NE Arabian Sea. Marine and PetroleumGeology,59, 406–428.
Molin, P., Pazzaglia, F.J. & Dramis, F. 2004. Geomor-phic expression of active tectonics in a rapidly-deforming forearc, Sila Massif, Calabria, SouthernItaly. American Journal of Science, 304, 559–589.
Mukherjee, S. 2013. Deformation Microstructures inRocks. Springer Geochemistry/Mineralogy. Springer,Berlin.
Mukherjee, S. 2014a. Review of flanking structures inmeso- and micro-scales. Geological Magazine, 151,951–974.
Mukherjee, S. 2014b. Atlas of Shear Zone Structures inMeso-scale. Springer Geology. Springer, Cham,Switzerland.
Mukherjee, S. 2015. Atlas of Structural Geology. Elsev-ier, Amsterdam.
Mukhopadhyay, S., Mishra, O.P., Zhao, D. &Kayal, J.R. 2006. 3-D seismic structure of thesource area of the 1993 Latur, India, earthquakeand its implications for rupture nucleations. Tecto-nophysics, 415, 1–16.
Nagare, V.B. 2014. Calculating the morphotectonicindices of the Mula River Basin, Western part ofMaharashtra, India: a GIS approach. Galaxy: Inter-national Multidisciplinary Research Journal, 3,230–237.
NANDED DISTRICT GAZETTEER. 1971. Section on Geology,contributed by the Geological Survey of India, Cal-cutta, Maharashtra State Gazetteers, Government ofMaharashtra, Nanded District (First Edition). Director-ate of Government Printing, Stationary and Publica-tions, Maharashtra State, Bombay, India.
Patro, B.P.K. 2002. A magnetotelluric study of crustalgeoelectric structure in western India in relation toseismotectonics of the Deccan trap region. PhD thesis,Osmania University, Hyderabad, India.
Peshwa, V.V. & Kale, V.S. 1997. Neotectonics of theDeccan trap province: focus on Kurudwadi lineament.Journal of Geophysics, 18, 77–86.
Powar, K.B. & Patil, D.N. 1980. Structural evolutionof the Deccan Volcanic Province: a study based onLANDSAT-1 imageries. In: Proceedings of the 3rdIndia Geological Congress, Poona. University ofPoona, Poona, India, 235–253.
Rajaguru, S.N. & Kale, V.S. 1985. Changes in the flu-vial regime of Western Maharashtra upland rivers dur-ing Late Quaternary. Journal of Geological Society ofIndia, 26, 16–27.
Rajaguru, S.N., Kale, V.S. & Badam, G.L. 1993. Qua-ternary fluvial systems in Upland Maharashtra.CurrentScience, 64, 817–822.
R. D. KAPLAY ET AL.334
by guest on March 29, 2017http://sp.lyellcollection.org/Downloaded from
Rastogi, B.K. 2001. Seismology and seismic events ofwestern India, Special issue on earthquake, Maeers.Maharashtra Institute of Technology Pune Journal,IX, 70–80.
Rosenblatt, P. & Pinet, P.C. 1994. Comparative hypso-metric analysis of Earth and Venus. GeophysicalResearch Letters, 21, 465–468.
Sangode, S.J., Mesharm, D.C., Kulkarni, Y.R.,Gudadhe, S.S., Malpe, D.B. & Herlekar, M.A.2013. Neotectonic response of the Godavari and Kad-dam Rivers in Andhra Pradesh, India: implications toquaternary reactivation of old fracture system. Journalof Geological Society of India, 81, 459–471.
Schumm, S.A. 1956. The evolution of drainage systemsand slopes in bad lands at Perth, Amboi, New Jersey.Geological Society of American Bulletin, 67, 597–646.
Singh, T. 2008a. Tectonic implications of geomorphiccharacterization of watersheds using spatial correla-tion: Mohand Ridge, NW Himalaya, India. Zeitschriftfur Geomorphologie, 54, 489–501.
Singh, T. 2008b. Hypsometric analysis of watershedsdeveloped on actively deforming Mohand anticlinalridge, NW Himalaya. Geocarto International, 23,417–427.
Singh, T. & Jain, V. 2009. Tectonic constraints on water-shed development on frontal ridges: Mohand Ridge,NW Himalaya, India. Geomorphology, 106, 231–241.
Srinagesh, D., Bhaskar, Y.V.B.S.N., Thandan Babu
Naik, R., Solomon Raju, P., Sarma, A.N.S., Vijay
Kumar, T. & Yedekar, D.B. 2008. Preliminary ReportonSeismicActivity atNandedCity,MaharashtraRegionunpublished report submitted to District Collector.Nanded, Govt. of Maharashtra (Unpublished report).
Srinagesh, D., Srinivas, T.V.N. et al. 2012. Causativefault of swarm activity in Nanded City, Maharashtra.Current Science, 103, 366–369.
Srivastava, R.K. 2007. Study of Lineament FabricAround Nanded, Maharashtra by Remote Sensing.Unpublished note from the Geological Survey ofIndia, Central Region, Nagpur, India.
Tiwari, M.P. 1999. Quaternary lithostratigraphic forma-tions of Central Indian river basin, their correlationand chronology. Gondwana Geological MagzazineSpecial Publications, 4, 17–31.
Twidale, C.R. 2004. River patterns and their meaning.Earth-Science Reviews, 67, 159–218.
Vannoli, P., Basili, R. & Valensise, G. 2004. New geo-morphic evidence for anticlinal growth driven byblind-thrust faulting along the northern Marche coastalbelt (central Italy). Journal of Seismology, 8, 297–312.
Verrios, S., Zygouri, V. & Kokkalas, S. 2004. Morpho-tectonic analysis in the eliki fault Zone (Gulf ofCorinth, Greece). Bulletin of the Geological Societyof Greece, 36, 1706–1715.
Whitney, B.B. & Hengesh, J.V. 2015. Geomorphologi-cal evidence of neotectonic deformation in the Carnar-von Basin, Western Australia. Geomorphology, 228,579–596.
MORPHOTECTONIC EXPRESSION IN THE EASTERN SEDVP 335
by guest on March 29, 2017http://sp.lyellcollection.org/Downloaded from