Munich Personal RePEc Archive Do recruiters ’like’ it? Online social networks and privacy in hiring: a pseudo-randomized experiment Matthieu Manant and Serge Pajak and Nicolas Souli ´ e Department of Economics, University of Paris Sud 24. June 2014 Online at http://mpra.ub.uni-muenchen.de/56845/ MPRA Paper No. 56845, posted 28. June 2014 05:42 UTC
Transcript
MPRAMunich Personal RePEc Archive
Do recruiters ’like’ it? Online socialnetworks and privacy in hiring: apseudo-randomized experiment
Matthieu Manant and Serge Pajak and Nicolas Soulie
Department of Economics, University of Paris Sud
24. June 2014
Online at http://mpra.ub.uni-muenchen.de/56845/MPRA Paper No. 56845, posted 28. June 2014 05:42 UTC
Do recruiters �like�it? Online social networks and privacy inhiring: A pseudo-randomized experiment�
Matthieu Manant�, Serge Pajak� and Nicolas Soulié�� RITM, Department of Law, Economics and Management, Université Paris-Sud
June 24, 2014
Abstract
With the advance of online social networks, the screening of applicants during hiring can extendbeyond the usual application material. Although browsing the online pro�le of an applicant raisesethical issues, this practice potentially improves the job matching, at virtually no cost to theemployer. In this paper, we investigate the use of online social networks as a reliable source ofinformation for recruiters on applicants in the French job market.
We set up a �eld experiment using real accountant job o¤ers in the greater Paris area. Weadjust the content of Facebook accounts to manipulate the perceived origins of applicants (home-town and language spoken) and analyze the impact on the number of callbacks received fromemployers. The signal we manipulate to distinguish applicants is available only within the onlinepro�le, not the application material. During a 12 month period from March 2012 to March 2013,we submitted more than 800 applications. The test applicant received a third fewer callbackscompared to the control applicant, a signi�cant di¤erence. Our results suggest that online pro�lesare used indeed to screen applicants, and that this occurs early in the hiring process.
During the course of the experiment, a change to the standard Facebook layout sent a part ofour signal, namely the language spoken by the applicants, into a sub-tab not directly visible fromthe front page. This exogenous change (clicking on a tab is now required to access the information)allowed us to measure the recruiter�s depth of search. In subsequent months, the gap between thetwo applicant types shrank and virtually disappeared. This suggests that screening is super�cial,illustrating the existence of employer search costs for browsing an entire pro�le.
Keywords: Online Social Network; Labor Market Discrimination; Privacy; Field experiment.JEL Codes: J71; D83; K31; C93.
1 Introduction
For a decade, Social Network Sites (SNSs) have been growing in popularity and have reached morethan one billion users worldwide.1 They radically changed the way many people create and managerelationships with friends and families. However, the impact of these online services seems to extend
�This paper was presented at the Telecom ParisTech Economics & Management Seminar (January, 2013), theUniversité Paris-Est Créteil seminar (January, 2013), the Economics & Psychology seminar at Paris School of Economics(March, 2013), the 3rd SEEK Conference on Labour Market at ZEW Mannheim (April, 2013), the 11th IIOC AnnualConference in Boston (May, 2013), the Workshop on Experimental Economics in Florence (May, 2013), the 4th AnnualMeeting of the French Experimental Economics Association in Mannheim (June, 2013), the 62nd Annual Meetingof the French Economic Association in Aix-en-Provence (June, 2013), the World Meeting of the Economic ScienceAssociation in Zurich (July, 2013) and we thank the audience for their comments and feedback. We are grateful toparticipants in the research program Alain Rallet, Fabrice Rochelandet, Fabrice Le Guel and Grazia Cecere for theiruseful comments all along the experiment, and also to Guillaume Hollard and José de Sousa for their support. Authors�e-mails: [email protected] (corresponding author), [email protected], [email protected].
1See for instance BBC: http://www.bbc.com/news/technology-19816709
1
much further, with the media regularly reporting employee dismissals motivated by information dis-closed on social network pro�les.2 Moreover, many declarative surveys document the use of SNSs assources of information on applicants by employers (Clark and Roberts, 2010). As SNSs become ubiq-uitous, the use by employers of information not originally aimed at them raises ethical and economicissues. It demonstrates an increasing overlap of the professional and private spheres which could havea impact on the functioning and e¢ ciency of the labor market. In this context, this study contributesto the debate on privacy regulation and addresses the following question: Do online SNSs constitutea reliable new source of information on applicants for recruiters? In other words, do recruiters screenapplicants�SNS pro�les and use this information in deciding to grant or deny an interview?
The hiring process is the central labor market mechanism and is crucial for the e¢ ciency ofthe economy. The better the match between an employer and an applicant, the higher will be theemployee�s productivity (Autor, 2001). However, the economic literature shows that hiring is plaguedby search costs and incomplete bilateral information between employers and applicants (Stigler, 1962;Spence, 1973). As a consequence, both players implement search and signaling strategies to �nd thebest match (Rees, 1966; Salop, 1973a, 1973b; Spence, 1973; Holzer, 1987). Although there is a largeliterature on applicants�search and signaling strategies (Mortensen and Pissarides, 1999a), work onthe similar strategies of employers is scarcer (Granovetter, 1995; DeVaro, 2008; Oyer and Schae¤er,2011). Employers play a central role in the functioning of the labor market and the job matchingprocess since applicants accept almost all job o¤ers (Barron et al., 1997). The literature on employersdeals mainly with two types of employer search strategies: extensive vs. intensive, and sequentialvs. non-sequential screening (Holzer, 1987; Barron et al., 1997). These search strategies could beimplemented using formal or informal search methods (Rees, 1966; Albrecht and van Ours, 2006; vanOmmeren and Russo, 2014). These two methods are associated with two main sources of informationfor recruiters: the formal application material (resume, cover letter, etc.), and the informal referralsand word-of-mouth. A recent trend in work on employers� search strategies investigates the use ofSNSs in hiring (Clark and Roberts, 2010; Acquisti and Fong, 2013). Our paper aims to extend thework on employers�search strategies, and to focus more speci�cally on SNSs as a reliable new channelof information on applicants during hiring, in addition to application material and referrals.
So far, evidence on the use of SNSs by employers relies on declarative surveys whose results showstrong variation (see Clark and Roberts (2010) for examples). These variations could stem in partfrom the qualitative nature of these surveys (Bertrand and Mullainathan, 2001) and in part from thefact that using personal information during hiring is illegal, meaning respondents might be reluctantto truthfully answer questions about their hiring practices. To avoid declarative bias, we opt for a �eldexperiment methodology3 and create two �ctitious applicants with identical resumes and applicationcover letters but one di¤erence in their Facebook pro�les. While the control applicant has a typicallyFrench pro�le, the test applicant�s Facebook pro�le reveals Marrakesh to be his hometown and Arabica spoken language. This signal appears only on the Facebook pro�le. We chose this signal because theliterature on labor market discrimination shows that this characteristic negatively a¤ects an applicant�scall-back rate (Bertrand and Mullainathan (2004) for the U.S.; Duguet et al. 2005, 2010; Jacquemetet al., 2012 for France). Each applicant has a unique �rst-name and last-name combination to ensurethat an employer searching the applicant on the Internet �nds the right pro�le. The applicants��rstnames were chosen from among the most frequent French-sounding names for males of the applicants�age. Our candidates then apply for job openings for an accountant in the greater Paris area. Inthe usual testing methodology, two applications for a job opening are sent simultaneously and theresumes and cover letters of the two �ctitious applicants are su¢ ciently di¤erent to avoid detection
2Some examples of employees� dismissals related to SNSs and reported in the New York Times:http://www.nytimes.com/2013/01/22/technology/employers-social-media-policies-come-under-regulatory-scrutiny.html?pagewanted=all, or BBC: http://www.bbc.com/capital/story/20130626-can-social-media-get-you-�red
3 Independently, Acquisti and Fong (2013) set up an experiment in the U.S. to test for several potentially discrimi-nating signals on SNSs such as sexual orientation or marital status.
2
by the employer (this approach is called systematic attribution). In our case, the two applicants haveidentical resumes and cover letters and di¤er only in their name for identi�cation, and their Facebookpro�le for treatment manipulation. Therefore, we send one application per job opening using thepseudo-random attribution method (see Ahmed et al., 2013; Acquisti and Fong, 2013). With thismethod, we control during the experiment that the two �ctitious candidates are applying for similarjob positions. Following the literature on hiring, we consider a call-back from the recruiter to set upa job interview as a positive outcome. Since the two applicants are similar except for the Facebookpro�le displaying their hometown and languages spoken, a signi�cant di¤erence in call-back rate canstem only from observation by the employer of the signal that is available exclusively on the applicants�Facebook pro�les.4
From March 2012 to March 2013, we sent more than 800 applications, evenly divided betweenthe two applicants. The response rates for our �ctitious applicants are signi�cantly di¤erent, atrespectively 12.2% and 16.9% for the control candidate. This suggests that employers search foradditional information on the applicant to the application package submitted by e-mail, and use theinformation found on the Facebook pro�le to select an applicant for a job interview. In additionto this �rst result, during the experiment we observed an exogenous change in the layout of theFacebook pro�le. Information on the languages spoken by the applicant, instead of being displayedin the front page of the pro�le was pushed back into a tab. This change provided evidence on thedepth of employers�search for personal information. Shortly after this layout change, which reducedthe di¤erentiating signal, the gap between the callback rates of two candidates reduced dramatically,suggesting that the search for further information on the candidate is not deep and that employerslimit it to the front page of the online social network pro�le.
This article is organized as follows. The �rst section reviews the job search literature with a specialfocus on employer�s strategies, and presents our main hypothesis. The second section presents the�eld experiment and our protocol and the third presents the results of the �eld experiment. The �nalsection o¤ers some conclusions.
2 Literature review
The hiring process is usually characterized with search costs and bilateral information asymmetries(Stigler, 1962; Spence, 1973; Salop and Salop, 1976). In this context, applicants and recruiters aim atreducing these costs and asymmetries by implementing signalling and/or search strategies, reinforcingthe importance of information. These strategies have been extensively studied in the case of jobseekers.5 In contrast, employers� strategies have been far less explored despite their importance inthe hiring process. In this article, we focus on employers�search strategies, and especially on theirevolutions with the Internet.6
The literature on recruiters highlights the use of two main search strategies: extensive/intensiveand sequential/non�sequential, depending on the number of screened applicants and whether theselection process is carried out continuously or sequentially (Rees, 1966; Barron et al., 1985). Thesestrategies could be implemented through formal or informal search methods (Rees, 1966, Albrecht and
4The main di¢ culty involved in testing our hypothesis is that the recruiter�s online search is not an observablevariable, i.e. it is impossible to know who are the viewers of a given online pro�le. For this reason, we set up anexperiment so that viewing one or the other of our �ctitious pro�les translates into di¤erent call back rates, whichare directly observable. Incidentally, this also explains why legal attempts to forbid online searches during hiring aredi¢ cult to implement: recruiters�behaviors are not directly observable.
5The literature on applicants�job search and signaling is large and beyond the scope of this article (see Lazear andOyer (2007) for a good review). For theoretical approaches, see Stigler, 1962; Salop, 1973a, 1973b; Spence, 1973; forempirical evidence, see Stigler, 1962; Rees, 1966; Holzer, 1987.
6For the literature on employers�signaling strategies see Salop and Salop (1976), and Guasch and Weiss (1980) fortheoretical models. For empirical work, one can refer to Holzer (1987) and Albrecht and van Ours (2006).
3
van Ours, 2006; van Ommeren and Russo, 2014). Formal method refers to the use of advertisementsin newspaper or employment agency, whereas informal method draws on recruiters social network.These search methods imply that recruiters use two di¤erent support/channel of information aboutapplicants with application materials in the case of formal method (Rees, 1966), and referrals andword-of-mouth for informal methods (Granovetter, 1995). More recently, the spread of the Internetand development of online social networks has had a strong impact on employers� strategies andpotentially provides a new channel of transmission of information via online pro�les on SNSs.
Employers�search strategiesThe literature on the employers�search strategies during hiring is more recent and rather scarce
(Granovetter, 1995; DeVaro, 2008; Oyer and Schae¤er, 2011).7 According to this literature, employerscan choose between extensive search, i.e. search on a pool of applicants as large as possible, and/orintensive search, i.e. search for additional information on selected applicants (Rees, 1966; Barron etal., 1985; Holzer, 1987). Barron et al. (1985) use data such as average number of hours per applicantfor recruiting, to provide evidence of the existence of such strategies. More recent work highlightsan important feature of these search strategies, i.e. whether or not search is sequential. The modelproposed by Burdett and Cunningham (1998) considers search to be sequential if the �rm o¤ers ajob position to an applicant immediately after receipt of her application and assuming the applicant�sproductivity exceeds a certain threshold. If the applicant accepts the position the search processstops. Conversely, non-sequential search assumes that the �rm pools a certain number of applicationsand then screens them, and �nally o¤ers the position to the best applicant. Empirical studies usingvacancy characteristics (required education, work experience, etc.), investigate the determinants ofsearch strategies. They show that both extensive and intensive strategies can be optimal dependingon characteristics such as job seekers� strategies, vacancy duration, job characteristics, etc. (vanOmmeren and Russo, 2014). However, in most of these studies, the nature of the dependent variable,namely vacancy duration, makes interpretation of the results di¢ cult. Andrews et al. (2008) pointout that a short (long) vacancy duration cannot be exactly interpreted as a sequential (non-sequential)search strategy. According to van Ommeren and Russo (2014), empirical studies highlight a strongrelationship between search strategies (sequential or non sequential) and search methods (advertising,private or public agency, etc.).
Employers�search methods and channels of transmission of informationThese search strategies could be implemented using formal or informal search methods (Rees, 1966;
Albrecht and van Ours, 2006; van Ommeren and Russo, 2014). Formal search methods refer to the useby recruiters of advertisements and employment agency to �ll a position. Informal search methodsrely on information gathered or received by recruiters from their social network (friends, relatives,current or incumbent personnel, etc.). In the case of formal methods, the information consists inthe application material (resume, cover letter, etc.) directly or indirectly (via e.g. employmentagency) provided by the applicant (Rees, 1966). In the informal method, recruiters gather or receiveinformation through referrals and word-of-mouth from friends, relatives or former/current employees(Albrecht and van Ours, 2006). In other words, each type of method is associated with a particularchannel of information.
Formal information channels include the basic application material screened by employers to selectapplicants, i.e. cover letters and resumes. The information provided consists mainly of objectivelyveri�able information such as education, work experience, quali�cations, etc. Employers can screenthese documents and contact previous employers and/or school heads. During interview, if requiredfor the position advertised, the employer may have the opportunity to carry out additional checkssuch as medical examination, credit worthiness, police record, etc. (Rees, 1966; Spence, 1973; Holzer,1987; DeVaro, 2008).
7See Mortensen and Pissarides (1999a, 1999b) and Rogerson et al. (2005) for surveys dealing with search models forapplicants in the labor market.
4
Informal information channels include information acquired from former colleagues and/or friendsof the applicant through referrals and word-of-mouth (Rees, 1966; Granovetter, 1995; Montgomery,1992, Albrecht and van Ours, 2006; van Ommeren and Russo, 2008). According to Rees (1966),former or current good employees are considered by employers as reliable channels of informationabout potential recruits for two main reasons. First, employers anticipate that employees tend torecommend candidates with similar competences and location. Second, employees know that theirreferrals can impact their own reputation. As a result they tend to recommend people who they thinkwill be most appropriate. Furthermore, applicants who have been recommended for a position by afriend or a relative tend to be more con�dent in the information provided about the position (typeof work, working atmosphere, boss�s behaviors, etc.). Consequently, such applicants are more able toassess whether their competences are a good �t with the position. The empirical literature underlinesthe complex e¤ects of informal contacts and networks on labor outcomes due to individual, relationaland employer heterogeneity (see Ionnides and Loury (2004) for a review). Since the work of Rees (1966)and Granovetter (1995), many studies highlight the importance of referrals and recommendations inhiring. More recent studies using newly available data (DeVaro, 2008) show that informal channels ofinformation matter as they carry reliable information that could only with di¢ culty spread throughformal channels.
SNSs as a new source of information for recruiters?The labor market is being heavily impacted by the advance of the Internet. Employers bene�t
from lower costs for advertising job openings and applicants face lower costs in searching for relevantjob openings and sending applications. Overall, lower costs are expected to increase the e¢ ciency ofthe labor market by improving the quality of employee-employer matching (Autor, 2001; Manning,2011).8 However, Autor (2001) points out that the ease of application for job seekers can result inexcessive irrelevant applications which may increase employers�cost of selection. As a consequenceof the overload of formal and standardized application information, employers may turn to informalinformation on applicants to narrow their search.
In addition to easier access to formal information on applicants, the Internet also provides newsources of information on applicants: their SNSs pro�les. The wide use of SNSs is making it easy foremployers to check background information about applicant (schools, current and former positions,etc.), but also to access personal information not dedicated to them (trips, friends, hobbies, opinions,etc.). In this way, SNSs constitute a new informal source of information in addition to referrals andword-of-mouth. Unlike these sources of information, interaction with others is not required in the caseof SNSs. Recruiters can check online pro�les without the applicant�s awareness or consent. Evidenceof such practices among recruiters has been recently underlined in the literature through declarativesurveys (Clark and Roberts, 2010) or �eld experiment on online discrimination (Acquisti and Fong,2013). This privacy concern raises ethical and economic issues.
Most notably, there is an important discrepancy between the intent of SNSs users and that ofemployers. The former tend to use SNSs casually as a tool for social interaction, including recre-ational purposes, while the latter use them to gather personal information on applicants with directprofessional consequences. This di¤erence in the use of personal information may harm the qualityof the relationship between employers and employees (Clark and Roberts, 2010). Incidentally, thisnew hiring practice is an illustration of the shifting boundaries between the personal and professionalspheres. On an economic viewpoint, personal information disclosed online may constitute a relevantdeterminant of hiring decision. Apart from Acquisti and Fong (2013) for the U.S. labor market, howsecondary usage of personal information impacts matching during hiring has been neglected in theliterature. Following this recent strand, our paper tests whether SNSs has become a new reliableinformal source of information for recruiters on applicants (see Figure 1).
8See Pissarides (2000), and, Petrongolo and Pissarides (2001) for a canonical model that introduces the matchingfunction but does not deal explicitly with the e¤ect of the Internet on the labor market.
5
Figure 1: Sources of information about applicants
3 Experimental setting: Methodology and signal
MethodologyThe most direct way to establish use of social media in hiring is asking employers. However, there
is a strong declarative bias due to the legal/ethical nature of the question. To circumvent this, we setup a �eld experiment.
Field experiments have been used in the literature to capture employers�hiring practices. Theyrely upon two main methodologies: situation (or audit) testing,9 and correspondence testing. Theaudit approach allows to focus on employers�hiring behaviors along the multiple steps of the hiringprocess, i.e. i) whether they recall the candidate for an interview, ii) whether they o¤er the positionafter the interview, and iii) the wage level o¤ered. The �rst audit testing was conducted by Daniel(1968).10 One of the limitations of this approach is that it is di¢ cult in practice to ensure similarityof applicants�performance during a face-to-face interview. Moreover, the actor�s direct interactionwith the employer during the interview raises strong concerns of experimenter bias (see Bertrand andMullainathan 2004 for further discussion).
Correspondence testing involves fewer methodological issues (Riach and Rich, 2002). It allowsfor a higher level of control over the experimental environment, especially the content of applica-tions. It is also less time-consuming (Bursell, 2007), and easier to rigorously reproduce. According toBursell (2007), correspondence testing is a type of randomized experiment,11and therefore providesthe strongest possible opportunity to draw causal inferences. The main di¢ culty lies in making theapplications similar in all relevant aspects, so that only the tested characteristic varies between thetwo applications. Last, although correspondence testing reveals discrimination at the call-back stageand not at the �nal hiring decision stage, it has been shown that around 90% of the discriminationoccurs at the call-back stage (Riach and Rich, 2002).
Therefore, we choose to carry out a correspondence test. However, unlike usual correspondencetests where recruiters receive at least two �ctitious applications, we send one application per job
9Audit testing consists in real persons briefed by the experimenters, usually professional actors, applying for theopening and presenting themselves to the job interview. They then act in a similar manner for every interview. Thecharacteristics of the actors or the way they behave during the interview can thus be manipulated all other things equal.10See Bursell (2007) for other labor market-related audits results and limitations.11Examples of correspondence tests: in the UK (Brown and Gay, 1985; Hubbuck and Carter, 1980), in Australia
(Riach and Rich, 1991) and in the U.S. (Bertrand and Mullainathan, 2004).
6
opening with quasi-identical applicants. We created two �ctitious applicants with identical applicationmaterial (resumes and cover letters) except for one manipulated characteristic or signal. This approachhas two main advantages. First, the two applicants are identical in term of competence and experiencewhich drastically limits potential compounds. Second, as a consequence, each recruiter receives onlyone application. This means that the study only marginally in�uences the hiring process (comparedto sending multiple applications per opening) which is desirable from an ethical view point and interms of e¢ ciency. Third, as the applications are sent to two separate samples of �rms, the detectionrisk is non-existent. We therefore need to insure that the two applicants apply for similar positionsin terms of job and �rm characteristics. We do this by using job openings from the French publicemployment agency that provide detailed information on both the position and the �rm. This pointis developed in the following protocol description.
SignalIn our experiment, the di¤erence between the two applicants consists in an Arabic signal on one
applicant�s Facebook pro�le. The Arabic pro�le mentions that the applicant is from a Moroccan city(Marrakesh), and speaks Arabic. The control pro�le is from a French city (Brive-la-Gaillarde) andspeaks Italian. We thus di¤erentiate our applicants by city of origin and language spoken as displayedon the Facebook pro�le.The literature highlights the importance of an applicant�s foreign origins (see e.g. Duguet et al.,
2010 for applicants from the Paris area) and language skills for potential employers during hiring(Oreopoulos, 2009; Edo et al., 2013). Therefore, provided the signal is perceived, it can be expectedto have a negative impact on the odds of being called back.The literature shows that, within the application package, information triggering employer rejection
can be conveyed by the applicant�s name, especially her foreign origin (Bertrand and Mullainathan,2004; Ahmed et al., 2008; Jacquemet and Yannelis, 2012; Berson, 2012; Duguet et al., 2010), or part-ner�s gender (Ahmed et al., 2013) which signals the candidate�s sexual orientation, doing voluntarywork for a community organization (Weichselbaumer, 2003; Drydakis, 2009), or the photograph at-tached to the resume (Weichselbaumer, 2003). However, manipulating those signals is not a suitablestrategy in our case since information on names and hobbies is included in the resume and could notbe evidence that the employer consulted the online pro�le.
Ahmed and Hammarstedt (2008) use the Internet as a medium to test for discriminatory practicesrelated to rental housing ads posted online. However, as in every preceding study, the discriminatinginformation is contained in the application package. In our study, the application is completelysimilar for the two �ctitious candidates, and the Internet is the medium for both transmission of theapplication (by the candidate) and discovery of discriminating information (by the recruiter).
Resumes, cover letters and Facebook pro�lesFor each applicant, on both the resume and the cover letter we indicate the following information,
in order: name, address, holding of a driving license, date of birth and age, phone number and e-mail address. The applicant�s address is in an a uent Paris district (15th arrondissement) to avoidlocation-based discrimination. The applicant holds a driving license. The phone numbers are distinctin each resume so as to track candidates�call back. The e-mail address of each applicant is registeredon Gmail with user name following the same pattern "�[email protected]". Names anddates of birth are also available on the Facebook pro�les.
In our base resume, the applicant has a three-year higher education degree in accounting, a �awlessschool record, and three internships with various experience suitable for most accounting jobs. Acover letter is included in the application. A cover letter that is too general and standardized isusually not su¢ cient; employers usually seek a speci�c professional pro�le (customers, suppliers, assetmanagement, etc.). We pre-de�ned parts of the letter with standard sentences corresponding to thecommon pro�les sought by recruiters, and included them according to what was speci�ed in the ad.
7
We used information on the recruiting �rm that was available on the Internet, such as o¢ cial websites,web articles, etc. If we were unable to �nd information about the �rm, we sent an unspeci�c coverletters. Resumes and cover letters were submitted as pdf �les. Pdf is a standard format that is easilyreadable by recruiters. Before the start of the experiment and alongside conducting pre-tests, weinterviewed human resources managers to ensure relevance of the cover letters to current job marketconditions.
The �rst and last names of each applicant are French-sounding. The �rst names were picked fromthe top-�ve �rst names for the year of birth. Each combination of �rst name and last name is unique,and our �ctitious pro�les are the sole results when searching on these �rst and last names on the threeleading French language web search engines, and on Facebook.12 Each combination corresponds toone unique Facebook pro�le. To test that the results do not depend on the speci�c names or workexperience of the �rst pair, we create a second pair of applicants with di¤erent names and with fewerwork experience.
Work experienceTime Span First name & Name Candidate�s type at the beginning
of the experimentMarch 2012 Thomas Marvaux Control (French signal) 6.5 to 13 months- Sept. 2012 Stéphane Marcueil Test (Morrocan signal)Oct. 2012 Julien Bautrant Control (French signal) 1 to 6.5 months- March 2013 Nicolas Lautrant Test (Morrocan signal)
Table 1: The two pairs of applicants
Selecting the job openingsWe selected the job openings published by the French public agency for employment, Pôle Emploi
(PE), during the period March, 2012 to March, 2013. Only job openings posted through the PE publicagency website are collected; other recruitment channels, such as Monster, are not considered. Wefocus on PE openings for two main reasons: First, PE systematically provides detailed informationon the job (wage, contract, working hours, required education and work experience, etc.) and the�rm (name, location, sector, size, etc.) which is crucial for pseudo-random attribution of applicantsto job o¤ers. Other popular French employment websites (Monster, Keljob, Indeed, etc.) providemuch less detail except in the case of a few job ads. Second, since PE is the public employmentagency it has a transparent equal opportunities policy and discriminatory employers will likely avoidposting their openings on the PE website. Auto-selection of employers using this recruitment channelis thus likely to make it more di¢ cult to �nd a signi�cant di¤erence between the two candidates.The applications are submitted via a standard email referring to the advertised position and thereference number, with the resume and cover letter as attachments.13 We selected only openings thatprovided the recruiter�s direct contact information (contact name and e-mail), and excluded thosewhich required the applicant to contact a third-party, usually PE or a recruitment agency. Onlyopenings for relatively long-term contracts were considered, i.e. jobs with an unde�ned-duration workcontract (CDI) or a �xed-duration contract (CDD) of 6 months or more.14 Our applicants havethree years of undergraduate education in accounting, and we responded to ads in the three relevantcategories (accountant, assistant-accountant, and aid-accountant) in the PE categorization. For eachselected opening, we generate the application material, i.e. the resume and the cover letter, using
12The market shares of the web search engines in France in December 2012 were: 90.1% for Google, 3.3% for Bingand 1.5% for Yahoo (source: http://www.atinternet.com, last retrieved: June, 2014).13A few ads were disregarded either because the e-mail address provided in the ad was wrong or no email address
was included.14We assume that very short employment periods are not associated with deep search or screening of applicants.
8
pre-de�ned key sentences to match advertised job. At this point, to avoid experimenter bias, thematerial was not assigned to an applicant. Assignment to an applicant occurred only after all theapplication material had been generated.
Pseudo-Random Assignment ProcedureWe observe the recruiters�behavior through the di¤erences (if any) in return rates for the two
�ctitious applicants. The candidates have identical application packages and di¤er only in selectedinformation on their Facebook pro�les. Following Ahmed et al. (2013) and Acquisti and Fong (2013),we use a pseudo-random assignment procedure where only one application is sent per job o¤er. Thetype of applicant is pseudo-randomly assigned to each application, so that all along the experimentsimilar job o¤ers are attributed to each applicant.15 Half of our sample of job openings receives anapplication from the control candidate and the other half from the Arabic candidates. The tradi-tional systematic assignment procedure provides information on how a given employer responds toevery candidate who applied. However, we are interested in showing that employers that receivedan application from the control candidate called him back for interview more often, on average, thanemployers who received the Arabic candidate. We control that this systematic di¤erence is not dueto �rm or job characteristics. In addition, when using a testing approach the experimenter needs toconstruct two �ctitious candidates who are su¢ ciently di¤erent to avoid detection but close enoughthat the di¤erence in call backs between the two candidates can be attributable only to the factor ofinterest, and not to other factors which were changed to di¤erentiate the two candidates. The randomassignment procedure requires that the number of applications is doubled but completely alleviatesthe trade-o¤ between the risk of candidates being detected and the ability to interpret the results. Asour candidates never both apply to the same company, the risk of detection is considerably lower thanwith a usual testing methodology. And since we do not need to di¤erentiate the candidates arti�ciallyto avoid detection, we can o¤er strictly identical candidates.
4 Results
Experiment overviewThe experiment covers a period of one year from March 19, 2012 to March 19, 2013. During
this period, we sent a total of 837 applications. As shown in Figure 2, we sent applications for bothcandidates at similar rates over the period. The vertical red line indicates the time when we changedto the second pair of �ctitious applicants (names, work experience and Facebook pro�les), as discussedin the previous section.
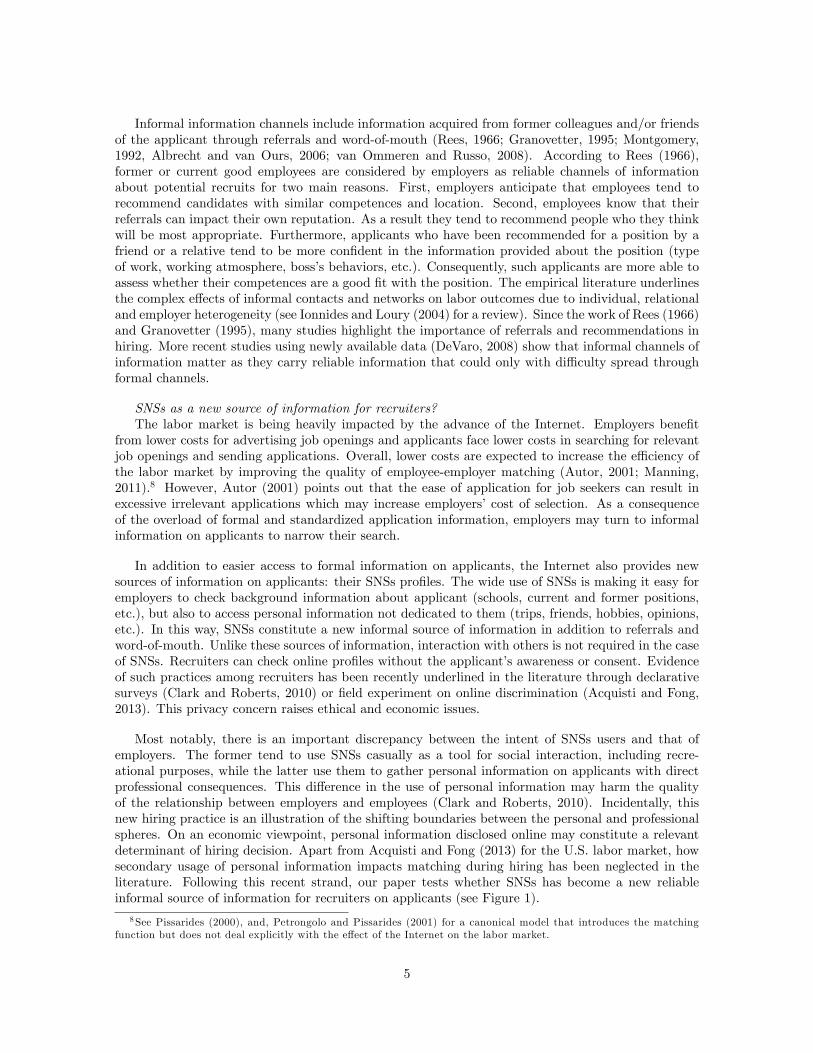
Samples balancing Since we send one application per opening, our database is divided into twosamples, �rms that received the control candidate and �rms that received the test candidate. Weensured that the two samples were balanced in relation to �rms�observable characteristics by usingpseudo-random sampling. Table 2 below presents the descriptive statistics for the job positions and�rms applied to.16
We observe that, on average, both applicants applied to similar positions in terms of jobs and �rmcharacteristics. During the whole experiment our applicants received 122 positive recalls for interview.This global return rate is quite high (14.6%) compared to other similar studies (see e.g. Duguet andPetit, 2005 and Duguet et al., 2010 for the Paris region). The most plausible explanation for the highercall back rate in our study is that we matched cover letter and resume to the job opening for eachapplication, incorporating pre-de�ned sentences corresponding to the characteristics of the �rm and
15This pseudo-random assignment is based on job position (accountant, assistant-accountant, etc.), required workexperience, and �rm size and sector (see Table 2 for descriptive statistics).16Tests of equality of mean or proportion (depending on the type of variable) have been computed. These tests allow
us to accept the null hypothesis of equality in proportion or mean at the 5% threshold for all variables in Table 2.
Firm status Public: 6.0% 5.0%Not-for-pro�t: 11.4% 13.0%
Sector See Annex 1 - - - -Location See Annex 1 - - - -Total number of applications 420 417
Table 2: Overall descriptive statistics of the applications
10
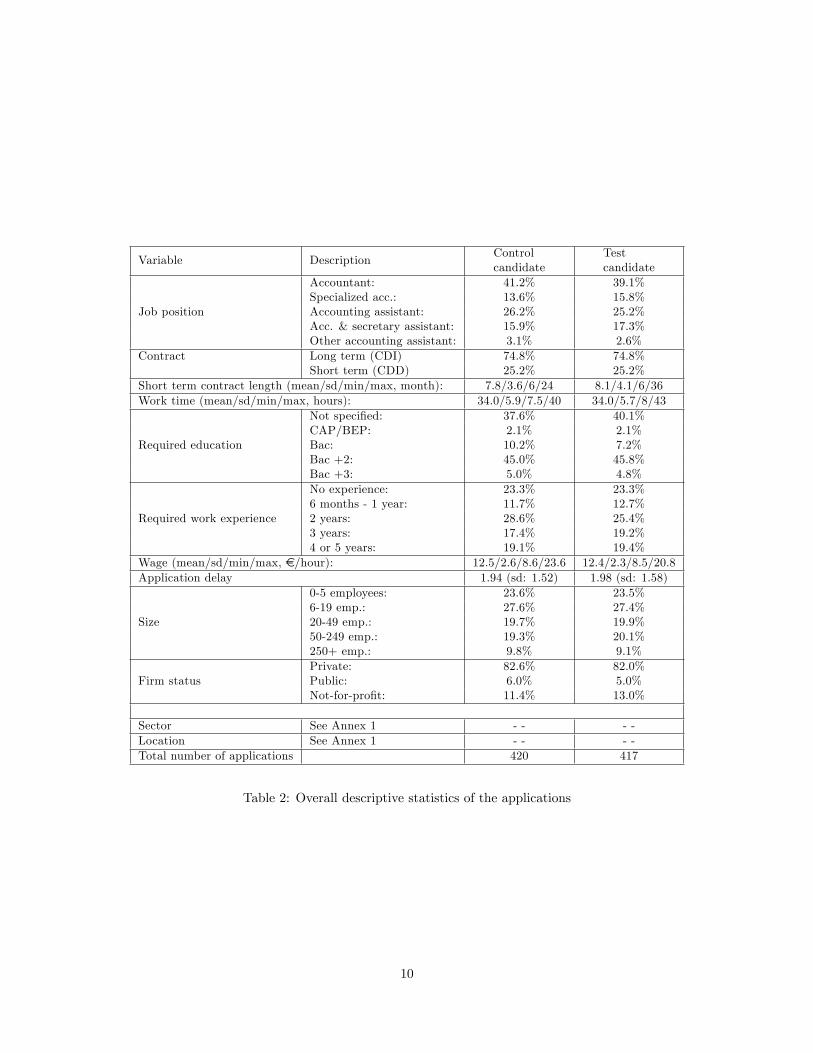
Figure 2: Cumulative number of applications sent, by type of applicant
the advertised position. Most recruiters contacted our applicants by phone (68.0%) or e-mail (26.3%).A few chose contact by both phone and e-mail (5.7%). All the applicants�postal addresses were real,but no regular mail was ever received. Table 3 shows the overall results of the �eld experiment.
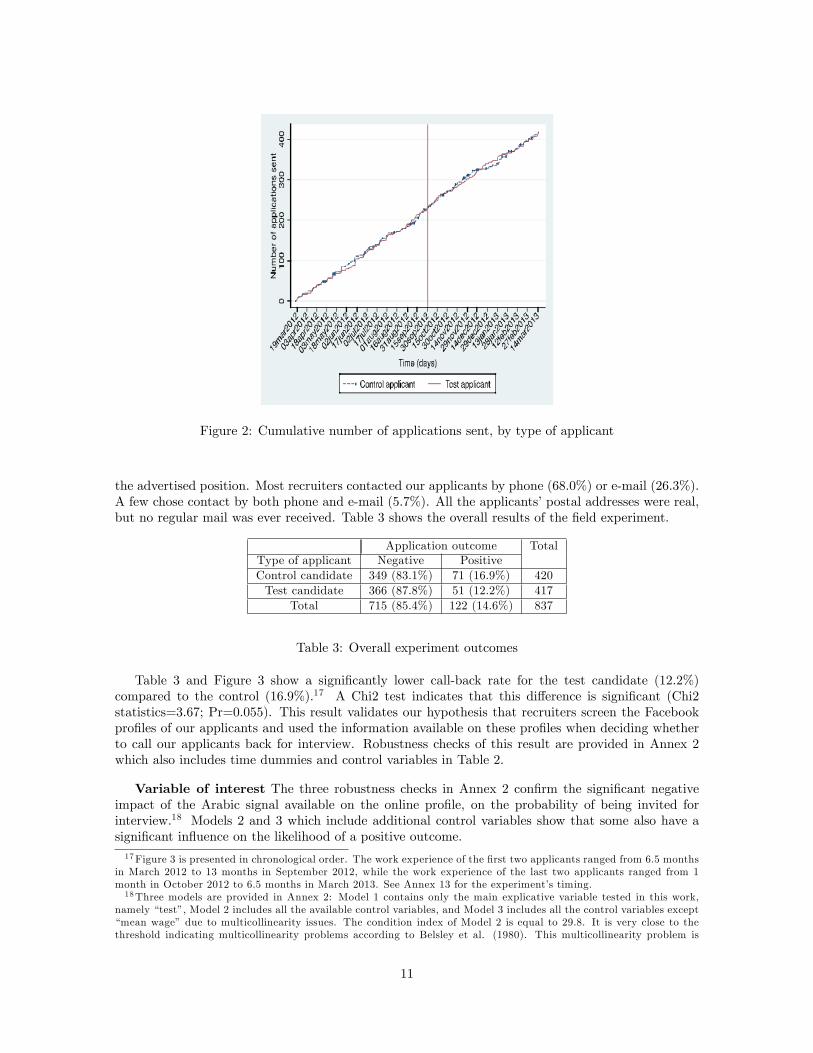
Table 3 and Figure 3 show a signi�cantly lower call-back rate for the test candidate (12.2%)compared to the control (16.9%).17 A Chi2 test indicates that this di¤erence is signi�cant (Chi2statistics=3.67; Pr=0.055). This result validates our hypothesis that recruiters screen the Facebookpro�les of our applicants and used the information available on these pro�les when deciding whetherto call our applicants back for interview. Robustness checks of this result are provided in Annex 2which also includes time dummies and control variables in Table 2.
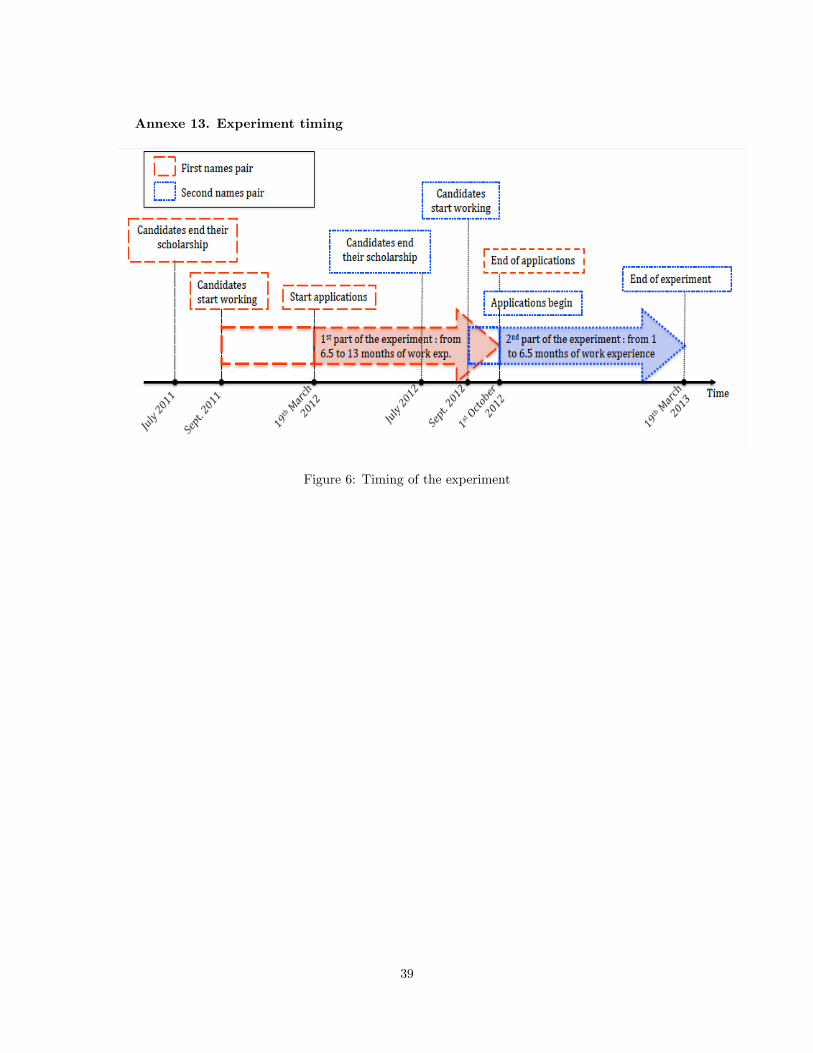
Variable of interest The three robustness checks in Annex 2 con�rm the signi�cant negativeimpact of the Arabic signal available on the online pro�le, on the probability of being invited forinterview.18 Models 2 and 3 which include additional control variables show that some also have asigni�cant in�uence on the likelihood of a positive outcome.17Figure 3 is presented in chronological order. The work experience of the �rst two applicants ranged from 6.5 months
in March 2012 to 13 months in September 2012, while the work experience of the last two applicants ranged from 1month in October 2012 to 6.5 months in March 2013. See Annex 13 for the experiment�s timing.18Three models are provided in Annex 2: Model 1 contains only the main explicative variable tested in this work,
namely �test�, Model 2 includes all the available control variables, and Model 3 includes all the control variables except�mean wage� due to multicollinearity issues. The condition index of Model 2 is equal to 29.8. It is very close to thethreshold indicating multicollinearity problems according to Belsley et al. (1980). This multicollinearity problem is
11
Control variables The control variables which turn out to be signi�cant highlight additionalresults about the hiring process generally. Firstly, we observe a negative impact of over-education onthe probability of being selected. Secondly, during the experiment the applicants�work experienceranged from 1 to 13 months. It appears that only a large di¤erence between applicant�s current workexperience and that required by recruiters is an impediment. Only four or �ve years of experiencedi¤erent from what the recruiter requires seems to negatively a¤ect the odds of call-back. Thirdly,we noticed a negative non-linear e¤ect of distance from the job. Close commuting distances (30-90minutes) have a negative in�uence on the probability to be selected, but longer distances (over 90minutes) and shorter (under 30 minutes) have no signi�cant impact, suggesting that employers wouldexpect the successful applicant to relocate closer rather than endure a long commute (van Ommerenet al., 1999). Finally, only three sectors have signi�cant e¤ects, namely industry, teaching/research,and hotel/restaurant. One possible explanation for this is that although we designed the applicants�resumes to �t as many industries as possible, they do not �t all activities. The activities of teaching andresearch use very speci�c public accounting beyond the scope of our applicants�skills and education.
Exogenous layout change On December, 2012 Facebook changed the layout of its pro�les,19
from a single page to a front page which includes tabs to provide access to certain personal information.Such personal information, which used to be directly available in the �rst page of the pro�le, is nowavailable only if viewers click on the relevant tab. Speci�cally, the new pro�les provide information oncity of origin on the front page but information on language(s) is accessed by clicking the �About�tab.Other aspects of the experimental setting remained unchanged. Comparing the results before andafter the layout modi�cation allows us to isolate the impact, if any, of this ergonomic change on theeconomic outcome. The period from March, 2012 to December, 2012 allows us to establish our mainresult: a Facebook pro�le provides recruiters with a reliable source of information on applicants.20
The second period from December, 2012 to March, 2013 provides some evidence about the depthof the screening performed by recruiters within the online pro�les. We discuss the results of theseconsecutive parts of the experiment below.
Note: The second pair of applicants graduated in September 2012 and therefore have less workexperience. See table and �gure in Annex 13 for the details of the di¤erences between the two pairsof applicants.
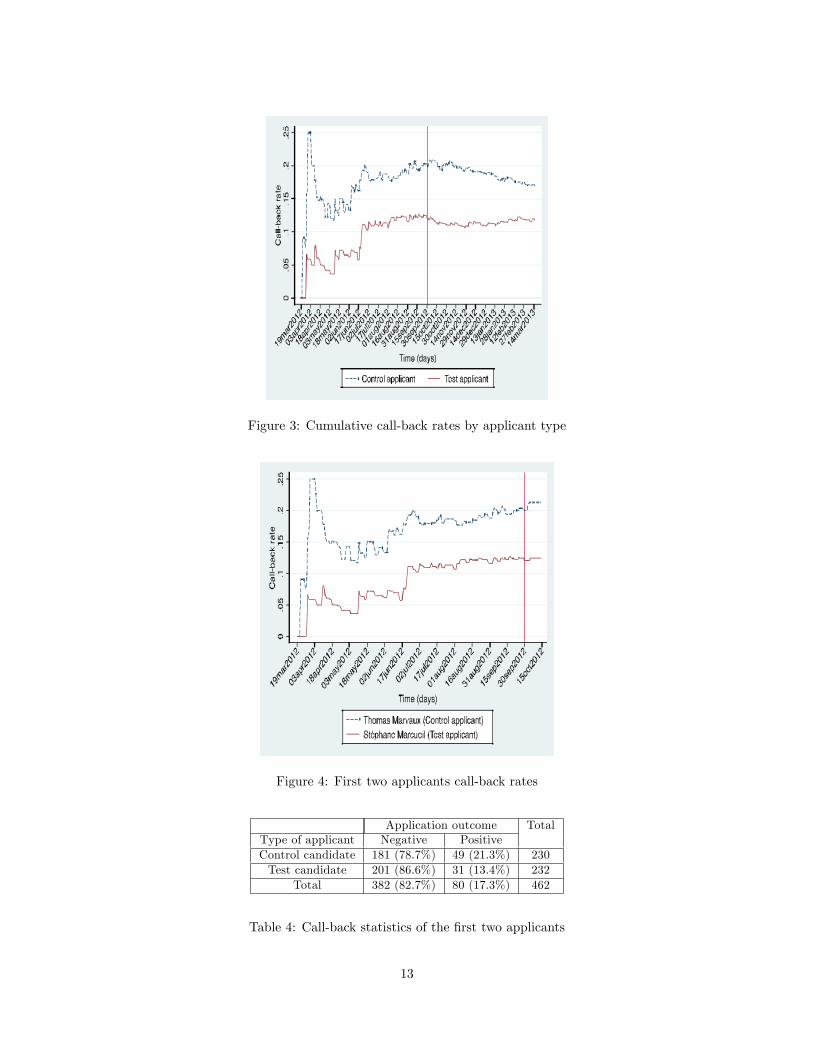
First part of the experimentThe �rst two applicants were used during the 6.5 months from March 19, 2012 to September 30,
2012. The two applicants have work experience ranging from 6.5 months at the beginning of this partto 13 months at the end (see Annex 13 for more details on the experiment timing). During this periodwe sent a total of 462 applications. Table 4 and Figure 4 below summarize the results during this �rstperiod:
not surprising as the wage o¤ered is related to the required education level and to other job characteristics such as therequired experience, the sector, the job position and the �rm size among others. Once we exclude �mean wage� in themodel 3, the condition index fall down to 20.4.19Link to the o¢ cial announcement of the Facebook layout change: http://newsroom.fb.com/News/584/
Improvements-to-Timeline].Link to Facebook�s announcement of the layout change in December on ABC News: http://abcnews.go.
com/blogs/technology/2012/12/facebook-may-be-changing-your-timeline-redesign-tests-in-progress/#.UNOU516etEM.twitter and on other news, or bloggers� websites that observed this change about Decem-ber 2012: http://mashable.com/2013/01/08/facebook-timeline-change-new/ ; http://socialmediatoday.com/mohammed-anzil/1100946/facebook-way-change-your-timeline-again ; http://news.cnet.com/8301-1023_3-57543175-93/facebook-looking-into-a-slimmer-trimmer-timeline-layout/ ; http://www.insidefacebook.com/2012/10/31/facebook-tests-timeline-layout-with-single-column-of-posts/ and http://www.marismith.com/quick-guide-facebook-profile-layout-image/.20 In the �rst 8 months, the control applicant received 62 positive call-backs from 311 applicants (19.9%); the test
applicant was recalled 36 times from 302 applications (11.9%), i.e. Chi2 = 7.33; Pr = 0.007.
12
Figure 3: Cumulative call-back rates by applicant type
Table 4: Call-back statistics of the �rst two applicants
13
The �rst part of the experiment shows a consistent gap in the number of call-backs received byour two applicants. In particular, Figure 4 shows a roughly constant gap of 8 percentage pointsbetween the two applicants in favor of the control candidate who received 21.3% of positive returnscompared to 13.4% for the test candidate. A Chi2 test con�rms the signi�cance of this di¤erence(Chi2 statistics=5.09; Pr=0.024).21
Based on the experimental protocol in place, this gap favoring the control candidate can result onlyfrom two joint choices of employers: i) screening of applicants�Facebook pro�les, and ii) exploitationof the information collected from these pro�les to decide whether or not to recall the candidate.Incidentally, the fact that employers use the information obtained from Facebook suggests also that itis considered reliable although not part of the formal application package. It appears that the contentof the online pro�le seems to carry important weight for the decision to call back.
Second part of the experimentThe second pair of �ctitious applicants was used during 5.5 months from October 1, 2012 to March
19, 2013. In this case, the two applicants�work experience ranged from 1 month at the beginning ofthis part to 6.5 months at the end. During this period we sent a total of 375 applications. Table 5and Figure 5 summarize the results of this second part:
Figure 5: Call back rates for second two applicants
Table 5: Call-back statistics of the second two applicants
21 Information on the similarity of the applications during this period and additional robustness checks for this resultare available respectively in Annexes 3, 4 and 5.
14
Table 5 and Figure 5 show that both applicants had similar call-back rates (11.6% and 10.8%) atthe end of the second part of the experiment. These callback rates are lower than those in the �rstpart of the experiment, which was expected since the applicants have shorter work experience. Thetwo call-back rates are not signi�cantly di¤erent (Chi2 statistics=0.05; Pr=0.81), which leads us toconclude that our two applicants are no longer di¤erent from the recruiters�point of view.
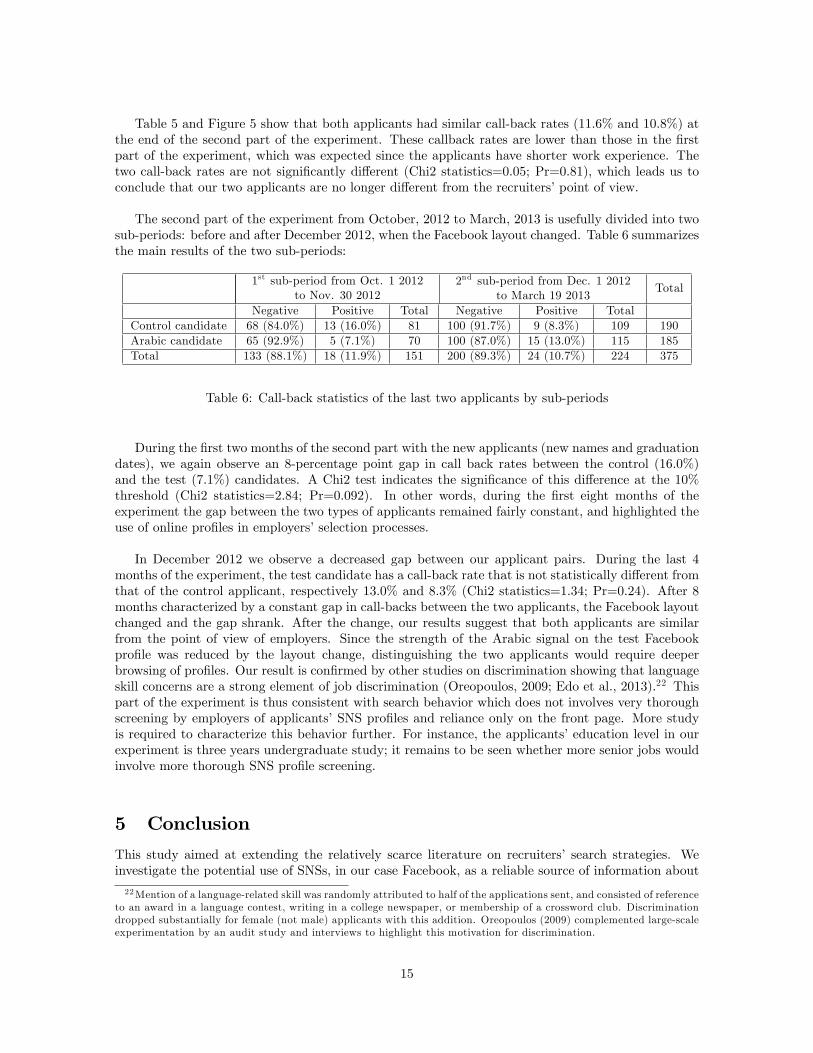
The second part of the experiment from October, 2012 to March, 2013 is usefully divided into twosub-periods: before and after December 2012, when the Facebook layout changed. Table 6 summarizesthe main results of the two sub-periods:
Table 6: Call-back statistics of the last two applicants by sub-periods
During the �rst two months of the second part with the new applicants (new names and graduationdates), we again observe an 8-percentage point gap in call back rates between the control (16.0%)and the test (7.1%) candidates. A Chi2 test indicates the signi�cance of this di¤erence at the 10%threshold (Chi2 statistics=2.84; Pr=0.092). In other words, during the �rst eight months of theexperiment the gap between the two types of applicants remained fairly constant, and highlighted theuse of online pro�les in employers�selection processes.
In December 2012 we observe a decreased gap between our applicant pairs. During the last 4months of the experiment, the test candidate has a call-back rate that is not statistically di¤erent fromthat of the control applicant, respectively 13.0% and 8.3% (Chi2 statistics=1.34; Pr=0.24). After 8months characterized by a constant gap in call-backs between the two applicants, the Facebook layoutchanged and the gap shrank. After the change, our results suggest that both applicants are similarfrom the point of view of employers. Since the strength of the Arabic signal on the test Facebookpro�le was reduced by the layout change, distinguishing the two applicants would require deeperbrowsing of pro�les. Our result is con�rmed by other studies on discrimination showing that languageskill concerns are a strong element of job discrimination (Oreopoulos, 2009; Edo et al., 2013).22 Thispart of the experiment is thus consistent with search behavior which does not involves very thoroughscreening by employers of applicants�SNS pro�les and reliance only on the front page. More studyis required to characterize this behavior further. For instance, the applicants�education level in ourexperiment is three years undergraduate study; it remains to be seen whether more senior jobs wouldinvolve more thorough SNS pro�le screening.
5 Conclusion
This study aimed at extending the relatively scarce literature on recruiters� search strategies. Weinvestigate the potential use of SNSs, in our case Facebook, as a reliable source of information about
22Mention of a language-related skill was randomly attributed to half of the applications sent, and consisted of referenceto an award in a language contest, writing in a college newspaper, or membership of a crossword club. Discriminationdropped substantially for female (not male) applicants with this addition. Oreopoulos (2009) complemented large-scaleexperimentation by an audit study and interviews to highlight this motivation for discrimination.
15
applicants for recruiters during hiring. So far, the literature has focused only on the usual sourcesof information on applicants (application material and referrals). Declarative surveys on the use ofSNSs in hiring are a¤ected by a strong declarative bias due to the ethical and legal issues surroundingthe collection of applicants� personal data. We therefore set up a �eld experiment, using real jobo¤ers for accountants in the greater Paris area. This experiment consisted of creating two �ctitiousapplicants that di¤ered only in their perceived origins, observable solely on their Facebook pro�le.In line with the literature on discrimination, this signal � if observed and considered reliable � isexpected to have a signi�cant negative e¤ect on the call-back rates of the test applicant compared tothe control. Conversely, if recruiters do not screen applicants�Facebook pro�le, the quasi-similarityof their application material (resume and cover letter) will lead to similar call-back rates for both.During 12 months (from March 2012 to March 2013), we applied for job openings for accountants inthe Paris region using pseudo-random assignment method, and sent more than 400 applications perapplicant.
The results show a signi�cant gap between the test and control applicants, with respectively 12.2%and 16.9% of positive returns. During the course of the experiment, a change in the standard Facebooklayout sent information on the language to a sub-page, not directly visible from the front page. Theextra step of clicking a tab to access that information allowed us to measure the depth of the recruiter�ssearch. Therefore, the experiment is split into two sub periods - before and after the Facebook layoutchange in December 2012. The �rst sub-period from March 2012 to December 2012 shows a clear andconsistent gap of 8 percentage points between the control (21.3%) and test (13.4%) applicants. Theexperimental protocol ensures that the signi�cant di¤erence results from observation of the Arabicsignal available on the test applicant�s Facebook pro�le. The main result of this article is that SNSsare used in hiring to screen applicants and do a¤ect the employer�s decision to grant an interview.
The second part of the experiment is based on an unexpected change in the layout of Facebookpro�les which occurred in December, 2012. This modi�cation strongly a¤ected the Arabic signal asonly a part of it (i.e. the hometown) still appeared on the Facebook front page, while the second part(i.e. language spoken) was positioned at the bottom of a secondary page (in the "About" tab). Thisnatural experiment allowed us to learn more about the SNS screening practices of recruiters since,following this change the two candidates exhibited no signi�cant di¤erence in their call-back rates. Itsuggests that screening is super�cial, illustrating the existence of search costs for employers to browsean entire pro�le.
An implication for policy is that applicants should know that their SNSs pro�les are consideredreliable means of assessment and selection by many recruiters. It is important during a job searchto treat the SNS pro�le as a part of the application material. A communication campaign couldbe organized to inform people of the secondary use of their personal information and the potentialconsequences for the probability of �nding a job and for their professional careers. Our �ndings alsosuggest potential solutions, ranging from locking one�s pro�le, to cleaning one�s SNS pro�le duringjob search or various assessment periods, to the use of multiple SNS pro�les ("o¢ cial" accessible toanyone, and private), to the use of an avatar. However, the impact of not having an online presencewhile looking for a job should be assessed in further studies.
It should be noted that the layout change leading to a signi�cant gap in call-back rates wasminor. However, it changed the assessment of our applicants and the �nal economic outcome quitedramatically. Indeed, this type of recruiter behavior demonstrates the increasing overlap between thepersonal and professional spheres.
16
References
[1] Acquisti, Alessandro and Fong, Christina M. "An experiment in hiring discrimination via onlinesocial networks." SSRN Working Paper, 2013.
[2] Ahmed, Ali M. and Hammarstedt, Mats. "Discrimination in the rental housing market: A �eldexperiment on the Internet." Journal of Urban Economics, September 2008 64(2), pp. 362-372.
[3] Ahmed, Ali M., Andersson, Lina and Hammarstedt, Mats. "Are gay men and lesbians discrimi-nated against in the hiring process?" Southern Economic Journal, 2013, 79, pp. 565-585.
[4] Andrews, M.J., Bradley, S., Stott, D. and Upward, R. �Successful employer Search? An empiricalanalysis of vacancy duration using micro data.�Economica, 2008, 75, pp. 455-480.
[5] Autor, David H. "Wiring the labor market." Journal of Economic Perspectives, 2001, 15(1), pp.25-40.
[6] Barron, John M., Berger, Mark C. and Black, Dan A. "Employer search, training and vacancyduration." Economic Inquiry, 1997, 35, pp. 167-192.
[7] Barron, John M., Bishop, John and Dunkelberg, William C. "Employer search: the interviewingand hiring of new employees." Review of Economics and Statistics, 1985, 67, pp. 43-52.
[8] Bartling, Björn, Fehr, Ernst and Schmidt, Klaus M. "Screening, Competition, and Job Design:Economic Origins of Good Jobs." American Economic Review, 2012, 102 (2), pp. 834-864.
[9] Belsley, David A., Kuh, Edwin and Welsch, Roy. "Regression Diagnostics: Identifying in�uentialdata and sources of collinearity." New York: Wiley, 1980.
[10] Berson, Clémence. "Does competition induce hiring equity?" Centre d�Economie de la Sorbonne,Working Paper, 2012, 19.
[11] Bertrand, Marianne and Mullainathan, Sendhil. "Do People Mean What They Say? Implicationsfor Subjective Survey Data" American Economic Review, September 2001, 91(2), pp. 67-72.
[12] Bertrand, Marianne and Mullainathan, Sendhil. "Are Emily and Greg More Employable thanLakisha and Jamal? A Field Experiment on Labour Market Discrimination." American EconomicReview, September 2004, 94(4), pp. 991-1013.
[13] Blackwell, Christopher W. "Current Employee Privacy Issues." Journal of Applied Managementand Entrepreneurship, 2004, 9 (1), pp. 113-118.
[14] Brandenburg, Carly. "The Newest Way to Screen Job Applicants: A Social Networker�s Night-mare." Federal Communications Law Journal, 2008, 60 (3), pp. 597-626.
[15] Brown, Colin and Gay, Pat. "Racial Discrimination: 17 Years After the Act." London, PolicyStudies Institute, 1985.
[16] Burdett, K. and Cunningham, E. �Toward a theory of vacancies.�Journal of Labor Economics,1998, 16(3), pp. 445-478.
[17] Bursell, Moa. "What�s in a Name? A Field Experiment Test for the Existence of Ethnic Discrim-ination in the Hiring Process." Stockholm University Working Paper, 2007:7.
[18] Clark, Leigh A. and Roberts, Sherry J. "Employer�s use of social networking sites: a sociallyirresponsible practice." Journal of Business Ethics, 2010, 95, pp. 507-525.
[19] Daniel, William W. "Racial Discrimination in England." Harmondsworth: Penguin, 1968.
17
[20] DeVaro, Jed. "The labor market e¤ects of employer recruitment choice." European EconomicReview, 2008, 52, pp. 283-314.
[21] Doleac, Jennifer L. and Stein, Luke C.D. "The Visible Hand: Race and Online Market Outcomes."Economic Journal, 2013, 123 (572) pp. 469-492.
[22] Drydakis, N. �Sexual orientation discrimination in the labour market.�Labour Economics, 2009,16(4), pp. 364-372.
[23] Duguet, Emmanuel, Leandri, Noam, L�horty, Yannick and Petit, Pascale. "Are Young FrenchJobseekers of Ethnic Immigrant Origin Discriminated Against? A controlled Experiment in theParis Area." Annals of Economics and Statistics, 2010, 99-100, pp. 187-215.
[24] Duguet, Emmanuel. and Petit, Pascale. "Hiring discrimination in the French �nancial sector: aneconometric analysis on �eld experiment data." Annals of Economics and Statistics, 2005, 78,pp. 79-102.
[25] Edo, Anthony, Jacquemet, Nicolas and Yannelis, Constantine. "Language Skills and HomophilousHiring Discrimination: Evidence from Gender- and Racially-Di¤erentiated Applications." 2013,CES Working Papers n�2013.58.
[26] Granovetter, M. « Getting a job : a study of contacts and careers » , University of Chicago Press,second edition, 1995.
[27] Guasch, J. Luis and Weiss, Andrew. "Adverse selection by markets and the advantage of beinglate." The Quarterly Journal of Economics, 1980, 94 (3), pp. 453-466.
[28] Holzer, Harry J. "Hiring procedures in the �rm: Their economic determinants and outcomes."NBER Working Paper, 2185, 1987.
[29] Hubbuck, Jim and Carter, Simon. "Half a chance? A Report on Job Discrimination againstYoung Blacks in Nottingham." London Commission for Racial Equality, 1980.
[30] Ioannides, Y.M. and Loury, L.D. �Job information networks, neighborhood e¤ects, and inequal-ity�Journal of Economic Literature, 2004, vol. n�42, pp. 1056-1093.
[31] Jacquemet, Nicolas and Yannelis, Constantine. "Indiscriminate discrimination: A correspondencetest for ethnic homophily in the Chicago Labor Market." Labour Economics, 19(6), December2012, pp. 824-832.
[32] Lazear, E.P. and Oyer, P. �Personnel economics�NBER Working Paper 13480, 2007.
[33] Manning, Alan. "Imperfect Competition in the Labor Market." Handbook of Labor Economics,2011, 4 (B), pp. 973-1041.
[34] Montgomery, James D. "Social Networks and Labor-Market Outcomes: Toward an EconomicAnalysis." American Economic Review, 81 (5), 1991, pp. 1408-1418.
[35] Montgomery, James D. "Job search and network composition: implications of the strength of-weak-ties hypothesis.", American Sociological Review, 1992, 57, pp. 586-596.
[36] Mortensen, Dale T. and Pissarides, Christopher A. "New Developments in Models of Search in theLabor Market." in Handbook of Labor Economics. O. Ashenfelter and D. Card, eds. Amsterdam:North Holland, 1999a, pp. 2567-2627.
[37] Mortensen, Dale T. and Pissarides, Christopher A. "Job Reallocation, Employment Fluctuationsand Unemployment Di¤erences." in Taylor JB and Woodford (eds.), Handbook of Macroeco-nomics, Vol. n�1, 1999, Amsterdam: North Holland, pp. 1171-1228.
18
[38] Oyer, Paul and Schaefer, Scott. "Personnel economics: hiring and incentives." in Handbook ofLabour Economics, 2011, Vol. 4b, pp. 1769-1823.
[39] Oreopoulos, Philip. "Why Do Skilled Immigrants Struggle in the Labor Market? A �eld Experi-ment with Six Thousand Resumes." NBER Working Papers, 15036, National Bureau of EconomicResearch, Inc, 2009.
[40] Petrongolo, Barbara and Pissarides, Christopher A. "Looking into the Black Box: A Survey ofthe Matching Function." Journal of Economic Literature, 2001, 39, pp. 390-431.
[41] Pissarides, Christopher A. "Equilibrium Unemployment Theory." 2nd ed. Cambridge: MIT Press,2000.
[42] Riach, P. and Rich, J. �Testing for racial discrimination in the labour market.�Cambridge Journalof Economics, vol. n�15, 1991, pp. 239-256.
[43] Riach, Peter A. and Rich, Judith "Field Experiments of Discrimination in the Market Place."Economic Journal, 2002, 112 (483), pp. 480-518.
[44] Rees, Albert. "Information networks in labor markets." American Economic Review, 1966,56(1/2), pp. 559-566.
[45] Rogerson Richard, Shimer Robert and Wright Randall. "Search-Theoretic Models of the LaborMarket: A Survey." Journal of Economic Literature, 2005, 43, pp. 959-988.
[46] Salop, Steven C. "Wage Di¤erentials in a Dynamic Theory of the Firm." Journal of EconomicTheory, 1973a, 6(4), pp. 321-344.
[47] Salop, Steven C. "Systematic Job Search and Unemployment." Review of Economic Studies, April1973b, 40(2), pp. 191-201.
[48] Salop, Joanne and Salop, Steven, C. "Self-selection and Turnover in the Labor Market." TheQuaterly Journal of Economics, November 1976, 90(4), pp. 619-627.
[49] Stigler, George J. "Information in the Labor Market." Journal of Political Economy, 1962,70(5/2), pp. 94-105.
[50] Spence, Michael. "Job Market Signaling." The Quaterly Journal of Economics, 1973, 87(3), pp.355-374.
[51] Van Ommeren, J., Rietveld, P. and Nijkamp, P. �Job moving, residential moving, and commuting:A search perpective.�Journal of Urban Economics, 46, 1999, pp. 230-253.
[52] Van Ommeren, J. and Russo, �Firm Recruitment Behaviour: Sequential or Non-sequentialSearch?�Oxford Bulletin of Economics and Statistics, 76(3), 2014, pp. 432-455.
[53] Weichselbaumer, Doris. "Sexual orientation discrimination in hiring." Labour Economics, Else-vier, December 2003, 10(6), pp. 629-642.
[54] Weiss, Andrew. "Job Queues and Layo¤s in Labor Markets with Flexible Wages." Journal ofPolitical Economy, 1980, 88 (3), pp. 526-538.
19
Annexe 1. Job applications by sector and applicant�s type
Firm status Private: 83.0% 83.6%Public: 6.5% 4.7%Not-for-pro�t: 10.4% 11.6%
Sector See Annex 4 - - - -Location See Annex 4 - - - -Total number of applications 230 232
* indicates a signi�cant di¤erence in mean or proportion between the two applicants at 5% thresh-old.
Note: Given the large number of variables taken into account, some di¤erences between the twoapplicants could appear among control variables for sub-period of the experimentation. For instance,we can observe signi�cant proportion or mean di¤erences between the two applicants in the Tablebelow for contract type, application delay and some job positions. For some extent, these di¤erencesstem from the detailed manner we opted to expose the variables. In a less detailed way and withoutloss of relevance, all accounting assistant positions could be merged (accounting assistant, accountingand secretary assistant, and, other accounting assistant), and then the proportion di¤erence would nothold any more. In the case of contract type, the di¤erence is not due to a detailed manner to presentthis variable but to our pseudo-random assignment method during which we focus more especially on 4characteristics: �rm�s size and sector in addition to job position and required work experience. Then,some di¤erences could temporally appear among other control variables. For application delay, somedi¤erence could appear due to the fact that at least two co-authors are involved in the preparation23French standard weekly worktime = 35h24Number of business days between the ad publication and the application sending
24
and checking of the application materials. For each applicant type, the sending is carried only byone co-author. Depending on authors�availability, this last operation could imply some variationsin application sending. According to models in Annex 5, the type of contract duration and theapplication delay have not however any signi�cant in�uence on the outcome of the application.
25
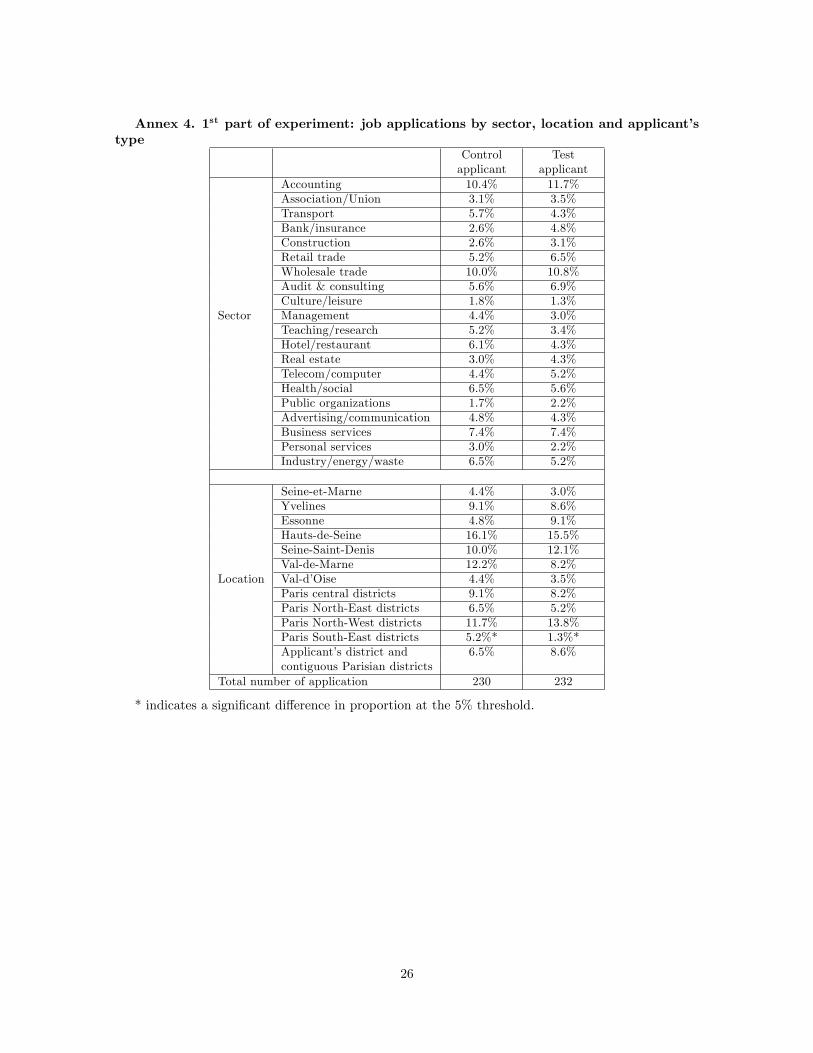
Annex 4. 1st part of experiment: job applications by sector, location and applicant�stype
Firm status Private: 82.7% 82.1%Public: 5.9% 5.0%Not-for-pro�t: 11.4% 12.9%
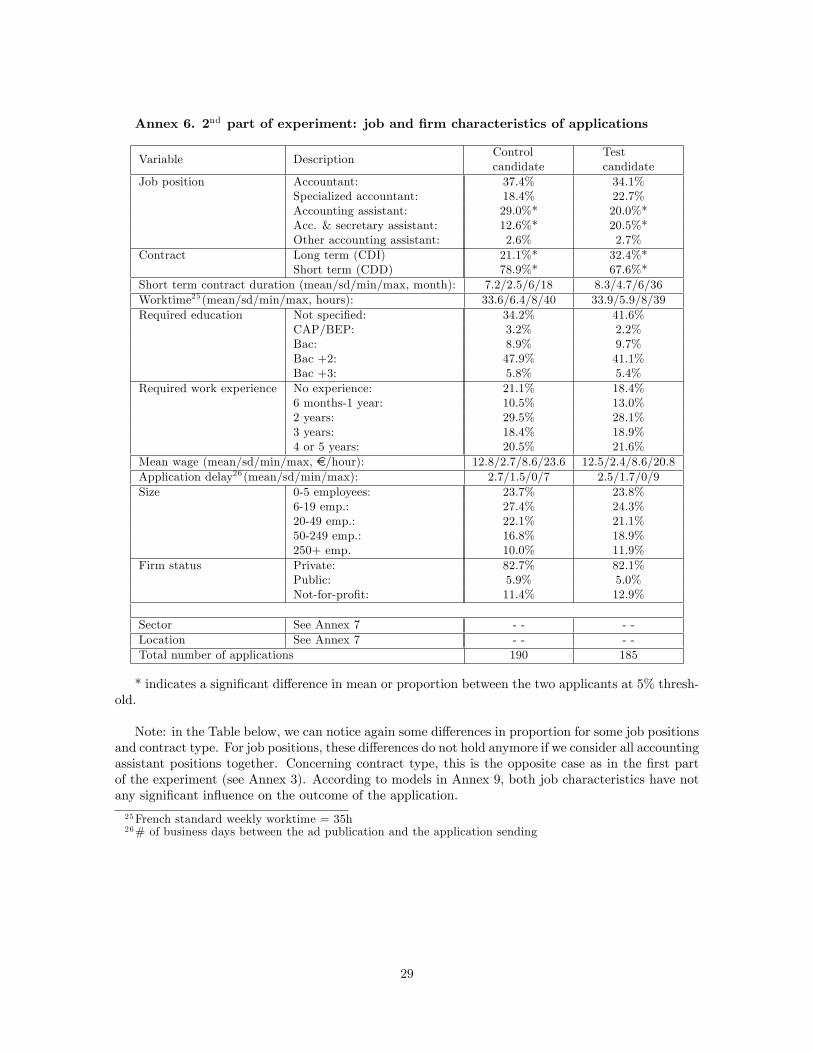
Sector See Annex 7 - - - -Location See Annex 7 - - - -Total number of applications 190 185
* indicates a signi�cant di¤erence in mean or proportion between the two applicants at 5% thresh-old.
Note: in the Table below, we can notice again some di¤erences in proportion for some job positionsand contract type. For job positions, these di¤erences do not hold anymore if we consider all accountingassistant positions together. Concerning contract type, this is the opposite case as in the �rst partof the experiment (see Annex 3). According to models in Annex 9, both job characteristics have notany signi�cant in�uence on the outcome of the application.
25French standard weekly worktime = 35h26# of business days between the ad publication and the application sending
29
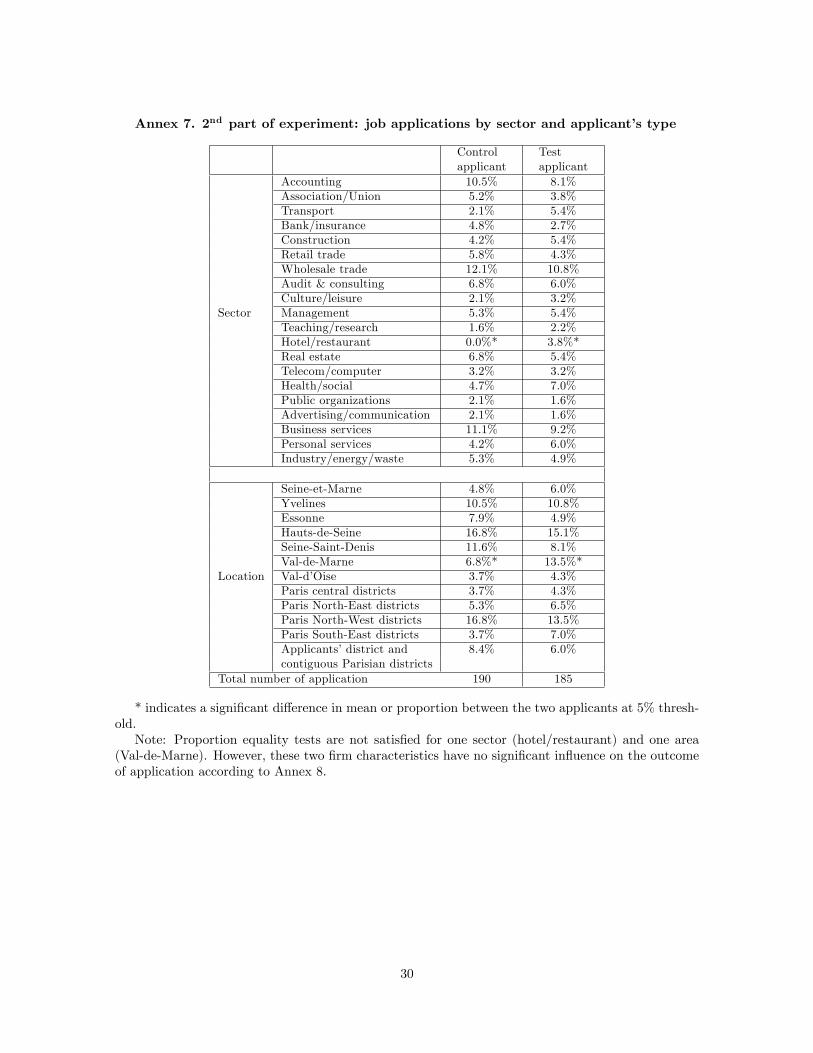
Annex 7. 2nd part of experiment: job applications by sector and applicant�s type
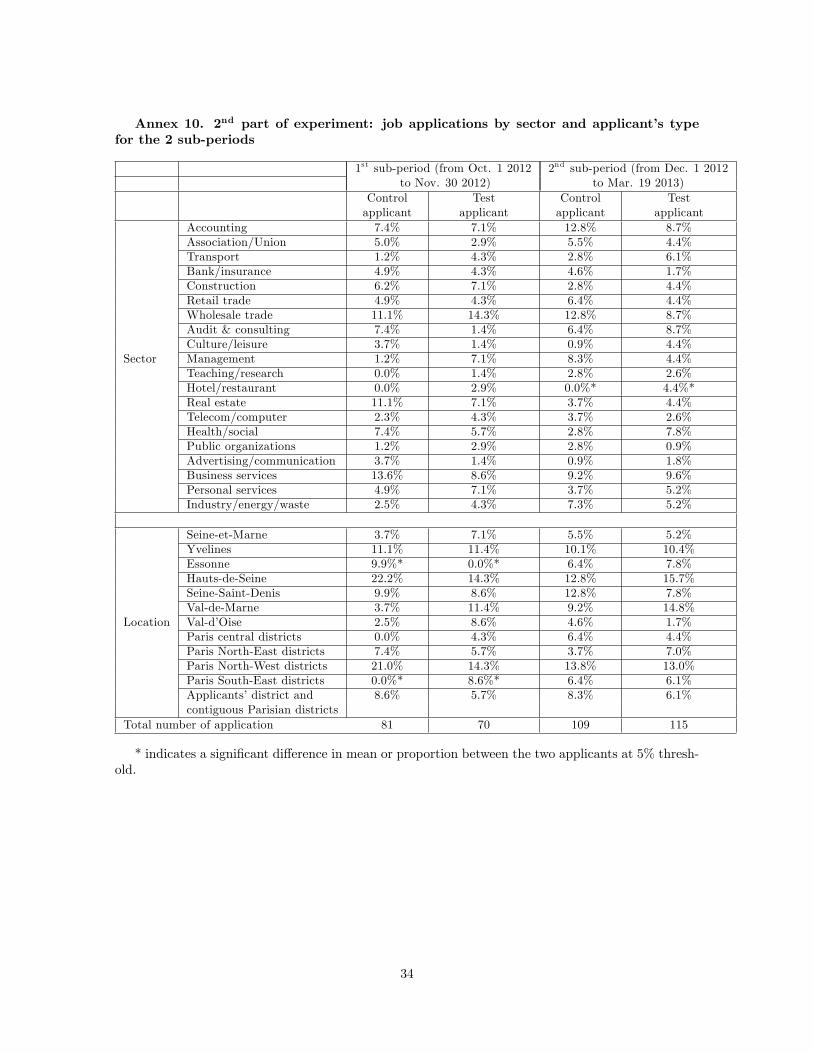
* indicates a signi�cant di¤erence in mean or proportion between the two applicants at 5% thresh-old.Note: Proportion equality tests are not satis�ed for one sector (hotel/restaurant) and one area
(Val-de-Marne). However, these two �rm characteristics have no signi�cant in�uence on the outcomeof application according to Annex 8.
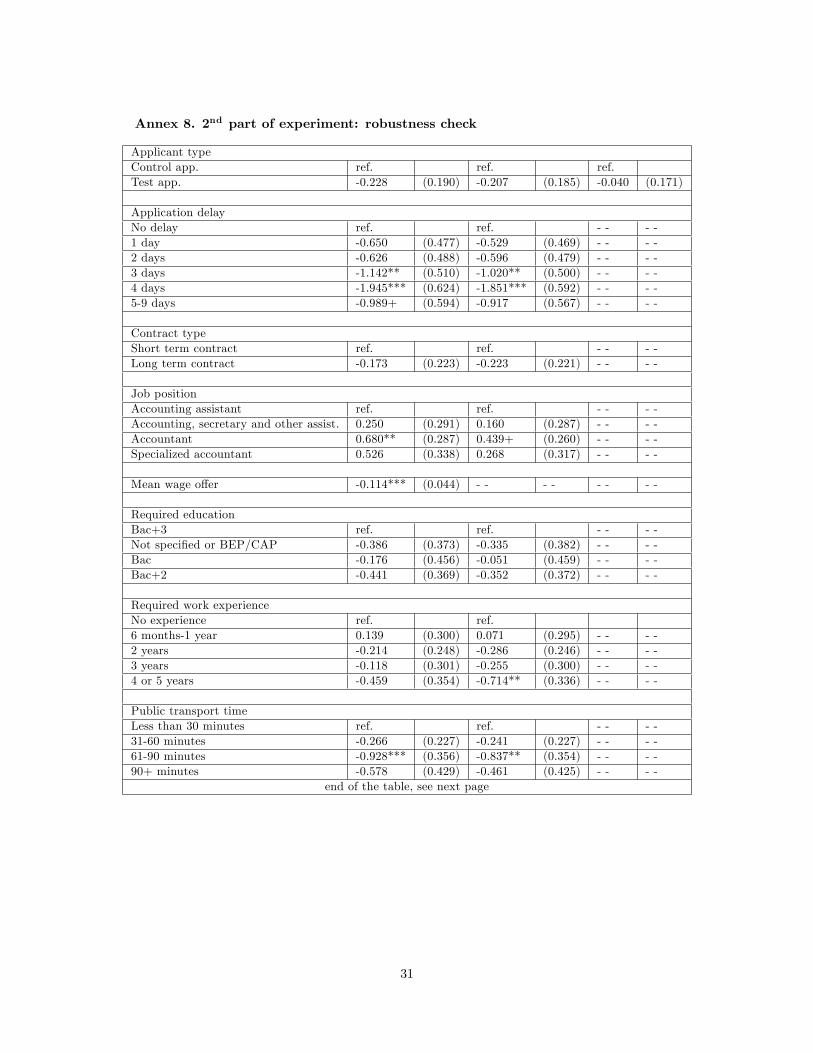
Robust standard errors in brackets. +, ** and *** mean respectively signi�cant at 10%, 5% and1% tresholds.
Note: some sectors have to be merged due to perfect predictability of results otherwise. This isthe case here for: construction and real estate, retail trade and hotel/restaurant, and industry, energy,waste and transport.
32
Annex 9. 2nd part of experiment: job and �rm characteristics of the applications forthe 2 sub-periods
1st sub-period (from Oct. 1 2012 2nd sub-period (from Dec.1 2012to Nov. 30 2012) to Mar. 19 2013)
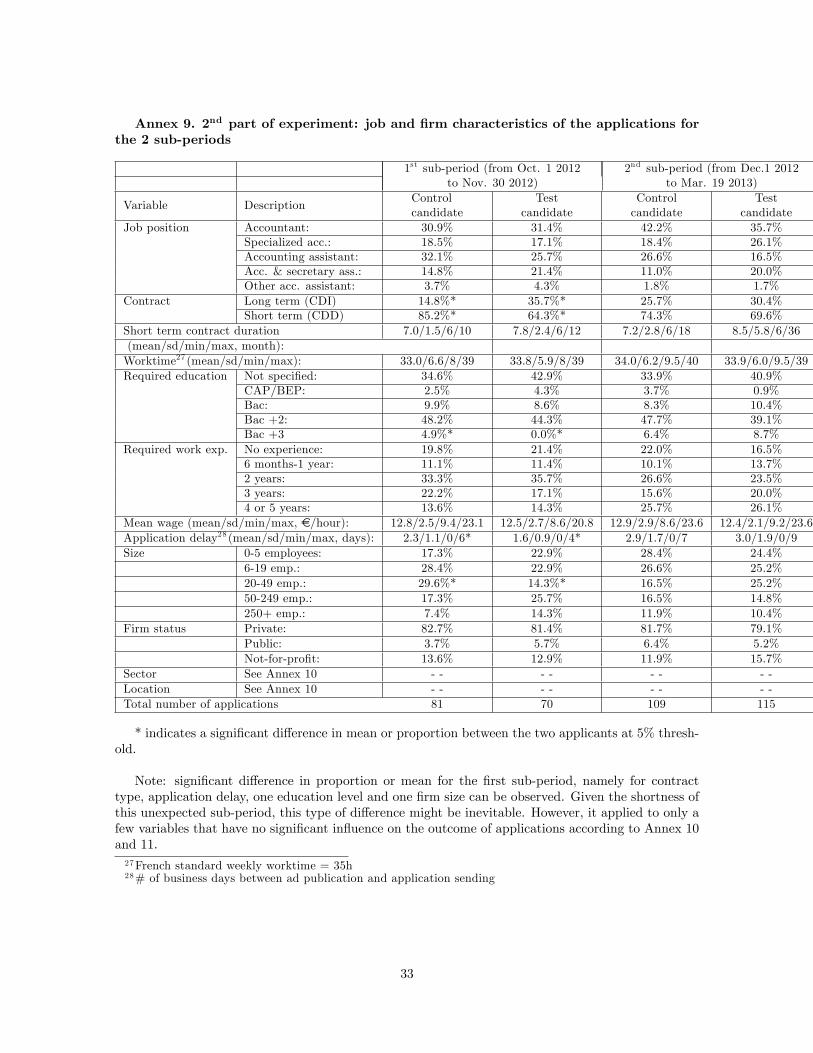
Sector See Annex 10 - - - - - - - -Location See Annex 10 - - - - - - - -Total number of applications 81 70 109 115
* indicates a signi�cant di¤erence in mean or proportion between the two applicants at 5% thresh-old.
Note: signi�cant di¤erence in proportion or mean for the �rst sub-period, namely for contracttype, application delay, one education level and one �rm size can be observed. Given the shortness ofthis unexpected sub-period, this type of di¤erence might be inevitable. However, it applied to only afew variables that have no signi�cant in�uence on the outcome of applications according to Annex 10and 11.27French standard weekly worktime = 35h28# of business days between ad publication and application sending
33
Annex 10. 2nd part of experiment: job applications by sector and applicant�s typefor the 2 sub-periods
1st sub-period (from Oct. 1 2012 2nd sub-period (from Dec. 1 2012to Nov. 30 2012) to Mar. 19 2013)
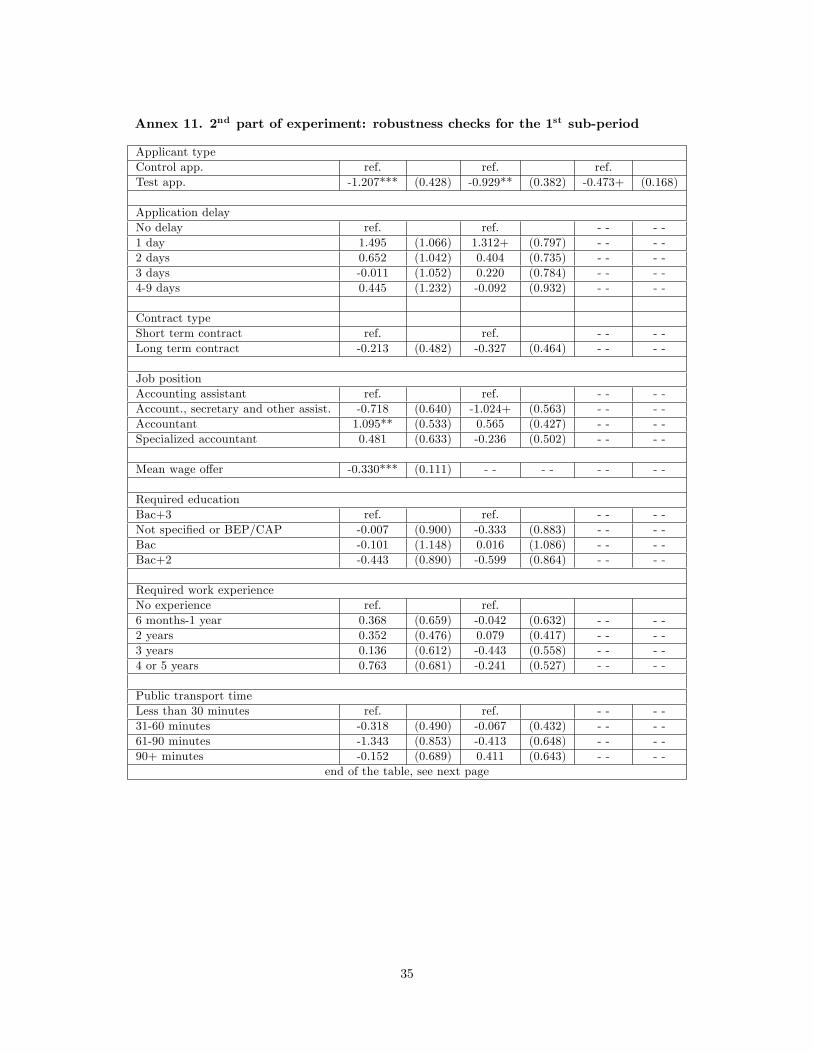
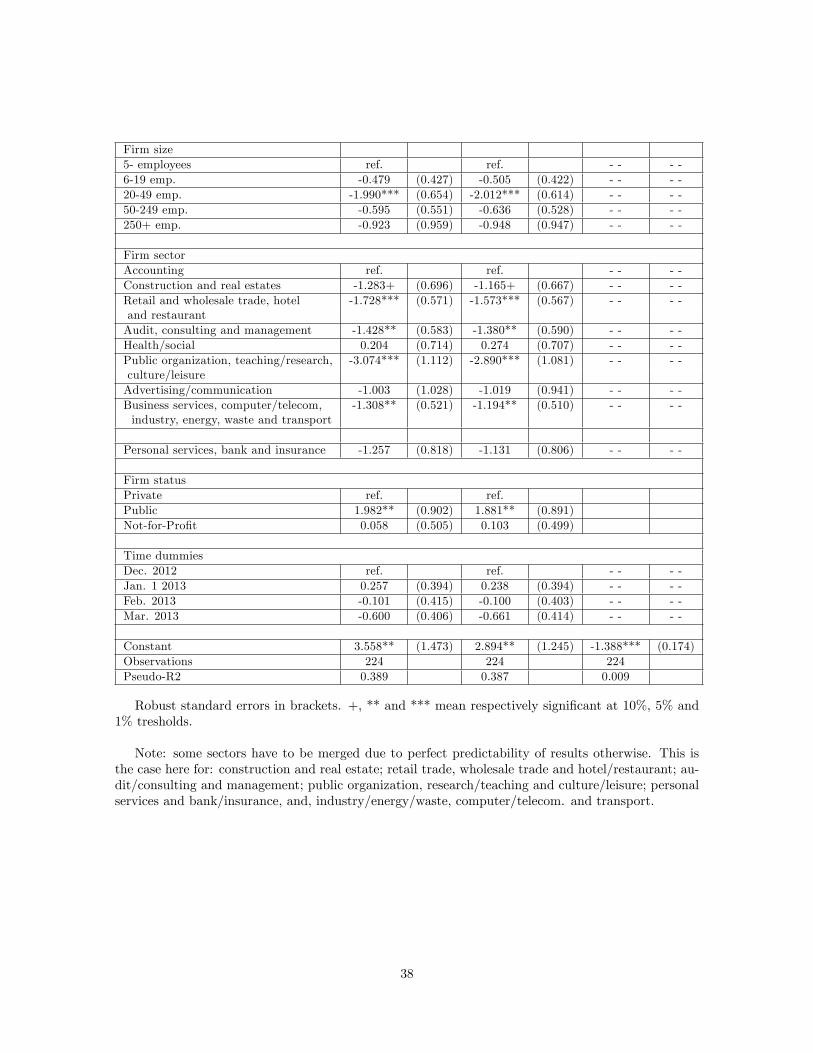
Robust standard errors in brackets. +, ** and *** mean respectively signi�cant at 10%, 5% and1% tresholds.
Note: some sectors have to be merged due to perfect predictability of results otherwise. This isthe case here for: construction and real estate; retail trade and hotel/restaurant; public organization,research/teaching and culture/leisure; personal services and bank/insurance, and, industry, energy,waste and transport.
36
Annex 12. Robustness check: 2nd part of experiment for the 2nd sub-period
Robust standard errors in brackets. +, ** and *** mean respectively signi�cant at 10%, 5% and1% tresholds.
Note: some sectors have to be merged due to perfect predictability of results otherwise. This isthe case here for: construction and real estate; retail trade, wholesale trade and hotel/restaurant; au-dit/consulting and management; public organization, research/teaching and culture/leisure; personalservices and bank/insurance, and, industry/energy/waste, computer/telecom. and transport.