458
| Date post: | 03-Jan-2016 |
| Category: |
Documents |
| Upload: | eduardo-antunez |
| View: | 383 times |
| Download: | 2 times |

NANOTECHNOLOGY SCIENCE AND TECHNOLOGY
NANOPOROUS MATERIALS: TYPES,
PROPERTIES AND USES
No part of this digital document may be reproduced, stored in a retrieval system or transmitted in any form orby any means. The publisher has taken reasonable care in the preparation of this digital document, but makes noexpressed or implied warranty of any kind and assumes no responsibility for any errors or omissions. Noliability is assumed for incidental or consequential damages in connection with or arising out of informationcontained herein. This digital document is sold with the clear understanding that the publisher is not engaged inrendering legal, medical or any other professional services.

NANOTECHNOLOGY SCIENCE AND TECHNOLOGY
Additional books in this series can be found on Nova‘s website at:
https://www.novapublishers.com/catalog/index.php?cPath=23_29&seriesp= Nanotechnology+Science+and+Technology
Additional E-books in this series can be found on Nova‘s website at:
https://www.novapublishers.com/catalog/index.php?cPath=23_29&seriespe= Nanotechnology+Science+and+Technology
NANOTECHNOLOGY SCIENCE AND TECHNOLOGY
NANOPOROUS MATERIALS: TYPES,
PROPERTIES AND USES
SAMUEL B. JENKINS
EDITOR
Nova Science Publishers, Inc.
New York
Copyright © 2010 by Nova Science Publishers, Inc. All rights reserved. No part of this book may be reproduced, stored in a retrieval system or transmitted in any form or by any means: electronic, electrostatic, magnetic, tape, mechanical photocopying, recording or otherwise without the written permission of the Publisher. For permission to use material from this book please contact us: Telephone 631-231-7269; Fax 631-231-8175 Web Site: http://www.novapublishers.com
NOTICE TO THE READER
The Publisher has taken reasonable care in the preparation of this book, but makes no expressed or implied warranty of any kind and assumes no responsibility for any errors or omissions. No liability is assumed for incidental or consequential damages in connection with or arising out of information contained in this book. The Publisher shall not be liable for any special, consequential, or exemplary damages resulting, in whole or in part, from the readers‘ use of, or reliance upon, this material. Any
parts of this book based on government reports are so indicated and copyright is claimed for those parts to the extent applicable to compilations of such works. Independent verification should be sought for any data, advice or recommendations contained in this book. In addition, no responsibility is assumed by the publisher for any injury and/or damage to persons or property arising from any methods, products, instructions, ideas or otherwise contained in this publication. This publication is designed to provide accurate and authoritative information with regard to the subject matter covered herein. It is sold with the clear understanding that the Publisher is not engaged in rendering legal or any other professional services. If legal or any other expert assistance is required, the services of a competent person should be sought. FROM A DECLARATION OF PARTICIPANTS JOINTLY ADOPTED BY A COMMITTEE OF THE AMERICAN BAR ASSOCIATION AND A COMMITTEE OF PUBLISHERS. LIBRARY OF CONGRESS CATALOGING-IN-PUBLICATION DATA
Nanoporous materials : types, properties, and uses / editors, Samuel B. Jenkins. p. cm. Includes index. ISBN 978-1-61122-999-8 (eBook)
Published by Nova Science Publishers, Inc. † New York
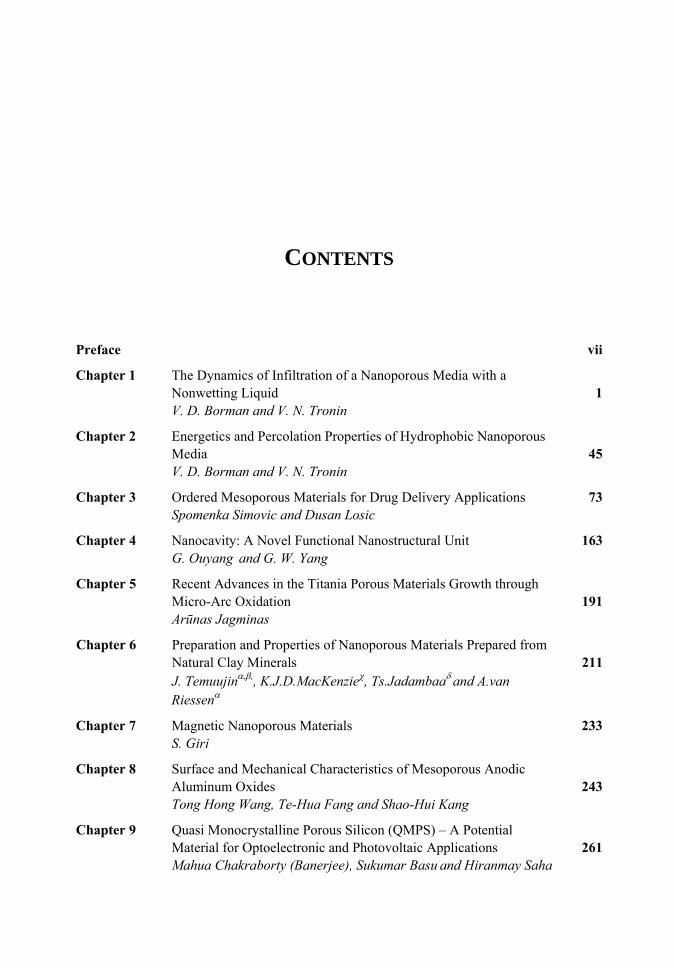
CONTENTS
Preface vii
Chapter 1 The Dynamics of Infiltration of a Nanoporous Media with a Nonwetting Liquid 1 V. D. Borman and V. N. Tronin
Chapter 2 Energetics and Percolation Properties of Hydrophobic Nanoporous Media 45 V. D. Borman and V. N. Tronin
Chapter 3 Ordered Mesoporous Materials for Drug Delivery Applications 73 Spomenka Simovic and Dusan Losic
Chapter 4 Nanocavity: A Novel Functional Nanostructural Unit 163 G. Ouyang
and G. W. Yang
Chapter 5 Recent Advances in the Titania Porous Materials Growth through Micro-Arc Oxidation 191 Arūnas Jagminas
Chapter 6 Preparation and Properties of Nanoporous Materials Prepared from Natural Clay Minerals 211
J. Temuujin,
, K.J.D.MacKenzie, Ts.Jadambaa
and A.van
Riessen
Chapter 7 Magnetic Nanoporous Materials 233 S. Giri
Chapter 8 Surface and Mechanical Characteristics of Mesoporous Anodic Aluminum Oxides 243 Tong Hong Wang, Te-Hua Fang and Shao-Hui Kang
Chapter 9 Quasi Monocrystalline Porous Silicon (QMPS) – A Potential Material for Optoelectronic and Photovoltaic Applications 261 Mahua Chakraborty (Banerjee), Sukumar Basu
and Hiranmay Saha

Contents vi
Chapter 10 Low-k Nanoporous Interdielectrics: Materials, Thin Film Fabrications, Structures and Properties 273 Moonhor Ree, Jinhwan Yoon and Kyuyoung Heo
Chapter 11 Novel Manufacturing and Processing Technologies of Nanoporous Silicon 315 Jia-Chuan Lin and Wei-Chih Tsai
Index 355
PREFACE Nanoporous materials consist of a regular organic or inorganic framework supporting a
porous structure. Nanoporous materials are separated into three subtypes: microporous materials, mesoporous materials and macroporous materials. In recent years, nanoporous materials have been recognized as promising candidates for the multifunctional applications such as catalysis, ion-exchange, gas storage low density magnetic storage, etc. In addition, nanoporous materials are also of scientific and technological importance because of their ability to absorb and cooperate with atoms, ions and molecules on their sizeable interior surfaces and pore space. This new book proposes and reviews advances being made in the field of nanoporous materials.
Chapter 1- After compression of a system formed by a nanoporous media and a nonwetting liquid to the threshold pressure value 0cp , the liquid fills the pores of a porous media. In accordance with prevailing concepts, passage of the liquid from the bulk to the dispersed state can be described as a percolation-type transition [1]. The percolation-type spatial distribution of pores filled with the liquid is confirmed by the ―devil‘s staircase‖
effect involving the change in the resistance of a porous media (porous glass) upon its infiltration with mercury in the vicinity of the threshold infiltration pressure [2]. The percolation type of infiltration of porous media is also confirmed by the ―viscous fingers‖
effect, in which a wetting liquid is displaced from pores by some other liquid [3]. In this case, a nonuniform front of porous media infiltration is formed. This process is typical of infiltration of macroscopic porous bodies with wetting liquids. The threshold type of infiltration was observed for nonwetting liquids, for grained porous media (zeolites) with a pore size of R = 0.3–1.4 nm and silochromes (R = 4–120 nm) filled with nonwetting liquid metals, and for hydrophobized granular porous bodies with a silicon oxide skeleton (R = 3-50 nm) filled with water, ethylene glycol, or salt solutions [4–21]. The grain size in [4–20] was 1–100 µm.
To fill nanometer-size pores with a nonwetting liquid with a surface energy of 0.05–0.50 J/m2, a threshold pressure of 0cp = 102
–103 atm is required. When the liquid passes from the bulk to the dispersed state in a nanoporous media with a specific volume of 1 cm3/g, the energy absorbed by the liquid and returned (accumulated) when the liquid flows out amounts to 10–100 kJ/kg. This value is an order of magnitude higher than for polymer composites or alloys with the shape memory effect, which are widely used now [20]. This forms the basis for devices for mechanical energy absorption and accumulation. Bogomolov [23] was the first
Samuel B. Jenkins viii
to indicate such a possibility of accumulating mechanical energy. It should be noted that 1 kg of a porous material is sufficient for absorbing the energy of a media having a mass of 1 t and moving at a velocity of 50 km/h.
Chapter 2- Energetics of "nanoporous medium--nonwetting liquid" systems is one of the new directions in basic and applied research [1-8]. In the simple model of a porous media in the form of cylindrical channels, this threshold pressure is described by the Laplace--Washburn equation 2p R cos , where is the surface energy of the liquid, R is the
pore radius, and is the contact angle (for a nonwetting liquid, 90 ). For filling nanometer-sized pores by a nonwetting liquid with a surface energy of 0 05 0 5 J/m2, it is
necessary to apply a threshold pressure of 2 310 10 atm. When the liquid passes from the bulk of the material to a dispersed state in pores of the nanoporous medium with a specific volume of ~ 1 cm3/g, the absorbed and accumulated (returned when the liquid flows out) energy can reach 10 100 kJ/kg. This value is one order of magnitude higher than the energy observed for widely used materials, such as polymer composites and alloys with the shape memory effect [9-11].
Among the systems under investigation are silochromes, zeolites with liquid metals, hydrophobized silica gels, and zeolites with water and aqueous solutions of organic compounds and salts. In recent years, hydrophobized nanoporous media have become available owing to the development of the method used for modifying the surface of nanoporous media, for example, with alkyl chlorosilanes [6,7,12-22]. To date, nanoporous media with different pore shapes, porosities, specific surface areas, specific volumes, average pore radii, and pore size distributions have been studied [1,6,7,19,20,21-55]. The investigations performed thus far have been concerned primarily with equilibrium properties. Experiments have been carried out at a low compression rate of the system when the rate of increase in the pressure ( p ) in the liquid--porous media system is (10 3 -1) atm/s. In the infiltration-defiltration cycle, there is a hysteresis, so that the threshold pressure of infiltration is higher than the pressure of defiltration. Moreover, the majority of the systems studied are characterized by the phenomenon of nonoutflow of a nonwetting liquid when a part of this liquid remains in the porous medium as the excess pressure decreases to zero. The absorbed energy is determined by the product of the volume of filled pores and the difference between the infiltration and defiltration pressures. In frameworks the model of cylindrical channels, these pressures are described by the Laplace--Washburn equation with different angles of wetting. The phenomenon of nonoutflow of a nonwetting liquid has restricted the practical application of the system. These phenomena have been observed in the systems under investigation irrespective of the type of a modifier of the pore surface.
Chapter 3- Conventional drug therapy is associated with a number of challenges, such as poor drug stability and/or solubility in biological environment, lack of selectivity, severe toxicity and unfavourable pharmacokinetics. The application of nanotechnology to medical devices - ―nanomedicine‖ is recognized as an emerging field with huge potential for
development of new therapeutic concepts. Research on mesoporous materials for biomedical purposes has experienced an outstanding increase during recent years. Three major types of mesoporous materials for drug delivery application were emerged including: mesoporous silica engineered by organic synthesis and porous silicon, anodically oxidised alumina (AAO) and nanotubular titania fabricated by electrochemical methods. Although still in early stages,
Preface ix
few in vivo studies clearly show the potential of these materials for drug delivery devices in orthopedics implants, dental implants, and vascular stents, where not only is the controlled release of drugs such as antibiotics or growth factors desired, but also appropriate biointegration is needed. In this chapter we collect and analyze some of the most relevant milestones in the research of mesoporous materials for controlled drug delivery for implantable and systemic delivery systems. To provide a comprehensive overview to the reader, this review firstly analyzes biocompatibility aspects, which are the major prerequisite for application of materials that come into contact with biological systems. Secondly, we consider the basic aspects of the textural properties (surface and porosity) that contribute to the understanding of drug adsorption and controlled release processes. Finally, more sophisticated stimuli-responsive materials are reviewed. This is only beginning of the further research in terms of correlating biomaterial chemistry and tissue responses and new clinical approaches required not only for orthopaedics, but also treatment for a number of other diseases (hearth, cancer, diabetes, Parkinson‘s, Alzheimer‘s etc).
Chapter 4-The discovery of the nanocavity structures marked a highlight point in the condensed matter physics and material science of low-dimensional systems. However, it is hard to get a deeper understanding for these unique nanostructures with negative curvature of the fundamental physics underlying from the perspective of classic method. Of great importance is the question of the many physical quantities, such as surface energy, cohesive energy and mechanical modulus, etc., keeping not constant due to under-coordinated atoms in the surface or interface layer of low-dimensional systems [1-3]. The most striking feature is the inner surface atomic state of nanocavity structures with negative curvature are different from those of multilayers, nanocrystals and bulk counterparts. Thus, the surface energy in inner surface of nanocavity structures is the most important quantity, which plays the dominant role and should be responsible for the novel performances.
The present chapter focuses on the basic physical principles of surface energy of nanocavity structures and its novel performances based on the nanothermodynamics and continuum mechanics considerations. Deeper insight into the physical mechanism behind and analytical solutions to the unusually mechanical behavior and thermal stability of nanocavities are presented. Correlation between the surface energy in inner surface of nanocavity structures and its effect on local stiffness, sink effect, interface diffusion and nonlinear shrinkage has been established. It is found that the inner surface energy of nanocavity increases with the size of nanocavity decreasing, which is the inverse of the size dependent surface energy of free nanocrystals. Accordingly, the method for nanocavity structures not only reveals the new physics and chemistry of nanostructural surface energy, but also provides general theoretical tools to calculate the surface energy and related properties.
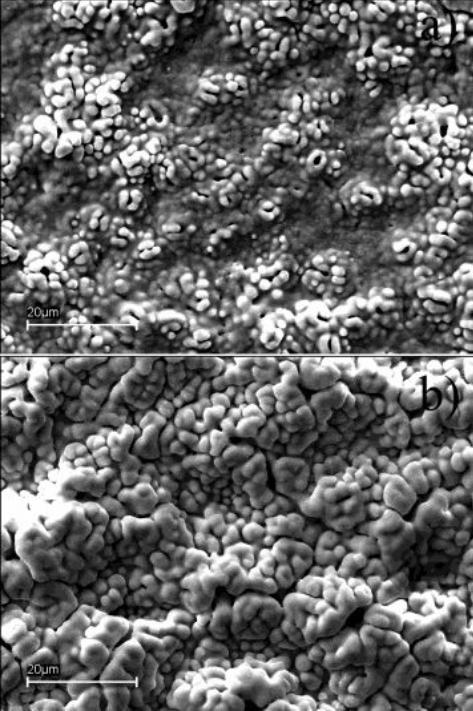
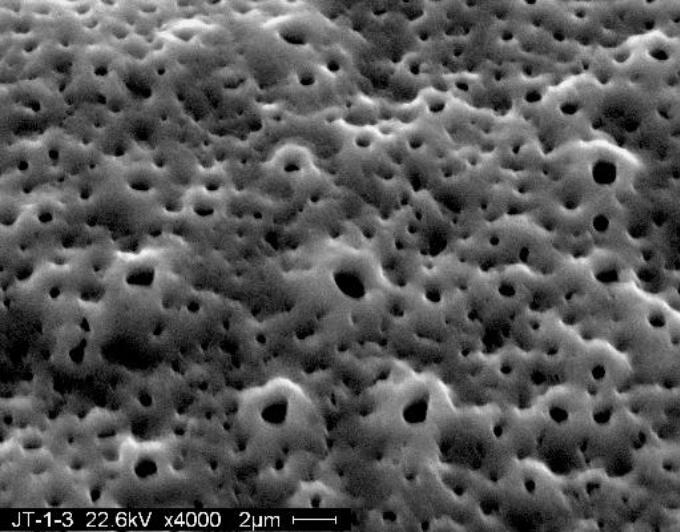
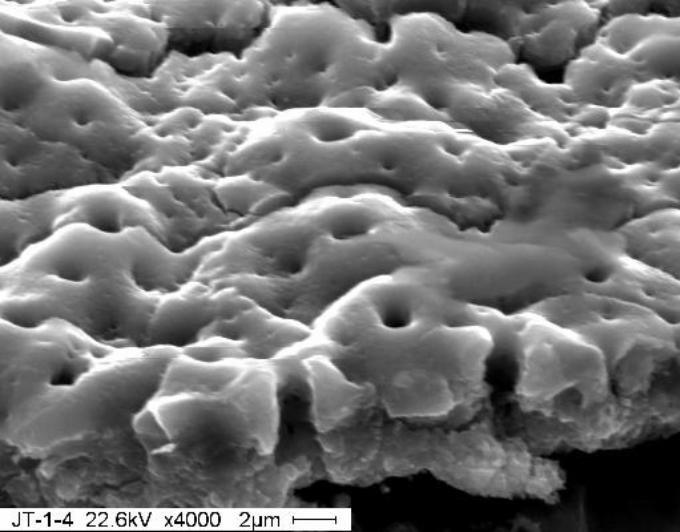
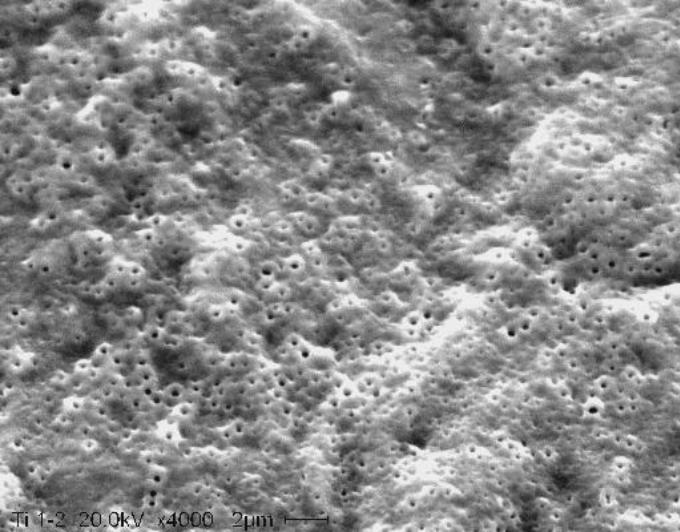
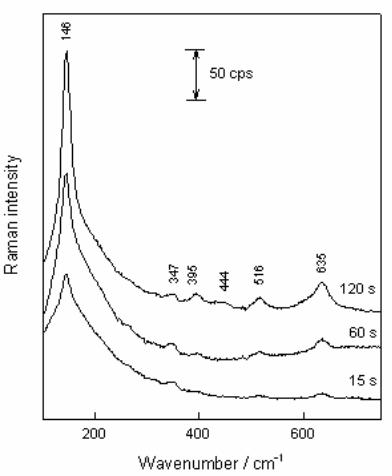
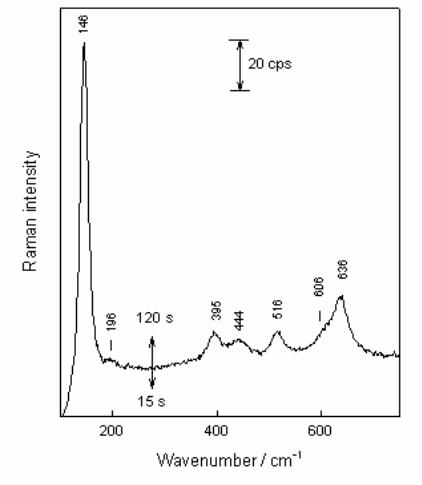
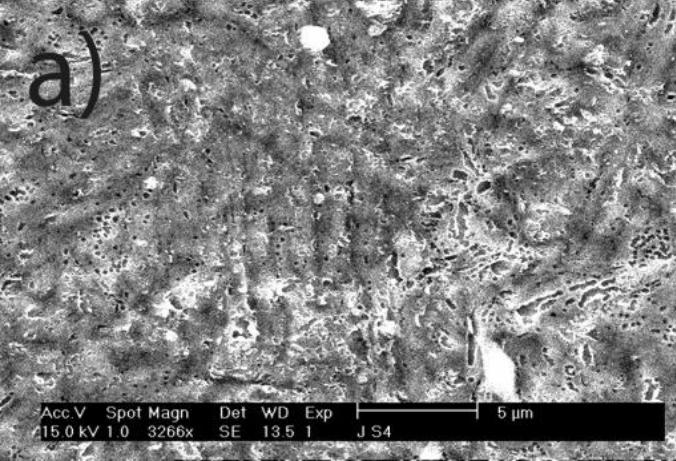
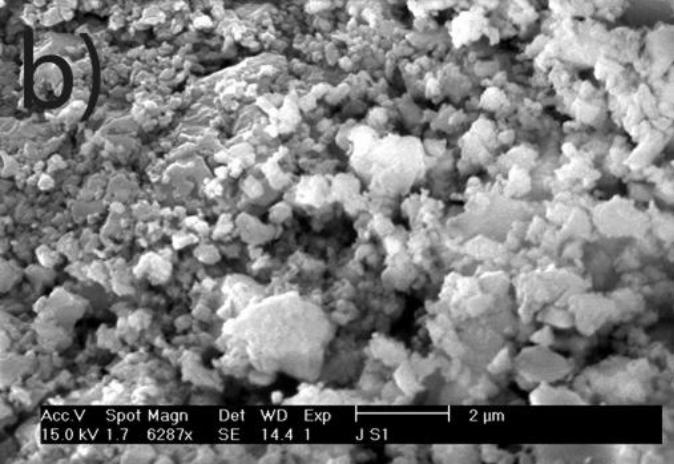
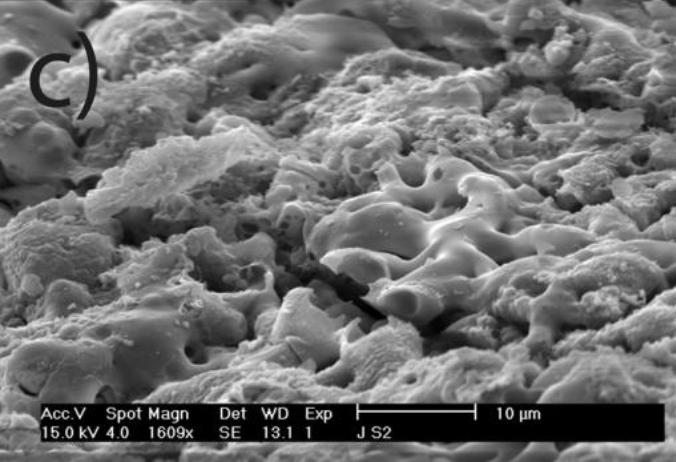
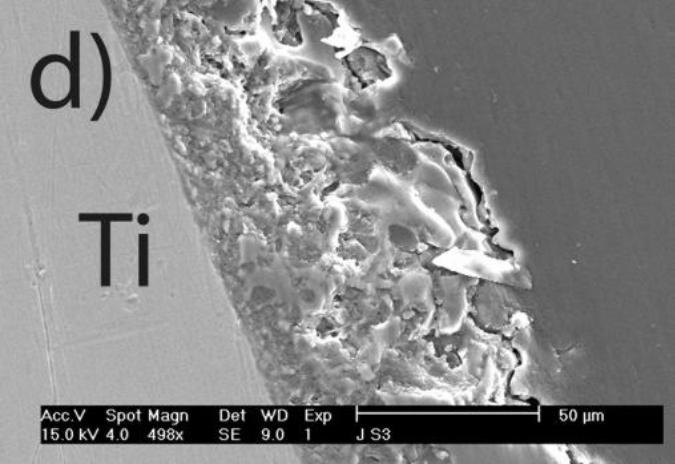
Chapter 5- Micro-arc oxidation or so-called plasma electrolytic oxidation (PEO) is an effective way to make much thicker oxide films on the surface of titanium and its alloys surprisingly improving protection properties of this material. PEO operates at potentials above the breakdown voltage of the growing passive film on the Ti anode and is characterized by numerous arcs moving rapidly over the electrode. Due to a high temperature in the micro-plasma channels, penetrating continually the growing film from the surface to the metal/oxide interface during micro-arc oxidation, the fused components of solution are usually inserted into these films. Furthermore, the quantity of sintered compounds increases with the treatment time producing a ceramic layer with nonuniform distribution of elements, porosity, and
Samuel B. Jenkins x
properties. On the other hand, the anodizing of Ti under micro-arc conditions in the aqueous solutions of pure acids, such as sulphuric and phosphoric, results in the formation of rough films with a network of pores randomly distributed and nonuniform in size.
In this chapter, recent progress in fabrication, design, characterization and potential applications of quite pure, thick porous titania coatings by the PEO way are presented and discussed. We showed also that the growth of PEO coatings in strongly alkaline silicate solutions originates from the formation of low valence titanium oxides at the substrate surface as thick as several micrometers.
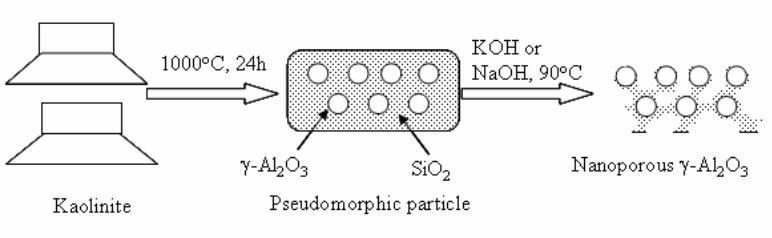
Chapter 6- In this chapter, we review recent work carried out in our research group on the preparation and characterisation of nanoporous materials from a variety of clay minerals by selective leaching methods. These nanoporous materials are prepared by exploiting the crystal architecture of layer-lattice minerals.
According to their layer periodicity, clay minerals are divided into different types, namely 1:1 type (kaolinite, antigorite etc), 2:1 (montmorillonite, vermiculite, pyrophillite, talc etc) and amorphous (allophane etc). The combination of tetrahedral Si2O5 and octahedral Al2(OH)4 or Mg2(OH)4 layers gives a range of unique crystal architectures.
Nanoporous materials have been prepared using a simple selective leaching technique. Differences in the solubility of the clay components at different pH values are exploited to leach a particular component from the clay structure and produce pores. Leaching occurs preferentially at moderate temperatures (80-90oC). The use of clay minerals to prepare nanoporous materials allows the pore size and shape to be controlled.
It is found that in most cases, preliminary amorphisation of the clay minerals favours the leaching process. However, some minerals such as vermiculite can be acid-treated directly, producing porous silica with the highest specific surface area of all the minerals (670 m2/g), by comparison with the silica of the lowest surface area (15 m2/g) produced from talc. Pore size distribution measurements reveal the presence of micro and nanopores.
Amorphisation of the clay minerals can be achieved by either thermal or mechanical treatment (grinding). Preliminary milling destroys the layer structure of the clay mineral, making it difficult to control the pore size and shape. Thermal amorphisation of the clay mineral favours the production of porous materials with high surface areas and controlled pore size distributions.
Nanoporous silica, -alumina and composite materials have been prepared from kaolin, montmorillonite, pyrophillite, phlogopite and talc show excellent decolorisation, adsorption and ion-exchange properties.
Chapter 7- Currently, nanoporous materials have been recognised as promising candidates for the multifunctional applications such as catalysis, ion-exchange, gas storage, low density magnetic storage, etc. Because of the diverse range of metal organic (inorganic) networks the structural, chemical, and physical properties of nanoporous materials are fascinating from fundamental interest as well as technological applications. The use of transition metal ions within the nanoporous structure opens up the possibility of various applications with improved electrical, optical, and magnetic properties. Among them, the search for the improved magnetic properties is challenging ascribed to their potential applications in developing low density magnetic storage materials, magnetic sensors, and intelligent or multifunctional materials. The magnetic properties of the metal organic (inorganic) networks are strongly influenced by the structures of the materials where magnetic properties have been tuned by designing varieties of porous structures composed of
Preface xi
different transition metals. In this article the magnetism of nanoporous materials is reviewed based on recent experimental results.
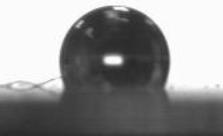
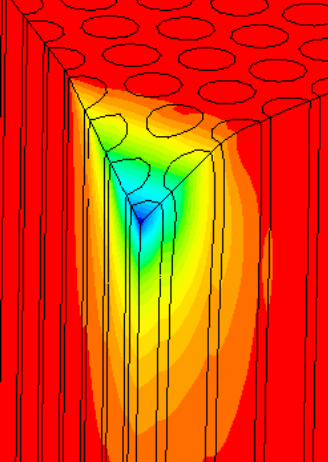
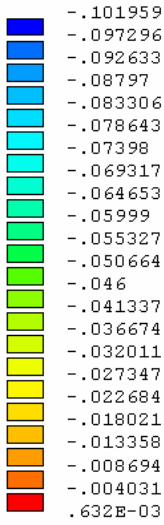
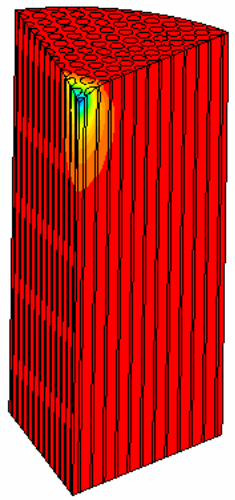
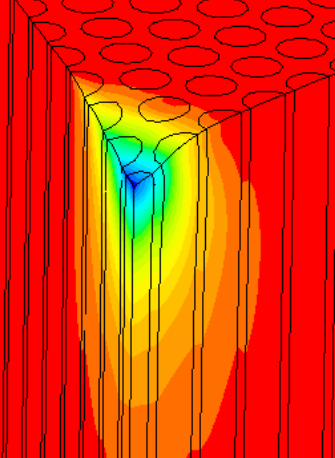
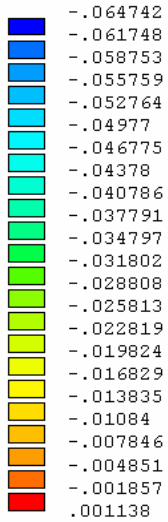
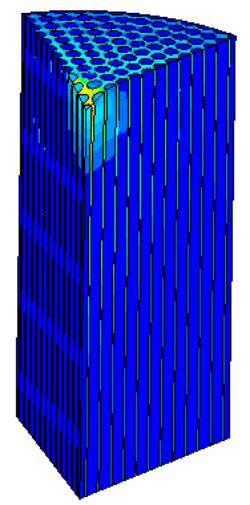
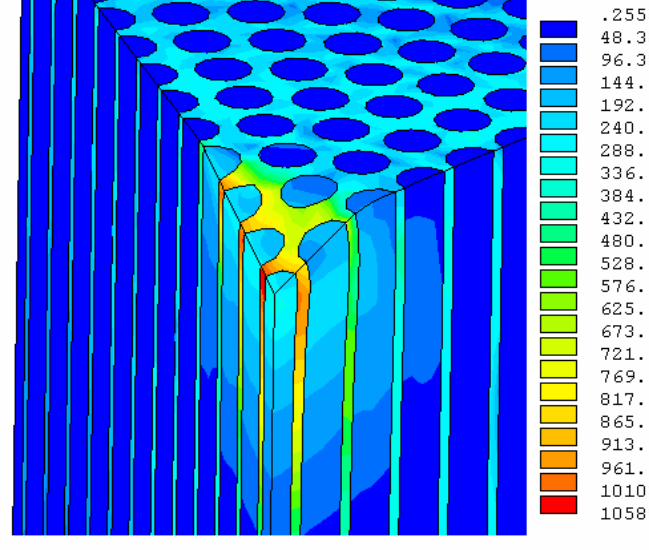
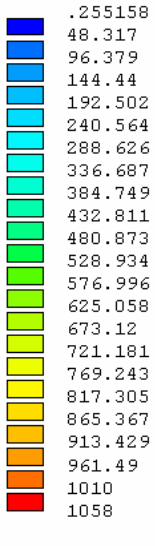
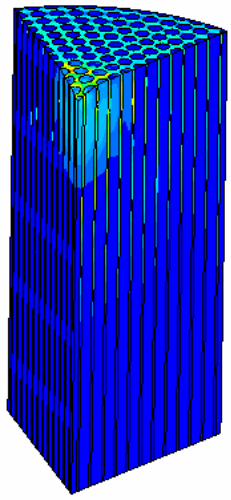
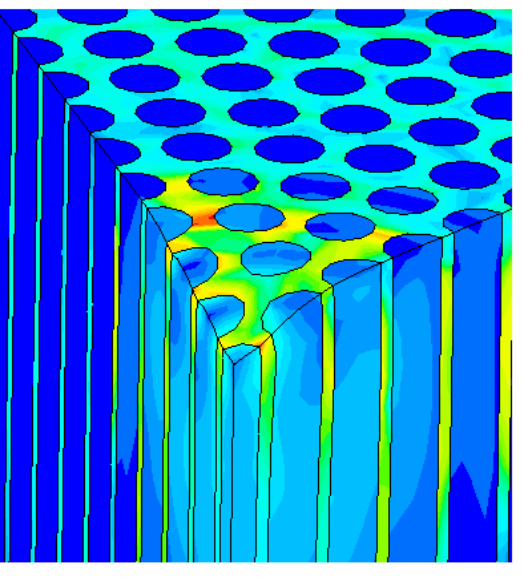
Chapter 8- Surface and mechanical properties of porous anodic aluminum oxides (AAO) were achieved by means of scanning electron microscope (SEM), atomic force microscope (AFM), indentation tests and finite elements method (FEM) simulations. A two-step anodized mesoporous anodic aluminum oxide was successfully fabricated vertically and hollowly. Both microindentation and nanoindentation were carried out. The results showed that the nanoporous AAO was hydrophobic with a contact angle of 105° while the nanoporous-filled AAO is in a relatively good wettability. Localized pop-in can be found during nanoindentation due to the collapse of the beneath cylindrical structures. Over a certain load, microindentation may induce radial cracks from the indented edge to outward of the AAO. The underside of the indented AAO sample was milled to figure out the structural changes. The effects of the nanoporous filling on the Young's modulus and the hardness are investigated and discussed. A three-dimensional finite element model was also successfully developed to understand the nanoindentation-induced mechanism. A maximum von Mises stress of 1.058 GPa occurred beneath the indenter.
Chapter 9- Research on Porous Silicon (PS) is being pursued since their discovery for use in optoelectronics, solar cells and sensors. Silicon containing nano size (10-15 nm) pores produced by electrochemical anodization has the well-known potential advantage of enhanced light trapping inside the material. Also its low reflectance loss makes it suitable for optoelectronic and photovoltaic applications. However, the lack of stability due to ageing effect because of slow native oxidation could not make PS a promising material so far. To overcome this instability problem, recently an idea of Quasi Monocrystalline Porous Silicon (QMPS), a modified form of PS was conceived. When low porosity (~ 20-30%) porous silicon is thermally annealed in the temperature range, 1050-1100C and in pure H2 ambient, the nanopores get transformed both in shape and size, resulting in QMPS. During annealing, the open pore channels on the surface of PS layer become closed and pore-free smooth surface is formed as monocrystalline silicon, with nano-size voids embedded inside the body that might help in the enhanced optical absorption. The presence of nano voids and favorable electrical properties as that of silicon makes QMPS suitable as active layer for low-cost solar cells. Researchers have also used this material as passive seed layer for epitaxial growth for solar cell fabrications. A few researchers have investigated the structural, optical and electrical properties but fabrication of solar cells using QMPS as an active layer is yet to be achieved. However, the primary theoretical modeling has indicated that about 15 – 16% efficiency solar cells are possible to be targeted. Modeling on optical absorption and carrier concentration of QMPS layers have also been done in detail. Further studies can be performed on the effect of variation of the size of nanopores during formation either by thermal annealing or by laser and thermal annealing on the properties of QMPS. Study of QMPS/p+ Si interface in detail may also be very interesting in order to get a quantitative idea of defect density, nature of trapping states etc. There is an ample scope of studies with QMPS since the material is still in the initial stage of investigation and it can bring forth a sensational advancement in the important areas of optoelectronics and solar cells in terms of high efficiency, low cost and relatively easy device fabrications.
Chapter 10- The use of low dielectric constant (low-k) interdielectrics in multilevel structure integrated circuits (ICs) can lower line-to-line noise in interconnects and alleviate power dissipation issues by reducing the capacitance between the interconnect conductor
Samuel B. Jenkins xii
lines. Because of these merits, low-k interdielectric materials are currently in high demand in the development of advanced ICs. One important approach to obtaining low-k values is the incorporation of nanopores into dielectrics. The development of advanced ICs requires a method for producing low-k dielectric materials with uniform distributions of unconnected, closed, individual pores with dimensions considerably smaller than the circuit feature size. Thus the control of both pore size and pore size distribution is crucial to the development of nanoporous low-k dielectrics. This article reviews recent developments in the imprinting of closed nanopores into spin-on materials to produce low-k nanoporous interdielectrics for the production of advanced ICs. This review further provides an overview of the methodologies and characterization techniques used for investigating low-k nanoporous interdielectrics.
Chapter 11- Porous silicon (PS) films consisting of many pores and pillars are widely used to yield efficient visible photoluminescence (PL) and electroluminescence (EL) at room temperature. Such light-emission behaviors are primarily attributed to electron confinement in the nanocrystals that constitute the PS film. Also, the PS film shows a unique electrical property of negative difference conductance (NDC) for the carrier mobility difference in different sizes of pores and pillars.
The techniques of PS formation have been developed by many different methods. Among them, electrochemical anodization is the most commonly used. The anodization is performed in a hydrogen fluoride (HF) solution with an anodic current on the sample. However, it is very difficult to control the manufacturing parameters precisely in the manufacturing processes. Especially in nano-scale, the anisotropic etching or selective etching cannot be easily achieved in the wet-etching method. However, it is well known that nano-scaled PS (NPS) shows light emission more readily in the visible range than macro-PS does. Therefore, precise control of the NPS formation is very important.
In this chapter, the authors introduce three novel manufacturing technologies. In the first method, the Hall-effect is applied in the electrochemical anodization. By Lorentz force, the carriers can be well swept to the allocated areas. In the second method, a forward biased pn-junction is used for bottom-hole assistance. The NPS films with nano-scaled pores and high-aspect-ratio pillars can be formed. In the third method, the authors proposed a simple and mask-free method for the fabrication of patterned PS using a localized electric field. The electric field is applied by patterned electrodes (anode and cathode) which are placed horizontally underneath the sample. No masking-layer or related photo-lithography processes are needed in this method. Strong visible photoluminescence emissions in PS can be obtained by these novel methods.
In addition, the surface roughness of NPS leads to a high contact resistance to the metal layer of the applications on EL, and hence a waste of an electrical power. To enhance the EL efficiency and stabilize performance, a good metal contact to the light-emitting layer (NPS layer) is required. In the authors‘ study, a supercritical fluid (SCF) technique is explored to overcome the processing problem on metal contact. The SCF is a liquid or gas material used in a state above the critical temperature and critical pressure where gases and liquids can coexist. The use of a CO2 SCF and silver (Ag) nanoparticles is shown to improve the electrical contact between the metal and NPS. Therefore, the contact resistance can be largely reduced, and the power consumption of EL on the PS structure can be greatly reduced by the method.

Preface xiii
The morphology, porosity, and photoluminescence of the NPS prepared by the proposed method are investigated. This novel technology will have much benefit in the applications of nano-electronic and opto-electronic devices.

In: Nanoporous Materials Types, Properties and Uses ISBN: 978-1-61668-182-1 Editor: Samuel B. Jenkins, pp. 1-44 © 2010 Nova Science Publishers, Inc.
Chapter 1
THE DYNAMICS OF INFILTRATION OF A
NANOPOROUS MEDIA WITH A NONWETTING LIQUID
V. D. Borman and V. N. Tronin National Research Nuclear Univrsity MEPHI , Moscow, Russia
1. INTRODUCTION
After compression of a system formed by a nanoporous media and a nonwetting liquid to the threshold pressure value 0cp , the liquid fills the pores of a porous media. In accordance with prevailing concepts, passage of the liquid from the bulk to the dispersed state can be described as a percolation-type transition [1]. The percolation-type spatial distribution of pores filled with the liquid is confirmed by the ―devil‘s staircase‖ effect involving the change
in the resistance of a porous media (porous glass) upon its infiltration with mercury in the vicinity of the threshold infiltration pressure [2]. The percolation type of infiltration of porous media is also confirmed by the ―viscous fingers‖ effect, in which a wetting liquid is displaced from pores by some other liquid [3]. In this case, a nonuniform front of porous media infiltration is formed. This process is typical of infiltration of macroscopic porous bodies with wetting liquids. The threshold type of infiltration was observed for nonwetting liquids, for grained porous media (zeolites) with a pore size of R = 0.3–1.4 nm and silochromes (R = 4–
120 nm) filled with nonwetting liquid metals, and for hydrophobized granular porous bodies with a silicon oxide skeleton (R = 3-50 nm) filled with water, ethylene glycol, or salt solutions [4–21]. The grain size in [4–20] was 1–100 µm.
To fill nanometer-size pores with a nonwetting liquid with a surface energy of 0.05–0.50 J/m2, a threshold pressure of 0cp = 102
–103 atm is required. When the liquid passes from the bulk to the dispersed state in a nanoporous media with a specific volume of 1 cm3/g, the energy absorbed by the liquid and returned (accumulated) when the liquid flows out amounts to 10–100 kJ/kg. This value is an order of magnitude higher than for polymer composites or alloys with the shape memory effect, which are widely used now [20]. This forms the basis
V. D. Borman and V. N. Tronin 2
for devices for mechanical energy absorption and accumulation. Bogomolov [23] was the first to indicate such a possibility of accumulating mechanical energy. It should be noted that 1 kg of a porous material is sufficient for absorbing the energy of a media having a mass of 1 t and moving at a velocity of 50 km/h.
In earlier publications, infiltration of pores in a porous media was described in the mean field approximation as a percolation transition in an infinitely large porous media [1]. The pore volume filled under a pressure p was calculated as of the volume of an infinitely large cluster formed by pores with a radius larger (in accordance with the Laplace pressure) than the minimal radius of the pores accessible to the nonwetting liquid under the given pressure. The mean field approximation using the Bethe lattice makes it possible to qualitatively describe the dependence of the filled volume on pressure in the vicinity of threshold 0cp only under the assumption of a special asymmetric size distribution for pores [1].
In contrast to second-order phase transitions including the percolation transition [26], the systems under investigation exhibit an infiltration-defiltration hysteresis, as well as (complete or partial) nonoutflow of the nonwetting liquid from the porous media when the excess pressure drops to zero [5-7, 10-21]. It should be noted that the nondefiltration restricts the application of the system for energy absorption and accumulation, while hysteresis controls the absorbed and accumulated energy (returned during defiltration).
It was shown in [9, 21] that during slow infiltration of the systems under investigation, the pressure dependence of variation )( pV in the volume of liquid in a porous media in the infiltration-defiltration cycle (hysteresis) and the volume of the liquid remaining in pores can be described by percolation theory if we take into account energy barrier ),( pRA of the fluctuational infiltration-defiltration of the liquid in a pore of radius R. Condition
0),( pRA for porous medias with a certain pore size distribution makes it possible to find the pressure that corresponds to the access of a pore of radius R to infiltration in a system of connected pores. For porous media, this condition generalizes the Laplace relation. With increasing pressure, the number of pores accessible to infiltration increases and the pores surrounding the given one may also become accessible. Thus, a cluster of accessible pores is formed in the porous media.
For the systems studied in [9, 21], infiltration of porous medias upon a slow change in pressure is observed in the vicinity of the percolation threshold for such a fraction ( )p of the volume of accessible pores, for which the inequality 42
00 1010/)( cc p holds,
where 0c
is the percolation transition threshold ( 18.00 c for 3D systems [24, 25]). This
means that when the grain size of the porous media is L ~ (102-104) R , where R is the mean
pore radius in a grain ( R ~ 1-10 nm), correlation length v
cR 0 ( 8.0v [24,
25]) becomes comparable to grain size L or exceeds it ( L ). This allows us to treat the infiltration of a grain of the porous media as a spatially uniform process.
If the characteristic time P of variation in pressure is much longer than characteristic
hydrodynamic time z , of nonthreshold ( 0),( pRA ) infiltration of clusters of accessible pores, the volume of the liquid in the porous media at a given pressure can be calculated if the distribution function for accessible-pore clusters over the number of pores in them is known
The Dynamics of Infiltration of a Nanoporous Media with a Nonwetting Liquid 3
[20]. Infiltration first occurs from the grain surface, and then the liquid flows via clusters of filled pores to the clusters of accessible pores.. Thus, infiltration of grains of a porous media with a non-wetting liquid for P >> z can be described as infiltration of clusters formed by accessible pores. In view of the small grain volume, we can disregard the spatial non-uniformity in the formation of clusters of accessible pores.
It was shown in [27, 28] that upon rapid compression (with a pressure growth rate of p
= 104-105 atm/s) of the systems formed by a silochrome SKh 1.5 granulated porous media and Wood‘s alloy or a Fluka 100 hydrophobized granulated porous media and water, infiltration takes place beyond the percolation threshold at a pressure considerably exceeding threshold pressure pс0. The threshold pressure was 0p =1.6pc0 for the former system [27] and
0p =2pc0 for the latter system [26]. Infiltration is also associated with irregular oscillations in pressure [27]. It follows hence that when the characteristic time of compression of the system decreases, the mechanism of infiltration of the porous media changes. However, the mechanism of infiltration of the porous media under fast compression remains unclear.
To reveal the regularities of infiltration of a nanoporous media with a nonwetting liquid is of fundamental importance for understanding the dynamics of percolation transition and of practical interest for the development of shock-absorbing systems.
In Section 2, we will study experimentally the infiltration-defiltration process for systems consisting of a Libersorb 23 (L23) hydrophobic granular nanoporous media and water or an aqueous solution of CaCl2 for pressure compression rates of p > 104 atm/s in the situation
when the characteristic time P of pressure growth is shorter than the characteristic time z
of non-threshold hydrodynamic infiltration of clusters of accessible pores. New regularities in threshold infiltration under rapid compression are established, which noticeably distinguish the infiltration process in this case from infiltration of a nanoporous media under slow variation in pressure.
It can be expected that upon an increase in compression rate and a decrease in time P as
compared to z , the fraction of accessible pores increases and the system is ―thrown‖ beyond
the percolation threshold. In this case, an ―infinitely large‖ cluster of accessible pores is
formed in each grain, and the fraction of such pores increases so that the medium of pores in the grain becomes virtually homogeneous. Consequently, upon a decrease in ratio P / z , infiltration must be in compliance with the Darcy law [29] upon an increase in pressure, and the infiltration time of the porous media must decrease. However, it was found that infiltration pressure 0p in the systems under investigation is independent (within the experimental error) of the compression energy and, hence, of the pressurization time. During infiltration of the porous media, the new value of threshold pressure 0p remains unchanged and the filled volume is determined not by the fraction of accessible pores, but by the compression energy. For 0p p , the liquid does not infiltrate the porous media. Thus, it was found that pulsed compression of the systems studied here leads to the emergence of a threshold infiltration pressure 0p higher than pressure 0cp of the percolation transition
observed for P >>z . It was also found that the area of the infiltration-defiltration hysteresis
V. D. Borman and V. N. Tronin 4
loop under rapid compression is larger than for P >>z . This indicates the emergence of an
additional dissipation mechanism. We can naturally It associate this additional dissipation with a flow of the viscous liquid in a porous media. It was found, however, that the experimental time dependences of pressure and volume for the systems studied here do not change (within experimental error) upon a fivefold change in the viscosity of the liquid. Thus, it is established that the infiltration rate in grains of a hydrophobic nanoporous media is independent of the viscosity of the liquid.
In Section 3, a model describing the dynamics of infiltration in a granular porous material is constructed. It is assumed that infiltration in grains occurs independently and a pressure-dependent distribution of accessible pore clusters is formed in each grain. Under fast compression, infiltration occurs at a pressure of 00 cpp . For the systems studied here,
00 2.1 cpp , and more than 70% of all pores become accessible to infiltration. According to estimates, infiltration of a grain of a porous media under rapid compression
occurs when the fraction of accessible pores is 28.00 , which is higher than percolation threshold 18.00 c . In this case, the porous media is beyond the percolation threshold for accessible pores and an infinitely large cluster of accessible pores (whose size coincides with the size of the grain), surrounded by smaller clusters of accessible pores, is formed in each grain of the porous media. Finite-size clusters contain about 20% of all pores in the porous media, while the infinitely large cluster contains 80% of all accessible pores. For this reason, infiltration in a grain of the porous media under rapid compression will be described as rapid infiltration of liquid into finite-size clusters of accessible pores occurring simultaneously in the entire space of pores in a grain, followed by slow percolation of the liquid from these clusters into the growing infinitely large cluster of accessible pores. Obviously, no infiltration front is formed in this case over time intervals of percolation of the liquid into the infinitely large cluster.
For P >z , infiltration of a liquid into a porous media is described as percolation of the
liquid from a cluster of filled pores to a cluster of accessible pores, while for P <z , the
process is the percolation of the liquid from a cluster of filled pores to the infinitely large cluster of accessible pores. We solve a system of kinetic equations constructed for coordinate-independent distribution functions for clusters of accessible and filled pores and which describe these process is solved for slow and fast infiltration.
In the case of slow infiltration, a new result is the divergence of the characteristic time
v of infiltration in pores of a grain at percolation threshold 0c via accessible pores (critical retardation). In the case of fast infiltration, solution of the system of kinetic equation implies that infiltration must occur at a constant pressure 0p . For
0p p , infiltration should not be
observed. Pressure 0p and characteristic time v are controlled by the characteristic time of
pressurization in the vicinity of the new value of infiltration threshold c , which is higher
than the known percolation threshold. Quantity c is a universal characteristic for porous
bodies, and pressure 0cp p corresponding to it is determined by the size distribution of pores and by surface energies of the liquid and the interface between the liquid and the porous media.
The Dynamics of Infiltration of a Nanoporous Media with a Nonwetting Liquid 5
The solution of the system of kinetic equations leads to another new result, viz., nonlinear response of the medium to external action, which is manifested in the compensation of this action due to percolation of the liquid from the cluster of filled finite-size pores to an infinitely large cluster of accessible but unfilled pores. As a result of such compensation, infiltration must be independent of the viscosity of the liquid. Infiltration must be accompanied by oscillations of pressure and smaller oscillations of the volume.
The resultant time dependences of pressure and volume under rapid compression, as well as the dependences of p0, the maximum filled volume, and the total infiltration time on the compression energy, successfully describe the experimental data for systems L23 + H2O and L23 + CaCl2 under investigation (Section 4). The domain of applicability of the proposed model of infiltration dynamics of nanoporous bodies is also considered in this section.
This work is the result of rsearch carrrier out in following articles: V. D. Borman, A. M. Grekhov, and V. I. Troyan, Zh. Éksp. Teor. Fiz. 118 (1), 193 (2000) [JETP 91 (1), 170 (2000)], V. D. Borman, A. A. Belogorlov, A. M. Grekhov, G. V. Lisichkin, V. N. Tronin, and V. I. Troyan, Zh. Éksp. Teor. Fiz. 127 (2), 431 (2005) [JETP 100 (2), 385 (2005)], V. D. Borman, A. A. Belogorlov, A. M. Grekhov, G. V. Lisichkin, V. N. Tronin, and V. I. Troyan, Pis‘ma Zh. Tekh. Fiz. 30 (23), 1 (2004) [Tech. Phys. Lett. 30 (12), 973 (2004)], V. D.
Borman, A. A. Belogorlov, A. M. Grekhov, V. N. Tronin, and V. I. Troyan, Pis‘ma Zh. Éksp.
Teor. Fiz. 74 (5), 287 (2001) [JETP Lett. 74 (5), 258 (2001)], V. D. Borman, A. A. Belogorlov, G. V. Lisichkin, V. N. Tronin, and V. I. Troyan JETP, Vol. 108, No 3, March 2009.
2. EXPERIMENTAL TECHNIQUE AND RESULTS
In experiments, the dynamics of infiltration of water and aqueous solutions of CaCl2 in
Libersorb 23 (L23) granular nanoporous media with a mean pore radius of 5.6R nm was studied This porous media is KSK-G silica gel with SiO2 as the skeleton material, whose surface was chemically modified in accordance with the technique described in [29] to impart hydro-phobic properties to the surface. The specific surface of L23 is approximately 200 m2/g, its specific volume is 0.56 cm3/g, and the mean grain size of the powder of the porous media is 10 m. A sample of the porous media 2-10 g in mass was placed in a container permeable to the liquid in a high-pressure chamber with a volume of ~60 cm3. The chamber was filled with a liquid (water or 25% (in mass) aqueous solution of CaCl2). A movable 180-mm-long rod 10 mm in diameter was inserted through a seal in the cover of the chamber.
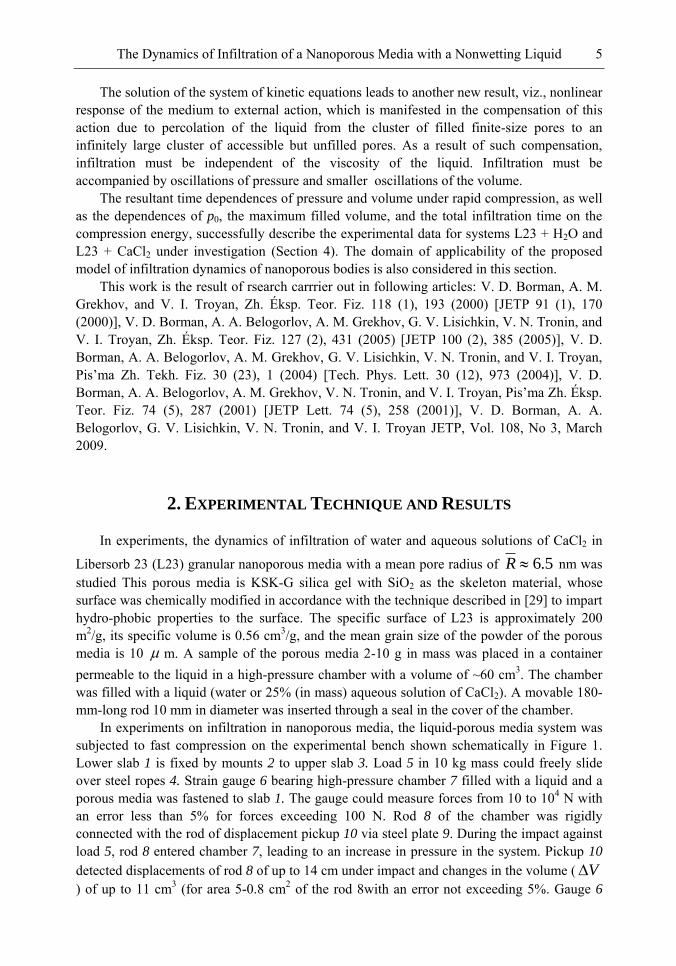
In experiments on infiltration in nanoporous media, the liquid-porous media system was subjected to fast compression on the experimental bench shown schematically in Figure 1. Lower slab 1 is fixed by mounts 2 to upper slab 3. Load 5 in 10 kg mass could freely slide over steel ropes 4. Strain gauge 6 bearing high-pressure chamber 7 filled with a liquid and a porous media was fastened to slab 1. The gauge could measure forces from 10 to 104 N with an error less than 5% for forces exceeding 100 N. Rod 8 of the chamber was rigidly connected with the rod of displacement pickup 10 via steel plate 9. During the impact against load 5, rod 8 entered chamber 7, leading to an increase in pressure in the system. Pickup 10
detected displacements of rod 8 of up to 14 cm under impact and changes in the volume ( V) of up to 11 cm3 (for area 5-0.8 cm2 of the rod 8with an error not exceeding 5%. Gauge 6
V. D. Borman and V. N. Tronin 6
measured force F exerted by the load on the rod and, hence, the pressure in the chamber (p =
F/S). The frequency range of the force and displacement pickups with a constant sensitivity was limited by a frequency of 5 kHz. Signals from the pickups were detected via an analog-to-digital converter and processed by a computer. The pressuriza-tion rate in experiments was p = (1-8) x 104 atm/s. Energy E of the impact varied from 20 to 100 J.
Figure 1. Experimental bench for studying the dynamics of infiltration of a nonwetting liquid in nanoporous bodies
Infiltration of water (L23 + H2O) and 25% aqueous solution of CaCl2 (L23 + CaCl2) into porous media L23 for a low pressurization rate ( p ≤ 1 atm/s) was also studied for comparison. For this purpose, we used the setup described in [20], which ensured a slow variation in pressure and measurement of the change in volume of the system (i.e., the volume of the liquid infiltrating the porous media at a fixed pressure). Additionally, total compressibility of the chamber and the liquid ( = (4.5 ± 0.4) x 10-3 cm3/atm for water and = (3.1 ± 0.3) x 10–3 cm3/atm for an aqueous solution of CaCl2), as well as compressibility = (1.8 ± 0.2) x 10–3 cm3/atm of the empty porous media, were measured in experiments when the chamber was filled with a liquid without a porous media. The reproducibility of infiltration—defiltration of the CaCl2 solution in the porous media indicated the absence of segregation of the salt in the pores of L23.
The Dynamics of Infiltration of a Nanoporous Media with a Nonwetting Liquid 7
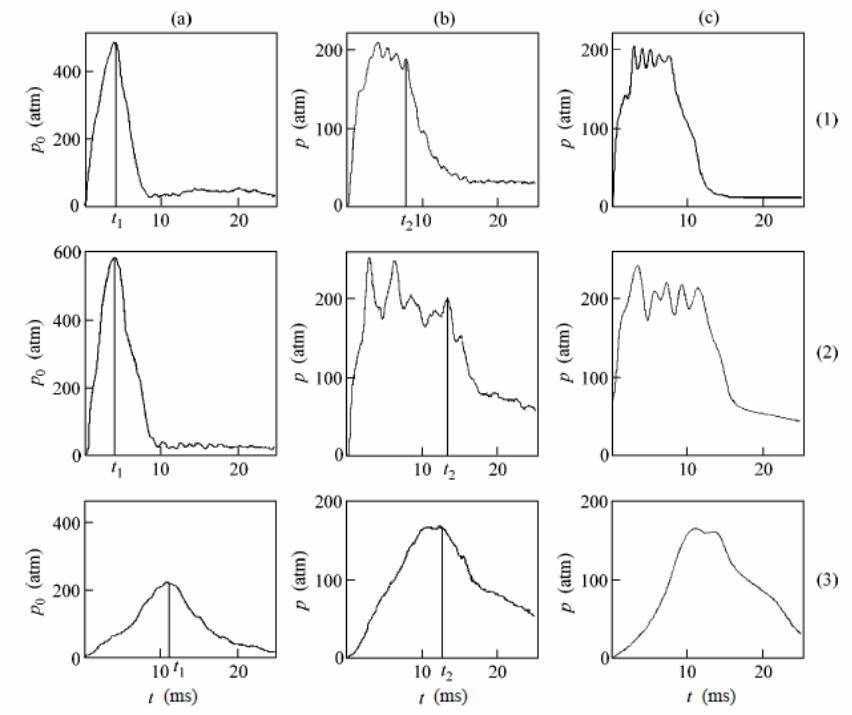
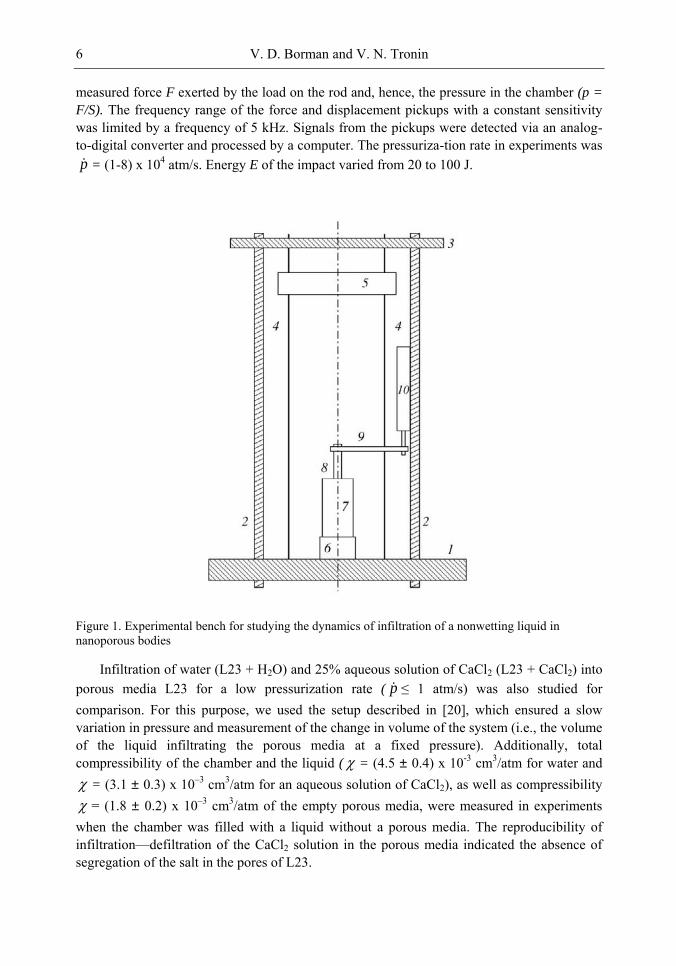
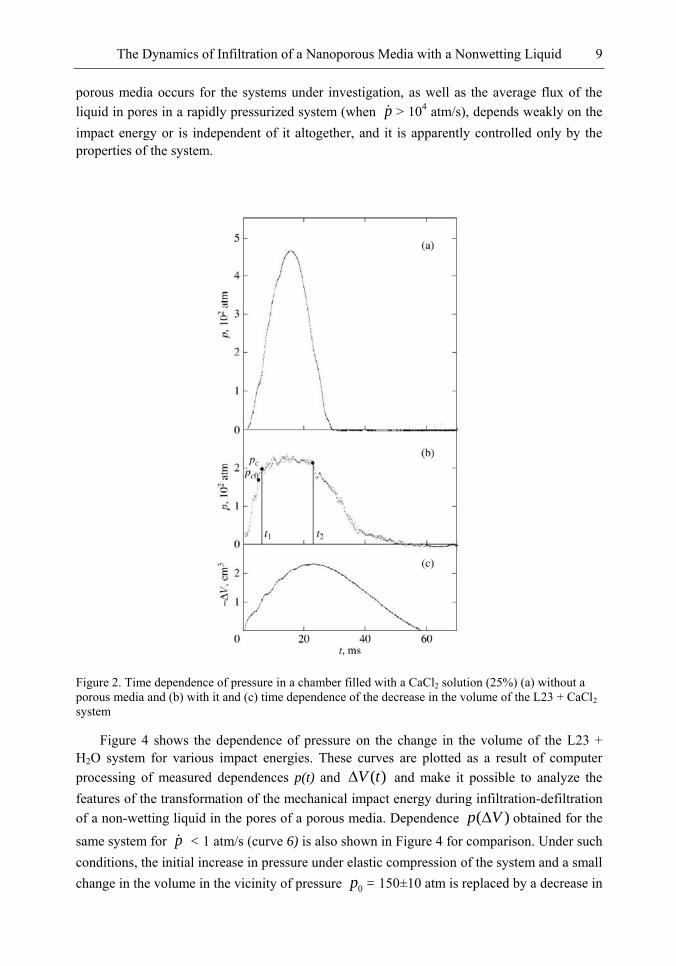
Figure 2 shows the time dependences of pressure in the chamber filled only with the liquid (aqueous solution of CaCl2 with a volume of 60 cm3), as well as the time dependence of pressure and volume in the case when the chamber was filled with the aqueous solution of CaCl2 (with a volume of 55 cm3) and the L23 porous media with a mass of m = 4 g. These curves were obtained for an impact energy of E = 40 ± 2 J. For the L23 + H2O and L23 + CaCl2 systems studied here at pressurization rate p > 104 atm/s, irregular oscillations of pressure took place; similar oscillations were observed in the liquid Wood‘s alloy-silochrome SKh-1.5 system [28] It should be noted that the amplitude of irregular volume oscillations predicted in [28] is much lower in the systems studied here than the amplitude of pressure oscillations. It follows from Figures 2a and 2b that in contrast to elastic compression of the chamber with the liquid, the increase in pressure in the porous media-liquid system is limited by the value of pressure 0p = 205 ± 10 atm averaged over irregular oscillations. Figure 2b
shows for comparison the value of pressure 0cp = 180 atm corresponding of the threshold of
infiltration of the CaCl2 solution into pores of L23 for a low pressurization rate p ≤1 atm/s.
The threshold values of pressure for the L23 + H2O system are 0cp = 150 ± 8 atm and 0p =
180 ± 9 atm. Quantity 0cp is defined as the pressure at which the compressibility of the infiltrated liquid-porous media system is maximum. The characteristic time of the increase in pressure from 0cp to 0p is 1t = 2 ms, which corresponds to a pressurization rate of p
1.2x10⁴ atm/s. It can be seen that for p > 104 atm/s, the volume of the system decreases at a
pressure p0 higher than the percolation transition pressure 0cp [9, 21] in the case of slow
infiltration. The duration of compression of the system is controlled by time 2t = 23 ms, at which the decrease in volume is maximum. During the time interval from zero to t1, the decrease in the volume of the system is – V = 1.10 ± 0.05 cm3 and is equal (to within the measurement error) to the decrease in volume – V = 1.00 ± 0.05 cm3 due to compressibility of the chamber, liquid, and porous media. In time interval t1 – t2, the value 0p of the pressure averaged over oscillations is constant; consequently, the observed change in the volume (see Figure 2c) is associated not with the compressibility of the chamber and system, but with the infiltration through the pores of the porous media. Thus, infiltration of pores begins at a pressure 0p higher than the percolation transition pressure; maximum infiltration (change in the volume of the system) is attained at instant t2, and the entire process of infiltration occurs at a constant pressure 0p averaged over oscillations. Maximal infiltration at t = t2 is mV =
1.20±0.05 cm3, which is smaller than the volume Vpore = 2.3 cm3 of pores in the sample; i.e., for impact energy E = 40 J, infiltration of liquid through accessible pores in the sample with the mass of m = 4 g does not occur. According to estimates, the work of compression (Eel =
432 J) in the time interval from 0 to t2 coincides with impact energy E = 40 + 2 J to within the measurement error. Over time intervals t > t2, the increase in the volume of the system and chamber is associated with the removal of elastic stresses and defiltration of the liquid from the pores of the porous media. Dependences analogous to those depicted in Figure 2 are also observed for the L23 + H2O system.
V. D. Borman and V. N. Tronin 8
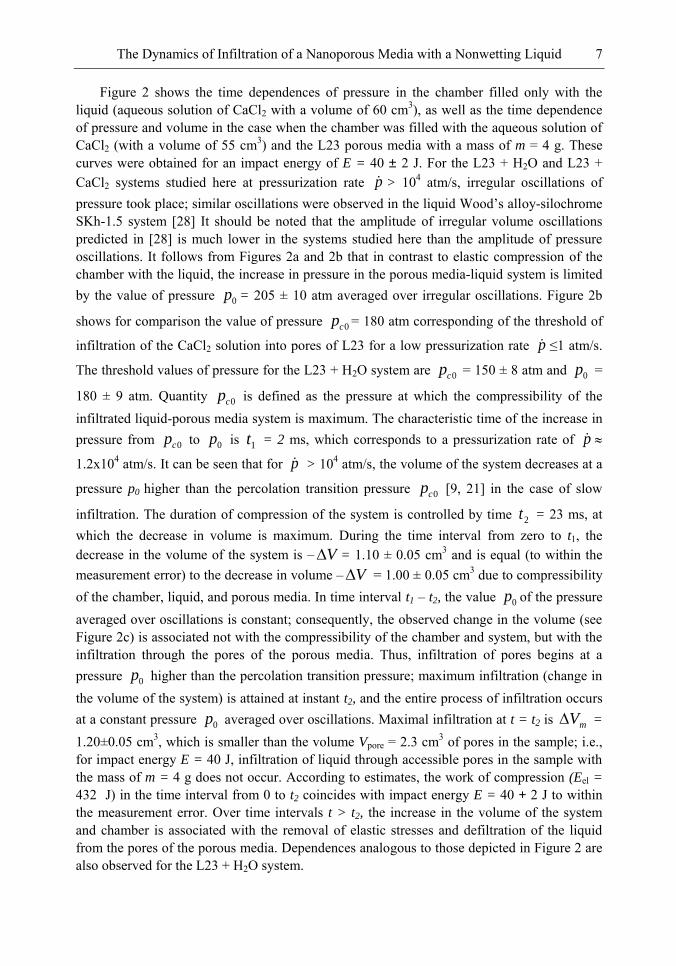
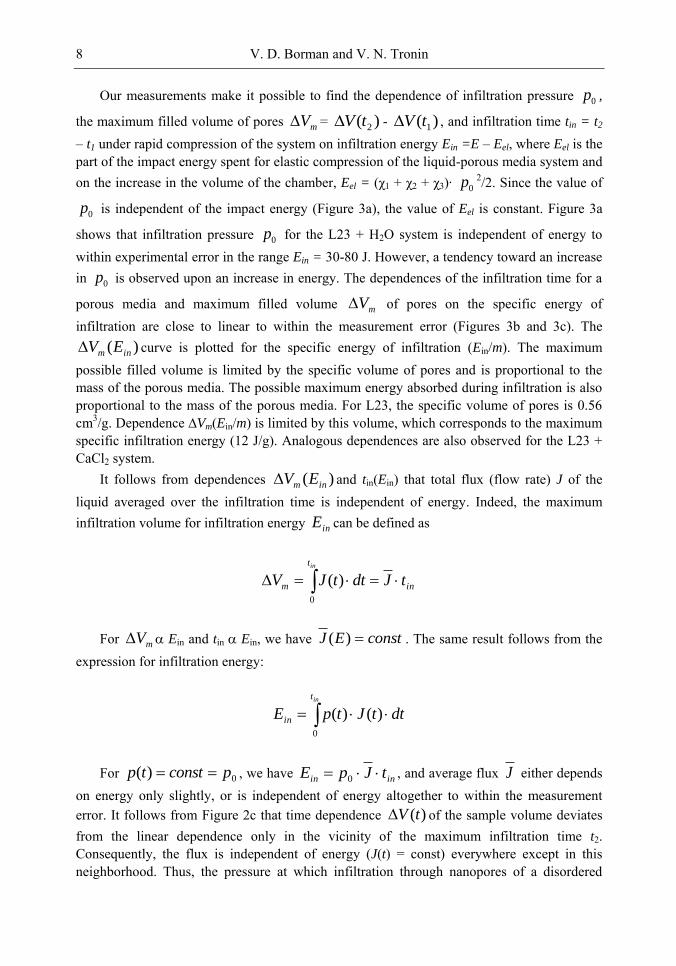
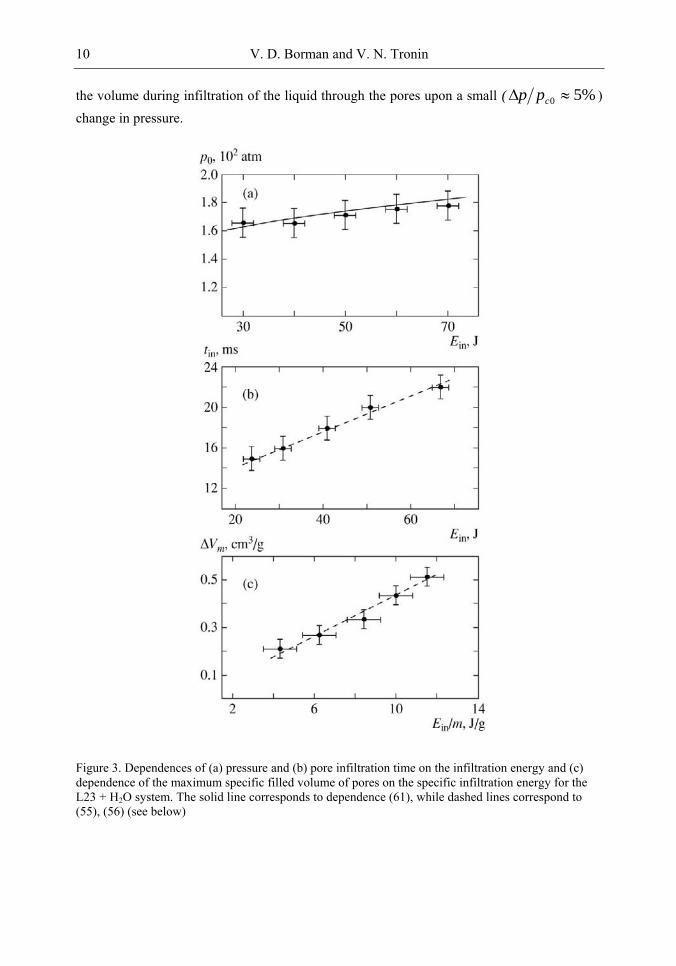
Our measurements make it possible to find the dependence of infiltration pressure 0p ,
the maximum filled volume of pores mV = )( 2tV - )( 1tV , and infiltration time tin = t2
– t1 under rapid compression of the system on infiltration energy Ein =E – Eel, where Eel is the part of the impact energy spent for elastic compression of the liquid-porous media system and on the increase in the volume of the chamber, Eel = (χ1 + χ2 + χ3)· 0p 2/2. Since the value of
0p is independent of the impact energy (Figure 3a), the value of Eel is constant. Figure 3a
shows that infiltration pressure 0p for the L23 + H2O system is independent of energy to within experimental error in the range Ein = 30-80 J. However, a tendency toward an increase in 0p is observed upon an increase in energy. The dependences of the infiltration time for a
porous media and maximum filled volume mV of pores on the specific energy of infiltration are close to linear to within the measurement error (Figures 3b and 3c). The
)( inm EV curve is plotted for the specific energy of infiltration (Ein/m). The maximum possible filled volume is limited by the specific volume of pores and is proportional to the mass of the porous media. The possible maximum energy absorbed during infiltration is also proportional to the mass of the porous media. For L23, the specific volume of pores is 0.56 cm3/g. Dependence ∆Vm(Ein/m) is limited by this volume, which corresponds to the maximum specific infiltration energy (12 J/g). Analogous dependences are also observed for the L23 + CaCl2 system.
It follows from dependences )( inm EV and tin(Ein) that total flux (flow rate) J of the liquid averaged over the infiltration time is independent of energy. Indeed, the maximum infiltration volume for infiltration energy inE can be defined as
int
inm tJdttJV0
)(
For mV Ein and tin Ein, we have constEJ )( . The same result follows from the expression for infiltration energy:
int
in dttJtpE0
)()(
For 0)( pconsttp , we have inin tJpE 0
, and average flux J either depends on energy only slightly, or is independent of energy altogether to within the measurement error. It follows from Figure 2c that time dependence )(tV of the sample volume deviates from the linear dependence only in the vicinity of the maximum infiltration time t2. Consequently, the flux is independent of energy (J(t) = const) everywhere except in this neighborhood. Thus, the pressure at which infiltration through nanopores of a disordered
The Dynamics of Infiltration of a Nanoporous Media with a Nonwetting Liquid 9
porous media occurs for the systems under investigation, as well as the average flux of the liquid in pores in a rapidly pressurized system (when p > 104 atm/s), depends weakly on the impact energy or is independent of it altogether, and it is apparently controlled only by the properties of the system.
Figure 2. Time dependence of pressure in a chamber filled with a CaCl2 solution (25%) (a) without a porous media and (b) with it and (c) time dependence of the decrease in the volume of the L23 + CaCl2 system
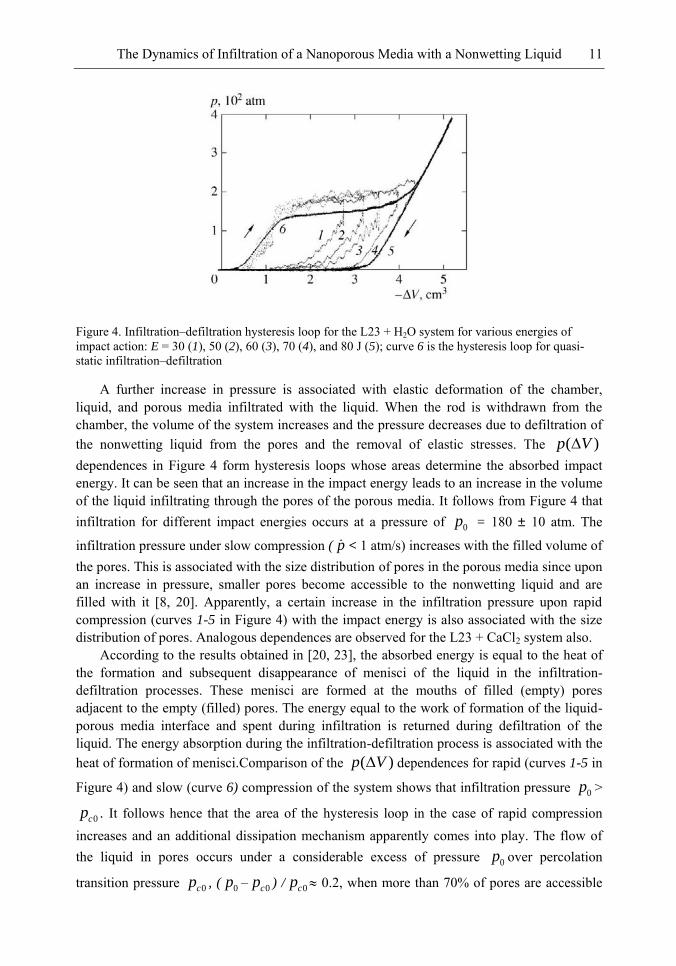
Figure 4 shows the dependence of pressure on the change in the volume of the L23 + H2O system for various impact energies. These curves are plotted as a result of computer processing of measured dependences p(t) and )(tV and make it possible to analyze the features of the transformation of the mechanical impact energy during infiltration-defiltration of a non-wetting liquid in the pores of a porous media. Dependence )( Vp obtained for the
same system for p < 1 atm/s (curve 6) is also shown in Figure 4 for comparison. Under such conditions, the initial increase in pressure under elastic compression of the system and a small change in the volume in the vicinity of pressure 0p = 150±10 atm is replaced by a decrease in
V. D. Borman and V. N. Tronin 10
the volume during infiltration of the liquid through the pores upon a small ( %50 cpp ) change in pressure.
Figure 3. Dependences of (a) pressure and (b) pore infiltration time on the infiltration energy and (c) dependence of the maximum specific filled volume of pores on the specific infiltration energy for the L23 + H2O system. The solid line corresponds to dependence (61), while dashed lines correspond to (55), (56) (see below)
The Dynamics of Infiltration of a Nanoporous Media with a Nonwetting Liquid 11
Figure 4. Infiltration–defiltration hysteresis loop for the L23 + H2O system for various energies of impact action: E = 30 (1), 50 (2), 60 (3), 70 (4), and 80 J (5); curve 6 is the hysteresis loop for quasi-static infiltration–defiltration
A further increase in pressure is associated with elastic deformation of the chamber, liquid, and porous media infiltrated with the liquid. When the rod is withdrawn from the chamber, the volume of the system increases and the pressure decreases due to defiltration of the nonwetting liquid from the pores and the removal of elastic stresses. The )( Vp
dependences in Figure 4 form hysteresis loops whose areas determine the absorbed impact energy. It can be seen that an increase in the impact energy leads to an increase in the volume of the liquid infiltrating through the pores of the porous media. It follows from Figure 4 that infiltration for different impact energies occurs at a pressure of 0p = 180 ± 10 atm. The
infiltration pressure under slow compression ( p < 1 atm/s) increases with the filled volume of the pores. This is associated with the size distribution of pores in the porous media since upon an increase in pressure, smaller pores become accessible to the nonwetting liquid and are filled with it [8, 20]. Apparently, a certain increase in the infiltration pressure upon rapid compression (curves 1-5 in Figure 4) with the impact energy is also associated with the size distribution of pores. Analogous dependences are observed for the L23 + CaCl2 system also.
According to the results obtained in [20, 23], the absorbed energy is equal to the heat of the formation and subsequent disappearance of menisci of the liquid in the infiltration-defiltration processes. These menisci are formed at the mouths of filled (empty) pores adjacent to the empty (filled) pores. The energy equal to the work of formation of the liquid-porous media interface and spent during infiltration is returned during defiltration of the liquid. The energy absorption during the infiltration-defiltration process is associated with the heat of formation of menisci.Comparison of the )( Vp dependences for rapid (curves 1-5 in
Figure 4) and slow (curve 6) compression of the system shows that infiltration pressure 0p >
0cp . It follows hence that the area of the hysteresis loop in the case of rapid compression increases and an additional dissipation mechanism apparently comes into play. The flow of the liquid in pores occurs under a considerable excess of pressure 0p over percolation
transition pressure 0cp , ( 0p – 0cp ) / 0cp 0.2, when more than 70% of pores are accessible
V. D. Borman and V. N. Tronin 12
to infiltration of the nonwetting liquid. In this case, we can naturally assume that the additional energy dissipation is associated with energy losses in the flow of the viscous liquid in nanopores.
To verify this assumption, we performed experiments in which the p(V), p(t), and V(t)
dependences were investigated for the L23 + CaCl2 system under fast and slow compression at temperatures varying from 258 to 323 K. The viscosity of the CaCl2 solution varies by a factor of 5 in this temperature range [30]. However, surface energy of the solution [31] and surface energy of the interface between the porous media and the liquid change upon variation in temperature. These quantities control pressure 0cp ( , ) which determines the percolation threshold of infiltration of the solid. For 3D systems, the percolation threshold is determined by the fraction of pores accessible to infiltration,
18.0)( coPco [3, 9, 21, 25,26]. Here,
)(
3
0 )(3
4)(
copR
c dRRfRp
11)(
0
0
c
cp
pR
f(R) is the size distribution of pores, and is the ratio of the areas of the menisci and of the pore. This relation was obtained for an infinitely large porous media. For a real porous media with a mean pore radius R and a grain size L, the value of 0cp changes by approximately
2 310 10R L , which is smaller than the maximum experimental error.
It was found that in the temperature interval 258-323 K, the value of 0cp (and, hence, the
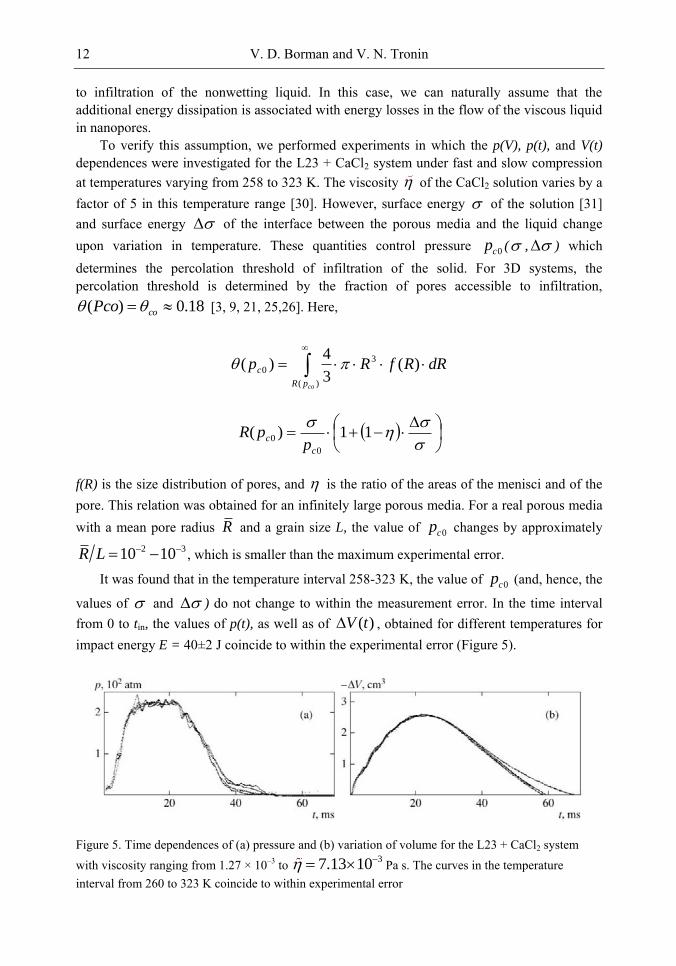
values of and ) do not change to within the measurement error. In the time interval from 0 to tin, the values of p(t), as well as of )(tV , obtained for different temperatures for impact energy E = 40±2 J coincide to within the experimental error (Figure 5).
Figure 5. Time dependences of (a) pressure and (b) variation of volume for the L23 + CaCl2 system with viscosity ranging from 1.27 × 10⁻³ to 37.13 10 Pa s. The curves in the temperature interval from 260 to 323 K coincide to within experimental error
The Dynamics of Infiltration of a Nanoporous Media with a Nonwetting Liquid 13
It follows hence that for the L23 + CaCl2 system under investigation, the infiltration dynamics in the temperature range 258-323 K and the flow of liquid in nanopores are independent of the viscosity of the liquid.
Thus, for a pressurization rate of p > 104 atm/s in the systems studied here, infiltration
of nanopores of a porous media occurs at a constant pressure 0p , which is higher than
percolation transition pressure 0cp . Pressure 0p weakly depends on the impact energy, exhibiting a tendency toward growth within the experimental error (see Figure 3a). The energy dependence of the filled volume of pores and infiltration time are close to linear dependences to within the experimental error (see Figures 3a and 3b), and the mean flux of the liquid in pores is independent of the impact energy. During infiltration, additional dissipation energy is observed as compared to slow infiltration; however, dependences p(t)
and )(tV do not change with temperature or upon a fivefold variation in the viscosity coefficient of the liquid (see Figure 5). It has also been established that the relative amplitude of oscillations of the volume during infiltration is considerably smaller than the relative amplitude of pressure oscillations.
3. MODEL OF INFILTRATION DYNAMICS FOR A POROUS MEDIA
3.1. Formulation of the Problem
Let us consider the dynamics of infiltration of grains in a disordered nanoporous media containing pores of different sizes and immersed in a nonwetting liquid. We assume that infiltration in grains occurs independently. At the initial instant, pores in each grain are empty and the liquid pressure is zero. As the pressure increases and attains a critical value, infiltration begins in the grains of the porous media. The problem involves the calculation of the time dependence of a filled volume, V(t), at a preset pressure p(t) with a characteristic time p of increasing pressure for various relations between this time and the characteristic
hydrodynamic time of infiltration of the porous media. Speaking of infiltration in the porous media, we will henceforth mean in all cases the infiltration of one of its grains, unless the opposite is specially stipulated. Obviously, infiltration may occur in a grain only if the pores form a connected system in it. Porosity defined as the ratio of the pore volume to the volume of a grain in the porous media must be such that the fraction of connected pores is considerably larger than the fraction of pores that do not belong to the connected system. If size L of the grains of the porous material is much than the maximum size of the pores, the characteristics of a grain of the porous media are indistinguishable from the characteristics of an infinitely large media to within R/L ~ 10-4-10-2. In this case, infiltration through all pores of the gain may occur only when porosity exceeds percolation threshold c , which is a characteristic of an infinitely large porous media. For 3D systems, the percolation threshold is
0.18c [2,25,26]; the connectivity of pores with one another in this case is the result of
the formation of infinitely large clusters of pores for c . For porous media with porosity
V. D. Borman and V. N. Tronin 14
near percolation threshold c , this cluster is strongly rarefied and contains only about 1% of the total number of pores in the porous media [25,26, 32]. For porous media with a porosity c , the number of pores in the infinitely large cluster increases with ,
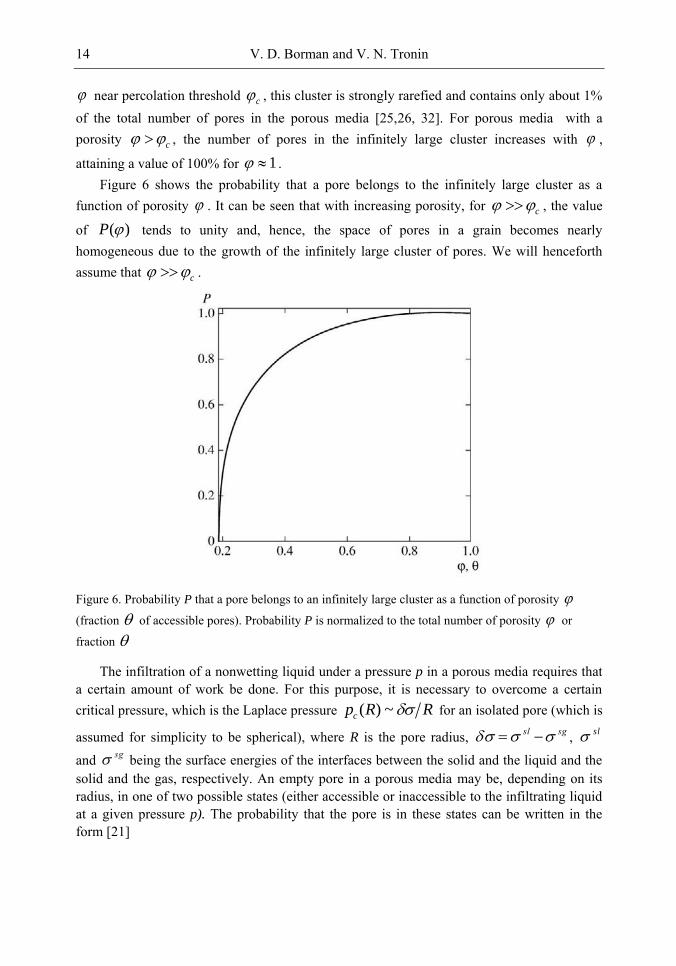
attaining a value of 100% for 1 . Figure 6 shows the probability that a pore belongs to the infinitely large cluster as a
function of porosity . It can be seen that with increasing porosity, for c , the value
of ( )P tends to unity and, hence, the space of pores in a grain becomes nearly homogeneous due to the growth of the infinitely large cluster of pores. We will henceforth assume that c .
Figure 6. Probability P that a pore belongs to an infinitely large cluster as a function of porosity
(fraction of accessible pores). Probability P is normalized to the total number of porosity or
fraction
The infiltration of a nonwetting liquid under a pressure p in a porous media requires that a certain amount of work be done. For this purpose, it is necessary to overcome a certain critical pressure, which is the Laplace pressure ( ) ~cp R R for an isolated pore (which is
assumed for simplicity to be spherical), where R is the pore radius, sgsl , sl
and sg being the surface energies of the interfaces between the solid and the liquid and the solid and the gas, respectively. An empty pore in a porous media may be, depending on its radius, in one of two possible states (either accessible or inaccessible to the infiltrating liquid at a given pressure p). The probability that the pore is in these states can be written in the form [21]
The Dynamics of Infiltration of a Nanoporous Media with a Nonwetting Liquid 15
1
,exp1,
TRpA
Rpwi (1)
where
3
, 1 1A p R pR
RpA , is the work that must be done to fill a pore of radius R with a liquid under pressure p; T is the temperature; and is the surface energy of the liquid, is the ratio of the meniscus surface area to the pore surface area.
It can be seen from expression (1) that if 0, RpA , then probability 1~w and a
pore can be filled with the liquid; if, however, 0, RpA , we have 0w and the pore becomes inaccessible. Consequently, the homogeneous space of pores with various sizes during infiltration at a preset pressure is divided into pores that can be filled, 0, RpA
(accessible pores) and pores that cannot be filled, 0, RpA (inaccessible pores). Thus, we can assume that the medium subjected to infiltration is a heterogeneous medium consisting of accessible and inaccessible pores playing the role of white and black spheres, respectively, in percolation theory [25]. Such a medium can experience a percolation transition occurring via the formation of clusters of accessible pores followed by infiltration of a nonwetting liquid in such formations. In the general case, percolation threshold 0c for
accessible pores does not coincide with c . However, for c , in view of the homogeneity of the pore space, we can consider pores together with the skeleton material surrounding them (thick-wall pores) and analyze percolation through these pores. In this case, the percolation threshold for accessible pores and for porosity obviously coincide ( 0c = c ).
In a porous media, pores are in contact. For this reason, the value of 0 ( )cp R defined by the
condition 0, RpA is determined by the contacts of a given pore with its neighbors and, hence, on fraction of menisci. Consequently, we can define the pores accessible at such a
pressure p as pores whose radii satisfy the condition 0( )cp R p . Upon a change in pressure, some of the formerly inaccessible pores become accessible and are filled with the liquid (if it can reach them). The approach of the liquid flow to the given pore is governed by percolation theory and occurs via the formation of accessible pore clusters both of a finite and an infinitely large size [9, 21].
Thus, the dynamics of infiltration in a grain of a porous media can be represented as the formation of the medium for infiltration (i.e., a system of clusters of accessible pores followed by infiltration in a part of these clusters). Since the infiltration in a grain of the
porous media detected experimentally occurs when percolation length v
cR 0 (
8.0v ) becomes comparable to grain size L or exceeds it L ), infiltration in the grain
V. D. Borman and V. N. Tronin 16
can be treated as a uniform process occurring simultaneously in the entire pore space of the grain and resulting in the formation of clusters of filled pores.
Thus, the problem of infiltration of a porous media can be formulated as the problem of calculating the coordinate-independent distribution functions for clusters of accessible and filled pores over the number of pores, followed by calculation of volume V(t) of the liquid in the porous media under pressure p(t). As before [8], we assume that the size distribution for pores is narrow ( 1 RR ) so that the percolation transition is independent of RR
3.2. Basic Equations
The times in which accessible and filled pores form are substantially different. Indeed, in accordance with expression (1), the formation of accessible pores is controlled by the time of pressure variation in the system, while the time of filling is the hydrodynamic time of infiltration of the liquid through the clusters of accessible pores. These times may differ by orders of magnitude; for this reason, the pores accessible at instant t can be divided into accessible and filled and accessible but unfilled. Consequently, to describe the infiltration dynamics, it is necessary to trace the formation processes of clusters of accessible pores and clusters of filled pores separately. In deriving kinetic equations for distribution functions
( , )f n t and ( , )F n t of accessible and filled pores, we will assume that the transformation of an accessible pore into a filled one only leads to the disappearance of the accessible pore (i.e., the infiltrated medium does not change in the course of filling). It should be noted that the change in the medium being infiltrated will be taken into account below as the filled volume is calculated in the mean field approximation.
The formation of clusters in the problem of spheres (black and white spheres) was described in [34], where the distribution function for clusters of white spheres over the number of spheres in these clusters was introduced. A change in the distribution function in this model occurs as a result of coalescence of clusters of white spheres. Following [33], we will describe the dynamics of infiltration of the liquid in a grain assuming that the medium for infiltration is inhomogeneous and consists of accessible and inaccessible pores. In this case, accessible pores play the role of white spheres and their fraction is defined as
3
0
( ) ( , ) ( ) rp w R p dRf R R
(2)
where ( )rf R is the size distribution function for pores and quantity of ( , )w R p is defined by relation (1).
In describing the dynamics of infiltration of a non-wetting liquid in a porous media, pressure is a function of time; consequently, also depends on time. Bearing this in mind, we can write the system of kinetic equations defining the time evolution of the distribution functions for clusters of accessible and filled pores over the number of pores in them in the form
The Dynamics of Infiltration of a Nanoporous Media with a Nonwetting Liquid 17
1
1 1
( , ) ( , )( , ) ( ( ))( , ) ( , ) ( , )
( , ) ( , ) ( )
n
m m pc
f n m t f m tF n t S tF m t F n t F n t
t m n m n m n
(3)
1
1 1
1
1 1
( , ) 1 1 ( ) ( , ) ( , ) ( , ) ( , ) 2 ( , ) ( )
2
( , ) ( , ) ( ( ))( , ) ( , ) ( , )
( , ) ( , ) ( )
nq q q q q
m md
n
m m pc
f n tm n m f m t f n m t n f n t m f m t n f n t S
t
f n m t f m t S tF m t F n t F n t
m n m n m n
(4)
where
( ) ( )cS , 0c , 1 1( ) ( ( ))d pt
t
, 1( )p
dp
pdt ; (5)
p is the characteristic time of pressure variation; pc is the characteristic percolation
time for an infinitely large cluster of accessible pores from filled clusters, d has the meaning of the characteristic time in which accessible pores form upon time variation of pressure; q,
, and are critical indices ( 0.8q , 0.2 [33] and 0.6 for 3D systems [8]); ( ( ))S t is the effective part of an infinitely large cluster of accessible pores (i.e., the fraction
of pores belonging to the infinitely large cluster and accessible to infiltration); and ( )x is the Heaviside function.
Equation (3) defines the distribution function for clusters of filled pores at an arbitrary instant. The first term describes the formation process of a cluster of n pores as a result of infiltration into clusters of n - m accessible pores via clusters of m filled pores over characteristic time ( , )m n m . The second term corresponds to the attachment of any cluster of accessible pores to the cluster of n filled pores during infiltration over characteristic time ( , )n m . The third term describes infiltration of the infinitely large cluster of accessible
pores from filled clusters over characteristic time ( )pc n . Equation (3) disregards the
variation of distribution function F n t( , ) due to coalescence of clusters of filled pores with one another, which corresponds to the assumption of invariability of the medium in the course of infiltration. Function F n t( , ) for a nearly complete infiltration will be calculated below in the mean field approximation.
Equation (4) defines the time evolution of the distribution function for accessible-pore clusters due to their coalescence with one another (first two terms), attachment to the infinitely large cluster (third term), and infiltration-defiltration of the liquid from these clusters (three last term).Times ( , )n m and ( )pc n appearing in Eqs. (3) and (4) can be
estimated from the following considerations. Let V(m) be the volume of a cluster of m
accessible pores, V(n) be the volume of a cluster of n filled pores, j(n) be the flux from n
filled pores, S(n, m) be the area of contact between clusters of m accessible and n filled pores, and ( )S n be the area of the contact of the cluster of n pores with the infinitely large cluster.
V. D. Borman and V. N. Tronin 18
Then we can write ( )
( , )( ) ( , )
V mn m
j n S n m ,
( ) ( )
( ) ( )pc
V nn
j n S n hese quantities depend
on the size distribution of pores. Since we are interested only in the dependences of times ( , )n m and ( )pc n on the number of filled and accessible pores in the clusters, we will
estimate the values of these quantities assuming that all pores in a cluster are of the same size coinciding with the average size of a pore in the porous media ( R ). In this case, we have
34( )
3V m R m
, 2( , ) 4 ( )qS n m R nm , 2( ) 4 qS n R n
(q' is the critical index). Using the
known expression for the flux in a porous medium, nj k p L ( nk is the penetration
factor of the medium ,~ -viscosity) [28], we obtain
1
0
1
0
( , ) ( )
( ) ( )
q q
q
pc
n m p n m
n p n
, (6)
where
0
0
4( )
3 ( ( ))n c
RLp
k p p R
and pressure 0 ( ) ~cp R R is defined by the condition ( ), 0cA p R R
Equations (3) and (4) allow us to calculate the distribution functions for clusters of accessible and filled pores over the number of pores in them for a preset variation of pressure p(t). Equation (4) contains the terms with essentially different physical meaning. The first three terms in kinetic equation (4) cannot be interpreted as a collision integral since these terms vary only with ( )t and p(t). These terms are on the order of d proportional to
p , which is not the intrinsic time of the system, and reflect the variation of distribution
function ( , )f n t of accessible pores only upon the variation of pressure and, as a
consequence, of quantity ( )t . If const , these terms are equal to zero. For
( )t , these terms must appear in Eq. (4) simultaneously with ( )( )f d dt . Thus,
derivative f t on the left-hand side of Eq. (4), as well as derivative F t , defines the
variation of distribution functions ( , ( ), )f n t t and ( , ( ), )F n t t due to the change in the external pressure and due to infiltration–defiltration of the liquid through accessible pores.
Equations (3) and (4) contain an integral of motion corresponding to the conservation of the total number of pores accessible to infiltration taking into account the fact that part of these pores have already been filled. Indeed, multiplying Eqs. (3) and (4) by n, summing over n, and adding the resultant expression, we obtain
The Dynamics of Infiltration of a Nanoporous Media with a Nonwetting Liquid 19
1
1 1 1
( ( , ) ( , )) ( , ) ( )q
n n n
dnF n t nf n t n f n t S
t dt
(7)
We can write probability ( )P that an accessible pore belongs to the infinitely large cluster as
1
1
( )( , ) ( )q
d
n
Pn f n S
(8)
where d is the fraction of accessible by unfilled pores. Relation (8) is analogous to the expression derived in [33] for the problem of spheres in percolation theory. Considering that the distribution functions for clusters of accessible and filled pores depend on time both explicitly and due to the change in pressure (and, hence, in quantity ( )t , using expression
(8), and setting (0) 0 , we obtain
1 1
( , ) ( , ) ( ( ));n n
nF n t nf n t p t
(9)
This relation corresponds to conservation of the total number of pores accessible to infiltration under pressure p at instant t. In deriving Eq. (9), we used the normalization of function ( , )f n t taking into account the fact that some of accessible pores may belong to an infinitely large cluster,
1
( , ) (1 ( ))d
n
nf n t P
In this case, distribution function ( , )F n t for clusters of filled pores is normalized to the total number of filled pores (including the filled pores formed from the infinitely large cluster of accessible pores).
Equations (3), (4), and (9) contain the times corresponding to different processes occurring during infiltration of a porous media: characteristic time p of variation of external
pressure, characteristic time d of the formation of accessible pores, characteristic time
~ ( , )z n m of the formation of the cluster of filled pores (angle brackets denote
averaging over the ensemble of clusters of accessible and filled pores), characteristic time ~ ( )n
of defiltration of the liquid to the infinitely large cluster of accessible and
empty pores, and characteristic time 1~ ( ( , ) )v
n
nF n t t
of variation of the total filled
volume. For 3D systems, 0 0.18c and ~ 0.6 ; consequently, p d in all cases in
V. D. Borman and V. N. Tronin 20
accordance with relation (5). Since infiltration of the volume occurs due to variation of the external pressure, we have max( , )v d z .
We will consider two cases corresponding to slow ( p v z d ) and fast (
v z p d ) variations of pressure. The solutions to systems of equations (3), (4), and
(9) are significantly different in these cases.
3.3. Kinetics of Infiltration for Slow Variation of Pressure
Let us consider the case of a slow variation in pressure, when p v z d . We
will be interested in infiltration of a porous media over time intervals ~ vt and will calculate the time dependence of the filled volume under pressure p. In Eq. (4), the first term on the right-hand side plays the leading role since it is on the order of 1
d
, while the second
term is on the order of 1 1
z d . Since p z , a change in pressure rapidly leads to the
formation of accessible pores (over time intervals t > d ) followed by infiltration of the liquid
(over time intervals zt ). In accordance with relation (9), the fraction of accessible pores decreases upon infiltration. An increase in pressure leads to the formation of and filling of pores that have become accessible. In view of condition p z , infiltration of the solid
media upon a slow variation in pressure occurs near the percolation threshold over accessible pores, remaining below this threshold. For this reason, ( ) 0S in Eq. (4), and the terms
containing distribution function ( , )F n t for filled pores (and, hence quantity z p ) are
small as compared to the terms containing d and can be discarded. In this case, Eq. (4) assumes the form of the equation used in [33]; the solution to this equation is known:
0
C(t) (t)( , ) ,
( )
nf n tZ t
1/( ) exp( ( ) ),a
n t n r t n (10)
1
( ) ( )n
n
Z t n t
Here, function C(t) is controlled by the normalization of distribution 0 ( , )f n t , varies
over time intervals ~ vt and determines the filled volume. The critical indices for 3D systems are given by [24, 25, 33]
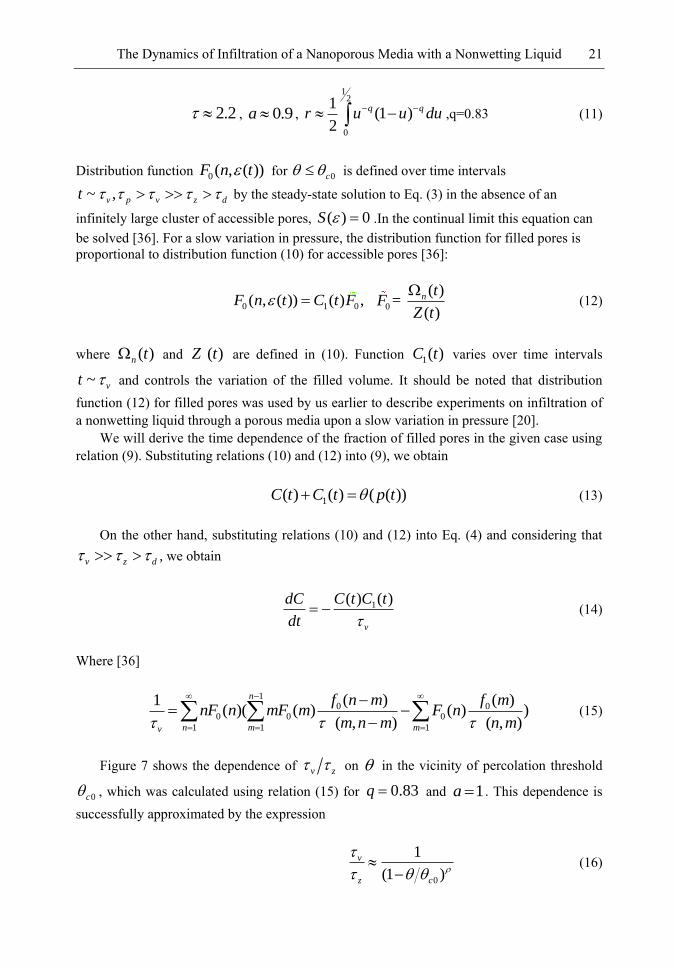
The Dynamics of Infiltration of a Nanoporous Media with a Nonwetting Liquid 21
2.2 , 0.9a ,
12
0
1(1 )
2
q qr u u du ,q=0.83 (11)
Distribution function 0( , ( ))F n t for 0c is defined over time intervals
~ ,v p v z dt by the steady-state solution to Eq. (3) in the absence of an
infinitely large cluster of accessible pores, ( ) 0S .In the continual limit this equation can be solved [36]. For a slow variation in pressure, the distribution function for filled pores is proportional to distribution function (10) for accessible pores [36]:
0 1 0( , ( )) ( ) ,F n t C t F 0
( ) =
( )
n tF
Z t
(12)
where ( )n t and ( )Z t are defined in (10). Function 1( )C t varies over time intervals
~ vt and controls the variation of the filled volume. It should be noted that distribution function (12) for filled pores was used by us earlier to describe experiments on infiltration of a nonwetting liquid through a porous media upon a slow variation in pressure [20].
We will derive the time dependence of the fraction of filled pores in the given case using relation (9). Substituting relations (10) and (12) into (9), we obtain
1( ) ( ) ( ( ))C t C t p t (13)
On the other hand, substituting relations (10) and (12) into Eq. (4) and considering that
v z d , we obtain
1( ) ( )
v
C t C tdC
dt (14)
Where [36]
1
0 00 0 0
1 1 1
( ) ( )1( )( ( ) ( ) )
( , ) ( , )
n
n m mv
f n m f mnF n mF m F n
m n m n m
(15)
Figure 7 shows the dependence of v z on in the vicinity of percolation threshold
0c , which was calculated using relation (15) for 0.83q and 1a . This dependence is successfully approximated by the expression
0
1
(1 )
v
z c
(16)
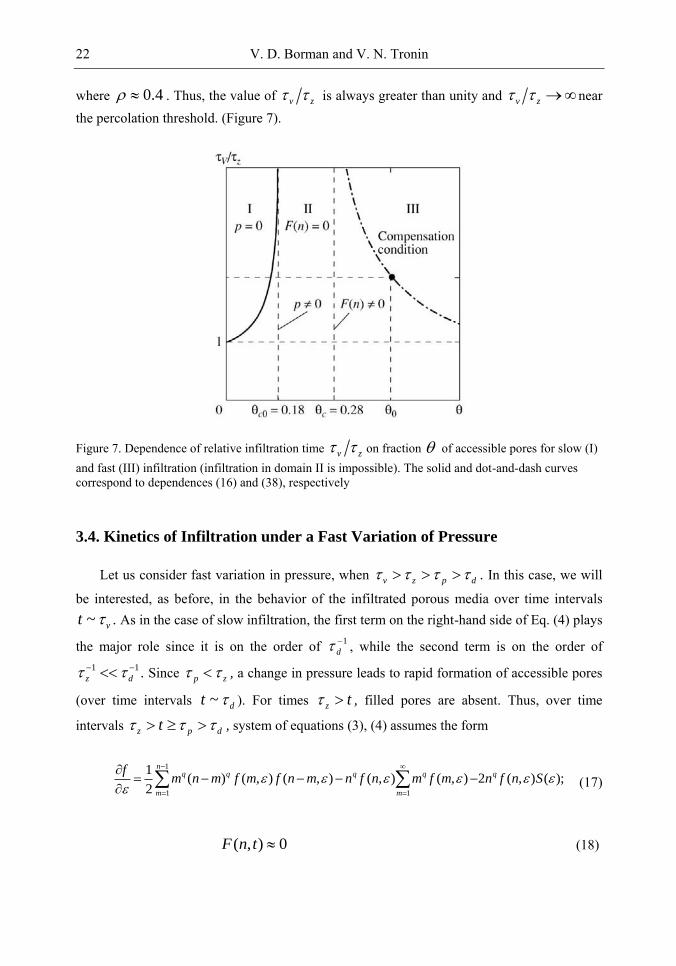
V. D. Borman and V. N. Tronin 22
where 0.4 . Thus, the value of v z is always greater than unity and v z near the percolation threshold. (Figure 7).
Figure 7. Dependence of relative infiltration time v z on fraction of accessible pores for slow (I) and fast (III) infiltration (infiltration in domain II is impossible). The solid and dot-and-dash curves correspond to dependences (16) and (38), respectively
3.4. Kinetics of Infiltration under a Fast Variation of Pressure
Let us consider fast variation in pressure, when v z p d . In this case, we will
be interested, as before, in the behavior of the infiltrated porous media over time intervals ~ vt . As in the case of slow infiltration, the first term on the right-hand side of Eq. (4) plays
the major role since it is on the order of 1
d , while the second term is on the order of
1 1
z d . Since p z , a change in pressure leads to rapid formation of accessible pores
(over time intervals ~ dt ). For times z t , filled pores are absent. Thus, over time
intervals z p dt , system of equations (3), (4) assumes the form
1
1 1
1( ) ( , ) ( , ) ( , ) ( , ) 2 ( , ) ( );
2
nq q q q q
m m
fm n m f m f n m n f n m f m n f n S
(17)
( , ) 0F n t (18)
The Dynamics of Infiltration of a Nanoporous Media with a Nonwetting Liquid 23
It can be seen that over time intervals t satisfying the inequality v z p dt ,
the formed accessible pores now have time to be infiltrated; as a result, the porous media is in a state above the percolation threshold over accessible pores for 0c with
( ) ( )F n f n . Over time intervals v z p dt , the process of infiltration of the
porous media begins in accordance with Eqs. (3) and (4) (in these equations, the effective part of the infinitely large cluster of accessible pores is ( ) 0S . Over these time intervals, in
view of condition z dt , the time derivative in Eq. (4) can be set at
( )( )d dt f . By virtue of condition z d , the sums of the terms in Eq. (4)
containing ( , )F n t is zero in the zeroth and first orders in d z In this case, Eq. (3) is
satisfied automatically. Thus, over time intervals t such that v z p dt , the
equation for distribution function ( , )f n t for accessible pores coincides with the first
equation of system (17),(18), while the equation for ( , )F n t assumes the form
11
1 1 1
1 1
[ ( ) ( ) ( , ) ( ) ( , ) ( ) ( ) 0c
n qdq q q q
m m
F m m n m f n m F n n m f m F n n S
(19)
The equation for ( , )f n t at ( ) 0S near 0c ( 0c ) has a solution differing from
0 ( , )f n t in Eq. (10) only in the value of critical index a [33]. Function C(t) appearing in Eq.
(10) controls the variation of the filled volume and varies over time intervals ~ vt ;
consequently, this function can be assumed to be constant for v z dt . Equation (19) with known distribution function (10) for accessible pores is a
homogeneous equation for function ( )F n . A nonzero solution to this equation exists only if
the determinant of matrix nmA vanishes:
1 1 1
0 0
1
det( ) 0
( ) ( , ) ( ( , ) ( ))
1,
0,
nm
q q q q q
nm nm nm
k
nm
A
A n m f n m m m k f k m S
n m
n m
(20)
Matrix nmA has the form of a triangular matrix with zeros above the principal diagonal. The determinant of such a matrix is equal to the product of the diagonal elements,
V. D. Borman and V. N. Tronin 24
1 1
0
1
det ( 1) ( ( , ) ( ))m q q q
km
A m k f k m S
and does not vanish. Consequently, Eq. (20) has no solutions for finite values of n and m. For n and m , the contact areas of two clusters are controlled by a single critical index; consequently, 1q q . Passing in Eq. (20) from summation to integration,
considering that 0 ~( ) ( )
n mf n m n m , and setting
1 1
0 00
0
lim ( , ) 2 ( ) ( , )q q
kk f k k dxx f x
we obtain from Eq. (20)
1 1
0 0, ,
0 1
lim lim (2 ( , ) ( , ) ( ))q q q
nm nmn m n m
A m dxx f x dxx f x S
(21)
where nm is the Kronecker delta. This leads to the following equation that defines the value
of c corresponding to a nonzero distribution function for filled pores:
1 1
0 0
0 1
2 ( , ) ( , ) ( ) 0q qdxx f x dxx f x S
(22)
Expressions (2), (5),(10), and (22) for ( ) 0S show that the value of c is controlled
by percolation threshold 0c and the critical indices appearing in Eq. (22). If function
0( , )f x is defined by expressions (10), the integrals appearing in Eq. (22) can be expressed in terms of the gamma function and the Whittaker functions [35]. In this case, solving numerically Eq. (22) for 0.83, 0.9q a [34], and 0 0.18c , we obtain c =0.28.
Thus, Eq. (19) has the solution ( ) 0F n for 0c c and ( ) 0F n for c .
Consequently, we can state that a new state of the system is formed for c over time
intervals z p d for p dt . Further infiltration of the porous media over time
intervals vt ~ may occur via its passage to this state, which emerges in the case under investigation due to the infinitely large cluster of accessible pores. It follows from Eq. (3) that pressure pc corresponding to the transition of the porous media to the new state can be determined, in accordance with formula (2), from the relation
3
c
0
( , ) ( ) = c rw R p dRf R R
(23)
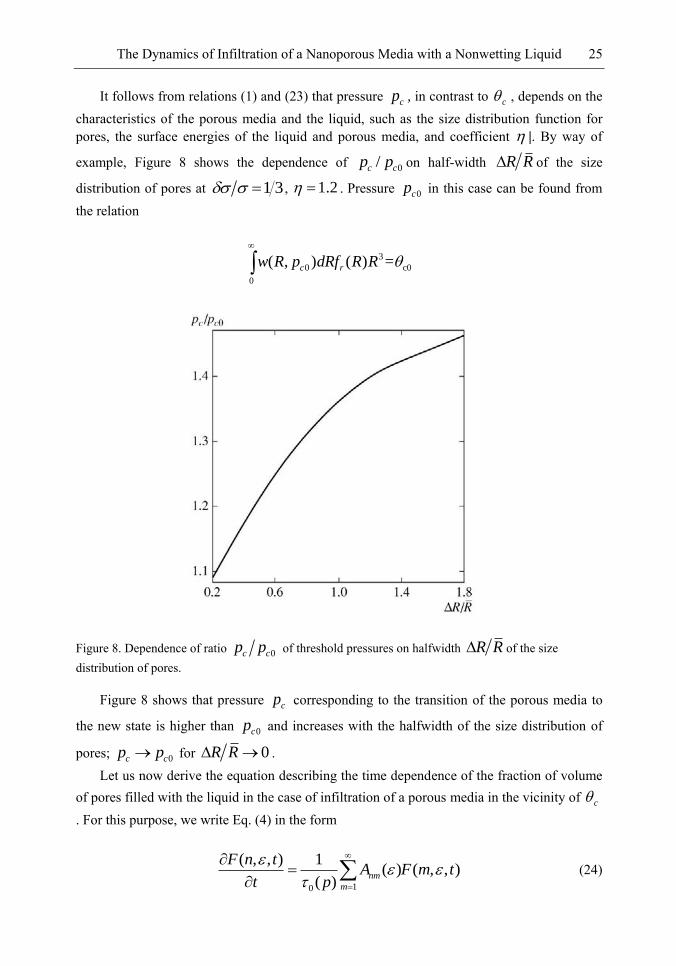
The Dynamics of Infiltration of a Nanoporous Media with a Nonwetting Liquid 25
It follows from relations (1) and (23) that pressure cp , in contrast to c , depends on the characteristics of the porous media and the liquid, such as the size distribution function for pores, the surface energies of the liquid and porous media, and coefficient |. By way of
example, Figure 8 shows the dependence of 0/c cp p on half-width R R of the size
distribution of pores at 1 3 , 1.2 . Pressure 0cp in this case can be found from the relation
3
0 c0
0
( , ) ( ) = c rw R p dRf R R
Figure 8. Dependence of ratio 0c cp p of threshold pressures on halfwidth R R of the size distribution of pores.
Figure 8 shows that pressure cp corresponding to the transition of the porous media to
the new state is higher than 0cp and increases with the halfwidth of the size distribution of
pores; 0c cp p for 0R R . Let us now derive the equation describing the time dependence of the fraction of volume
of pores filled with the liquid in the case of infiltration of a porous media in the vicinity of c
. For this purpose, we write Eq. (4) in the form
10
( , , ) 1( ) ( , , )
( )nm
m
F n tA F m t
t p
(24)
V. D. Borman and V. N. Tronin 26
Matrix nmA is defined by relation (20) and its eigenvalues are defined by the equation
det( ) 0nm nmA . For finite values of n and m, we have
1 1
0
1
det( ) ( ( ( , ) ( )))q q q
nm nm
km
A m k f k m S
(25)
and, hence, the eigenvalues of matrix nmA are negative for finite n and m. For n and
m , we obtain, in accordance with relation (21)
1 1
0 0
0 1
( ) (2 ( , ) ( , ) ( )) ( )q q q
cm dxx f x dxx f x S z
(26)
Angle brackets indicate averaging over an ensemble of clusters for 1m , and z and are constants. Numerical calculations for 0.83, 1q a , and 0.2 give 0.8z and
0.8 . Thus, the spectrum of eigenvalues of matrix nmA for n and m
acquires a small (in the vicinity of c ) positive eigenvalue corresponding to relaxation
time ~ ( )c z
while the remaining eigenvalues are finite for c , negative, and
are on the order of 1
z .
Using relation (26), we can write Eq. (24) in the form
0
( )( )( ) ( )
( )nm
m
F nF n A F m
t p
(27)
Matrix
0 0
( )1
( ) ( )nm nm nmA A
p p
has eigenvalues ( ) 0n , 1
( ) ~z
n
, which do not vanish for = c . Considering
that d
t t dt
, we obtain the equation
0
( )( , ) ( , )( ) ( , )
( )nm
m
F n d F nF n A F m
t dt p
(28)
containing terms varying over substantially different time intervals:
The Dynamics of Infiltration of a Nanoporous Media with a Nonwetting Liquid 27
~z
F F
t
, ( , ) ~ ( ) ~nm
m z
FA F m n F
For time intervals ~ vt , we can obtain the following estimate:
( , ) ~ ~ ,
( )c
p
c
cc p p
F FF n t
pp
, (29)
Compressibility ( ) p pcp
is calculated for pressure cp defined by relation (23), which
shows that 0 3
0
1( ) ~ , 1c
c c c
c
px
x p . Consequently,
5
1( ) ~c p pcp
p x
and,
hence, 5
3( ) ~ ( ( ))c p pc cpp
. Since the value of c for which the new state of the porous
media being infiltrated is formed is higher than 0c , we have 0c cp p and
2( ) ~ 10c p pcpp
. Therefore,
5
3~c p p
, for 1 . Using these estimates in the
zeroth and first orders in z
c
and Eq. (28), we obtain
0
( )( , )( , )
( )
d F nF n
dt p
(30)
( , )
( , )nm
m
F nA F m
t
(31)
In fact, the procedure described above corresponds to obtaining a solution to Eq. (27) by expanding it in the eigenfunctions of operator A. Equations (30) and (31) describe substantially different processes. Equation (31) describes the kinetics of formation of finite-size clusters of filled pores over time interval 1
0z
around an infinitely large cluster, while Eq. (30) describes a slow ―macroscopic‖ infiltration of the liquid into an infinitely large clusters of accessible pores through finite-size clusters of filled pores over time intervals
0~ ( )v c z
for ~ c ( ~ 0.8 ). The left-hand side of Eq. (30) describes the variation in the distribution function for filled pores as a result of external action, while the right-hand side describes the variation in distribution function ( , )F n as a result of infiltration through an infinitely large cluster of accessible pores. Consequently, Eq. (30) also
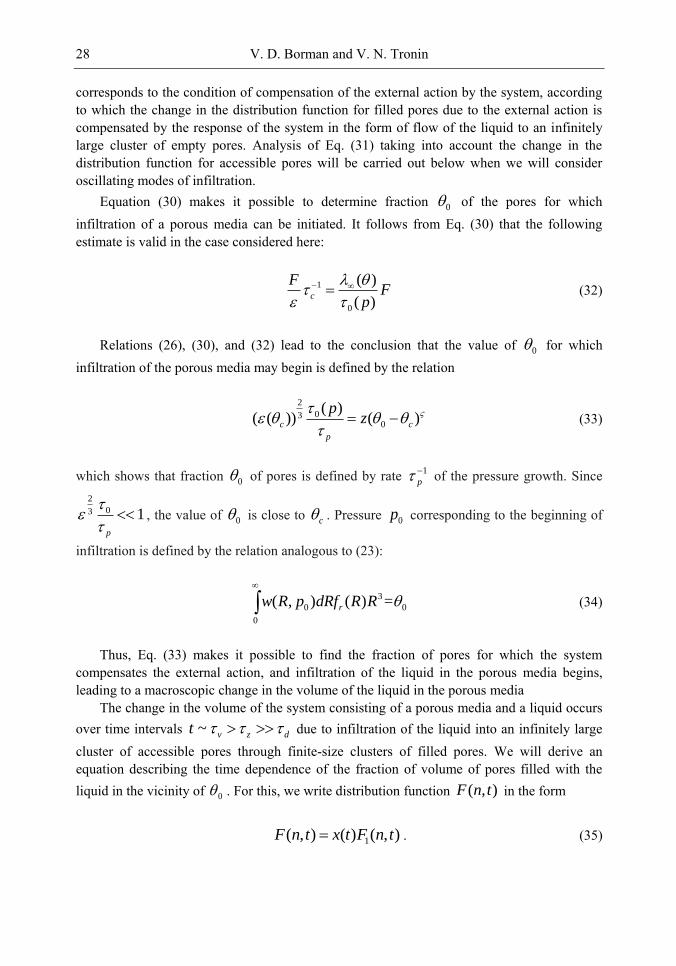
V. D. Borman and V. N. Tronin 28
corresponds to the condition of compensation of the external action by the system, according to which the change in the distribution function for filled pores due to the external action is compensated by the response of the system in the form of flow of the liquid to an infinitely large cluster of empty pores. Analysis of Eq. (31) taking into account the change in the distribution function for accessible pores will be carried out below when we will consider oscillating modes of infiltration.
Equation (30) makes it possible to determine fraction 0 of the pores for which infiltration of a porous media can be initiated. It follows from Eq. (30) that the following estimate is valid in the case considered here:
1
0
( )
( )c
FF
p
(32)
Relations (26), (30), and (32) lead to the conclusion that the value of 0 for which infiltration of the porous media may begin is defined by the relation
2
030
( )( ( )) ( )c c
p
pz
(33)
which shows that fraction 0 of pores is defined by rate 1
p
of the pressure growth. Since 2
03 1p
, the value of 0 is close to c . Pressure 0p corresponding to the beginning of
infiltration is defined by the relation analogous to (23):
3
0 0
0
( , ) ( ) = rw R p dRf R R
(34)
Thus, Eq. (33) makes it possible to find the fraction of pores for which the system compensates the external action, and infiltration of the liquid in the porous media begins, leading to a macroscopic change in the volume of the liquid in the porous media
The change in the volume of the system consisting of a porous media and a liquid occurs over time intervals ~ v z dt due to infiltration of the liquid into an infinitely large cluster of accessible pores through finite-size clusters of filled pores. We will derive an equation describing the time dependence of the fraction of volume of pores filled with the liquid in the vicinity of 0 . For this, we write distribution function ( , )F n t in the form
1( , ) ( ) ( , )F n t x t F n t . (35)
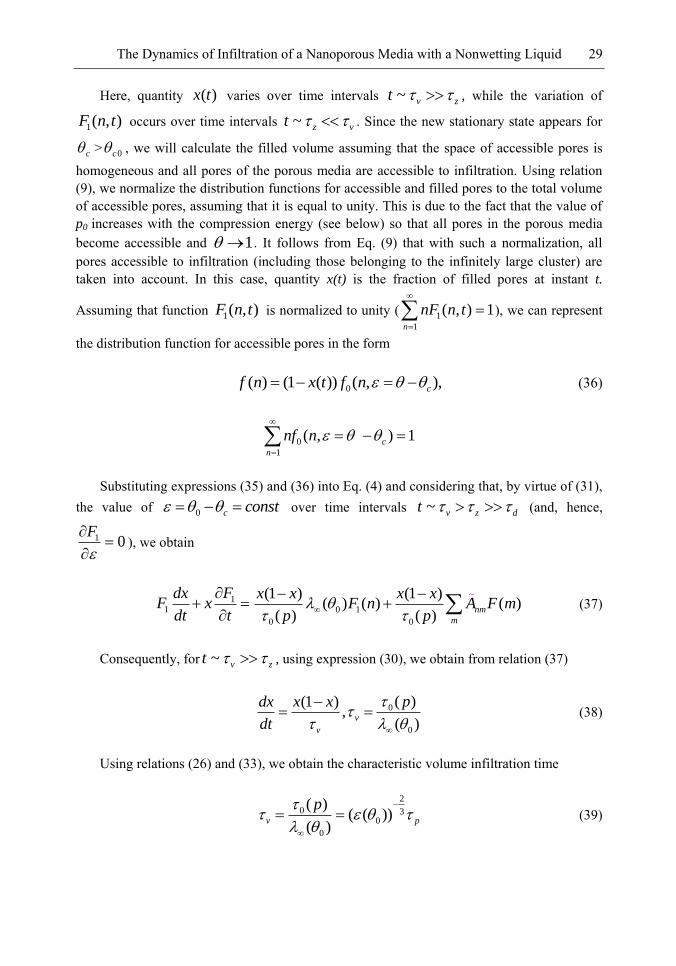
The Dynamics of Infiltration of a Nanoporous Media with a Nonwetting Liquid 29
Here, quantity ( )x t varies over time intervals ~ v zt , while the variation of
1( , )F n t occurs over time intervals ~ z vt . Since the new stationary state appears for
c > 0c , we will calculate the filled volume assuming that the space of accessible pores is homogeneous and all pores of the porous media are accessible to infiltration. Using relation (9), we normalize the distribution functions for accessible and filled pores to the total volume of accessible pores, assuming that it is equal to unity. This is due to the fact that the value of p0 increases with the compression energy (see below) so that all pores in the porous media become accessible and 1 . It follows from Eq. (9) that with such a normalization, all pores accessible to infiltration (including those belonging to the infinitely large cluster) are taken into account. In this case, quantity x(t) is the fraction of filled pores at instant t.
Assuming that function 1( , )F n t is normalized to unity ( 1
1
( , ) 1n
nF n t
), we can represent
the distribution function for accessible pores in the form
0( ) (1 ( )) ( , ),cf n x t f n (36)
0
1
( , ) 1c
n
nf n
Substituting expressions (35) and (36) into Eq. (4) and considering that, by virtue of (31), the value of 0 c const over time intervals ~ v z dt (and, hence,
1 0F
), we obtain
11
FdxF x
dt t
0 1
0 0
(1 ) (1 )( ) ( ) ( )
( ) ( )nm
m
x x x xF n A F m
p p
(37)
Consequently, for ~ v zt , using expression (30), we obtain from relation (37)
0
0
( )(1 ),
( )v
v
pdx x x
dt
(38)
Using relations (26) and (33), we obtain the characteristic volume infiltration time
2
0 30
0
( )( ( ))
( )v p
p
(39)
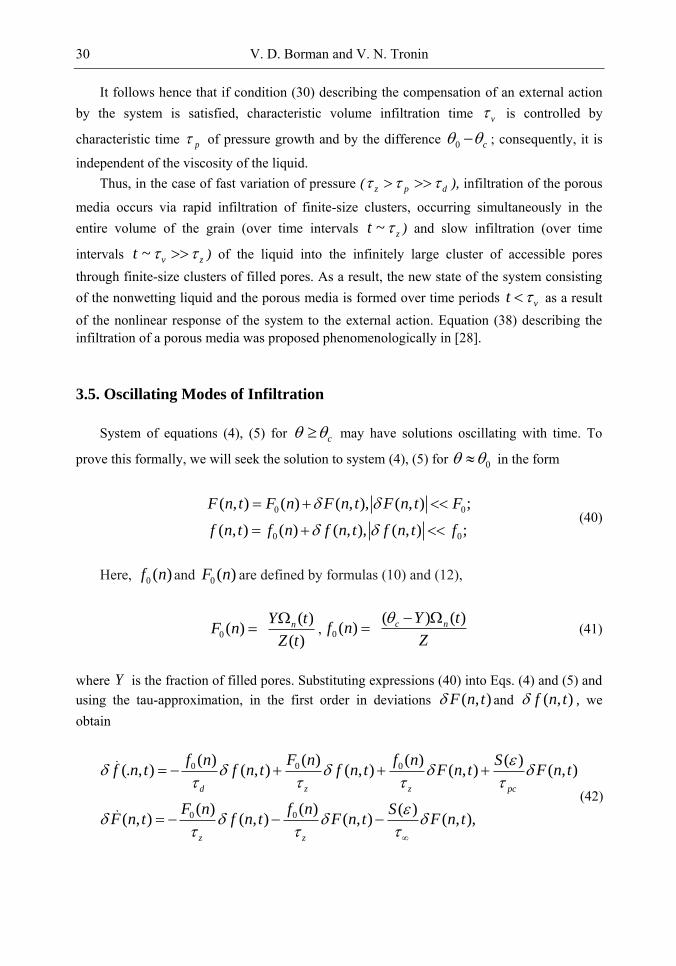
V. D. Borman and V. N. Tronin 30
It follows hence that if condition (30) describing the compensation of an external action by the system is satisfied, characteristic volume infiltration time v is controlled by
characteristic time p of pressure growth and by the difference 0 c ; consequently, it is
independent of the viscosity of the liquid. Thus, in the case of fast variation of pressure ( z p d ), infiltration of the porous
media occurs via rapid infiltration of finite-size clusters, occurring simultaneously in the entire volume of the grain (over time intervals ~ zt ) and slow infiltration (over time
intervals ~ v zt ) of the liquid into the infinitely large cluster of accessible pores through finite-size clusters of filled pores. As a result, the new state of the system consisting of the nonwetting liquid and the porous media is formed over time periods vt as a result of the nonlinear response of the system to the external action. Equation (38) describing the infiltration of a porous media was proposed phenomenologically in [28].
3.5. Oscillating Modes of Infiltration
System of equations (4), (5) for c may have solutions oscillating with time. To
prove this formally, we will seek the solution to system (4), (5) for 0 in the form
0 0
0 0
( , ) ( ) ( , ), ( , ) ;
( , ) ( ) ( , ), ( , ) ;
F n t F n F n t F n t F
f n t f n f n t f n t f
(40)
Here, 0 ( )f n and 0 ( )F n are defined by formulas (10) and (12),
0
( )( )
( )
nY tF n
Z t
, 0
( ) ( )( ) c nY t
f nZ
(41)
where Y is the fraction of filled pores. Substituting expressions (40) into Eqs. (4) and (5) and using the tau-approximation, in the first order in deviations ( , )F n t and ( , )f n t , we obtain
0 0 0
0 0
( ) ( ) ( ) ( )(. , ) ( , ) ( , ) ( , ) ( , )
( ) ( ) ( )( , ) ( , ) ( , ) ( , ),
d z z pc
z z
f n F n f n Sf n t f n t f n t F n t F n t
F n f n SF n t f n t F n t F n t
(42)
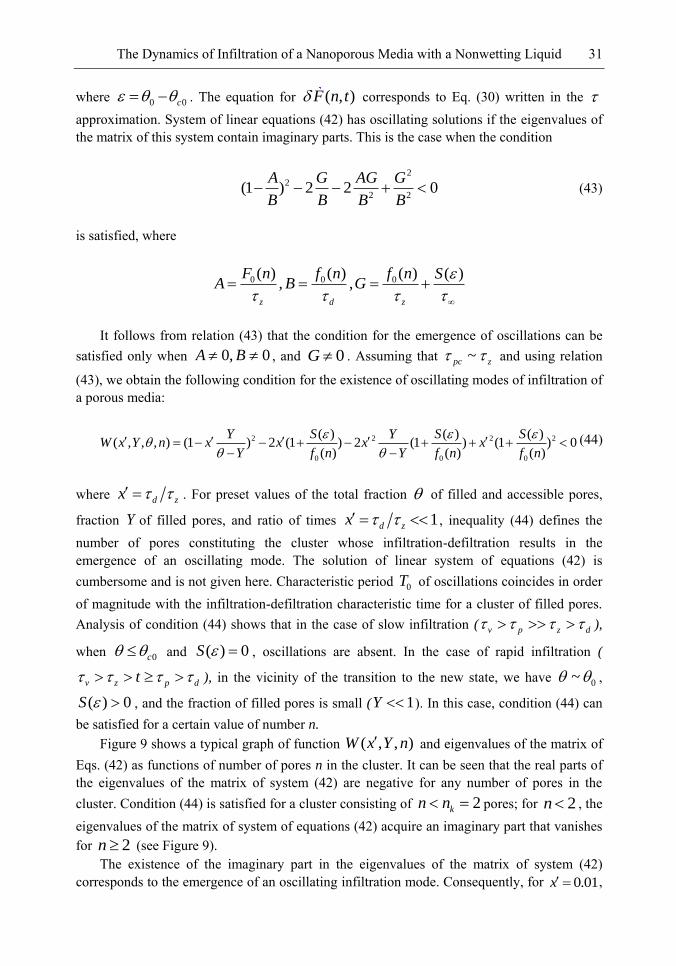
The Dynamics of Infiltration of a Nanoporous Media with a Nonwetting Liquid 31
where 0 0c . The equation for ( , )F n t corresponds to Eq. (30) written in the
approximation. System of linear equations (42) has oscillating solutions if the eigenvalues of the matrix of this system contain imaginary parts. This is the case when the condition
2
2
2 2(1 ) 2 2 0
A G AG G
B B B B (43)
is satisfied, where
0 0 0( ) ( ) ( ) ( ), ,
z d z
F n f n f n SA B G
It follows from relation (43) that the condition for the emergence of oscillations can be satisfied only when 0, 0A B , and 0G . Assuming that ~pc z and using relation
(43), we obtain the following condition for the existence of oscillating modes of infiltration of a porous media:
2 2 2 2
0 0 0
( ) ( ) ( )( , , , ) (1 ) 2 (1 ) 2 (1 ) (1 ) 0
( ) ( ) ( )
Y S Y S SW x Y n x x x x
Y f n Y f n f n
(44)
where d zx . For preset values of the total fraction of filled and accessible pores,
fraction Y of filled pores, and ratio of times 1d zx , inequality (44) defines the number of pores constituting the cluster whose infiltration-defiltration results in the emergence of an oscillating mode. The solution of linear system of equations (42) is cumbersome and is not given here. Characteristic period 0T of oscillations coincides in order of magnitude with the infiltration-defiltration characteristic time for a cluster of filled pores. Analysis of condition (44) shows that in the case of slow infiltration ( v p z d ),
when 0c and ( ) 0S , oscillations are absent. In the case of rapid infiltration (
v z p dt ), in the vicinity of the transition to the new state, we have 0~ ,
( ) 0S , and the fraction of filled pores is small ( 1Y ). In this case, condition (44) can be satisfied for a certain value of number n.
Figure 9 shows a typical graph of function ( , , )W x Y n and eigenvalues of the matrix of Eqs. (42) as functions of number of pores n in the cluster. It can be seen that the real parts of the eigenvalues of the matrix of system (42) are negative for any number of pores in the cluster. Condition (44) is satisfied for a cluster consisting of 2kn n pores; for 2n , the eigenvalues of the matrix of system of equations (42) acquire an imaginary part that vanishes for 2n (see Figure 9).
The existence of the imaginary part in the eigenvalues of the matrix of system (42) corresponds to the emergence of an oscillating infiltration mode. Consequently, for 0.01x ,
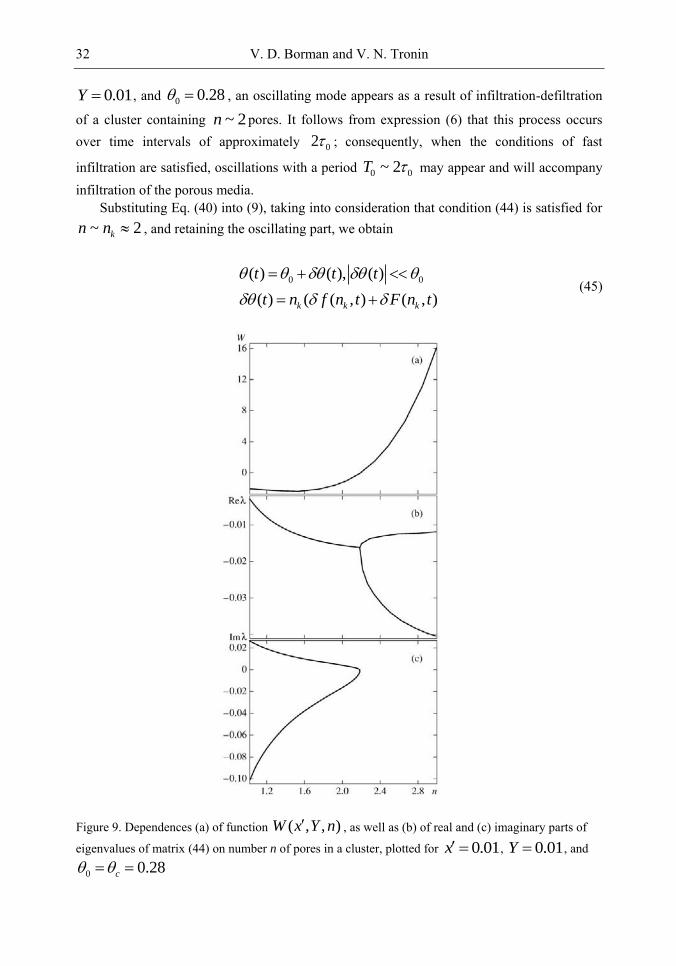
V. D. Borman and V. N. Tronin 32
0.01Y , and 0 0.28 , an oscillating mode appears as a result of infiltration-defiltration
of a cluster containing ~ 2n pores. It follows from expression (6) that this process occurs over time intervals of approximately 02 ; consequently, when the conditions of fast
infiltration are satisfied, oscillations with a period 0 0~ 2T may appear and will accompany infiltration of the porous media.
Substituting Eq. (40) into (9), taking into consideration that condition (44) is satisfied for ~ 2kn n , and retaining the oscillating part, we obtain
0 0( ) ( ), ( )
( ) ( ( , ) ( , )k k k
t t t
t n f n t F n t
(45)
Figure 9. Dependences (a) of function ( , , )W x Y n , as well as (b) of real and (c) imaginary parts of
eigenvalues of matrix (44) on number n of pores in a cluster, plotted for 0.01x , 0.01Y , and
0 0.28c
The Dynamics of Infiltration of a Nanoporous Media with a Nonwetting Liquid 33
For pressure oscillations, we obtain from Eq. (3)
3 -1
0
( , )( ) ( )( ( ) ) c
r
w R pp t t dRf R R
p
(46)
Thus, the emergence of oscillations ( , )kf n t and ( , )kF n t of the distribution
functions leads to the emergence of pressure oscillations with a period 0 0~ 2T . Let us find the time dependence of the volume in an oscillating regime. For this purpose,
we substitute Eqs. (45) into Eq. (38). The solution of the resultant equation has the form
0
100 0
0
( )(0) 1
1 exp( ( (1 ( ) ) ( )) )(0)
t
c
v
x tx
t dtx
(47)
Here, (0)x is the fraction of pores filled by the instant of passage of the system to a new
state and quantity v is defined by relation (31). Since the characteristic period of oscillations
is 0 0~ 2 vT , the value of 0
( ) 0
t
t dt over time intervals vt and, hence,
oscillations of the relative volume must be smaller than pressure oscillations (46). In our experiments, a liquid Wood‘s alloy (Tm = 345°C) and a Silokhrom SKh-1.5 porous
media were placed in a high-pressure chamber. The mass and size of the Silokhrom grains were m = 1 g and 300 µm, respectively. The pore diameter in Silokhrom SKh-1.5 ranged from 130 to 260 nm. The pressure in the chamber was produced by mechanical action on a rod that could enter the chamber through gaskets. A decrease in volume of the Wood‘s alloy-Silokhrom system upon moving the rod inside the chamber produced excessive pressure. The change in volume was measured using a displacement pickup. The pressure was measured by a strain gauge that was mounted on a support under the high-pressure chamber. The gauge could detect strength from 0 to 1000 kg in the frequency range up to 10 kHz with an accuracy of=10%. The filling critical pressure was determined from the V(p) dependence of the filled pore volume on pressure p for a quasi-static pressure buildup with a characteristic time of=10 s. For the system under study, this value was found to be pc0 = 120 atm. In the experiments with dynamic filling, the time-dependent pressure in the chamber was measured for the pulsed mechanical action on the chamber rod. The measured compressibility of Silokhrom SKh-1.5 was = 1.6 x 10⁻³ atm-1. Since the compressibility of the chamber with volume Vch
=120 cm3 was = 1.4 x 10⁻⁵ atm-1., a change in the chamber volume filled with the Wood‘s
alloy (the compressibility of the Wood‘s alloy is ~10–6 atm1) was vastly larger than the
change in the Silokhrom volume in the dynamic experiments on the time scale of <10 ms with working pressure p ~ 3 x 10² atm. Because of this, the characteristics of a pressure pulse in the chamber were determined in special experiments, in which the chamber was filled only with the Wood‘s alloy. When studying the filling dynamics of the porous media, the maximal pressure in the chamber was p0 = 240-600 atm, i.e., much higher than the critical pressure of
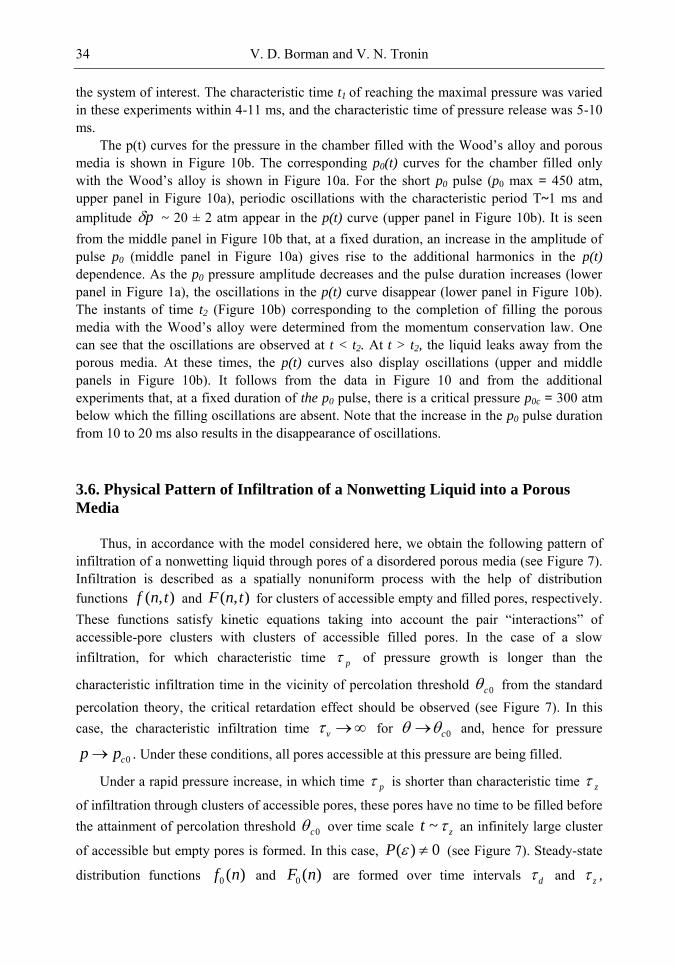
V. D. Borman and V. N. Tronin 34
the system of interest. The characteristic time t1 of reaching the maximal pressure was varied in these experiments within 4-11 ms, and the characteristic time of pressure release was 5-10 ms.
The p(t) curves for the pressure in the chamber filled with the Wood‘s alloy and porous media is shown in Figure 10b. The corresponding p0(t) curves for the chamber filled only with the Wood‘s alloy is shown in Figure 10a. For the short p0 pulse (p0 max = 450 atm, upper panel in Figure 10a), periodic oscillations with the characteristic period T~1 ms and amplitude p ~ 20 ± 2 atm appear in the p(t) curve (upper panel in Figure 10b). It is seen from the middle panel in Figure 10b that, at a fixed duration, an increase in the amplitude of pulse p0 (middle panel in Figure 10a) gives rise to the additional harmonics in the p(t)
dependence. As the p0 pressure amplitude decreases and the pulse duration increases (lower panel in Figure 1a), the oscillations in the p(t) curve disappear (lower panel in Figure 10b). The instants of time t2 (Figure 10b) corresponding to the completion of filling the porous media with the Wood‘s alloy were determined from the momentum conservation law. One can see that the oscillations are observed at t < t2. At t > t2, the liquid leaks away from the porous media. At these times, the p(t) curves also display oscillations (upper and middle panels in Figure 10b). It follows from the data in Figure 10 and from the additional experiments that, at a fixed duration of the p0 pulse, there is a critical pressure p0c = 300 atm below which the filling oscillations are absent. Note that the increase in the p0 pulse duration from 10 to 20 ms also results in the disappearance of oscillations.
3.6. Physical Pattern of Infiltration of a Nonwetting Liquid into a Porous
Media
Thus, in accordance with the model considered here, we obtain the following pattern of infiltration of a nonwetting liquid through pores of a disordered porous media (see Figure 7). Infiltration is described as a spatially nonuniform process with the help of distribution functions ( , )f n t and ( , )F n t for clusters of accessible empty and filled pores, respectively. These functions satisfy kinetic equations taking into account the pair ―interactions‖ of
accessible-pore clusters with clusters of accessible filled pores. In the case of a slow infiltration, for which characteristic time p of pressure growth is longer than the
characteristic infiltration time in the vicinity of percolation threshold 0c from the standard percolation theory, the critical retardation effect should be observed (see Figure 7). In this case, the characteristic infiltration time v for 0c and, hence for pressure
0cp p . Under these conditions, all pores accessible at this pressure are being filled.
Under a rapid pressure increase, in which time p is shorter than characteristic time z
of infiltration through clusters of accessible pores, these pores have no time to be filled before the attainment of percolation threshold 0c over time scale ~ zt an infinitely large cluster
of accessible but empty pores is formed. In this case, ( ) 0P (see Figure 7). Steady-state
distribution functions 0 ( )f n and 0 ( )F n are formed over time intervals d and z ,
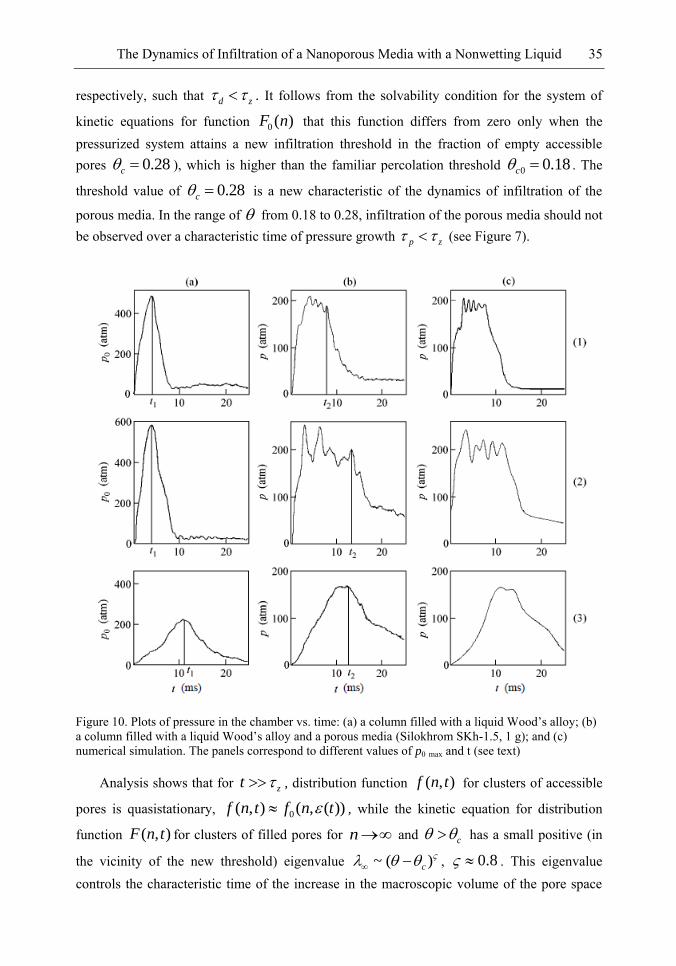
The Dynamics of Infiltration of a Nanoporous Media with a Nonwetting Liquid 35
respectively, such that d z . It follows from the solvability condition for the system of
kinetic equations for function 0 ( )F n that this function differs from zero only when the pressurized system attains a new infiltration threshold in the fraction of empty accessible pores 0.28c ), which is higher than the familiar percolation threshold 0 0.18c . The
threshold value of 0.28c is a new characteristic of the dynamics of infiltration of the
porous media. In the range of from 0.18 to 0.28, infiltration of the porous media should not be observed over a characteristic time of pressure growth p z (see Figure 7).
Figure 10. Plots of pressure in the chamber vs. time: (a) a column filled with a liquid Wood‘s alloy; (b)
a column filled with a liquid Wood‘s alloy and a porous media (Silokhrom SKh-1.5, 1 g); and (c) numerical simulation. The panels correspond to different values of p0 max and t (see text)
Analysis shows that for zt , distribution function ( , )f n t for clusters of accessible
pores is quasistationary, 0( , ) ( , ( ))f n t f n t , while the kinetic equation for distribution
function ( , )F n t for clusters of filled pores for n and c has a small positive (in
the vicinity of the new threshold) eigenvalue ~ ( )c
, 0.8 . This eigenvalue controls the characteristic time of the increase in the macroscopic volume of the pore space
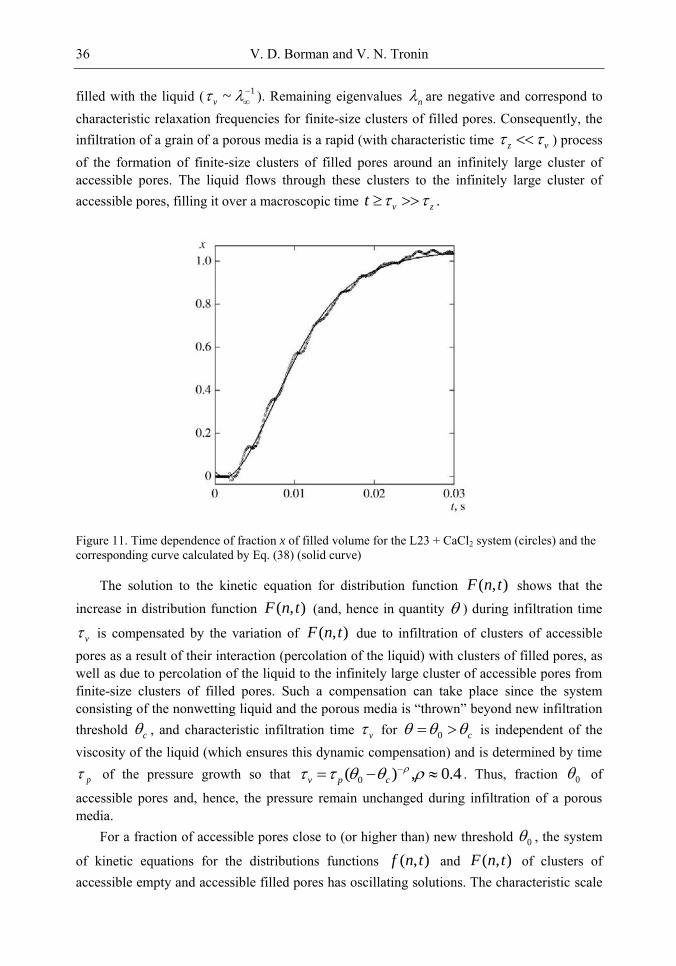
V. D. Borman and V. N. Tronin 36
filled with the liquid ( 1~v
). Remaining eigenvalues n are negative and correspond to characteristic relaxation frequencies for finite-size clusters of filled pores. Consequently, the infiltration of a grain of a porous media is a rapid (with characteristic time z v ) process of the formation of finite-size clusters of filled pores around an infinitely large cluster of accessible pores. The liquid flows through these clusters to the infinitely large cluster of accessible pores, filling it over a macroscopic time v zt .
Figure 11. Time dependence of fraction x of filled volume for the L23 + CaCl2 system (circles) and the corresponding curve calculated by Eq. (38) (solid curve)
The solution to the kinetic equation for distribution function ( , )F n t shows that the
increase in distribution function ( , )F n t (and, hence in quantity ) during infiltration time
v is compensated by the variation of ( , )F n t due to infiltration of clusters of accessible pores as a result of their interaction (percolation of the liquid) with clusters of filled pores, as well as due to percolation of the liquid to the infinitely large cluster of accessible pores from finite-size clusters of filled pores. Such a compensation can take place since the system consisting of the nonwetting liquid and the porous media is ―thrown‖ beyond new infiltration
threshold c , and characteristic infiltration time v for 0 c is independent of the viscosity of the liquid (which ensures this dynamic compensation) and is determined by time
p of the pressure growth so that 0( ) , 0.4v p c
. Thus, fraction 0 of
accessible pores and, hence, the pressure remain unchanged during infiltration of a porous media.
For a fraction of accessible pores close to (or higher than) new threshold 0 , the system
of kinetic equations for the distributions functions ( , )f n t and ( , )F n t of clusters of accessible empty and accessible filled pores has oscillating solutions. The characteristic scale
The Dynamics of Infiltration of a Nanoporous Media with a Nonwetting Liquid 37
of the period of oscillations is on the order of z . The oscillations must be observed during
infiltration time v and correspond to the periodic infiltration-defiltration of the liquid in finite-size clusters.
4. DISCUSSION OF RESULTS AND COMPARISON WITH EXPERIMENT
Experiments show that the characteristic times of variation of volume and pressure for the system of a nonwetting liquid and a nanoporous media considered here are ~ 25v ms
and ~ 5p ms, respectively (see Figure 5). Let us estimate characteristic times z and 0 .
For this purpose, we write
( )
~v
V L
SJ , (48)
where ( )V L is the volume of a grain of size L, S is the surface area of the grain through which the liquid infiltrates, and J is the flow rate of the liquid. Using the linear relation between the velocity of the liquid flow and pressure gradient,
L
pkJ n ~
(49)
where nk is an unknown coefficient having the meaning of the penetrability factor of the
medium [29], and assuming that 34( )
3V L L
and 24S L , we obtain
2
~3
v
n
L
k p
(50)
Assuming that time v is given, we can obtain unknown coefficient nk from relation (49):
2
~3
n
v
Lk
p
(51)
Then definition (6) for 0
4
3 n
RL
k p
gives
V. D. Borman and V. N. Tronin 38
0
4~ v
R
L (52)
For ~ 10R nm and ~ 1L µm, the value of 0 is approximately 1 ms. Using relation (6)
for hydrody-namic time 1
0~ ( ) q q
z p n m for 0~ ~ 0.3 , we obtain ~ 10z ms.
Using relation 1
0( )d p
, for 0.6 , we obtain ~ 0.1d ms. Thus, the inequalities
typical of rapid infiltration ( 0v z p d ) are observed in experiments with the
systems under investigation, which allows us to use the developed model of infiltration for interpreting experimental data. For a slow variation in pressure ( ~ 1p atm/s), ~ 100p s
and, hence p z d . This justifies the use of relations (10) and (12) for describing the
results of experiments on slow infiltration of a nonwetting liquid through a nanoporous media [9, 21].
We can estimate the value of quantity 0 emerging due to compensation of the external action by the nanoporous media being infiltrated and determining the infiltration threshold using relation (33), which gives
12
0 30 ( ( ) )c c
pz
(53)
for 0 ~ 1 ms and ~ 25v ms, we obtain 0 0.003 0.283c . Thus, infiltration of a porous media in these experiments may begin in the vicinity of the transition of the system to a new infiltration state for 2
0 / ~10c c . It should be borne in mind that in view of
the finite size of grains, percolation threshold 0c (and, hence, quantities such a 0 and c
determined from it) also have values differing from the values of the corresponding quantities in the case of an infinitely large medium.
This difference can be estimated assuming that infiltration through a grain of size L
begins when correlation length ~( )
R
, 0.8 [33] becomes equal to the grain size.
Consequently,
1
0 0( ) ( )c c
RL
L (54)
This gives 3
0 0( ) ~ 10c cL , indicating the possibility of using the infinitely large medium approximation for describing the result of experiments.
It follows from relations (22) and (23) that positive eigenvalue 0 , which determines the characteristic infiltration time of the porous media, is formed in the limit
The Dynamics of Infiltration of a Nanoporous Media with a Nonwetting Liquid 39
n . The numerical solution of Eqs. (4) and (5) shows that the formation of a positive eigenvalue of system of equations (4), (5) begins for a number of pores 100n in the cluster. At the same time, a grain of size ~1 10L µm in the system under investigation
contains a number of pores 3
6 9
3~ ~ 10 10
Ln
R , which allows us to use the relations
obtained in Section 3 in the infinitely large medium approximation for describing experimental dependences.
Infiltration of a porous media occurs for the fraction 0 0.28 of accessible pores. For
the systems under investigation, the infiltration pressure is 00 2.1 cpp . It follows from expression (1) that the probability of a pore being accessible to infiltration is 0.93; consequently, 93% of all pores in a grain of the porous media become accessible to infiltration at room temperature. It can be seen from Figure 6 that for 0 0.28 , about 70% of pores in the porous media belong to the infinitely large cluster of accessible pores. The remaining 23% of pores (that do not belong to the infinitely large cluster) form finite-size clusters. These clusters surround the infinitely large cluster and, being infiltrated over time interval ~ 10z ms, form finite-size clusters of filled pores through which the liquid flows to the infinitely large cluster of accessible pores, infiltrating it over the characteristic time
~ 25v ms. Thus, infiltration of a grain of a rapidly pressurized porous media can be treated as a uniform process of infiltration of the liquid though finite-size clusters of accessible pores (about 20% of pores in the entire porous media) occurring simultaneously in the entire space of pores in the grain with characteristic time z ; it is followed by percolation of the liquid from these clusters to the growing infinitely large clusters of accessible pores, containing about 70% of all pores in the porous media with a long characteristic time ~ 25v ms.
Our experiments show that the time dependences of infiltration pressure and filled volume do not change upon a fivefold change in the viscosity of the liquid. Infiltration pressure cp at which the porous media passes to a new state can be determined from Eq.
(34), which does not contain viscosity; consequently 0p is independent of viscosity.
Numerical solution of Eq. (34) for 0 0.28 gives 0 200p atm, which corresponds to experimental data (see Figure 5). It follows from Eq. (39) and relation (40) that the volume infiltration time is independent of the viscosity of the liquid due to dynamic compensation of the external action by the nonwetting liquid-nanoporous media system. Figure 11 shows the time dependence of fraction x of the filled volume for the L23 + CaCl2 system, calculated using Eq. (38). It can be seen that the experimental and theoretical dependences almost coincide. It should be noted that Eq. (38) is valid over time intervals ~ ~10v zt ms. Consequently, the coincidence of the theoretical and experimental time dependences of the filled volume at shorter times is accidental.
In the model developed here, the filled volume and the infiltration time of a porous media are functions of the compression energy. These dependences can be derived from Eq. (38).
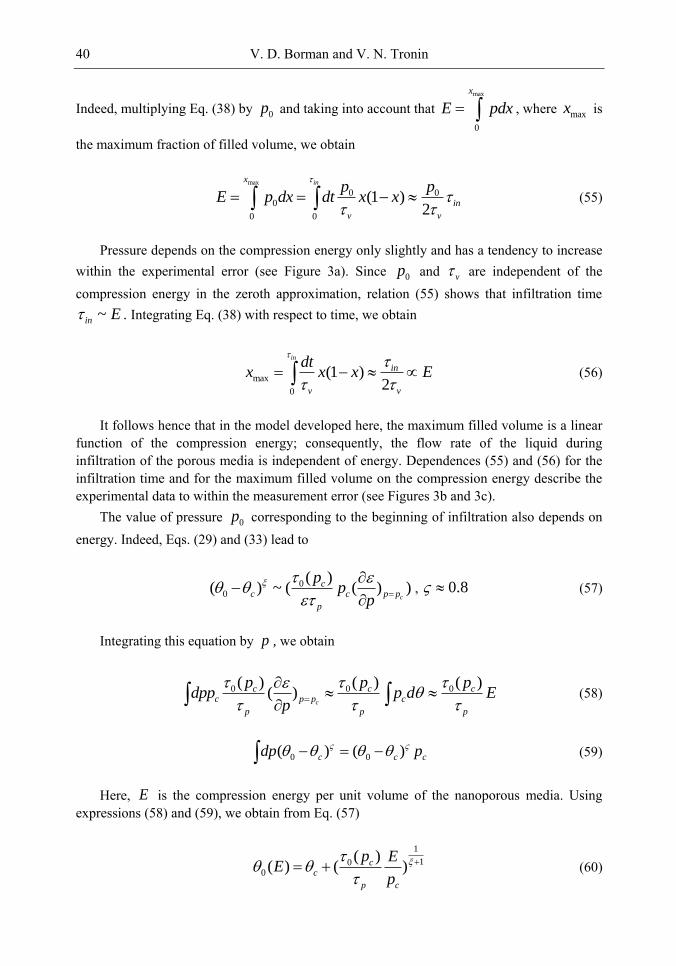
V. D. Borman and V. N. Tronin 40
Indeed, multiplying Eq. (38) by 0p and taking into account that max
0
x
E pdx , where maxx is
the maximum fraction of filled volume, we obtain
max
0 00
0 0
(1 )2
inx
in
v v
p pE p dx dt x x
(55)
Pressure depends on the compression energy only slightly and has a tendency to increase within the experimental error (see Figure 3a). Since 0p and v are independent of the compression energy in the zeroth approximation, relation (55) shows that infiltration time
~in E . Integrating Eq. (38) with respect to time, we obtain
max
0
(1 )2
in
in
v v
dtx x x E
(56)
It follows hence that in the model developed here, the maximum filled volume is a linear function of the compression energy; consequently, the flow rate of the liquid during infiltration of the porous media is independent of energy. Dependences (55) and (56) for the infiltration time and for the maximum filled volume on the compression energy describe the experimental data to within the measurement error (see Figures 3b and 3c).
The value of pressure 0p corresponding to the beginning of infiltration also depends on energy. Indeed, Eqs. (29) and (33) lead to
00
( )( ) ~ ( ( ) )
c
cc c p p
p
pp
p
, 0.8 (57)
Integrating this equation by p , we obtain
0 0 0( ) ( ) ( )( )
c
c c cc p p c
p p p
p p pdpp p d E
p
(58)
0 0( ) ( )c c cdp p (59)
Here, E is the compression energy per unit volume of the nanoporous media. Using expressions (58) and (59), we obtain from Eq. (57)
1
100
( )( ) ( )c
c
p c
p EE
p
(60)
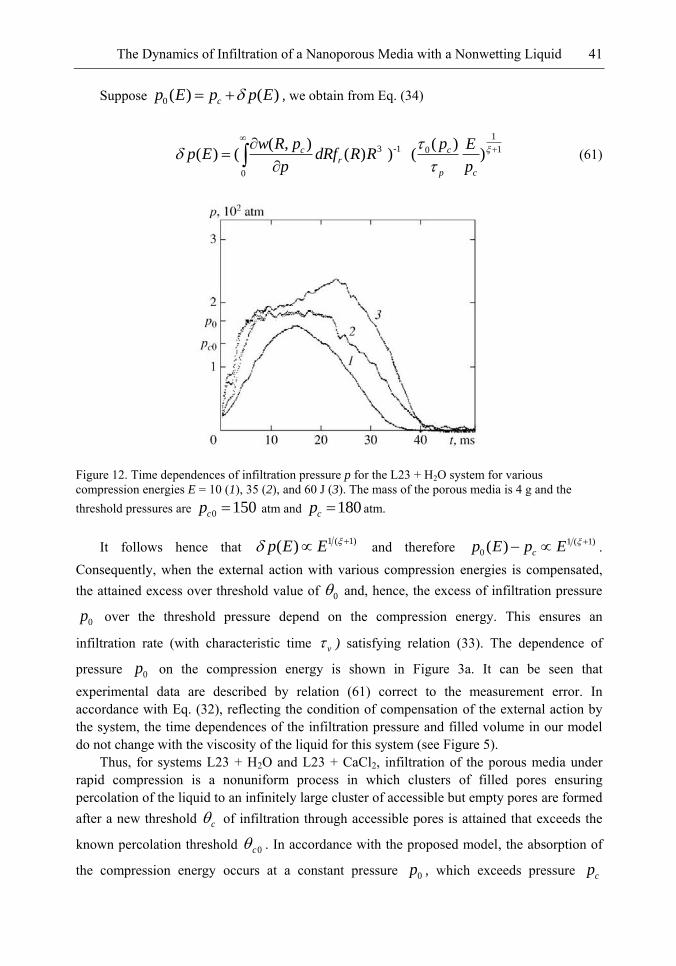
The Dynamics of Infiltration of a Nanoporous Media with a Nonwetting Liquid 41
Suppose 0( ) ( )cp E p p E , we obtain from Eq. (34)
1
3 -1 10
0
( , ) ( )( ) ( ( ) ) ( )c c
r
p c
w R p p Ep E dRf R R
p p
(61)
Figure 12. Time dependences of infiltration pressure p for the L23 + H2O system for various compression energies E = 10 (1), 35 (2), and 60 J (3). The mass of the porous media is 4 g and the threshold pressures are 0 150cp atm and 180cp atm.
It follows hence that 1 ( 1)( )p E E and therefore 1 ( 1)
0 ( ) cp E p E . Consequently, when the external action with various compression energies is compensated, the attained excess over threshold value of 0 and, hence, the excess of infiltration pressure
0p over the threshold pressure depend on the compression energy. This ensures an
infiltration rate (with characteristic time v ) satisfying relation (33). The dependence of
pressure 0p on the compression energy is shown in Figure 3a. It can be seen that experimental data are described by relation (61) correct to the measurement error. In accordance with Eq. (32), reflecting the condition of compensation of the external action by the system, the time dependences of the infiltration pressure and filled volume in our model do not change with the viscosity of the liquid for this system (see Figure 5).
Thus, for systems L23 + H2O and L23 + CaCl2, infiltration of the porous media under rapid compression is a nonuniform process in which clusters of filled pores ensuring percolation of the liquid to an infinitely large cluster of accessible but empty pores are formed after a new threshold c of infiltration through accessible pores is attained that exceeds the
known percolation threshold 0c . In accordance with the proposed model, the absorption of
the compression energy occurs at a constant pressure 0p , which exceeds pressure cp
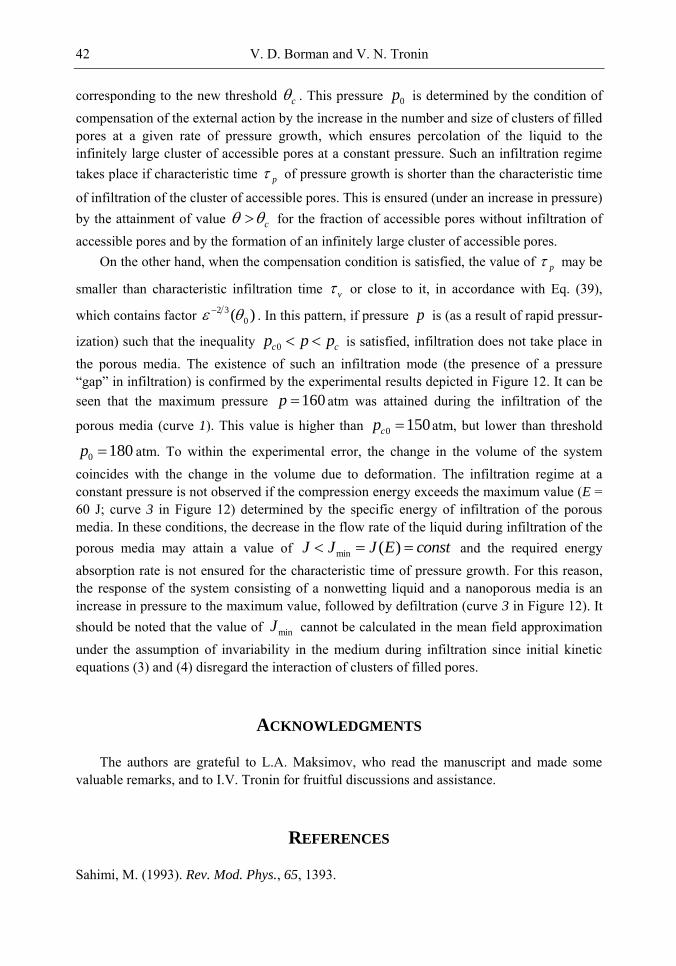
V. D. Borman and V. N. Tronin 42
corresponding to the new threshold c . This pressure 0p is determined by the condition of compensation of the external action by the increase in the number and size of clusters of filled pores at a given rate of pressure growth, which ensures percolation of the liquid to the infinitely large cluster of accessible pores at a constant pressure. Such an infiltration regime takes place if characteristic time p of pressure growth is shorter than the characteristic time
of infiltration of the cluster of accessible pores. This is ensured (under an increase in pressure) by the attainment of value c for the fraction of accessible pores without infiltration of accessible pores and by the formation of an infinitely large cluster of accessible pores.
On the other hand, when the compensation condition is satisfied, the value of p may be
smaller than characteristic infiltration time v or close to it, in accordance with Eq. (39),
which contains factor 2 3
0( ) . In this pattern, if pressure p is (as a result of rapid pressur-
ization) such that the inequality 0c cp p p is satisfied, infiltration does not take place in the porous media. The existence of such an infiltration mode (the presence of a pressure ―gap‖ in infiltration) is confirmed by the experimental results depicted in Figure 12. It can be seen that the maximum pressure 160p atm was attained during the infiltration of the
porous media (curve 1). This value is higher than 0 150cp atm, but lower than threshold
0 180p atm. To within the experimental error, the change in the volume of the system coincides with the change in the volume due to deformation. The infiltration regime at a constant pressure is not observed if the compression energy exceeds the maximum value (E = 60 J; curve 3 in Figure 12) determined by the specific energy of infiltration of the porous media. In these conditions, the decrease in the flow rate of the liquid during infiltration of the porous media may attain a value of min ( )J J J E const and the required energy absorption rate is not ensured for the characteristic time of pressure growth. For this reason, the response of the system consisting of a nonwetting liquid and a nanoporous media is an increase in pressure to the maximum value, followed by defiltration (curve 3 in Figure 12). It should be noted that the value of minJ cannot be calculated in the mean field approximation under the assumption of invariability in the medium during infiltration since initial kinetic equations (3) and (4) disregard the interaction of clusters of filled pores.
ACKNOWLEDGMENTS
The authors are grateful to L.A. Maksimov, who read the manuscript and made some valuable remarks, and to I.V. Tronin for fruitful discussions and assistance.
REFERENCES
Sahimi, M. (1993). Rev. Mod. Phys., 65, 1393.
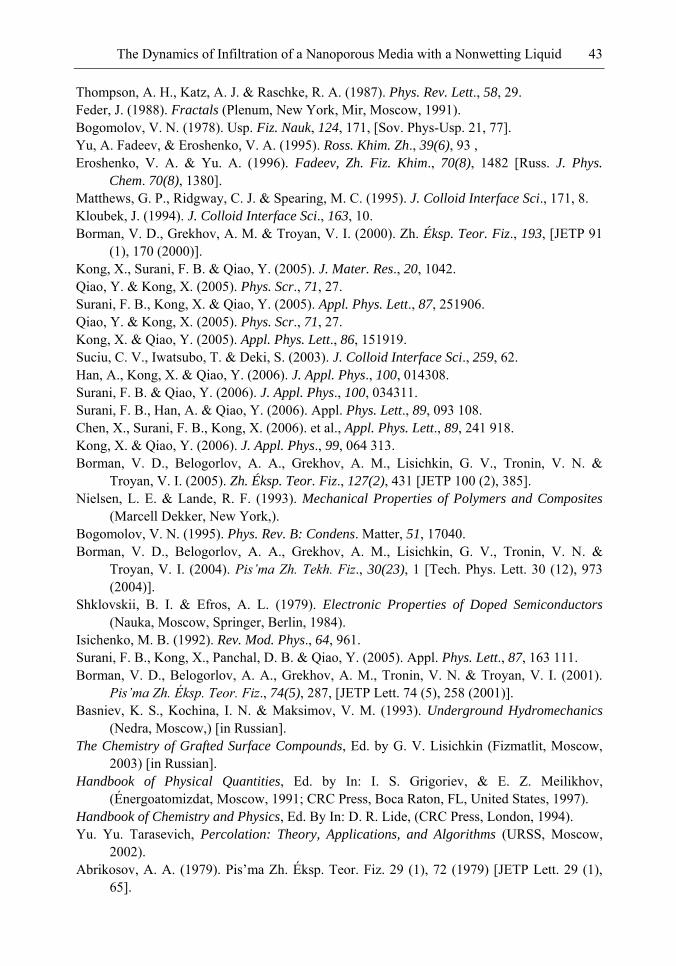
The Dynamics of Infiltration of a Nanoporous Media with a Nonwetting Liquid 43
Thompson, A. H., Katz, A. J. & Raschke, R. A. (1987). Phys. Rev. Lett., 58, 29. Feder, J. (1988). Fractals (Plenum, New York, Mir, Moscow, 1991). Bogomolov, V. N. (1978). Usp. Fiz. Nauk, 124, 171, [Sov. Phys-Usp. 21, 77]. Yu, A. Fadeev, & Eroshenko, V. A. (1995). Ross. Khim. Zh., 39(6), 93 , Eroshenko, V. A. & Yu. A. (1996). Fadeev, Zh. Fiz. Khim., 70(8), 1482 [Russ. J. Phys.
Chem. 70(8), 1380]. Matthews, G. P., Ridgway, C. J. & Spearing, M. C. (1995). J. Colloid Interface Sci., 171, 8. Kloubek, J. (1994). J. Colloid Interface Sci., 163, 10. Borman, V. D., Grekhov, A. M. & Troyan, V. I. (2000). Zh. Éksp. Teor. Fiz., 193, [JETP 91
(1), 170 (2000)]. Kong, X., Surani, F. B. & Qiao, Y. (2005). J. Mater. Res., 20, 1042. Qiao, Y. & Kong, X. (2005). Phys. Scr., 71, 27. Surani, F. B., Kong, X. & Qiao, Y. (2005). Appl. Phys. Lett., 87, 251906. Qiao, Y. & Kong, X. (2005). Phys. Scr., 71, 27. Kong, X. & Qiao, Y. (2005). Appl. Phys. Lett., 86, 151919. Suciu, C. V., Iwatsubo, T. & Deki, S. (2003). J. Colloid Interface Sci., 259, 62. Han, A., Kong, X. & Qiao, Y. (2006). J. Appl. Phys., 100, 014308. Surani, F. B. & Qiao, Y. (2006). J. Appl. Phys., 100, 034311. Surani, F. B., Han, A. & Qiao, Y. (2006). Appl. Phys. Lett., 89, 093 108. Chen, X., Surani, F. B., Kong, X. (2006). et al., Appl. Phys. Lett., 89, 241 918. Kong, X. & Qiao, Y. (2006). J. Appl. Phys., 99, 064 313. Borman, V. D., Belogorlov, A. A., Grekhov, A. M., Lisichkin, G. V., Tronin, V. N. &
Troyan, V. I. (2005). Zh. Éksp. Teor. Fiz., 127(2), 431 [JETP 100 (2), 385]. Nielsen, L. E. & Lande, R. F. (1993). Mechanical Properties of Polymers and Composites
(Marcell Dekker, New York,). Bogomolov, V. N. (1995). Phys. Rev. B: Condens. Matter, 51, 17040. Borman, V. D., Belogorlov, A. A., Grekhov, A. M., Lisichkin, G. V., Tronin, V. N. &
Troyan, V. I. (2004). Pis’ma Zh. Tekh. Fiz., 30(23), 1 [Tech. Phys. Lett. 30 (12), 973 (2004)].
Shklovskii, B. I. & Efros, A. L. (1979). Electronic Properties of Doped Semiconductors
(Nauka, Moscow, Springer, Berlin, 1984). Isichenko, M. B. (1992). Rev. Mod. Phys., 64, 961. Surani, F. B., Kong, X., Panchal, D. B. & Qiao, Y. (2005). Appl. Phys. Lett., 87, 163 111. Borman, V. D., Belogorlov, A. A., Grekhov, A. M., Tronin, V. N. & Troyan, V. I. (2001).
Pis’ma Zh. Éksp. Teor. Fiz., 74(5), 287, [JETP Lett. 74 (5), 258 (2001)]. Basniev, K. S., Kochina, I. N. & Maksimov, V. M. (1993). Underground Hydromechanics
(Nedra, Moscow,) [in Russian]. The Chemistry of Grafted Surface Compounds, Ed. by G. V. Lisichkin (Fizmatlit, Moscow,
2003) [in Russian]. Handbook of Physical Quantities, Ed. by In: I. S. Grigoriev, & E. Z. Meilikhov,
(Énergoatomizdat, Moscow, 1991; CRC Press, Boca Raton, FL, United States, 1997). Handbook of Chemistry and Physics, Ed. By In: D. R. Lide, (CRC Press, London, 1994). Yu. Yu. Tarasevich, Percolation: Theory, Applications, and Algorithms (URSS, Moscow,
2002). Abrikosov, A. A. (1979). Pis‘ma Zh. Éksp. Teor. Fiz. 29 (1), 72 (1979) [JETP Lett. 29 (1),
65].

V. D. Borman and V. N. Tronin 44
Morse, P. M. & Feshbach, H. (1953). Methods of Theoretical Physics (McGraw-Hill, New York, Inostrannaya Literatura, Moscow,), Vol. 2.
V. D. Borman, A. A. Belogorlov, G. V. Lisichkin, V. N. Tronin, and V. I. Troyan JETP, Vol. 108, No 3, March 2009.
In: Nanoporous Materials Types, Properties and Uses ISBN: 978-1-61668-182-1 Editor: Samuel B. Jenkins, pp. 45-71 © 2010 Nova Science Publishers, Inc.
Chapter 2
ENERGETICS AND PERCOLATION PROPERTIES OF
HYDROPHOBIC NANOPOROUS MEDIA
V. D. Borman and V. N. Tronin National Research Nuclear Univrsity MEPHI , Moscow, Russia
1. INTRODUCTION
Energetics of "nanoporous medium--nonwetting liquid" systems is one of the new directions in basic and applied research [1-8]. In the simple model of a porous media in the form of cylindrical channels, this threshold pressure is described by the Laplace--Washburn equation 2p R cos , where is the surface energy of the liquid, R is the pore radius,
and is the contact angle (for a nonwetting liquid, 90 ). For filling nanometer-sized pores by a nonwetting liquid with a surface energy of 0 05 0 5 J/m2, it is necessary to
apply a threshold pressure of 2 310 10 atm. When the liquid passes from the bulk of the material to a dispersed state in pores of the nanoporous medium with a specific volume of ~ 1 cm3/g, the absorbed and accumulated (returned when the liquid flows out) energy can reach 10 100 kJ/kg. This value is one order of magnitude higher than the energy observed for widely used materials, such as polymer composites and alloys with the shape memory effect [9-11].
Among the systems under investigation are silochromes, zeolites with liquid metals, hydrophobized silica gels, and zeolites with water and aqueous solutions of organic compounds and salts. In recent years, hydrophobized nanoporous media have become available owing to the development of the method used for modifying the surface of nanoporous media, for example, with alkyl chlorosilanes [6,7,12-22]. To date, nanoporous media with different pore shapes, porosities, specific surface areas, specific volumes, average pore radii, and pore size distributions have been studied [1,6,7,19,20,21-55]. The investigations performed thus far have been concerned primarily with equilibrium properties. Experiments have been carried out at a low compression rate of the system when the rate of
V. D. Borman and V. N. Tronin 46
increase in the pressure ( p ) in the liquid--porous media system is (10 3 -1) atm/s. In the infiltration-defiltration cycle, there is a hysteresis, so that the threshold pressure of infiltration is higher than the pressure of defiltration. Moreover, the majority of the systems studied are characterized by the phenomenon of nonoutflow of a nonwetting liquid when a part of this liquid remains in the porous medium as the excess pressure decreases to zero. The absorbed energy is determined by the product of the volume of filled pores and the difference between the infiltration and defiltration pressures. In frameworks the model of cylindrical channels, these pressures are described by the Laplace--Washburn equation with different angles of wetting. The phenomenon of nonoutflow of a nonwetting liquid has restricted the practical application of the system. These phenomena have been observed in the systems under investigation irrespective of the type of a modifier of the pore surface.
The revealed difference between the infiltration and defiltration pressures and the absorption of the mechanical energy observed in the infiltration--defiltration cycle due to the pressure hysteresis, as a rule, have been explained by the hysteresis of the contact angle; however, the mechanism responsible for the appearance of the latter hysteresis has remained unclear [4,7,19,20,21,22,56].
It has been established that the infiltration and defiltration pressures depend on the temperature and that, for the porous medium with a disordered structure of pores, the defiltration pressure increases (by several factors) with an increase in the temperature, whereas the infiltration pressure decreases only slightly (by less than 10%) or remains constant [21,22,24]. This means that, during infiltration and defiltration, the phenomenological contact angles differently depend on the temperature. For zeolites, the revealed temperature dependences exhibit a more complex behavior; moreover, the volume (V ) memory effect can be observed with an increase in the temperature and its subsequent decrease. It is worth noting that this effect is one order of magnitude (in V V ) stronger than that observed for known alloys and composites [10,11].
At present, there exist several hypothesis regarding the nature of the contact angle hysteresis. This hysteresis has been attributed to the rough surface of pores, the chemical inhomogeneity of the surface, and the dependence on the direction of the liquid motion [19,20].
In the framework of the concept that the porous medium is a system of cylindrical channels, the absorbed energy is expended for forming a liquid-porous media surface, which appears in the course of infiltration and disappears during defiltration at different pressures due to different contact angles [8,51,57]. In case of the closed hysteresis loop in the infiltration - full-defiltration process initial and finite states of the system are similar, the internal energy change 0dEEcicle
and the work done to perform the filling of the
porous medium should be equal to the thermal effect dQdA . The measurements carried
out in [19,58] showed that rise of temperature in the hydrophobic silica gel-water systems under investigation during infiltration-defiltration cycle was <10-3K. On the other hand, it was found in [47] that when one-third of the porous media volume of a similar system was filled and the liquid-porous medium interface area change was not equal to zero, the temperature did not increase within the limits of error (≤ 0.1K), while the estimation provides the temperature increase by T = 0.8K.
Energetics and Percolation Properties of Hydrophobic Nanoporous Media 47
In [57] the dependence of the thermal effect Q , which is accompanied by the thermal effect due to elastic compression of water and the porous media, on the filling degree in the hydrophobic silica gel-water system was measured. The author found that during infiltration
the heat generation took place ( 0Q ), whereas 0dT
d for water [59] and, consequently,
in case of independence of the wetting angle from temperature during the formation of liquid-
solid interface with area S one would expect the SdT
dTQ
value to be positive, i.e.
heat absorption shall be observed. In [57], it was experimentally found that, as the degree of infiltration increases, the quantity Q reaches a maximum and decreases to zero after the
complete infiltration of the porous media: Q =0. This result led the author of [57] actually to the conclusion that the first law of thermodynamics is violated in the process under investigation
Note that the energy absorption can not be to all appearance explained by viscous dissipation, since, as it ascertained in [60], change in viscosity of nonwetting liquid (aqueous solution of CaCl2) by 7 times does not alter the dependence of the filled volume on time, the threshold infiltration pressure and rate of filling hydrophobic silicagel.
In [61] the energy absorption during the infiltration-defiltration process is associated with the energy of formation of menisci. However, during infiltration (defiltration) if the wetting angle is independent of the filling degree, the area of menisci which are formed should be equal to the area of menisci disappeared, and therefore the formation energy at full infiltration (defiltration) should be equal to zero. It also does not allow to explain the results of [57].
Thus, the experimental data currently known seems to be self-contradictory and well-known traditional mechanisms of energy absorption do not make it possible to explain both the infiltration-defiltration hysteresis and special features of heat generation during the filling of nanoporous bodies with nonwetting liquid which are observed.
In the present work, we have established the relation between the energy properties of the interface and the percolation properties of the space of filled pores in a disordered porous media. The mechanism of energy absorbtion during filling of the nanoporous medium with nonwetting liquid is proposed. In accordance with this mechanism, the mechanical energy absorption is a result of expenditure of energy for the formation of menisci in the pores on the shell of the infinite cluster and expenditure of energy for the formation of liquid-porous medium interface in the pores belonging to the infinite cluster of filled pores. It has been demonstrated that the infiltration--defiltration cycle can be closed with the complete defiltration of the liquid and the reproducibility of the cycle when the specific relationship between the percolation properties of the porous media and the energy characteristics of the liquid-porous media and liquid-gas interfaces is satisfied. It turned out that, depending on porosity and, consequently, the number of nearest neighbors of the filled pores, the thermal effect can be either positive or negative. This makes it possible to explain the known experimental data [47,57] mentioned above and to describe the temperature dependences of the infiltration and defiltration pressures [21,22,24].
V. D. Borman and V. N. Tronin 48
2. THE MODEL OF A POROUS MEDIUM.
INFILTRATION FLUCTUATIONS
Let us consider a disordered porous medium infiltrated with a nonwetting liquid. It is assumed that the half-width of the pore size distribution R satisfies the inequality 3/ RR
, so that the fulfillment of this inequality ensures the independence of the percolation threshold from the radii of pores [62].
Filling of the porous media is a process of liquid infiltration into the disordered porous media which contains pores of different size. It is assumed that the size of the porous media a is much more than the maximum size of the pores maxR ( max
310 Ra [5]) so that the porous media can be regarded as infinite. Obviously, the infiltration of all the pores can take place only when the pores are connected with the surface and form a connected system. Consequently, the filling of the porous media can take place only when the pore system in it is far beyond the percolation threshold ( c ), is its porosity equal to the ratio of pores
to the porous media volume, c is the percolation threshold, which is the characteristic of the
porous media. For 3D systems, the percolation threshold 0.18c [63]. At the same time, the connectivity of pores with one another is the result of the formation of infinitely large clusters of pores at c . Figure 1 shows the dependence of the probability normalized to unity of a pore belonging to the infinitely large cluster on porosity .[63,64]
It can be seen from Figure 1 that, in the vicinity of the percolation threshold c , only a small number of pores (~1%) belong to the infinite cluster; therefore, in this case, only a small fraction of these pores, as well as pores that belong to the finite clusters connected with the boundary of the porous media, can be infiltrated. At increasing porosity and for c
( ) 1P and, consequently, the pore space becomes homogeneous due to the growth of the infinitely large cluster of pores. Under these conditions, the infiltration of the porous media can be described as the infiltration of an infinite cluster of pores. It is this infiltration that will be considered in the present paper.
It is assumed that thermal fluctuations at the pressure р in the vicinity of the infiltration threshold of the porous medium bring about the formation of macroscopically small regions in the form of clusters consisting of N pores filled with a liquid. Each cluster arises at the boundary of the porous medium and, in the view of the boundedness of the pore volume, grows through the attachment of the other filled pores to it. We believe that, at the beginning of the growth, each cluster can be considered a system of branched chains consisting of filled pores. In the course of infiltration of the porous medium with the liquid, the external pressure does the work. This process is accompanied by the formation of energetically unfavorable surfaces of both the menisci of the liquid in pores and the liquid--porous medium interfaces. Moreover, the state of the gas in the pores and the elastic state of the porous media change as well. If the adiabatic work of formation of an infiltration fluctuation is A(N) and the energy of dissipation due to the friction can be disregarded (see [5]), the probability of the formation of a fluctuation can be written as w~wо exp(S) [65], where S=-A/T is the fluctuation of the entropy. Therefore, an increase in the quantity A (A>0) with an increase in the number of
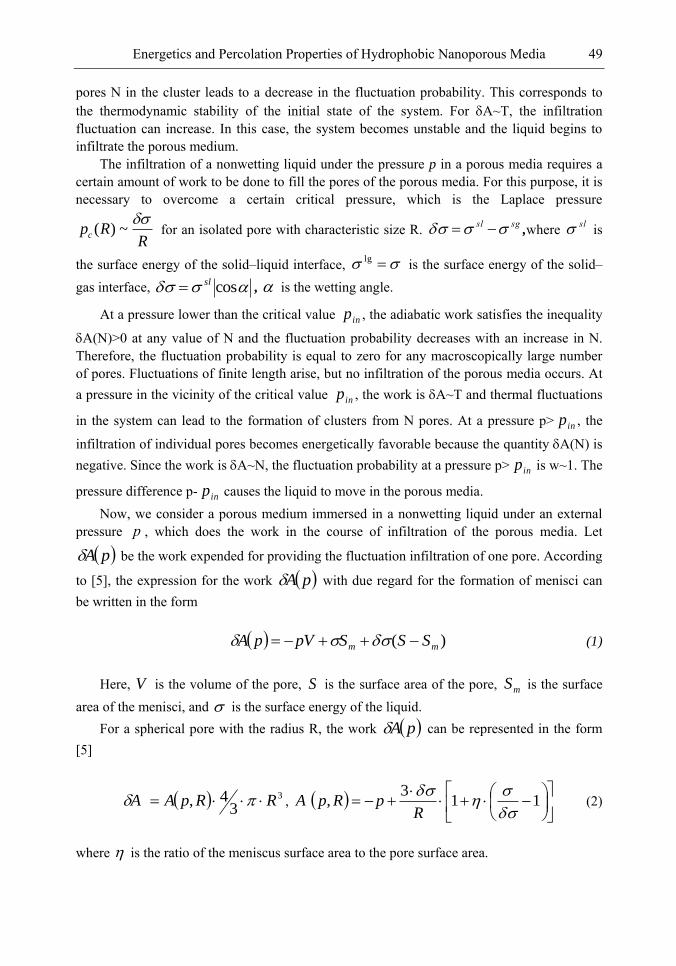
Energetics and Percolation Properties of Hydrophobic Nanoporous Media 49
pores N in the cluster leads to a decrease in the fluctuation probability. This corresponds to the thermodynamic stability of the initial state of the system. For А~Т, the infiltration
fluctuation can increase. In this case, the system becomes unstable and the liquid begins to infiltrate the porous medium.
The infiltration of a nonwetting liquid under the pressure p in a porous media requires a certain amount of work to be done to fill the pores of the porous media. For this purpose, it is necessary to overcome a certain critical pressure, which is the Laplace pressure
( ) ~cp RR
for an isolated pore with characteristic size R. sgsl ,where
sl is
the surface energy of the solid–liquid interface, lg is the surface energy of the solid–
gas interface, cossl , is the wetting angle.
At a pressure lower than the critical value inp , the adiabatic work satisfies the inequality
A(N)>0 at any value of N and the fluctuation probability decreases with an increase in N. Therefore, the fluctuation probability is equal to zero for any macroscopically large number of pores. Fluctuations of finite length arise, but no infiltration of the porous media occurs. At a pressure in the vicinity of the critical value inp , the work is А~Т and thermal fluctuations
in the system can lead to the formation of clusters from N pores. At a pressure р> inp , the
infiltration of individual pores becomes energetically favorable because the quantity A(N) is negative. Since the work is А~N, the fluctuation probability at a pressure р> inp is w~1. The
pressure difference р- inp causes the liquid to move in the porous media. Now, we consider a porous medium immersed in a nonwetting liquid under an external
pressure p , which does the work in the course of infiltration of the porous media. Let
pA be the work expended for providing the fluctuation infiltration of one pore. According
to [5], the expression for the work pA with due regard for the formation of menisci can be written in the form
)( mm SSSpVpA (1)
Here, V is the volume of the pore, S is the surface area of the pore, mS is the surface area of the menisci, and is the surface energy of the liquid.
For a spherical pore with the radius R, the work pA can be represented in the form [5]
3
34, RRpAA ,
11
3,
RpRpA (2)
where is the ratio of the meniscus surface area to the pore surface area.
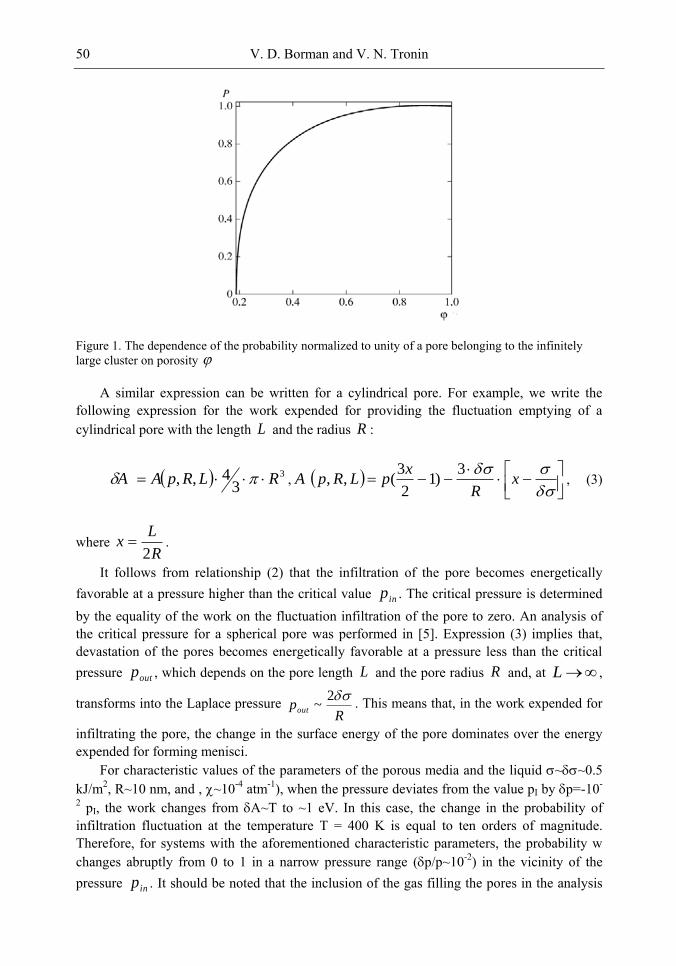
V. D. Borman and V. N. Tronin 50
Figure 1. The dependence of the probability normalized to unity of a pore belonging to the infinitely large cluster on porosity
A similar expression can be written for a cylindrical pore. For example, we write the following expression for the work expended for providing the fluctuation emptying of a cylindrical pore with the length L and the radius R :
3
34,, RLRpAA ,
x
R
xpLRpA
3)1
2
3(,, , (3)
where R
Lx
2 .
It follows from relationship (2) that the infiltration of the pore becomes energetically favorable at a pressure higher than the critical value inp . The critical pressure is determined by the equality of the work on the fluctuation infiltration of the pore to zero. An analysis of the critical pressure for a spherical pore was performed in [5]. Expression (3) implies that, devastation of the pores becomes energetically favorable at a pressure less than the critical pressure outp , which depends on the pore length L and the pore radius R and, at L ,
transforms into the Laplace pressure R
pout
2~ . This means that, in the work expended for
infiltrating the pore, the change in the surface energy of the pore dominates over the energy expended for forming menisci.
For characteristic values of the parameters of the porous media and the liquid ~~0.5 kJ/m2, R~10 nm, and , ~10-4 atm-1), when the pressure deviates from the value рI by р=-10-
2 рI, the work changes from А~T to ~1 eV. In this case, the change in the probability of infiltration fluctuation at the temperature T = 400 K is equal to ten orders of magnitude. Therefore, for systems with the aforementioned characteristic parameters, the probability w changes abruptly from 0 to 1 in a narrow pressure range (p/p~10-2) in the vicinity of the pressure inp . It should be noted that the inclusion of the gas filling the pores in the analysis
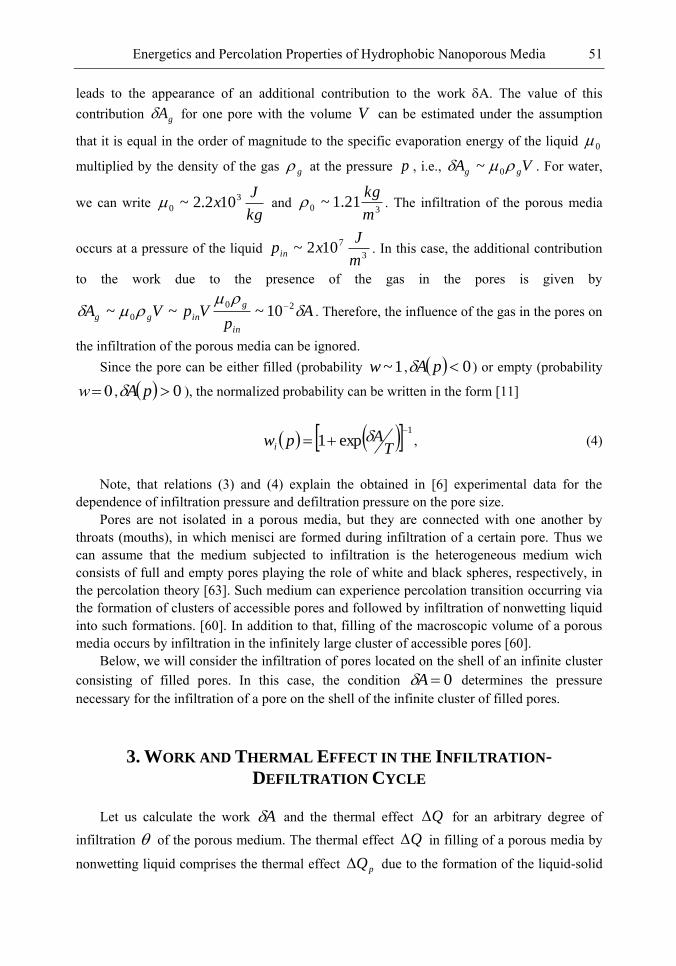
Energetics and Percolation Properties of Hydrophobic Nanoporous Media 51
leads to the appearance of an additional contribution to the work A. The value of this contribution gA for one pore with the volume V can be estimated under the assumption
that it is equal in the order of magnitude to the specific evaporation energy of the liquid 0
multiplied by the density of the gas g at the pressure p , i.e., VA gg 0~ . For water,
we can write kg
Jx 3
0 102.2~ and 30 21.1~
m
kg . The infiltration of the porous media
occurs at a pressure of the liquid 3
7102~m
Jxpin . In this case, the additional contribution
to the work due to the presence of the gas in the pores is given by
Ap
VpVAin
g
ingg
20
0 10~~~ . Therefore, the influence of the gas in the pores on
the infiltration of the porous media can be ignored. Since the pore can be either filled (probability 1~w , 0pA ) or empty (probability
0w , 0pA ), the normalized probability can be written in the form [11]
1
exp1
T
Apwi , (4)
Note, that relations (3) and (4) explain the obtained in [6] experimental data for the dependence of infiltration pressure and defiltration pressure on the pore size.
Pores are not isolated in a porous media, but they are connected with one another by throats (mouths), in which menisci are formed during infiltration of a certain pore. Thus we can assume that the medium subjected to infiltration is the heterogeneous medium wich consists of full and empty pores playing the role of white and black spheres, respectively, in the percolation theory [63]. Such medium can experience percolation transition occurring via the formation of clusters of accessible pores and followed by infiltration of nonwetting liquid into such formations. [60]. In addition to that, filling of the macroscopic volume of a porous media occurs by infiltration in the infinitely large cluster of accessible pores [60].
Below, we will consider the infiltration of pores located on the shell of an infinite cluster consisting of filled pores. In this case, the condition 0A determines the pressure necessary for the infiltration of a pore on the shell of the infinite cluster of filled pores.
3. WORK AND THERMAL EFFECT IN THE INFILTRATION-
DEFILTRATION CYCLE
Let us calculate the work A and the thermal effect Q for an arbitrary degree of
infiltration of the porous medium. The thermal effect Q in filling of a porous media by
nonwetting liquid comprises the thermal effect pQ due to the formation of the liquid-solid
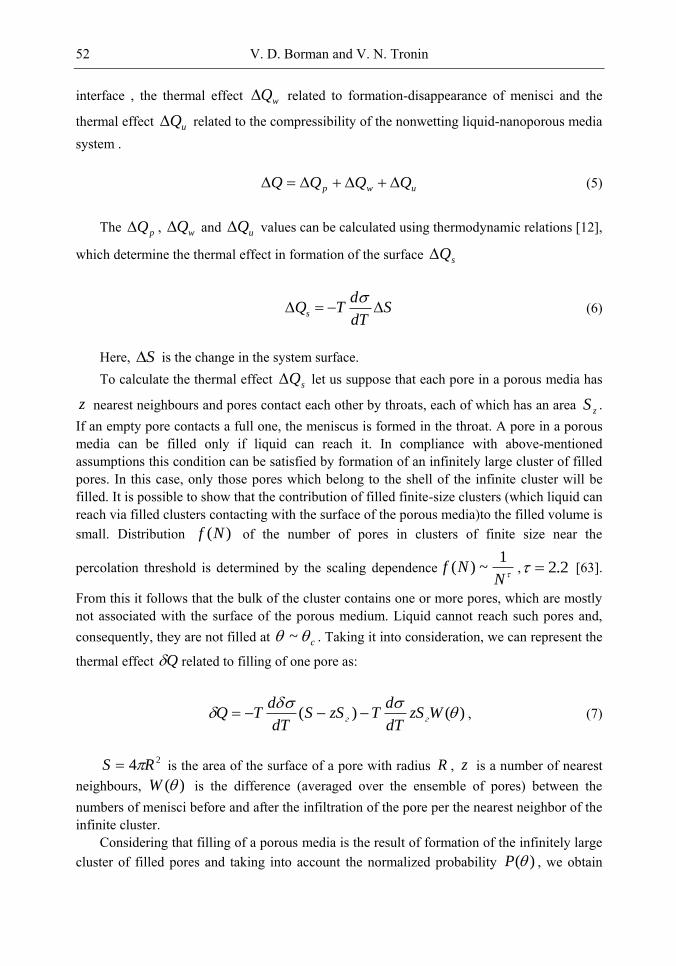
V. D. Borman and V. N. Tronin 52
interface , the thermal effect wQ related to formation-disappearance of menisci and the
thermal effect uQ related to the compressibility of the nonwetting liquid-nanoporous media system .
uwp QQQQ (5)
The pQ , wQ and uQ values can be calculated using thermodynamic relations [12],
which determine the thermal effect in formation of the surface sQ
s
dQ T S
dT
(6)
Here, S is the change in the system surface. To calculate the thermal effect sQ let us suppose that each pore in a porous media has
z nearest neighbours and pores contact each other by throats, each of which has an area zS . If an empty pore contacts a full one, the meniscus is formed in the throat. A pore in a porous media can be filled only if liquid can reach it. In compliance with above-mentioned assumptions this condition can be satisfied by formation of an infinitely large cluster of filled pores. In this case, only those pores which belong to the shell of the infinite cluster will be filled. It is possible to show that the contribution of filled finite-size clusters (which liquid can reach via filled clusters contacting with the surface of the porous media)to the filled volume is small. Distribution )(Nf of the number of pores in clusters of finite size near the
percolation threshold is determined by the scaling dependence1
( ) ~f NN
, 2.2 [63].
From this it follows that the bulk of the cluster contains one or more pores, which are mostly not associated with the surface of the porous medium. Liquid cannot reach such pores and, consequently, they are not filled at c ~ . Taking it into consideration, we can represent the
thermal effect Q related to filling of one pore as:
)()(
WzSdT
dTzSS
dT
dTQ гг , (7)
24 RS is the area of the surface of a pore with radius R , z is a number of nearest neighbours, )(W is the difference (averaged over the ensemble of pores) between the numbers of menisci before and after the infiltration of the pore per the nearest neighbor of the infinite cluster.
Considering that filling of a porous media is the result of formation of the infinitely large cluster of filled pores and taking into account the normalized probability )(P , we obtain
Energetics and Percolation Properties of Hydrophobic Nanoporous Media 53
that the quantity of heat per a pore released in the process of filling the porous media to the degree of filling can be written as:
(8)
0
)()( dWzSdT
dTQ zw
Here, )(Rf is the function normalized to unity of the size distribution for pores. For a disordered porous media average values in (8) can be calculated in the framework of a specific model of a porous media. We will use the model of randomly arranged spheres in which pores represent randomly arranged spherical holes [66]. This model does not take into account correlations in location of pores with different radii in accordance with assumption made about the narrowness of size distribution for pores RR )( . In accordance with the model, the average number of nearest neighbours z , associated with porosity of medium , and the area of a throat can be written in forms [66]
)1ln(8 zz (9)
22
256
9RS z
Using expression (8) and taking into account that RR )( , we obtain from (9):
0
2
0
2
)(4
)(4)1()(
dWRdT
dTQ
dPRdT
dTQ
w
p 2
1024
9 z (10)
To calculate )(W we consider an empty pore located on the perimeter of the infinite cluster of filled pores. Let us suppose that this pore contacts the infinitely large cluster of filled pores via n throats. Thus, menisci are formed in all n mouths and menisci are absent in the remaining z-n throats. After filling this pore, menisci which were there at the beginning of infiltration disappear and the number of menisci will be equal to z-n. In this case we can write
)(W as:
)()(
)()()(
0
0
RfzSSdRzSS
dPzSSdT
dTQ
zz
zp
V. D. Borman and V. N. Tronin 54
)!(!
!2)1())(()( 1
1 nzn
z
z
nzPW nzn
z
n
(11)
The first factor under the summation sign determines the probability that an empty pore contacts the infinite cluster of filled pores n times, the second factor is the probability of finding the empty pore close to the infinite cluster, provided that this pore is surrounded by z-n empty pores and therefore has z-n throats. The third factor determines the difference between a relative number of menisci after (z-n) and before (n) the filling of the pore. The binomial coefficient takes into account variants of allocation of n menisci on number of pore nearest neighbours. Note that the obtained expression coincides with the full perimeter of the infinitely large cluster calculated in [67], if the third factor is substituted for unity.
The sum in Eq. (11) can be calculated analytically
112 )1()1)())((1)(2()( zzPPPW (12)
Relations (9), (10), (12) determine the thermal effect during filling a porous media with porosity to the degree of filling .
The work A expended for infiltrating the porous media to the volume determined by the fraction and the corresponding work expended for infiltrating one pore )( inA can be
calculated from the thermodynamic relationship dSA [65]. By using expression (2)
for spherical pores, we obtain
0
2
0
2
223
)(4 ,)(4)1()(
)(44)1(3
4),(
dWRAdPRA
AAA
WRRR
ppA
wp
wp
in
(13)
The sum of heat (10) and work (13) determines the change in the energy of isothermal infiltration of the porous medium:
0
2
0
2 )(4)( ,)(4)1)(( dWRdT
dTEdPR
dT
dTE
EEE
wp
wp (14)
It follows from (14) that the change in energy of the system during filling the porous medium is determinded by the specific surface energies and , geometric properties of the porous medium and the evolution of the infinite cluster of filled pores, which depends on the properties the disordered porous medium (Figure 1).
Energetics and Percolation Properties of Hydrophobic Nanoporous Media 55
For the calculation of the work )(A and the thermal effect vQ arising upon the defiltration of the liquid from the porous medium, it should be noted that, in the infiltrated porous media, the defiltration of the liquid leads to the formation of empty pores surrounded by at least one filled pore connected through other filled pores with the surface of the porous medium. As in case of filling, the formation of an empty pore goes with the change in surface energy of the liquid-solid and liquid-gas interfaces as well. The change in surface energy is associated with formation-disappearance of menisci [5].
Taking into account this fact, the work expended for emptying the pore in the porous medium )(A with the degree of infiltration and the thermal effect vQ associated with the defiltration of the liquid from one pore in the porous media can be written in the form
)(44)1(3
4)( 1
223
WRRR
pAout
0
1
2
0
2 )(4 ,4)1()( dWRAdRA wv
pv
)()( 1
WzSdT
dTzSS
dT
dTQ ггv (15)
Relations (7) and (15) differ in sign of the last term and the functions )(W and )(1 W which determine the difference per one nearest neighbour between the number of menisci before and after infiltration (defiltration) in pores.
In contrast to the case of infiltration, the defiltration of the liquid occurs initially through the formation of individual empty pores and clusters of empty pores with a decrease in the pressure and, after the infinite cluster of empty pores is formed, through the formation of pores on the shell of this cluster. Upon the defiltration when the low degree of infiltration is reached, the liquid can be retained in the porous medium if it is contained in individual pores or clusters of filled pores surrounded by empty pores with smaller sizes from which the liquid defiltrated at higher pressures. However, as the number of neighbors of empty pores increases, according to relationships (15) (see below Figs. 1-3), the defiltration of the liquid becomes energetically more favorable; i.e., it should proceed at higher pressures. Therefore, the quantity )(1 W should be defined as the difference (averaged over the ensemble of pores) between the numbers of menisci before and after the emptying of the pore on the shell of the system of empty pores. Taking it into consideration, calculation of )(1 W gives:
12
1 )1()132()( zW (16)
The thermal effect, the work, and the change in the energy during the defiltration, when the degree of infiltration varies from 1 to , can be written in the form similar to relationships (10), (13), and (14):
V. D. Borman and V. N. Tronin 56
0
1
2
0
2 )(4 ,4)1()( dWRdT
dTQdR
dT
dTQ w
vp
v
0
1
2
0
2 )(4 ,4)1()( dWRAdRA wv
pv (17)
0
1
2
0
2 )(4)( ,4)1)(( dWRdT
dTEdR
dT
dTE w
vp
v
Expressions (17), like relationships (10), (13), and (14), are valid for the case of an isothermal process. This implies that they can be used for describing experiments in the case where the characteristic time of heat transfer (removal) Q is considerably shorter than the
characteristic time V of change in the volume of the nanoporous media--nonwetting liquid
system: Q << V . At Q V , the temperature and, correspondingly, the quantities ,
, dT
d, and
dT
d become dependent on the time and, hence, on the degree of infiltration
. In this case, they should be introduced under the integral sign in relationships (14) and (17).
4. CONDITIONS FOR THE CLOSED CYCLE
It can be seen from relationships (14) and (17) that, if after the increase in pressure and the infiltration of all pores of the nanoporous media with a liquid and the subsequent decrease in pressure and the complete defiltration, the system reverts to its original state, the following relationship should hold true:
EdWWdT
dTdP
dT
dT
1
0
1
1
0
))()(()())(()1)((
(18)
E =0
Here, E is the change in the internal energy of the system upon the transition from the initial state to the final state in the course of infiltration and defiltration.
Expression (18) relates the energy parameters of the liquid--solid and liquid--gas interfaces and the macroscopic characteristics of the porous media, such as the porosity ,
the structure of the percolation cluster ( )P , and the quantities W and 1W , which determine
the dependence on for the surface of menisci at the mouths of filled pores on the shell of an infinite cluster of filled pores in the case of infiltration and for the surface of menisci in pores on the shell of all clusters of empty pores (including the infinite cluster) in the case of
Energetics and Percolation Properties of Hydrophobic Nanoporous Media 57
defiltration. It follows from relationships (18) that the absorbed energy in contraction and expansion of the system in the closed cycle is dependent on the quantities and and equal to the total heat released upon the formation and disappearance of the liquid--solid and liquid--gas surfaces. This heat is determined by the independent quantities, namely, the derivatives of the quantities and with respect to temperature. The integrals in expression (18) account for the different paths of the system in the course of infiltration and defiltration. In the closed cycle, according to relationships (10), (13), (17), and (18), during the infiltration and defiltration, the system undergoes different sequences of equilibrium states that differ in macroscopic sets of filled pores.
In particular, the infiltration of the porous medium according to expression (18) is accompanied by an increase in the number of pores that belong to the infinite cluster of filled pores and by a change in the number of menisci in pores on the shell of this cluster. The defiltration of the porous medium is accompanied by an increase in the number of pores in all clusters (including the infinite cluster of empty pores and single pores) and by a change in the number of menisci on the shell of the entire system of empty pores. As follows from relationships (9), (10), and (16), these sequences of states depend on the porosity and the number of neighbors z in the system of connected pores. Therefore, in terms of the percolation theory and the model under consideration, the contact angle hysteresis is associated with different (in infiltration and defiltration) macroscopic properties of systems of filled and emptied pores that manifest themselves as different spatial distributions of the liquid in the connected pores. If the sets of macroscopic equilibrium states characterized by the distributions of filled and empty pores in the course of infiltration and defiltration were identical, the total thermal effect in the closed cycle would be equal to zero. In this case, the thermodynamic relationship (18) for the closed cycle is not satisfied.
The closed cycle and, consequently, the complete transformation of the work into the heat was observed for a number of water--hydrophobized silica gel systems [7,17,18,21,22]. In particular, the complete emptying of pores after the infiltration and the subsequent defiltration with a decrease in the excess pressure to zero was observed in [17,18] for the KSK-G silica gel modified by n-alkylsilane molecules ( 8 16n ) grafted to the silica gel surface with a surface density higher than 2 nm-2. Before the modification, the specific surface area, the pore volume, and the average pore radius for this silica gel were equal to 310 20 m2/g, 0.95 cm3/g, and 5 2R nm, respectively. The values of these quantities after the modification are not presented in [7,8], which complicates the analysis of the results obtained in these works. The closed cycle was also observed in [21] for the water-C&W silica gel (Waters) system in which the silica gel was modified by n-alkylsilane with the chain length 8n , the average pore radius 4 2R , and the specific pore volume of 0.53 m2/g in the temperature range 287 333 K. The authors established that the small nonoutflow ( 1
%) takes place only at a temperature of 278 K. For the systems containing water and the Fluka 60 C8 silica gel, as well as the Zorbax Z4, Z8, Z18, and PEP10C18 silica gels, the closed cycle was observed in [7, 22]. In [7], the authors investigated the infiltration and defiltration in four porous media MCM41 with pores in the form of cylindrical channels. These media were also modified by n-alkylsilane with 8n and a surface density of 2.1 nm-
2 and had the average pore radii 1 3 1 6 2 0 5 4R nm. The phenomenon of nonoutflow
V. D. Borman and V. N. Tronin 58
was observed only for the porous medium with 5 4R nm, whereas the other porous media
with 1 3 1 6 2 0R nm underwent a closed infiltration-defiltration cycle. For the porous medium with specified parameters of the macroscopic structure of the
pore space, the closed cycle with the complete defiltration, according to relationship (18), is possible only when the values of the quantities , , d dT and d dT fall in particular ranges. Therefore, relationship (18) requires a separate detailed quantitative analysis, which will be performed elsewhere. It should be noted that this analysis, in turn, necessitates the knowledge of the values of the quantities , , d dT and d dT ; the porosity; the pore size distribution (which is changed after the modification [19]); and the quantities Q and A . Here, we restrict our consideration to the qualitative analysis of the available experimental data for which relationship (18) is not satisfied and the sum of the work and the heat in the cycle is equal to the change in the internal energy of the system. In this case, the mechanical work dissipated by the system is not equal to the total heat release, as it was described in [34]. The phenomenon of nonoutflow associated with the change in the internal energy is characteristic of the majority of the studied hydrophobic porous media and liquids, namely, water [7,8,19,20, 23,24,34,35,36,37,40], aqueous solutions of salts [27,28,33], organic compounds, ethylene glycol [5], alcohol [25], and glycerol [47], as well as systems with the liquid metal [1], Wood's alloy [4], and mercury [68,69].
For water, the derivative involved in relationship (18) has the value 41.510d dT J/m2 K [70]. As the temperature changes from 293 K to 353 K, the surface energy in accordance with this value of the derivative changes by 5 %. Such a small change of the surface energy in the system containing water and the modified Fluka 100 C8 silica gel appears to be sufficient that the closed cycle will transform into the cycle with a nonoutflow of more than 80% of water with a decrease in the temperature from 353 to 293 K [24]. This cycle is characterized by a change in the internal energy of the system ( 0E ). The quantity E reflects both the reversible and irreversible changes in repeated infiltration--defiltration cycles. The reversible change can be associated with the adsorption of water on the modified surface [7,8]. This water evaporates already at room temperature (and more rapidly at an elevated temperature), and the first cycle with nonoutflow is reproduced [7,23,25]. The differential thermal analysis performed in [7] demonstrated that water evaporates at a temperature 373T K. The irreducible change of the internal energy E is governed by the interaction of the liquid with the surface of the porous medium and depends on the maximum pressure during the infiltration [25], the temperature and time of heating of the system [23], and the procedure used for preparing the surface after the modification [33]. The change of the internal energy E also depends on the length (n) of the grafted n-alkylsilane molecule. It is worth noting that, for water and silica gels, an increase in n from 4 to 18 leads to a decrease in the nonoutflow and a decrease in the change of the internal energy
E [7,8,16,17,18], whereas for water and the modified medium, the closed cycle is observed for 1n and the complete nonoutflow takes place for 8n [32]. An increase in the concentration of the NaCl or CaCl2 salt in the aqueous solution in specific ranges leads to an increase in the quantity and a decrease in the change of the internal energy E for the Fluka 100 C8 silica gel [25,27,28,32-34]. A decrease in the concentration of ethylene glycol in the aqueous solution and the hydrophobic silica gel L23 results in the transition from the
Energetics and Percolation Properties of Hydrophobic Nanoporous Media 59
complete nonoutflow at a concentration 15c % to the closed cycle (the nonoutflow is less than <5%) [5]. Unlike ethylene glycol, ethanol wets the modified surface of the Fluka 100 C8 silica gel. This brings about the adsorption of ethanol and an increase in the change of the internal energy E [26].
In recent years, experimental data have been published on the infiltration of hydrophobic zeolites with water and aqueous solutions of salts [25-33]. It has been revealed that, for systems containing water and silicalite 1 (OH), silicalite 1 (F ), and ZSM-5 zeolite, the hysteresis is not observed and the pressure dependences of the volume of the system measured for the infiltration and defiltration coincide with each other. This means that such systems exhibit properties of an elastic spring without dissipation at 0E in the cycle. With a cyclic change in the temperature from 358 to 318 K, these systems manifest a volume memory effect [10,11]. For the water--MFI zeolite system, the dependences of the pressure on the volume and temperature during the infiltration remain unchanged when the rate of decrease in the volume changes by three orders of magnitude [23]. This implies that the Laplace--Washburn and Poiseuille equations are not applicable to the system under investigation. The infiltration--defiltration hysteresis was observed for a KCl aqueous solution and the Zeolyst CBV-901 (HY) zeolite treated with SiCl4 [20]. This hysteresis depends on the nature of the anion and, for the Y(ZY) zeolite, on the nature of the cation (Li, Na, K, Cs); in this case, the infiltration pressure decreases with an increase in the cation radius [32].
In the analysis of experimental results obtained for zeolites, it is necessary to take into account that, for a channel (pore) diameter smaller than 1 nm, the liquid acquires properties of one-dimensional systems [41,71-73], which differ qualitatively from the properties of the liquid in channels of larger sizes. This problem requires a separate analysis.
In conclusion of the discussion of relationship (18), we should note that it was derived under the assumption that 3R R in the absence of correlations in the mutual arrangement of pores of different sizes and with the use of the model of pores as a system of randomly arranged spheres. Relationship (18) for the closed cycle does not contain the average pore radius R ; however, the value of R affects the porosity and, hence, the
number of neighbors z , the structure of the percolation cluster, and the quantities ( )W and
1( )W .
5. TEMPERATURE DEPENDENCES OF THE INFILTRATION
AND DEFILTRATION PRESSURES
Now, we analyze the signs of the derivatives d dT and d dT involved in relationship (18) and the integrals of the quantities ( )P and 1[ ( ) ( )]W W . It follows from relation (10) that the sign of the total thermal effect during infiltration is determined by signs of pQ , wQ values.
V. D. Borman and V. N. Tronin 60
The sign of the thermal effect due to the formation of the liquid-solid media interface
pQ depends on the sign of d
dT
, which can be ascertained using known dependences of
pressure at the beginning of infiltration inp and defiltration outp on temperature. The experiments carried out showed that for all investigated systems (modified silica gel - water, aqueous solutions of salts) the pressure at the beginning of infiltration changes not much as
temperature increases 0dT
dpin , while the defiltration pressure increases as temperature rises
[24,46]. Therefore, in order to determine the sign of the derivative dT
d, we calculate the
pressures required for the infiltration of one pore on the shell of the infinite cluster and the defiltration of the liquid from an arbitrary pore under the conditions 0inA and 0outA
, which follow from relationship (4). By assuming that the quantities , R , and W do not depend on the temperature and taking into account that the infiltration and defiltration begin in the vicinity of the corresponding percolation threshold from relationships (13) and (15), the
derivatives dT
dpin and dT
dpout can be written in the following form:
3
(1 ) ( )dp d din W
mdT R dT dT
(19)
1
3(1 ) ( 1 )out
n
dp d dW
dT R dT dT
. (20)
It follows from eq. (12),(16) that ( ) 0mW 1( 1 ) 0nW , ,m n -
maximum functions ( )W and 1(1 )W . Since 0dT
dpin , it follows from eq. (19), (20)
that
(1 ) ~ ( )m
d dW
dT dT
(21)
Hence, the sign of dT
d is opposite to the sign of dT
d. The coefficient of the surface
tension of the liquid-gas interface decreases as temperature increases, and vanishes at critical
point so that 0dT
d [70]. For water, value
dT
d is -1.5х10
-4 J/m2K.[70]. In this case, from
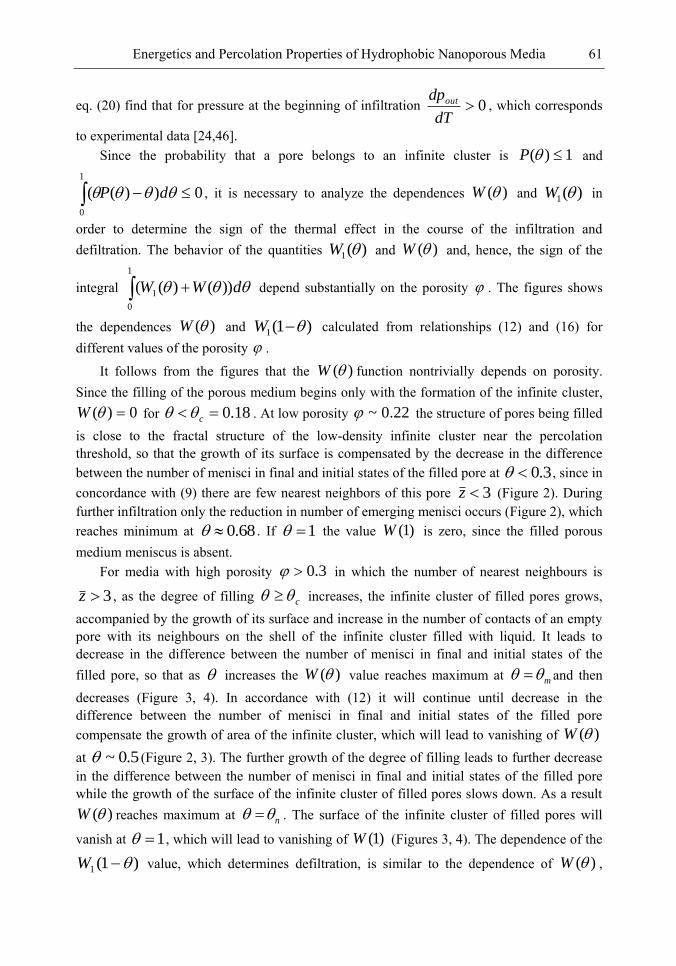
Energetics and Percolation Properties of Hydrophobic Nanoporous Media 61
eq. (20) find that for pressure at the beginning of infiltration 0dT
dpout , which corresponds
to experimental data [24,46]. Since the probability that a pore belongs to an infinite cluster is 1)( P and
0))((
1
0
dP , it is necessary to analyze the dependences )(W and )(1 W in
order to determine the sign of the thermal effect in the course of the infiltration and defiltration. The behavior of the quantities )(1 W and )(W and, hence, the sign of the
integral
1
0
1 ))()(( dWW depend substantially on the porosity . The figures shows
the dependences )(W and )1(1 W calculated from relationships (12) and (16) for different values of the porosity .
It follows from the figures that the )(W function nontrivially depends on porosity. Since the filling of the porous medium begins only with the formation of the infinite cluster,
0)( W for 18.0 c . At low porosity 22.0~ the structure of pores being filled is close to the fractal structure of the low-density infinite cluster near the percolation threshold, so that the growth of its surface is compensated by the decrease in the difference between the number of menisci in final and initial states of the filled pore at 3.0 , since in concordance with (9) there are few nearest neighbors of this pore 3z (Figure 2). During further infiltration only the reduction in number of emerging menisci occurs (Figure 2), which reaches minimum at 0.68 . If 1 the value )1(W is zero, since the filled porous medium meniscus is absent.
For media with high porosity 3.0 in which the number of nearest neighbours is
3z , as the degree of filling c increases, the infinite cluster of filled pores grows, accompanied by the growth of its surface and increase in the number of contacts of an empty pore with its neighbours on the shell of the infinite cluster filled with liquid. It leads to decrease in the difference between the number of menisci in final and initial states of the filled pore, so that as increases the )(W value reaches maximum at m and then decreases (Figure 3, 4). In accordance with (12) it will continue until decrease in the difference between the number of menisci in final and initial states of the filled pore compensate the growth of area of the infinite cluster, which will lead to vanishing of )(W at 5.0~ (Figure 2, 3). The further growth of the degree of filling leads to further decrease in the difference between the number of menisci in final and initial states of the filled pore while the growth of the surface of the infinite cluster of filled pores slows down. As a result
)(W reaches maximum at n . The surface of the infinite cluster of filled pores will
vanish at 1 , which will lead to vanishing of )1(W (Figures 3, 4). The dependence of the
)1(1 W value, which determines defiltration, is similar to the dependence of )(W ,
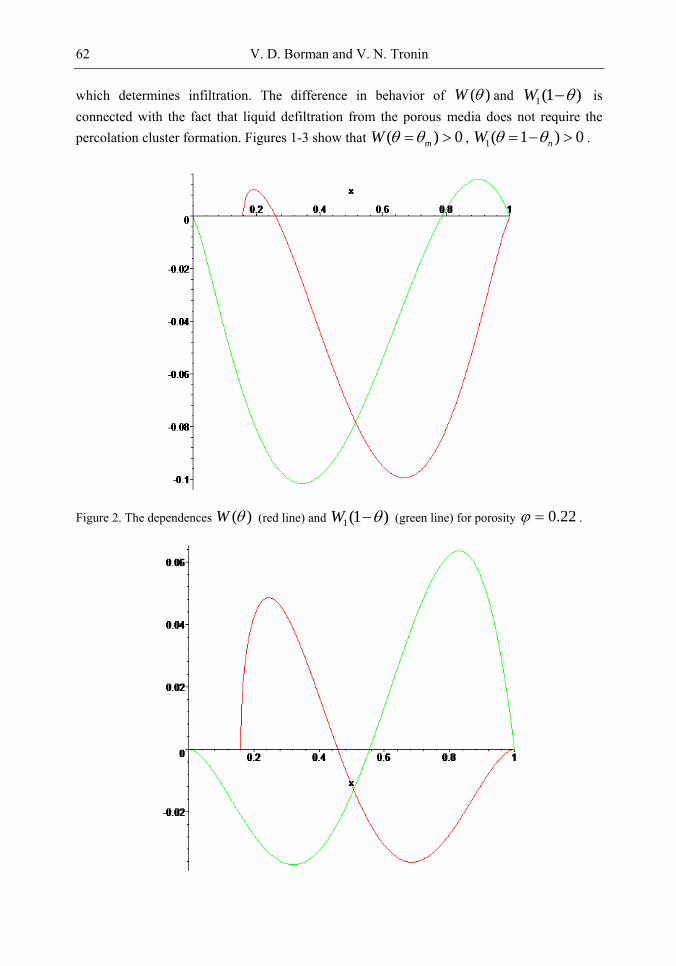
V. D. Borman and V. N. Tronin 62
which determines infiltration. The difference in behavior of )(W and )1(1 W is connected with the fact that liquid defiltration from the porous media does not require the percolation cluster formation. Figures 1-3 show that ( ) 0mW , 1( 1 ) 0nW .
Figure 2. The dependences )(W (red line) and )1(1 W (green line) for porosity 22.0 .
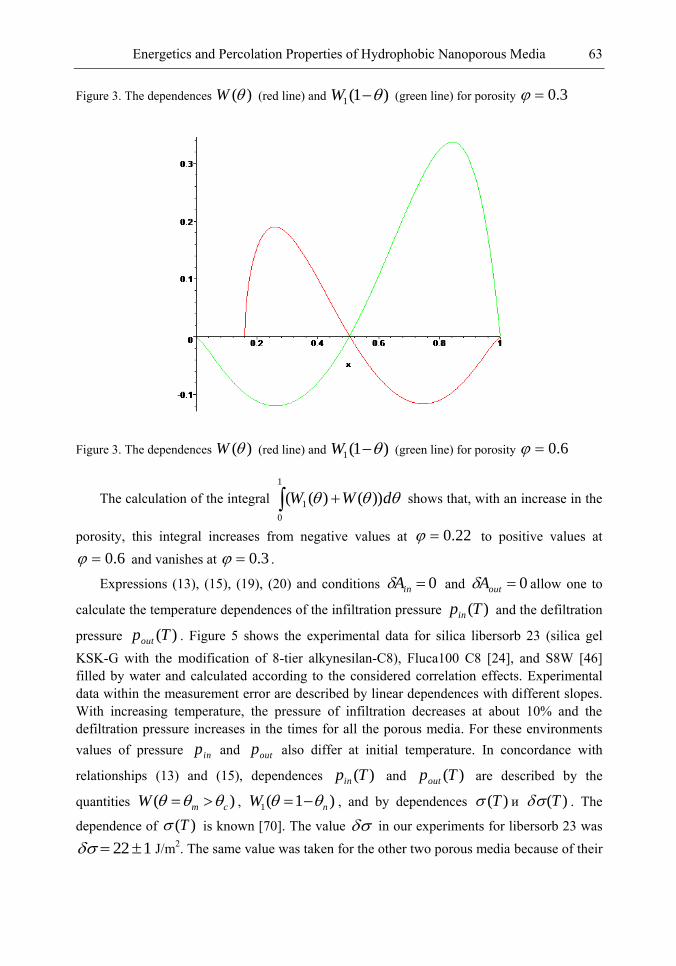
Energetics and Percolation Properties of Hydrophobic Nanoporous Media 63
Figure 3. The dependences )(W (red line) and )1(1 W (green line) for porosity 3.0
Figure 3. The dependences )(W (red line) and )1(1 W (green line) for porosity 6.0
The calculation of the integral
1
0
1 ))()(( dWW shows that, with an increase in the
porosity, this integral increases from negative values at 22.0 to positive values at 6.0 and vanishes at 3.0 .
Expressions (13), (15), (19), (20) and conditions 0inA and 0outA allow one to
calculate the temperature dependences of the infiltration pressure )(Tpin and the defiltration
pressure )(Tpout . Figure 5 shows the experimental data for silica libersorb 23 (silica gel KSK-G with the modification of 8-tier alkynesilan-C8), Fluca100 C8 [24], and S8W [46] filled by water and calculated according to the considered correlation effects. Experimental data within the measurement error are described by linear dependences with different slopes. With increasing temperature, the pressure of infiltration decreases at about 10% and the defiltration pressure increases in the times for all the porous media. For these environments values of pressure inp and outp also differ at initial temperature. In concordance with
relationships (13) and (15), dependences )(Tpin and )(Tpout are described by the
quantities ( )m cW , 1( 1 )nW , and by dependences )(T и )(T . The
dependence of )(T is known [70]. The value in our experiments for libersorb 23 was 122 J/m2. The same value was taken for the other two porous media because of their
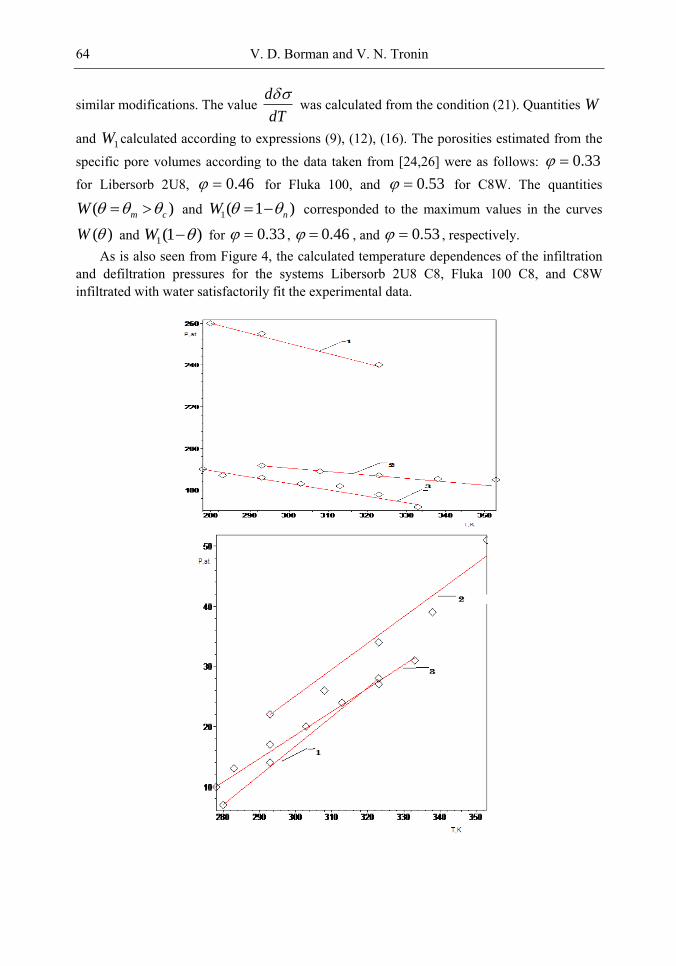
V. D. Borman and V. N. Tronin 64
similar modifications. The value dT
d was calculated from the condition (21). Quantities W
and 1W calculated according to expressions (9), (12), (16). The porosities estimated from the
specific pore volumes according to the data taken from [24,26] were as follows: 33.0
for Libersorb 2U8, 46.0 for Fluka 100, and 53.0 for C8W. The quantities
( )m cW and 1( 1 )nW corresponded to the maximum values in the curves
)(W and )1(1 W for 33.0 , 46.0 , and 53.0 , respectively. As is also seen from Figure 4, the calculated temperature dependences of the infiltration
and defiltration pressures for the systems Libersorb 2U8 С8, Fluka 100 С8, and C8W
infiltrated with water satisfactorily fit the experimental data.
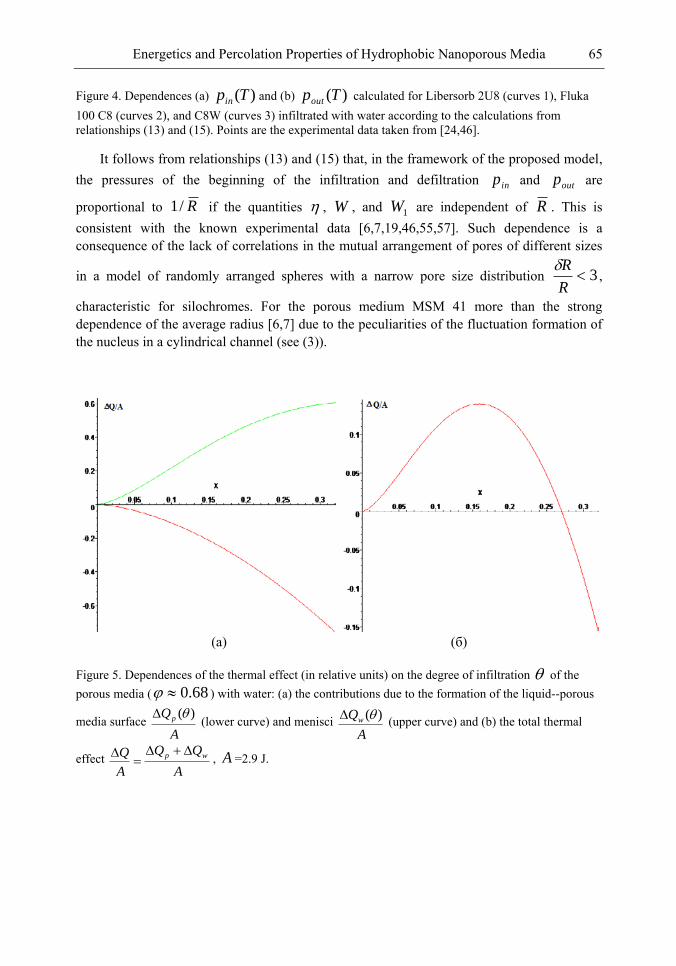
Energetics and Percolation Properties of Hydrophobic Nanoporous Media 65
Figure 4. Dependences (a) )(Tpin and (b) )(Tpout calculated for Libersorb 2U8 (curves 1), Fluka 100 С8 (curves 2), and C8W (curves 3) infiltrated with water according to the calculations from relationships (13) and (15). Points are the experimental data taken from [24,46].
It follows from relationships (13) and (15) that, in the framework of the proposed model, the pressures of the beginning of the infiltration and defiltration inp and outp are
proportional to R/1 if the quantities , W , and 1W are independent of R . This is consistent with the known experimental data [6,7,19,46,55,57]. Such dependence is a consequence of the lack of correlations in the mutual arrangement of pores of different sizes
in a model of randomly arranged spheres with a narrow pore size distribution 3R
R,
characteristic for silochromes. For the porous medium MSM 41 more than the strong dependence of the average radius [6,7] due to the peculiarities of the fluctuation formation of the nucleus in a cylindrical channel (see (3)).
(а) (б)
Figure 5. Dependences of the thermal effect (in relative units) on the degree of infiltration of the porous media ( 68.0 ) with water: (a) the contributions due to the formation of the liquid--porous
media surface A
Qp )( (lower curve) and menisci A
Qw )( (upper curve) and (b) the total thermal
effect A
A
Q wp
, A =2.9 J.
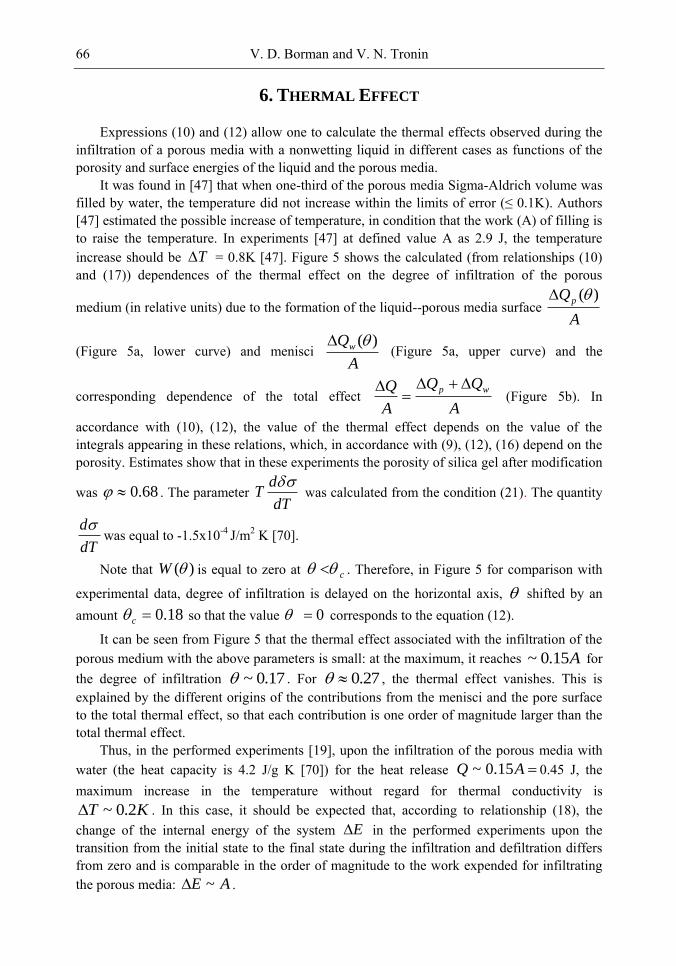
V. D. Borman and V. N. Tronin 66
6. THERMAL EFFECT
Expressions (10) and (12) allow one to calculate the thermal effects observed during the infiltration of a porous media with a nonwetting liquid in different cases as functions of the porosity and surface energies of the liquid and the porous media.
It was found in [47] that when one-third of the porous media Sigma-Aldrich volume was filled by water, the temperature did not increase within the limits of error (≤ 0.1K). Authors
[47] estimated the possible increase of temperature, in condition that the work (A) of filling is to raise the temperature. In experiments [47] at defined value A as 2.9 J, the temperature increase should be T = 0.8K [47]. Figure 5 shows the calculated (from relationships (10) and (17)) dependences of the thermal effect on the degree of infiltration of the porous
medium (in relative units) due to the formation of the liquid--porous media surface A
Qp )(
(Figure 5a, lower curve) and menisci A
Qw )( (Figure 5a, upper curve) and the
corresponding dependence of the total effect A
A
Q wp
(Figure 5b). In
accordance with (10), (12), the value of the thermal effect depends on the value of the integrals appearing in these relations, which, in accordance with (9), (12), (16) depend on the porosity. Estimates show that in these experiments the porosity of silica gel after modification
was 68.0 . The parameter dT
dT
was calculated from the condition (21). The quantity
dT
dwas equal to -1.5х10
-4 J/m2 K [70].
Note that )(W is equal to zero at c . Therefore, in Figure 5 for comparison with
experimental data, degree of infiltration is delayed on the horizontal axis, shifted by an amount 18.0c so that the value 0 corresponds to the equation (12).
It can be seen from Figure 5 that the thermal effect associated with the infiltration of the porous medium with the above parameters is small: at the maximum, it reaches A15.0~ for the degree of infiltration 17.0~ . For 27.0 , the thermal effect vanishes. This is explained by the different origins of the contributions from the menisci and the pore surface to the total thermal effect, so that each contribution is one order of magnitude larger than the total thermal effect.
Thus, in the performed experiments [19], upon the infiltration of the porous media with water (the heat capacity is 4.2 J/g K [70]) for the heat release AQ 15.0~ 0.45 J, the maximum increase in the temperature without regard for thermal conductivity is
KT 2.0~ . In this case, it should be expected that, according to relationship (18), the change of the internal energy of the system E in the performed experiments upon the transition from the initial state to the final state during the infiltration and defiltration differs from zero and is comparable in the order of magnitude to the work expended for infiltrating the porous media: AE ~ .
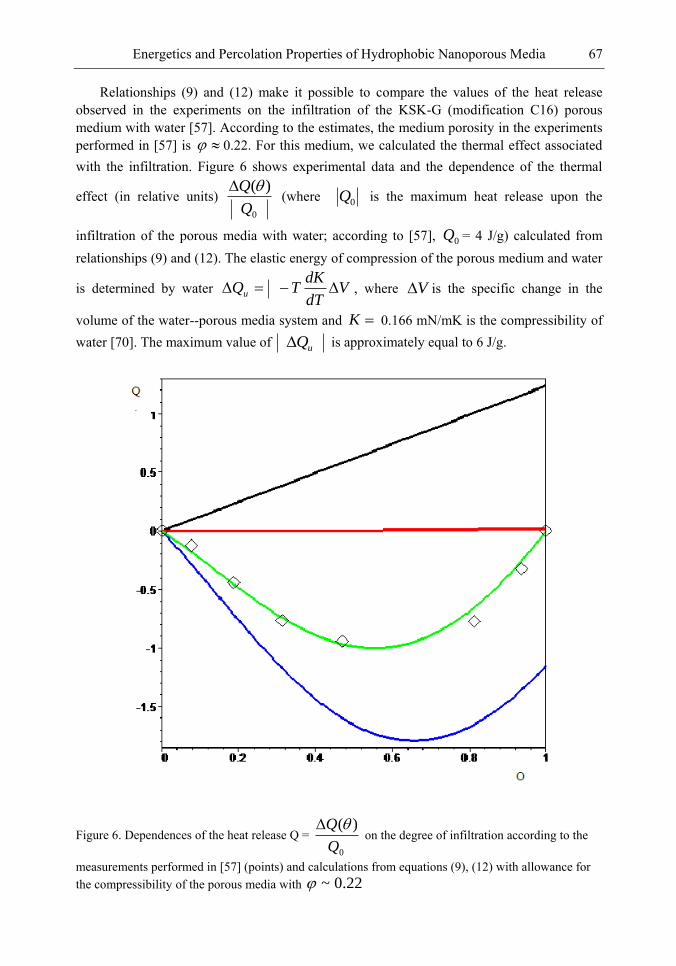
Energetics and Percolation Properties of Hydrophobic Nanoporous Media 67
Relationships (9) and (12) make it possible to compare the values of the heat release observed in the experiments on the infiltration of the KSK-G (modification C16) porous medium with water [57]. According to the estimates, the medium porosity in the experiments performed in [57] is 0.22. For this medium, we calculated the thermal effect associated with the infiltration. Figure 6 shows experimental data and the dependence of the thermal
effect (in relative units) 0
)(
Q
Q (where
0Q is the maximum heat release upon the
infiltration of the porous media with water; according to [57], 0Q = 4 J/g) calculated from relationships (9) and (12). The elastic energy of compression of the porous medium and water
is determined by water VdT
dKTQu , where V is the specific change in the
volume of the water--porous media system and K 0.166 mN/mK is the compressibility of water [70]. The maximum value of uQ is approximately equal to 6 J/g.
Figure 6. Dependences of the heat release Q = 0
)(
Q
Q on the degree of infiltration according to the
measurements performed in [57] (points) and calculations from equations (9), (12) with allowance for the compressibility of the porous media with 22.0~
V. D. Borman and V. N. Tronin 68
Figure 6 also presents the components of the thermal effect measured in [57]: the dependence of the heat release associated with the compressibility of the system (curve 1) and the dependence of the heat release pQ due to the change in the surface energy of pores
(curve 2) and menisci wQ (curve 3). It should be noted that the porous media studied in
[57] has a porosity 22.0~ and, hence, its system of pores is located in the vicinity of the
percolation threshold 18.0c . Consequently, the infinite cluster of empty pores, which is required for the infiltration of the porous media, is very sparse [10] and the probability (involved in relationship (10)) that a pore belongs to an infinite cluster is low 1P , therefore term contribution pQ to the thermal effect is small. In this case, it follows from
relationship (10) that, in the infiltration of this medium, the decisive role will be played by the second term in expression (10), which containing integral from )(W and determines the
contribution of menisci to the thermal effects ( 0 wQ ). It is this circumstance that is responsible for the unusual thermodynamic properties of the system used in [57]. It can be seen from figure 6 that calculated dependences of total thermal effect is in good agreement with the experimental data. Note that proposed mechanism can explain the thermal effects observed in [73] for the KSK-G (C16) with porosity ~ 0.4 and for PEP 100(C18) with a porosity of 0.6[74].
The measurements performed in [19,20] during multi-cycle infiltration--defiltration process (number of cycles ~1200) demonstrated that the increase in temperature in the systems containing hydrophobized silica gels and water per cycle is less than <10-3 K. The analysis of the experimental data reported in [19,20] showed that, in the course of the cyclic infiltration--defiltration process, the hysteresis and, hence, the heat release in the first cycle are two times larger than those observed in the 1200th cycle. Thus, in the experiments conducted in [19,20], there occurs a partial nonoutflow of the liquid from the porous media, which leads to changes in parameters and characteristics of the porous media, such as the porosity, the average number of nearest neighbors, and the interfacial energy. In this case, it is necessary to perform a detailed analysis of the changes in the parameters of the porous media in each cycle with inclusion of the thermal diffusivity of the porous media and water in terms of the above-derived relationships, which is beyond the scope of our present work.
7. CONCLUSIONS
Thus, in this work, we have established the relation between the energy properties of the interface and the macroscopic properties of the pore space in a disordered porous media and proposed the mechanism of energy absorption during the infiltration of the nanoporous medium with a nonwetting liquid. It turned out that thermal effects observed during the infiltration of the porous media and the defiltration of the liquid from it can be positive and negative depending on the porosity and, hence, on the number of nearest neighbors of filled pores.
The proposed mechanism is based on the inclusion of correlation effects during percolation infiltration of an infinite disordered porous media. It is assumed that the
Energetics and Percolation Properties of Hydrophobic Nanoporous Media 69
infiltration of the porous media is the result of growth of a percolation cluster consisting of filled pores through the attachment of empty pores (accessible to infiltration) to the shell of this cluster. As a consequence, menisci appear and disappear in pores on the shell of the percolation cluster in the course of its growth, and these processes depend on the degree of infiltration.
The above analysis is based on the representation of a system of pores in a porous media in terms of the model of randomly arranged spheres. In this model, effective parameters of a porous media, such as the porosity and the average size of necks, can be related to its macroscopic characteristics, such as the porosity and the specific surface area. However, in this model, the correlations in the mutual arrangement of pores of different sizes are ignored and, hence, it is impossible to adequately describe the effects of blocking of the liquid in pores with large radii that are surrounded by pores with smaller radii. Therefore, in the framework of the model of randomly arranged spheres, we can describe the infiltration of disordered porous media only with a narrow distribution of pores over the sizes RR )( . We assumed that pores in the porous media have a regular (either spherical or cylindrical) shape, ignored the coordinate dependence of the surface energy of a pore, and operated actually with the average values of this energy on the surface of the corresponding pore.
One of the consequences of the proposed mechanism is a condition that determines the class of systems for which a closed infiltration--defiltration cycle can exist. According to this condition, the initial and final states of the system coincide, the change of the internal energy is equal to zero, and the work expended for infiltrating the porous media, which is determined by the area of the hysteresis loop, is equal to the thermal effect. Another consequence of the proposed approach is the dependence of the effective contact angle on the degree of infiltration of the porous medium with a liquid (see relationships (13) and (15)). This dependence results from different paths on the way to the final state of the disordered porous medium during the infiltration (defiltration) with a liquid.
Thus, the proposed approach makes it possible within a unified context to describe the temperature dependences of the infiltration and defiltration pressures for a porous medium with a disordered structure and the thermal effects associated with the absorption of the energy by "disordered porous media--nonwetting liquid" systems.
REFERENCES
[1] Bogomolov, V. N. (1995). Phys. Rev. B, 51, 17040. [2] Erosenko, V. A. (2002). Rus.Chem.Journal, N 3, v XLVI, p31-38. [3] Fadeev, A. Y., Eroshenko, V. A. (1997). J. of Coll. and Interface Sci., 187, 275. [4] Borman, V. D., Grekhov, A. M. & Troyan, V. I. (2000). Zh. Éksp. Teor. Fiz., 118(1),
193, [JETP 91 (1), 170 (2000)]. [5] Borman, V. D., Belogorlov, A. A., Grekhov, A. M., Lisichkin, G. V., Tronin, V. N. &
Troyan, V. I. (2005). JETP, Vol. 100, No 2, 385, February. [6] Lefevre, B., Saugey, A., Barrat, J. L., Boequet, L., Charlaix, E., Gobin, P. F. & Vigier,
G. (2004). Coll. and Surf. A., 241. 265-272. [7] Lefevre, B., Saugey, A., Barrat, J. L., Boequet, L., Charlaix, E., Gobin, P. F. & Vigier.
G. (2004). J. Chem. Phys., 120, 4927.
V. D. Borman and V. N. Tronin 70
[8] Iwatsubo, T., Suciu, C. V., Ikenagao, M. & Yaguchio. K. (2007). Journal of Sound and
Vibration., 308, 579-590. [9] Chen, X., Surani, F. B., Kong, X., Punyamurtula, V. K. & Qiao, Y. (2006). Appl. Phys.
Lett., 89, 241918. [10] Yu Qiao, Venkata, K. (2006). Punyamurtula, Aijie Han, Xinguo Kong, Falgun B.
Surani. Appl. Phys. Lett., 89, 251905. [11] Han, A. & Qiao, Y. (2007). Appl. Phys. Lett., 91, 173123. [12] Han, A. & Qiao, Y. (2008). Chem. Phys. Lett., 454, 294-298. [13] Sebastian, I. & Halasz, I. (1974). Chromotographia., 7, 371. [14] Unger, K. K. (1979). Porous silica, its properties and use as suppert in column liquid
chromatography. (J.Chromotogr.Libr. V.16), Elsevier, Amsterdam. [15] Bokasanyi, L., Liardon, O. & Kovats, E. (1976). Adv.Colloid Interface Sci., 6, 95. [16] Lisichkin, G. V. & Yu.Fadeev, A. (1996). Rus.Chem.Journal, v XL, 3, стр.65. [17] Fadeev, А. U. & Erochenko, V. A. (1996). Journal. Phys.Chem., Т.70, 8, 1482. [18] Fadeev, А. U. & Erochenko, V. А. (1995). Coloid. Journal., Т.57,4,480. [19] Suciu, C. V., Iwatsubo, T. I., Deki, S. (2003). J. of Coll. and Interface Sci., 259, 62-80. [20] Suciu, C. V., Iwatsubo, T. I., Yaguchi, K. & Ikenada, M. (2005). J. of Coll. and
Interface Sci., 283, 196-214. [21] Loic Coiffard, V. (2006). Eroshenko. J. of Coll. and Interface Sci., 300, 304-309. [22] Denoyel, R., Beurroies, I. & Lefevre, B. (2004). J. of Petroleum Science and
Engineering., 45, 203. [23] Han, A., Kong, X. & Qiao, Y. (2006). J. Appl. Phys., 100, 014308. [24] Kong, X. & Qiao, Y. (2005). Philosophical Magazine Letters., 85(7), 331-338. [25] Yu Qiao, Guoxin Cao, Xi Chen. (2007). J. Am. Chem. Soc., 129, 2355-2359. [26] Xinguo Kong, Falgun, B. Surani, Yu Qiao. (2005). J. Mater. Res., 20(4), 1042. [27] Kong, X. & Qiao, Y. (2005). Appl. Phys. Lett., 86, 151919. [28] Surani, F. & Qiao, Y. (2006). J. Appl. Phys., 100, 034311. [29] Surani, F., Kong, X. & Qiao, Y. (2005). Appl. Phys. Lett., 87, 251906. [30] Falgun, B. (2006). Surani, Aijie Han, Yu Qiao. Appl. Phys. Lett., 89, 093108. [31] Aijie Han, Weiyi, Lu. & Venkata, K. (2009). Punyamurtula, Taewan Kim, Yu Qiao. J.
Appl. Phys., 105, 024309. [32] Kim, T., Han, A. & Qiao, Y. (2008). J. Appl. Phys., 104, 034304. [33] Han, A. & Qiao, Y. (2008). Chem. Phys. Lett., 454, 294-298. [34] Aijie Han, Venkata, K. Punyamurtula, (2008). Yu Qiao. Appl. Phys. Lett., 92, 153117. [35] Eroshenko, V., Regis, R. C., Soulard, M. & Patarin, J. (2001). J. Am. Chem. Soc., 123,
8129-8130. [36] Eroshenko, V., Regis, R. C., Soulard, M., Patarin, J. & Physique, C. R. (2002). 3, 111-
119. [37] Yu Qiao, Venkata K. Punyamurtula, Aijie Han, Xinguo Kong, Falgun B. (2006). Surani.
Appl. Phys. Lett., 89, 251905. [38] Han, A. & Qiao, Y. (2007). Appl. Phys. Lett., 91, 173123. [39] Han, A., Lu, W., Kim, T. & Chen, X. (2008). Phys. Rev. E., 78.031408. [40] Lu, W., Han, A., Kim, T., Punyamrtula, V. K., Chen, X. & Qiao, Y. (2009). App. Phys.
Lett, 94, 023106. [41] Qiao, Y., Liu, L. & Chen, X. (2009). Nanolett., 9(3), 984-988. [42] liu, L., Chen, X., Lu, W., Han, A. & Qiao, Y. (2009). Phys. Rev.Lett., 102.184501.
Energetics and Percolation Properties of Hydrophobic Nanoporous Media 71
[43] Kim, T., Lu, W., Han, A., Punyamrtula, V. K., Chen, X. & Qiao, Y. (2009). App. Phys.
Lett., 94, 013105. [44] Chen, X., Cao, G., Han, A., Punyamurtula, V. K., Liu, L., Culligan, P. J., Kim, T. &
Qiao, Y. (2008). Nanolett., 8(9), 2988-2992. [45] Liu, L., Qiao, Y. & Chen, X. (2008). App.Phys.Lett., 92, 101927. [46] Loic Coiffard, V. & Eroshenko, J. (2006). of Coll. and Interface Sci., 300, 304-309. [47] Yu Quiao, Venkata, K. (2008). Punyamurtula, Guijun Xian, Vistasp M. Karbhari, Aijie
Han. Appl. Phys. Lett., 92, 063109. [48] Han, A., Punyamurtula, V. K., Lu, W. & Qiao, Y. (2008). App. Phys. Lett., 103,
084318. [49] Han, A., Lu, W., Punyamutula, V. K., Chen, X., Surani, F. B., Kim, T., Qiao, Y. (2008).
J. Appl. Phys., 104, 124908. [50] Gomer, F. & Denoyel, R. (2000). J. Rouquerol. Langmuir., 16, 4374-4379. [51] Yu, V. (1994). Gusev. Langmuir., 10, 235-240. [52] Eroshenko, V. A., Proc, I. & Mech, E. (2007). Vol 222, 285, Proc.I MechE, Vol 221,
301. [53] Chen, X., Surani, F. B., Kong, X., Punyamurtula, V. K. & Qiao, Y. (2006). Appl. Phys.
Lett., 89, 241918. [54] Surani, F. B., Kong, X., Panchal, D. B. & Qiao, Y. (2005). Appl. Phys. Lett., 87,
163111. [55] Fadeev, A. Y. & Eroshenko. V. A. (1997). J. of Coll. and Interface Sci., 187, 275. [56] Qiao, Y. & Kong, X. (2005). Phys. Scr., 71, 27. [57] Erosenko, V. A. (2002). Rus.Chem.Journal, N 3, v XLVI, 31-38. [58] Falgun, S. (2006). Thesis, University of Akron. [59] Howe, J. M. (1997). Interfases in Materials, John Wiely & Sons, New York,. [60] Borman, V. D., Belogorlov, A. A., Lisichkin, G. V., Tronin, V. N. & Troyan, V. I.
(2009). JETP, Vol. 108, No 3, March. [61] Borman, V. D., Belogorlov, A. A., Grekhov, A. M., Lisichkin, G. V., Tronin, V. N. &
Troyan, V. I. (2004). Pis’ma Zh. Tekh. Fiz., 30(23), 1 [Tech. Phys. Lett. 30 (12), 973 (2004)].
[62] Ojovan, M. I. (1993). JETP, Vol. 77, No 6, 4021. [63] Isichenko, (1992). Rev.Mod,Phys., 64, 961. [64] Yu. Yu. Tarasevich, Percolation: Theory, Applications, and Algorithms (URSS,
Moscow, 2002). [65] Landay, L. D., Lifshitz, E. M. (1980). Statistical physics. M. [66] Heifetz, L. I. & Neimark, A. V. (1982). Manyfases prosees in porous medias,
Chemistry, Moscow. [67] Grinchuk, P. S. & Rabinovich, O. S. (2003). JETP, Vol. 96, No 2, 301. [68] Rigby, S. P., Edler, K. J. (2002). J.of. Colloid and Interface Sci., 250, 175-190. [69] Porcheron, F., Thommes, M., Ahmad, R. & Langmuir, P. A. (2007). 23, 3372-3380. [70] Handbook of Physical Quantities, Ed. by I. S. Grigoriev and E. Z. Meilikhov
(Énergoatomizdat, Moscow, 1991; CRC Press, Boca Raton, FL, United States, 1997). [71] Borman, V. D., Teplyakov, V. V., Tronin, V. N., Tronin, I. V. & Troyan, V. I. (2000).
JETP, Vol. 90, No 6, 950, June. [72] Borman, V. D., Tronin, V. N., Tronin, I. V. & Troyan, V. I. (2004). JETP, Vol. 98, No 1,
102, January.

V. D. Borman and V. N. Tronin 72
[73] Borman, V. D., Tronin, I. V., Tronin, V. N. & Troyan, V. I. (2006). Physics Letters A,v.
359, 504-507. [74] Yu Gusev, V. (1994). Langmur,v, 10, 235-240. [75] Gomes, F. & Donoyel, R (2000). J. Rouquerol, Langmur, v16, 4374-4379.
In: Nanoporous Materials: Types, Properties and Uses ISBN: 978-1-61668-182-1 Editors: Samuel B. Jenkins, pp. 73-162 ©2010 Nova Science Publishers, Inc.
Chapter 3
ORDERED MESOPOROUS MATERIALS FOR DRUG
DELIVERY APPLICATIONS
Spomenka Simovic and Dusan Losic University of South Australia, Ian Wark Research Institute,
Mawson Lakes, Adelaide, Australia
ABSTRACT
Conventional drug therapy is associated with a number of challenges, such as poor drug stability and/or solubility in biological environment, lack of selectivity, severe toxicity and unfavourable pharmacokinetics. The application of nanotechnology to medical devices - ―nanomedicine‖ is recognized as an emerging field with huge potential for development of new therapeutic concepts. Research on mesoporous materials for biomedical purposes has experienced an outstanding increase during recent years. Three major types of mesoporous materials for drug delivery application were emerged including: mesoporous silica engineered by organic synthesis and porous silicon, anodically oxidised alumina (AAO) and nanotubular titania fabricated by electrochemical methods. Although still in early stages, few in vivo studies clearly show the potential of these materials for drug delivery devices in orthopedics implants, dental implants, and vascular stents, where not only is the controlled release of drugs such as antibiotics or growth factors desired, but also appropriate biointegration is needed. In this chapter we collect and analyze some of the most relevant milestones in the research of mesoporous materials for controlled drug delivery for implantable and systemic delivery systems. To provide a comprehensive overview to the reader, this review firstly analyzes biocompatibility aspects, which are the major prerequisite for application of materials that come into contact with biological systems. Secondly, we consider the basic aspects of the textural properties (surface and porosity) that contribute to the understanding of drug adsorption and controlled release processes. Finally, more sophisticated stimuli-responsive materials are reviewed. This is only beginning of the further research in terms of correlating biomaterial chemistry and tissue responses and new clinical approaches required not only for orthopaedics, but also treatment for a number of other diseases (hearth, cancer, diabetes, Parkinson‘s, Alzheimer‘s etc).
Spomenka Simovic and Dusan Losic 74
1. INTRODUCTION To avoid problems associated to the conventional drug therapies related to limited drug
solubility, poor biodistribution, lack of selectivity and unfavourable pharmacokinetics, a considerable research has been directed in last two decades toward development of new and more efficient drug delivery systems [1-3]. Hydrophobic drugs do not dissolve in the blood and do not reach their target, which reduces their pharmacological efficacy [3]. Bioactive agents such as proteins, nucleic acids, enzymes, genes administered through oral or intravenous routes can be degraded prematurely by metabolism or by enzymatic conditions existing in gastrointestinal tracts [3-4]. These challenges have contributed to the rapid development of new controlled drug delivery systems prepared using advanced microfabrication methods, toward achieving various therapeutic goals, such as delivery of therapeutic agents to the desired site, enhancing bioavailability and drug protection. Controlled drug delivery can be (i) spatial- allows high anatomic specificity, lower dosage, and decreased side effects and ii) temporal -allows sustained dosing and minimized fluctuations from the therapeutic window. Most nano-sized drug delivery systems are based on either organic materials such as polymers, gels and liposomes or inorganic metallic and semiconducting nanoparticles. Organic systems such as polymeric particles and films have been approved for use in oral, implantable, injectable, inhalable, or patch form. The next generation of drug delivery systems are expected to possess new qualities beyond spatial and temporal control, and that means to enable predictable dosage and particularly, therapy responsive to the patient's needs, for example, the delivery of insulin autonomously, in response to changing glucose levels. Mechanisms for facilitating feedback necessitate the incorporation of advanced functional modules such as sensors, memory and logic devices, directly onto a drug delivery device. In addition, one may desire to duplicate natural developmental pathways to direct growth of nerves, blood vessels, tissues and organs by delivering specific growth hormones at precise times, possibly anisotropically, in order to fully program developing tissue [5].
The application of nanotechnology to medicine referred as ―nanomedicine‖ is recognized
as an emerging field with enormous potential for development of new therapeutic concepts [6-8]. The knowledge of the materials at the nanoscale may accelerate the improvement of controlled drug delivery systems [9, 10]. Factors limiting the capabilities and convenience of conventional drug administration may include long-term treatment, a narrow therapeutic window, a complex dosing schedule, combination therapy, an individualized or emergency-based dosing regimen, and labile active ingredient [11]. These limitations are being countered as new approaches emerge for developing drug and medical device combinations that can protect labile active ingredients, precisely control drug release kinetics (timing and amount), deliver multiple doses, eliminate frequent injection, and/or modulate release using integrated sensor feedback. Innovative delivery devices have the capability to completely control drug release: doses may be administered in pulses or continuously for periods of months to years, or doses may be stored in a device pending immediate need for emergency administration.
Realizing these goals for ―smart‖ drug delivery systems requires the development of small independent reservoir structures or containers that can be manufactured inexpensively, loaded easily with drugs, delivered with minimal trauma, and be easily tracked, programmed or controlled. Small containers would also allow for precise spatial positioning of drug release
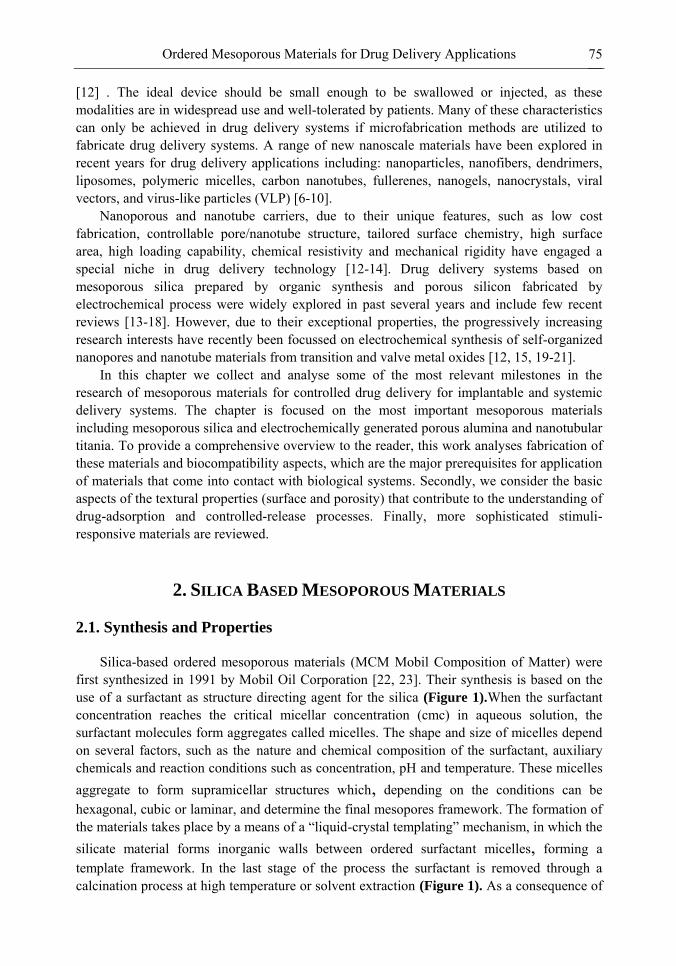
Ordered Mesoporous Materials for Drug Delivery Applications 75
[12] . The ideal device should be small enough to be swallowed or injected, as these modalities are in widespread use and well-tolerated by patients. Many of these characteristics can only be achieved in drug delivery systems if microfabrication methods are utilized to fabricate drug delivery systems. A range of new nanoscale materials have been explored in recent years for drug delivery applications including: nanoparticles, nanofibers, dendrimers, liposomes, polymeric micelles, carbon nanotubes, fullerenes, nanogels, nanocrystals, viral vectors, and virus-like particles (VLP) [6-10].
Nanoporous and nanotube carriers, due to their unique features, such as low cost fabrication, controllable pore/nanotube structure, tailored surface chemistry, high surface area, high loading capability, chemical resistivity and mechanical rigidity have engaged a special niche in drug delivery technology [12-14]. Drug delivery systems based on mesoporous silica prepared by organic synthesis and porous silicon fabricated by electrochemical process were widely explored in past several years and include few recent reviews [13-18]. However, due to their exceptional properties, the progressively increasing research interests have recently been focussed on electrochemical synthesis of self-organized nanopores and nanotube materials from transition and valve metal oxides [12, 15, 19-21].
In this chapter we collect and analyse some of the most relevant milestones in the research of mesoporous materials for controlled drug delivery for implantable and systemic delivery systems. The chapter is focused on the most important mesoporous materials including mesoporous silica and electrochemically generated porous alumina and nanotubular titania. To provide a comprehensive overview to the reader, this work analyses fabrication of these materials and biocompatibility aspects, which are the major prerequisites for application of materials that come into contact with biological systems. Secondly, we consider the basic aspects of the textural properties (surface and porosity) that contribute to the understanding of drug-adsorption and controlled-release processes. Finally, more sophisticated stimuli-responsive materials are reviewed.
2. SILICA BASED MESOPOROUS MATERIALS
2.1. Synthesis and Properties Silica-based ordered mesoporous materials (MCM Mobil Composition of Matter) were
first synthesized in 1991 by Mobil Oil Corporation [22, 23]. Their synthesis is based on the use of a surfactant as structure directing agent for the silica (Figure 1).When the surfactant concentration reaches the critical micellar concentration (cmc) in aqueous solution, the surfactant molecules form aggregates called micelles. The shape and size of micelles depend on several factors, such as the nature and chemical composition of the surfactant, auxiliary chemicals and reaction conditions such as concentration, pH and temperature. These micelles aggregate to form supramicellar structures which, depending on the conditions can be hexagonal, cubic or laminar, and determine the final mesopores framework. The formation of the materials takes place by a means of a ―liquid-crystal templating‖ mechanism, in which the
silicate material forms inorganic walls between ordered surfactant micelles, forming a template framework. In the last stage of the process the surfactant is removed through a calcination process at high temperature or solvent extraction (Figure 1). As a consequence of
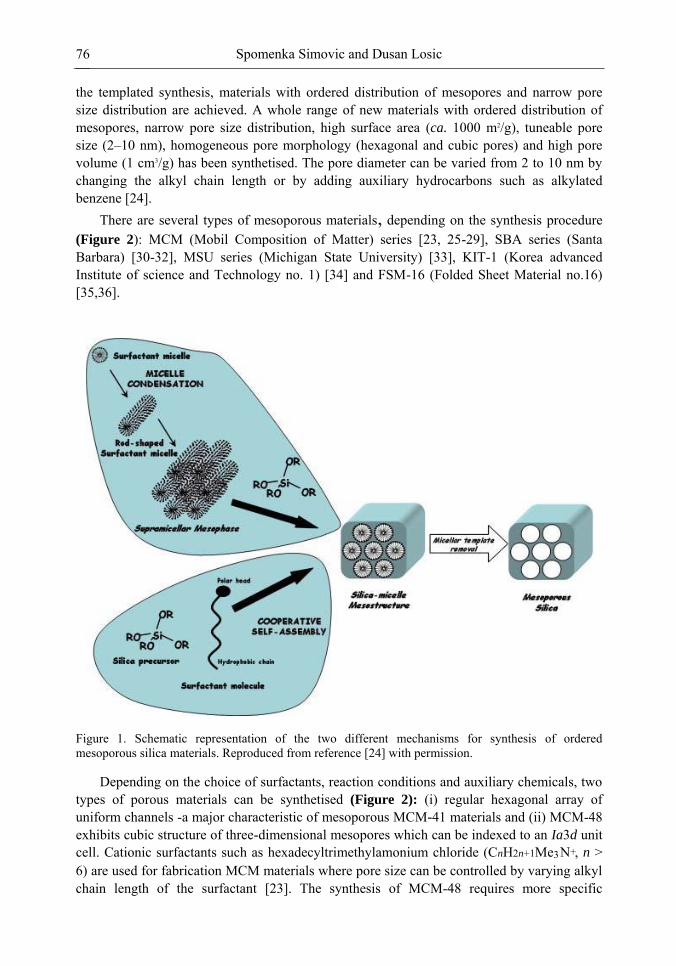
Spomenka Simovic and Dusan Losic 76
the templated synthesis, materials with ordered distribution of mesopores and narrow pore size distribution are achieved. A whole range of new materials with ordered distribution of mesopores, narrow pore size distribution, high surface area (ca. 1000 m2/g), tuneable pore size (2–10 nm), homogeneous pore morphology (hexagonal and cubic pores) and high pore volume (1 cm3/g) has been synthetised. The pore diameter can be varied from 2 to 10 nm by changing the alkyl chain length or by adding auxiliary hydrocarbons such as alkylated benzene [24].
There are several types of mesoporous materials, depending on the synthesis procedure (Figure 2): MCM (Mobil Composition of Matter) series [23, 25-29], SBA series (Santa Barbara) [30-32], MSU series (Michigan State University) [33], KIT-1 (Korea advanced Institute of science and Technology no. 1) [34] and FSM-16 (Folded Sheet Material no.16) [35,36].
Figure 1. Schematic representation of the two different mechanisms for synthesis of ordered mesoporous silica materials. Reproduced from reference [24] with permission.
Depending on the choice of surfactants, reaction conditions and auxiliary chemicals, two types of porous materials can be synthetised (Figure 2): (i) regular hexagonal array of uniform channels -a major characteristic of mesoporous MCM-41 materials and (ii) MCM-48 exhibits cubic structure of three-dimensional mesopores which can be indexed to an Ia3d unit cell. Cationic surfactants such as hexadecyltrimethylamonium chloride (CnH2n+1Me3 N+, n > 6) are used for fabrication MCM materials where pore size can be controlled by varying alkyl chain length of the surfactant [23]. The synthesis of MCM-48 requires more specific
Ordered Mesoporous Materials for Drug Delivery Applications 77
conditions than that of MCM-41: with the common alkyltrimethylammonium surfactants, MCM-48 will not be formed until the surfactant/silica molar ratio is beyond 1 [25-29].
Figure 2. Two different types of micelle–silica interaction and the ordered mesoporous materials obtained after each mechanism. Reproduced from reference [24] with permission.
Use of amphiphilic triblock copolymers to direct the organization of polymerizing silica species has resulted in the preparation of well-ordered hexagonal mesoporous silica structures (SBA-15) with cubic Pm3n (SBA-1, HMM-3), cubic Im3m (SBA-16), and 3D hexagonal P63/mmc (SBA-2, SBA-12) cagelike structures [16,17]. The SBA-15 materials produce highly ordered, two-dimensional hexagonal (space group p6mm) silica-block copolymer mesophases. Calcination at 500°C gives porous structures with pore sizes from 4.6 – 30 nm, pore volume fractions up to 0.85, and silica wall thicknesses of 3.1 - 6.4 nm. SBA-15 can be readily prepared over a wide range of uniform pore sizes and pore wall thicknesses at low temperature (35 °C to 80 °C), using a variety of poly (alkylene oxide) triblock copolymers and by the addition of cosolvent organic molecules. The block copolymer species can be recovered for reuse by solvent extraction with ethanol or removed by heating at 140 °C for 3 hours; in both cases, yielding a product that is thermally stable in boiling water [37, 38].
A family of mesoporous molecular sieves (denoted MSU-G) with vesiclelike hierarchical structures and unprecedented thermal (1000 ºC) and hydrothermal stabilities (more than 150 h at 100 ºC) associated with high SiO2 cross-linking was prepared through a supramolecular assembly pathway that relies on hydrogen bonding between electrically neutral gemini surfactants of the type CnH2n+1NH (CH2)2NH2 and silica precursors derived from
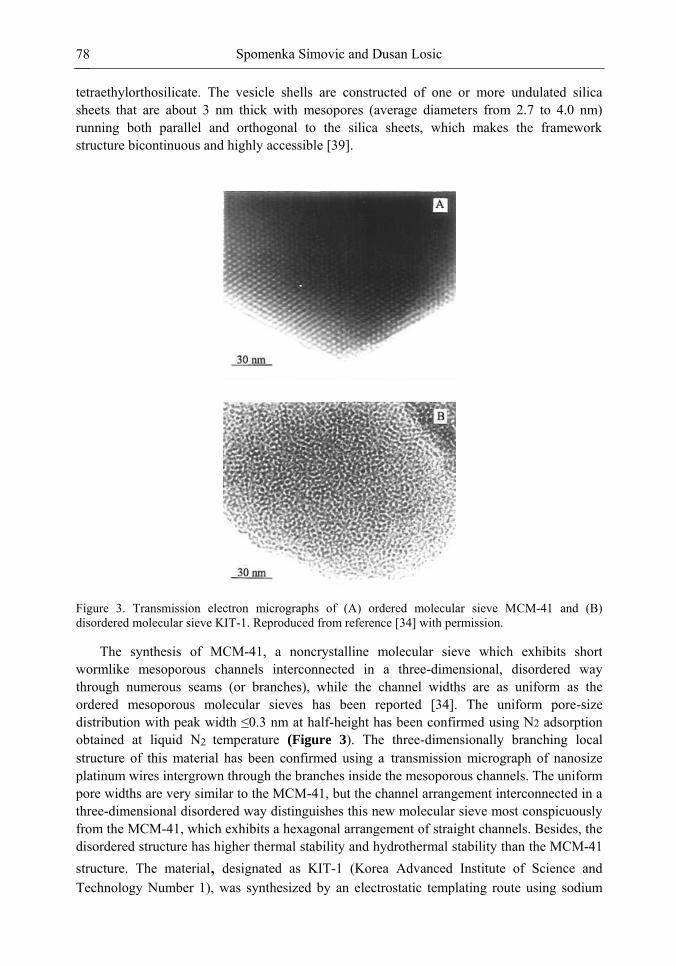
Spomenka Simovic and Dusan Losic 78
tetraethylorthosilicate. The vesicle shells are constructed of one or more undulated silica sheets that are about 3 nm thick with mesopores (average diameters from 2.7 to 4.0 nm) running both parallel and orthogonal to the silica sheets, which makes the framework structure bicontinuous and highly accessible [39].
Figure 3. Transmission electron micrographs of (A) ordered molecular sieve MCM-41 and (B) disordered molecular sieve KIT-1. Reproduced from reference [34] with permission.
The synthesis of MCM-41, a noncrystalline molecular sieve which exhibits short wormlike mesoporous channels interconnected in a three-dimensional, disordered way through numerous seams (or branches), while the channel widths are as uniform as the ordered mesoporous molecular sieves has been reported [34]. The uniform pore-size distribution with peak width ≤0.3 nm at half-height has been confirmed using N2 adsorption obtained at liquid N2 temperature (Figure 3). The three-dimensionally branching local structure of this material has been confirmed using a transmission micrograph of nanosize platinum wires intergrown through the branches inside the mesoporous channels. The uniform pore widths are very similar to the MCM-41, but the channel arrangement interconnected in a three-dimensional disordered way distinguishes this new molecular sieve most conspicuously from the MCM-41, which exhibits a hexagonal arrangement of straight channels. Besides, the disordered structure has higher thermal stability and hydrothermal stability than the MCM-41 structure. The material, designated as KIT-1 (Korea Advanced Institute of Science and Technology Number 1), was synthesized by an electrostatic templating route using sodium
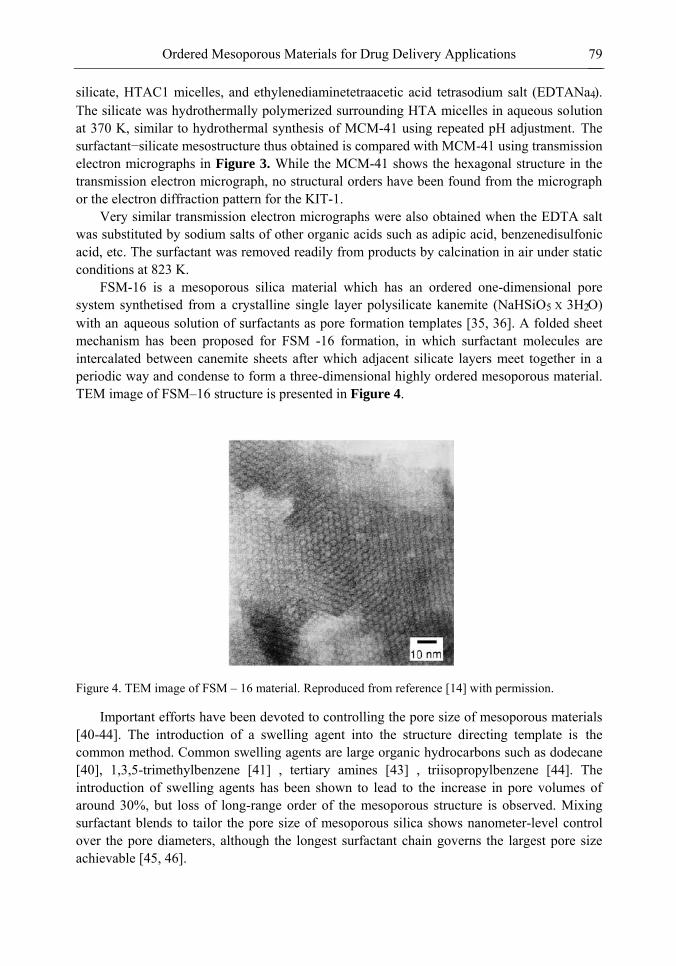
Ordered Mesoporous Materials for Drug Delivery Applications 79
silicate, HTAC1 micelles, and ethylenediaminetetraacetic acid tetrasodium salt (EDTANa4). The silicate was hydrothermally polymerized surrounding HTA micelles in aqueous solution at 370 K, similar to hydrothermal synthesis of MCM-41 using repeated pH adjustment. The surfactant−silicate mesostructure thus obtained is compared with MCM-41 using transmission electron micrographs in Figure 3. While the MCM-41 shows the hexagonal structure in the transmission electron micrograph, no structural orders have been found from the micrograph or the electron diffraction pattern for the KIT-1.
Very similar transmission electron micrographs were also obtained when the EDTA salt was substituted by sodium salts of other organic acids such as adipic acid, benzenedisulfonic acid, etc. The surfactant was removed readily from products by calcination in air under static conditions at 823 K.
FSM-16 is a mesoporous silica material which has an ordered one-dimensional pore system synthetised from a crystalline single layer polysilicate kanemite (NaHSiO5 X 3H2O) with an aqueous solution of surfactants as pore formation templates [35, 36]. A folded sheet mechanism has been proposed for FSM -16 formation, in which surfactant molecules are intercalated between canemite sheets after which adjacent silicate layers meet together in a periodic way and condense to form a three-dimensional highly ordered mesoporous material. TEM image of FSM–16 structure is presented in Figure 4.
Figure 4. TEM image of FSM – 16 material. Reproduced from reference [14] with permission.
Important efforts have been devoted to controlling the pore size of mesoporous materials [40-44]. The introduction of a swelling agent into the structure directing template is the common method. Common swelling agents are large organic hydrocarbons such as dodecane [40], 1,3,5-trimethylbenzene [41] , tertiary amines [43] , triisopropylbenzene [44]. The introduction of swelling agents has been shown to lead to the increase in pore volumes of around 30%, but loss of long-range order of the mesoporous structure is observed. Mixing surfactant blends to tailor the pore size of mesoporous silica shows nanometer-level control over the pore diameters, although the longest surfactant chain governs the largest pore size achievable [45, 46].
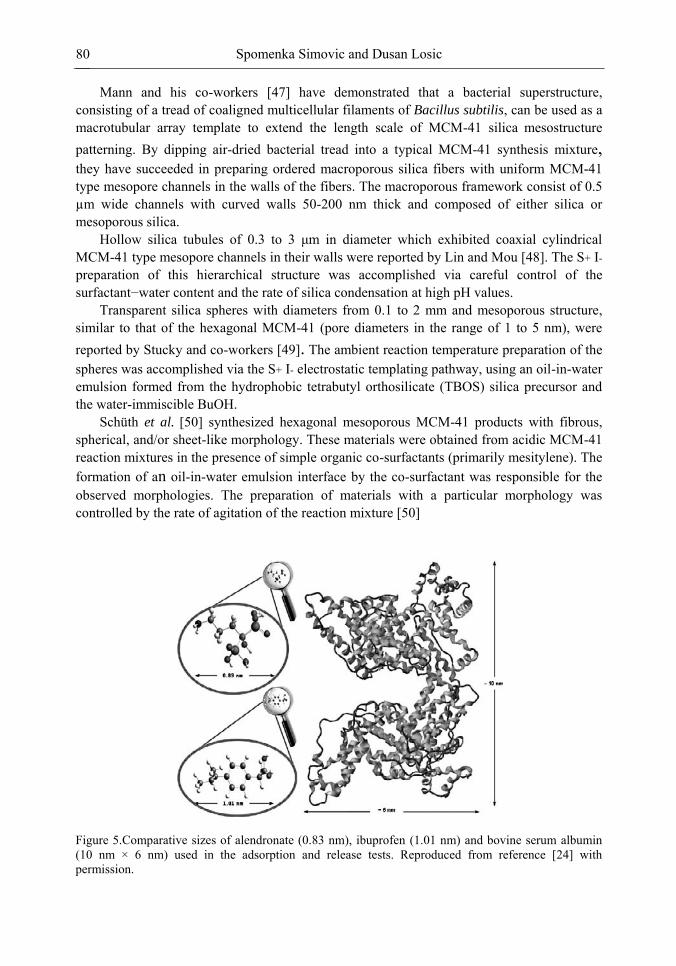
Spomenka Simovic and Dusan Losic 80
Mann and his co-workers [47] have demonstrated that a bacterial superstructure, consisting of a tread of coaligned multicellular filaments of Bacillus subtilis, can be used as a macrotubular array template to extend the length scale of MCM-41 silica mesostructure patterning. By dipping air-dried bacterial tread into a typical MCM-41 synthesis mixture, they have succeeded in preparing ordered macroporous silica fibers with uniform MCM-41 type mesopore channels in the walls of the fibers. The macroporous framework consist of 0.5 µm wide channels with curved walls 50-200 nm thick and composed of either silica or mesoporous silica.
Hollow silica tubules of 0.3 to 3 μm in diameter which exhibited coaxial cylindrical
MCM-41 type mesopore channels in their walls were reported by Lin and Mou [48]. The S+ I- preparation of this hierarchical structure was accomplished via careful control of the surfactant−water content and the rate of silica condensation at high pH values.
Transparent silica spheres with diameters from 0.1 to 2 mm and mesoporous structure, similar to that of the hexagonal MCM-41 (pore diameters in the range of 1 to 5 nm), were reported by Stucky and co-workers [49]. The ambient reaction temperature preparation of the spheres was accomplished via the S+ I- electrostatic templating pathway, using an oil-in-water emulsion formed from the hydrophobic tetrabutyl orthosilicate (TBOS) silica precursor and the water-immiscible BuOH.
Schüth et al. [50] synthesized hexagonal mesoporous MCM-41 products with fibrous, spherical, and/or sheet-like morphology. These materials were obtained from acidic MCM-41 reaction mixtures in the presence of simple organic co-surfactants (primarily mesitylene). The formation of an oil-in-water emulsion interface by the co-surfactant was responsible for the observed morphologies. The preparation of materials with a particular morphology was controlled by the rate of agitation of the reaction mixture [50]
Figure 5.Comparative sizes of alendronate (0.83 nm), ibuprofen (1.01 nm) and bovine serum albumin (10 nm × 6 nm) used in the adsorption and release tests. Reproduced from reference [24] with permission.
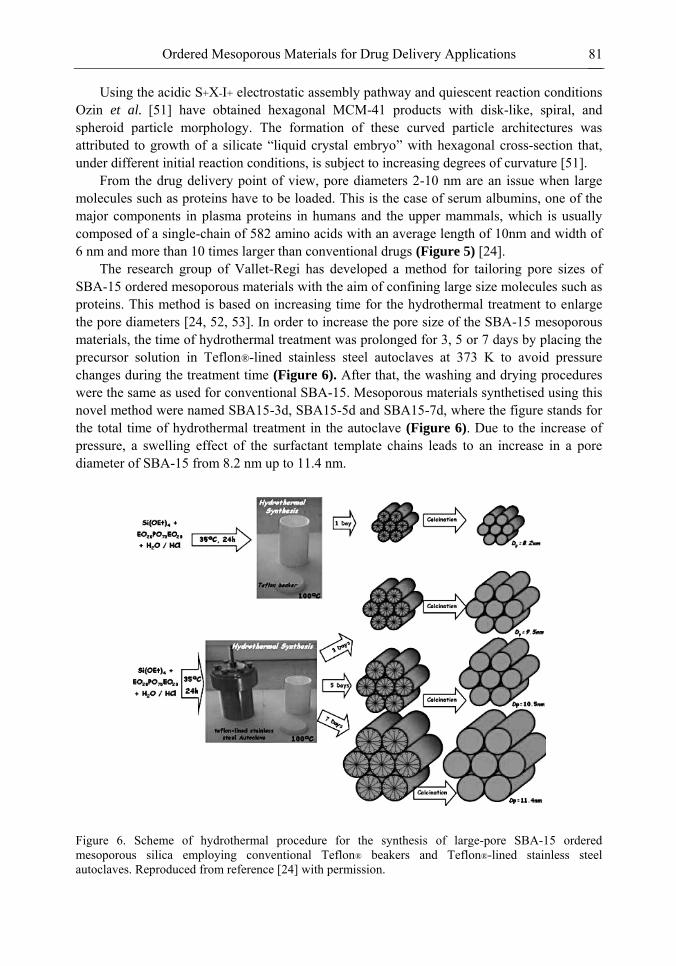
Ordered Mesoporous Materials for Drug Delivery Applications 81
Using the acidic S+X-I+ electrostatic assembly pathway and quiescent reaction conditions Ozin et al. [51] have obtained hexagonal MCM-41 products with disk-like, spiral, and spheroid particle morphology. The formation of these curved particle architectures was attributed to growth of a silicate ―liquid crystal embryo‖ with hexagonal cross-section that, under different initial reaction conditions, is subject to increasing degrees of curvature [51].
From the drug delivery point of view, pore diameters 2-10 nm are an issue when large molecules such as proteins have to be loaded. This is the case of serum albumins, one of the major components in plasma proteins in humans and the upper mammals, which is usually composed of a single-chain of 582 amino acids with an average length of 10nm and width of 6 nm and more than 10 times larger than conventional drugs (Figure 5) [24].
The research group of Vallet-Regi has developed a method for tailoring pore sizes of SBA-15 ordered mesoporous materials with the aim of confining large size molecules such as proteins. This method is based on increasing time for the hydrothermal treatment to enlarge the pore diameters [24, 52, 53]. In order to increase the pore size of the SBA-15 mesoporous materials, the time of hydrothermal treatment was prolonged for 3, 5 or 7 days by placing the precursor solution in Teflon®-lined stainless steel autoclaves at 373 K to avoid pressure changes during the treatment time (Figure 6). After that, the washing and drying procedures were the same as used for conventional SBA-15. Mesoporous materials synthetised using this novel method were named SBA15-3d, SBA15-5d and SBA15-7d, where the figure stands for the total time of hydrothermal treatment in the autoclave (Figure 6). Due to the increase of pressure, a swelling effect of the surfactant template chains leads to an increase in a pore diameter of SBA-15 from 8.2 nm up to 11.4 nm.
Figure 6. Scheme of hydrothermal procedure for the synthesis of large-pore SBA-15 ordered mesoporous silica employing conventional Teflon® beakers and Teflon®-lined stainless steel autoclaves. Reproduced from reference [24] with permission.
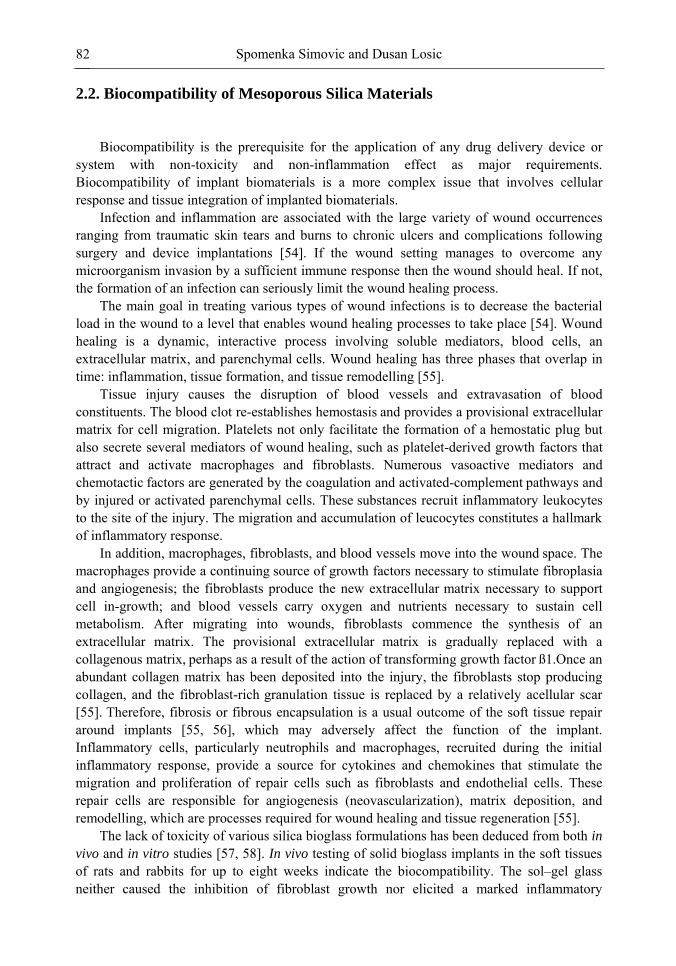
Spomenka Simovic and Dusan Losic 82
2.2. Biocompatibility of Mesoporous Silica Materials
Biocompatibility is the prerequisite for the application of any drug delivery device or
system with non-toxicity and non-inflammation effect as major requirements. Biocompatibility of implant biomaterials is a more complex issue that involves cellular response and tissue integration of implanted biomaterials.
Infection and inflammation are associated with the large variety of wound occurrences ranging from traumatic skin tears and burns to chronic ulcers and complications following surgery and device implantations [54]. If the wound setting manages to overcome any microorganism invasion by a sufficient immune response then the wound should heal. If not, the formation of an infection can seriously limit the wound healing process.
The main goal in treating various types of wound infections is to decrease the bacterial load in the wound to a level that enables wound healing processes to take place [54]. Wound healing is a dynamic, interactive process involving soluble mediators, blood cells, an extracellular matrix, and parenchymal cells. Wound healing has three phases that overlap in time: inflammation, tissue formation, and tissue remodelling [55].
Tissue injury causes the disruption of blood vessels and extravasation of blood constituents. The blood clot re-establishes hemostasis and provides a provisional extracellular matrix for cell migration. Platelets not only facilitate the formation of a hemostatic plug but also secrete several mediators of wound healing, such as platelet-derived growth factors that attract and activate macrophages and fibroblasts. Numerous vasoactive mediators and chemotactic factors are generated by the coagulation and activated-complement pathways and by injured or activated parenchymal cells. These substances recruit inflammatory leukocytes to the site of the injury. The migration and accumulation of leucocytes constitutes a hallmark of inflammatory response.
In addition, macrophages, fibroblasts, and blood vessels move into the wound space. The macrophages provide a continuing source of growth factors necessary to stimulate fibroplasia
and angiogenesis; the fibroblasts produce the new extracellular matrix necessary to support cell in-growth; and blood vessels carry oxygen and nutrients necessary to sustain cell metabolism. After migrating into wounds, fibroblasts commence the synthesis of an extracellular matrix. The provisional extracellular matrix is gradually replaced with a collagenous matrix, perhaps as a result of the action of transforming growth factor ß1.Once an abundant collagen matrix has been deposited into the injury, the fibroblasts stop producing collagen, and the fibroblast-rich granulation tissue is replaced by a relatively acellular scar [55]. Therefore, fibrosis or fibrous encapsulation is a usual outcome of the soft tissue repair around implants [55, 56], which may adversely affect the function of the implant. Inflammatory cells, particularly neutrophils and macrophages, recruited during the initial inflammatory response, provide a source for cytokines and chemokines that stimulate the migration and proliferation of repair cells such as fibroblasts and endothelial cells. These repair cells are responsible for angiogenesis (neovascularization), matrix deposition, and remodelling, which are processes required for wound healing and tissue regeneration [55].
The lack of toxicity of various silica bioglass formulations has been deduced from both in
vivo and in vitro studies [57, 58]. In vivo testing of solid bioglass implants in the soft tissues of rats and rabbits for up to eight weeks indicate the biocompatibility. The sol–gel glass neither caused the inhibition of fibroblast growth nor elicited a marked inflammatory
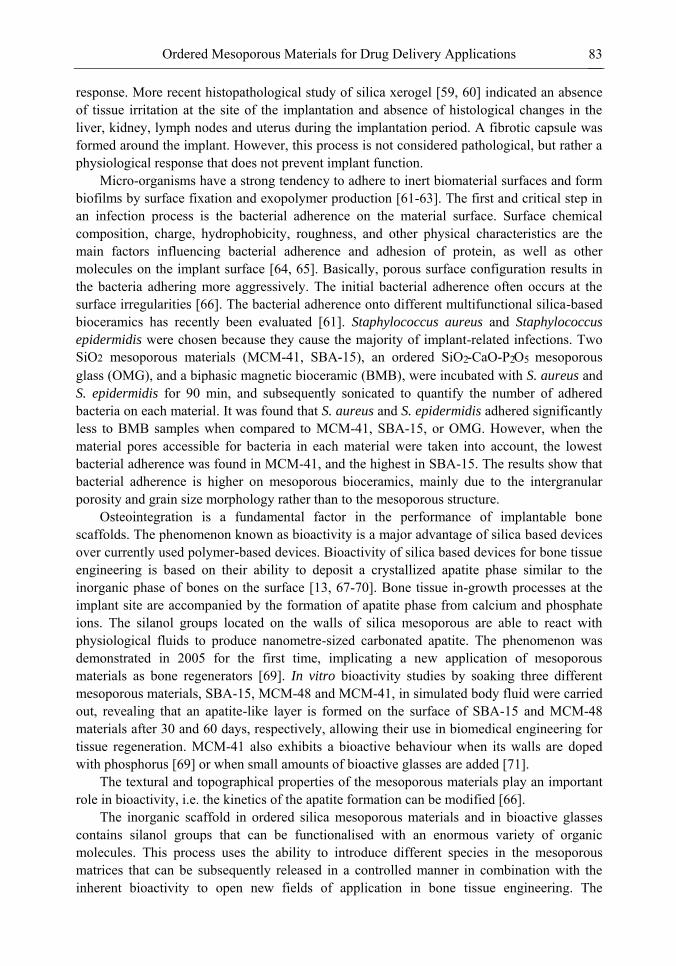
Ordered Mesoporous Materials for Drug Delivery Applications 83
response. More recent histopathological study of silica xerogel [59, 60] indicated an absence of tissue irritation at the site of the implantation and absence of histological changes in the liver, kidney, lymph nodes and uterus during the implantation period. A fibrotic capsule was formed around the implant. However, this process is not considered pathological, but rather a physiological response that does not prevent implant function.
Micro-organisms have a strong tendency to adhere to inert biomaterial surfaces and form biofilms by surface fixation and exopolymer production [61-63]. The first and critical step in an infection process is the bacterial adherence on the material surface. Surface chemical composition, charge, hydrophobicity, roughness, and other physical characteristics are the main factors influencing bacterial adherence and adhesion of protein, as well as other molecules on the implant surface [64, 65]. Basically, porous surface configuration results in the bacteria adhering more aggressively. The initial bacterial adherence often occurs at the surface irregularities [66]. The bacterial adherence onto different multifunctional silica-based bioceramics has recently been evaluated [61]. Staphylococcus aureus and Staphylococcus
epidermidis were chosen because they cause the majority of implant-related infections. Two SiO2 mesoporous materials (MCM-41, SBA-15), an ordered SiO2-CaO-P2O5 mesoporous glass (OMG), and a biphasic magnetic bioceramic (BMB), were incubated with S. aureus and S. epidermidis for 90 min, and subsequently sonicated to quantify the number of adhered bacteria on each material. It was found that S. aureus and S. epidermidis adhered significantly less to BMB samples when compared to MCM-41, SBA-15, or OMG. However, when the material pores accessible for bacteria in each material were taken into account, the lowest bacterial adherence was found in MCM-41, and the highest in SBA-15. The results show that bacterial adherence is higher on mesoporous bioceramics, mainly due to the intergranular porosity and grain size morphology rather than to the mesoporous structure.
Osteointegration is a fundamental factor in the performance of implantable bone scaffolds. The phenomenon known as bioactivity is a major advantage of silica based devices over currently used polymer-based devices. Bioactivity of silica based devices for bone tissue engineering is based on their ability to deposit a crystallized apatite phase similar to the inorganic phase of bones on the surface [13, 67-70]. Bone tissue in-growth processes at the implant site are accompanied by the formation of apatite phase from calcium and phosphate ions. The silanol groups located on the walls of silica mesoporous are able to react with physiological fluids to produce nanometre-sized carbonated apatite. The phenomenon was demonstrated in 2005 for the first time, implicating a new application of mesoporous materials as bone regenerators [69]. In vitro bioactivity studies by soaking three different mesoporous materials, SBA-15, MCM-48 and MCM-41, in simulated body fluid were carried out, revealing that an apatite-like layer is formed on the surface of SBA-15 and MCM-48 materials after 30 and 60 days, respectively, allowing their use in biomedical engineering for tissue regeneration. MCM-41 also exhibits a bioactive behaviour when its walls are doped with phosphorus [69] or when small amounts of bioactive glasses are added [71].
The textural and topographical properties of the mesoporous materials play an important role in bioactivity, i.e. the kinetics of the apatite formation can be modified [66].
The inorganic scaffold in ordered silica mesoporous materials and in bioactive glasses contains silanol groups that can be functionalised with an enormous variety of organic molecules. This process uses the ability to introduce different species in the mesoporous matrices that can be subsequently released in a controlled manner in combination with the inherent bioactivity to open new fields of application in bone tissue engineering. The
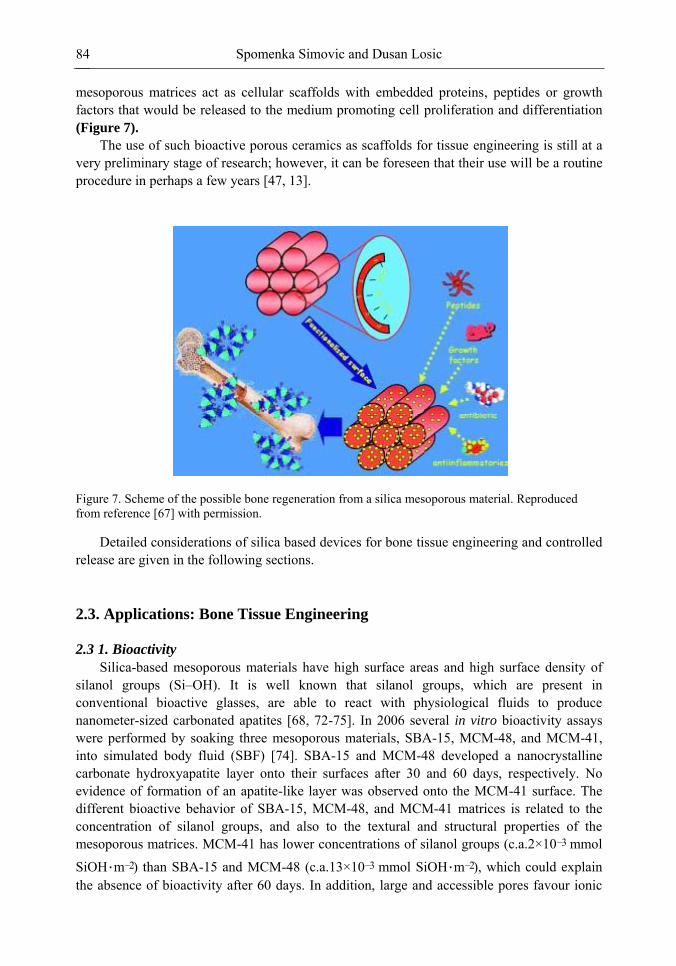
Spomenka Simovic and Dusan Losic 84
mesoporous matrices act as cellular scaffolds with embedded proteins, peptides or growth factors that would be released to the medium promoting cell proliferation and differentiation (Figure 7).
The use of such bioactive porous ceramics as scaffolds for tissue engineering is still at a very preliminary stage of research; however, it can be foreseen that their use will be a routine procedure in perhaps a few years [47, 13].
Figure 7. Scheme of the possible bone regeneration from a silica mesoporous material. Reproduced from reference [67] with permission.
Detailed considerations of silica based devices for bone tissue engineering and controlled release are given in the following sections.
2.3. Applications: Bone Tissue Engineering
2.3 1. Bioactivity
Silica-based mesoporous materials have high surface areas and high surface density of silanol groups (Si–OH). It is well known that silanol groups, which are present in conventional bioactive glasses, are able to react with physiological fluids to produce nanometer-sized carbonated apatites [68, 72-75]. In 2006 several in vitro bioactivity assays were performed by soaking three mesoporous materials, SBA-15, MCM-48, and MCM-41, into simulated body fluid (SBF) [74]. SBA-15 and MCM-48 developed a nanocrystalline carbonate hydroxyapatite layer onto their surfaces after 30 and 60 days, respectively. No evidence of formation of an apatite-like layer was observed onto the MCM-41 surface. The different bioactive behavior of SBA-15, MCM-48, and MCM-41 matrices is related to the concentration of silanol groups, and also to the textural and structural properties of the mesoporous matrices. MCM-41 has lower concentrations of silanol groups (c.a.2×10−3 mmol
SiOH⋅m−2) than SBA-15 and MCM-48 (c.a.13×10−3 mmol SiOH⋅m−2), which could explain the absence of bioactivity after 60 days. In addition, large and accessible pores favour ionic
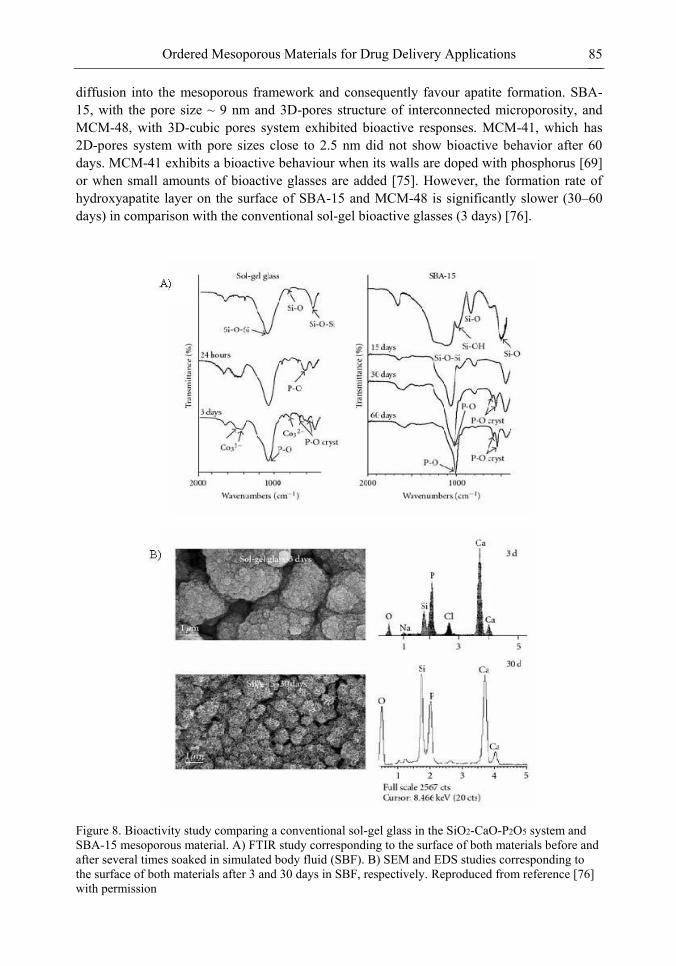
Ordered Mesoporous Materials for Drug Delivery Applications 85
diffusion into the mesoporous framework and consequently favour apatite formation. SBA-15, with the pore size ~ 9 nm and 3D-pores structure of interconnected microporosity, and MCM-48, with 3D-cubic pores system exhibited bioactive responses. MCM-41, which has 2D-pores system with pore sizes close to 2.5 nm did not show bioactive behavior after 60 days. MCM-41 exhibits a bioactive behaviour when its walls are doped with phosphorus [69] or when small amounts of bioactive glasses are added [75]. However, the formation rate of hydroxyapatite layer on the surface of SBA-15 and MCM-48 is significantly slower (30–60 days) in comparison with the conventional sol-gel bioactive glasses (3 days) [76].
Figure 8. Bioactivity study comparing a conventional sol-gel glass in the SiO2-CaO-P2O5 system and SBA-15 mesoporous material. A) FTIR study corresponding to the surface of both materials before and after several times soaked in simulated body fluid (SBF). B) SEM and EDS studies corresponding to the surface of both materials after 3 and 30 days in SBF, respectively. Reproduced from reference [76] with permission
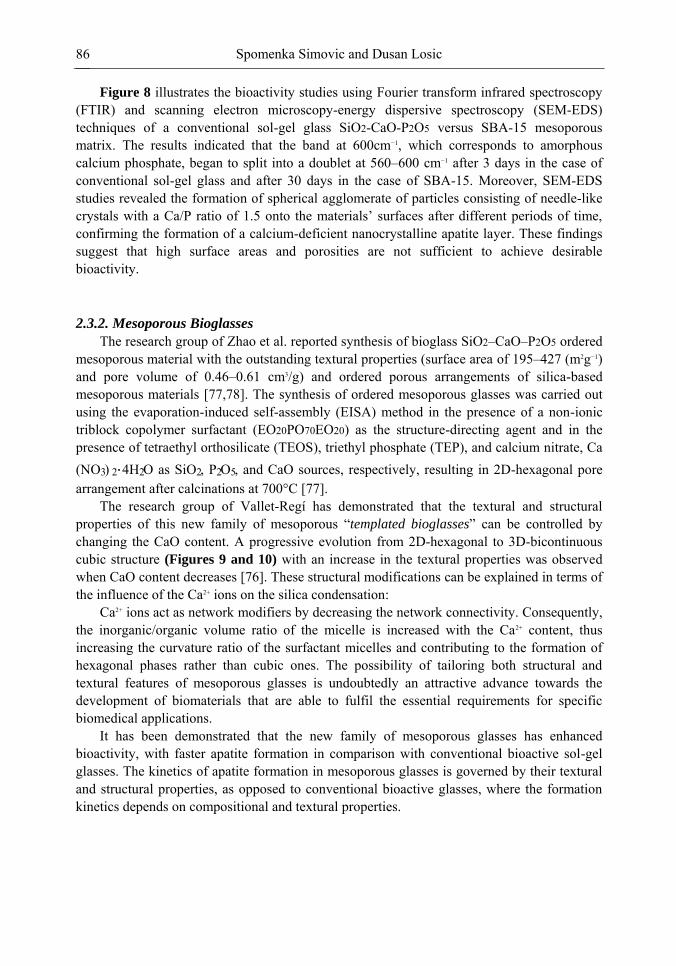
Spomenka Simovic and Dusan Losic 86
Figure 8 illustrates the bioactivity studies using Fourier transform infrared spectroscopy (FTIR) and scanning electron microscopy-energy dispersive spectroscopy (SEM-EDS) techniques of a conventional sol-gel glass SiO2-CaO-P2O5 versus SBA-15 mesoporous matrix. The results indicated that the band at 600cm−1, which corresponds to amorphous calcium phosphate, began to split into a doublet at 560–600 cm−1 after 3 days in the case of conventional sol-gel glass and after 30 days in the case of SBA-15. Moreover, SEM-EDS studies revealed the formation of spherical agglomerate of particles consisting of needle-like crystals with a Ca/P ratio of 1.5 onto the materials‘ surfaces after different periods of time,
confirming the formation of a calcium-deficient nanocrystalline apatite layer. These findings suggest that high surface areas and porosities are not sufficient to achieve desirable bioactivity.
2.3.2. Mesoporous Bioglasses
The research group of Zhao et al. reported synthesis of bioglass SiO2–CaO–P2O5 ordered mesoporous material with the outstanding textural properties (surface area of 195–427 (m2g−1) and pore volume of 0.46–0.61 cm3/g) and ordered porous arrangements of silica-based mesoporous materials [77,78]. The synthesis of ordered mesoporous glasses was carried out using the evaporation-induced self-assembly (EISA) method in the presence of a non-ionic triblock copolymer surfactant (EO20PO70EO20) as the structure-directing agent and in the presence of tetraethyl orthosilicate (TEOS), triethyl phosphate (TEP), and calcium nitrate, Ca (NO3) 2⋅4H2O as SiO2, P2O5, and CaO sources, respectively, resulting in 2D-hexagonal pore arrangement after calcinations at 700°C [77].
The research group of Vallet-Regí has demonstrated that the textural and structural properties of this new family of mesoporous ―templated bioglasses‖ can be controlled by changing the CaO content. A progressive evolution from 2D-hexagonal to 3D-bicontinuous cubic structure (Figures 9 and 10) with an increase in the textural properties was observed
when CaO content decreases [76]. These structural modifications can be explained in terms of the influence of the Ca2+ ions on the silica condensation:
Ca2+ ions act as network modifiers by decreasing the network connectivity. Consequently, the inorganic/organic volume ratio of the micelle is increased with the Ca2+ content, thus increasing the curvature ratio of the surfactant micelles and contributing to the formation of hexagonal phases rather than cubic ones. The possibility of tailoring both structural and textural features of mesoporous glasses is undoubtedly an attractive advance towards the development of biomaterials that are able to fulfil the essential requirements for specific biomedical applications.
It has been demonstrated that the new family of mesoporous glasses has enhanced bioactivity, with faster apatite formation in comparison with conventional bioactive sol-gel glasses. The kinetics of apatite formation in mesoporous glasses is governed by their textural and structural properties, as opposed to conventional bioactive glasses, where the formation kinetics depends on compositional and textural properties.
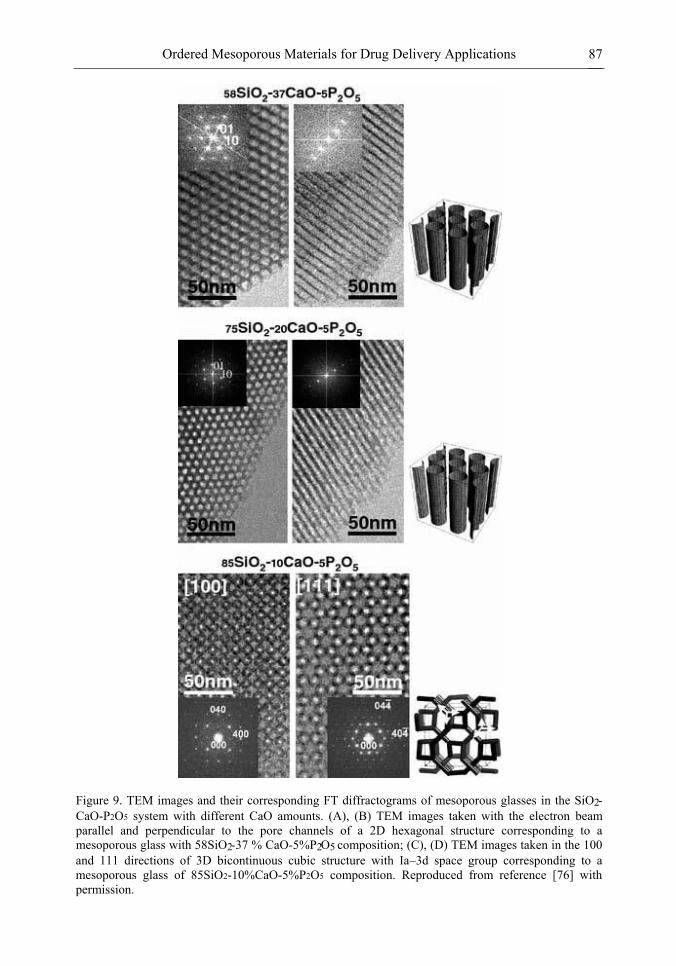
Ordered Mesoporous Materials for Drug Delivery Applications 87
Figure 9. TEM images and their corresponding FT diffractograms of mesoporous glasses in the SiO2-CaO-P2O5 system with different CaO amounts. (A), (B) TEM images taken with the electron beam parallel and perpendicular to the pore channels of a 2D hexagonal structure corresponding to a mesoporous glass with 58SiO2-37 % CaO-5%P2O5 composition; (C), (D) TEM images taken in the 100 and 111 directions of 3D bicontinuous cubic structure with Ia–3d space group corresponding to a mesoporous glass of 85SiO2-10%CaO-5%P2O5 composition. Reproduced from reference [76] with permission.
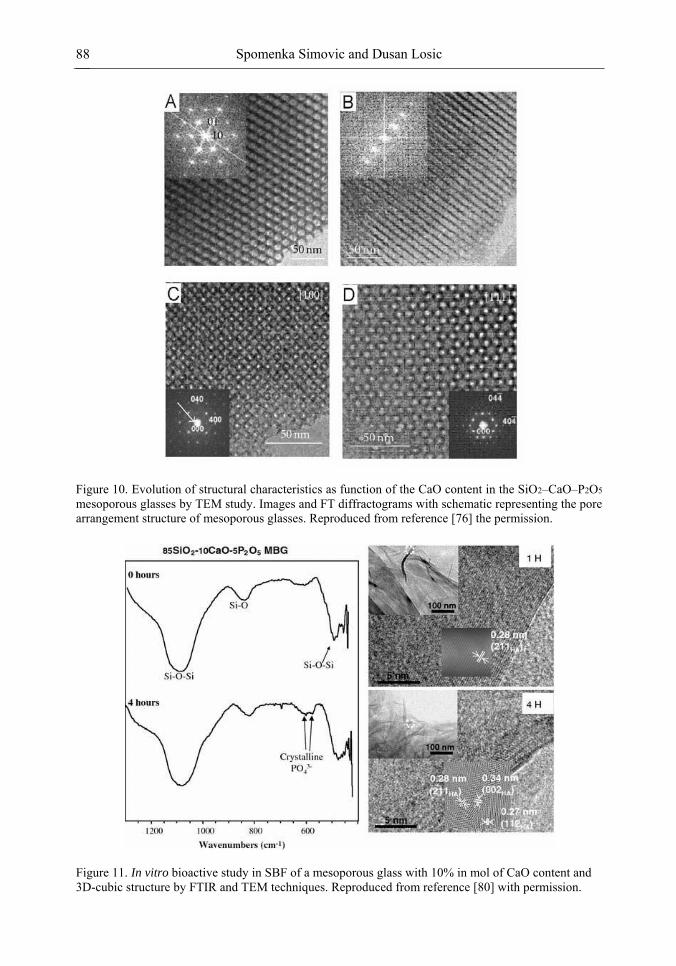
Spomenka Simovic and Dusan Losic 88
Figure 10. Evolution of structural characteristics as function of the CaO content in the SiO2–CaO–P2O5 mesoporous glasses by TEM study. Images and FT diffractograms with schematic representing the pore arrangement structure of mesoporous glasses. Reproduced from reference [76] the permission.
Figure 11. In vitro bioactive study in SBF of a mesoporous glass with 10% in mol of CaO content and 3D-cubic structure by FTIR and TEM techniques. Reproduced from reference [80] with permission.
Ordered Mesoporous Materials for Drug Delivery Applications 89
By tailoring the structural and textural properties at the nanometric level, a variety of bioactive responses can be observed. Mesoporous glasses with low CaO content (10% in mol) 85SiO2-10%CaO-5%P2O5 and 3D-bicontinuos cubic structure have shown the fastest HCA formation observed up to date in a silica based bioactive material. This behaviour could be explained in terms of the mesoporous structure and the textural properties, i.e. the 3D pore system provides not only high surface area and porosity, but also easier interchange of ions, increased mass transport and diffusion processes and hence, a higher crystallization rate (Figure 11) [68]. Bioactivity of mesoporous glass with 3D bicontinuous cubic structure and composition is depicted in Figure 12. Transmission electron microscopy (TEM) revealed only 4 hours for the formation of the crystalline apatite. The bioactive response is faster than for that of mesoporous glasses with higher CaO content and 2D-hexagonal structure. Figure
12 also shows that the Ca2+ concentration and pH remain almost constant to the values of 7.45 and 100 ppm, respectively during soaking time [68]. This is important since the high local pH values are cytotoxic.
Figure 12. Bioactive in vitro study corresponding to an ordered mesoporous glass with 3D bicontinuous cubic structure and 85SiO2-10%CaO-5%P2O5 composition. (Inset) schematic representation of 3D cubic pore arrangement A) Variation of calcium content and pH values of SBF after soaking the materials during different periods. B) HRTEM study corresponding to the surface of mesoporous glasses after 4 hours soaked in SBF. Low magnification image indicates the needle-like crystals formation on the surface of mesoporous glass. Higher magnification and FT transform showing the (002), (211), and (112) reflections corresponding to d-spacings of 0.34, 0.28, and 0.27 nm of an apatite phase. Reproduced from reference [80] with permission.
Mesoporous glasses with 2D-hexagonal pore arrangements and high CaO content (37% in mol) provided a biomimetic mechanism where a sequential transition from amorphous calcium phosphate (ACP) to octacalcium phosphate (OCP) and to calcium deficient carbonate hydroxyapatite (CDHA) maturation, similar to the in vivo bone biomineralization process was observed by TEM imaging (Figure 13) [79]. This is the first time such an ACP-OCP-CDHA maturation sequence has been observed in bioceramics. The open channel array and the textural parameters of 2D-hexagonal structure together with high CaO content allow an intense Ca2+–H3O+ exchange that results in local acid pH values that favor the OCP phase formation. ―Templated bioglasses‖ with 2D-hexagonal mesoporous arrangement and high
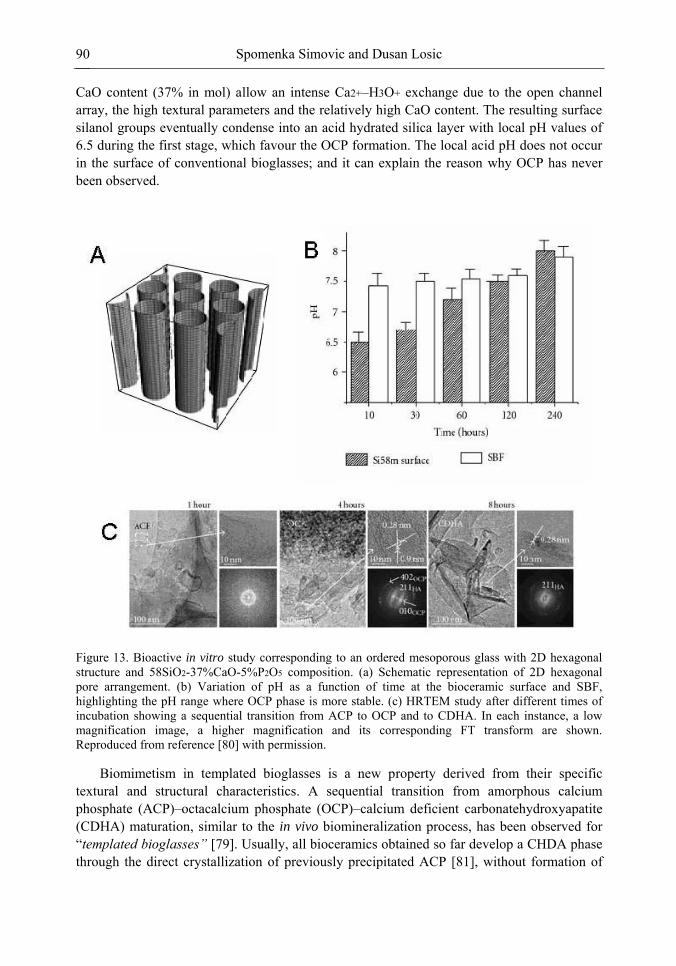
Spomenka Simovic and Dusan Losic 90
CaO content (37% in mol) allow an intense Ca2+–H3O+ exchange due to the open channel array, the high textural parameters and the relatively high CaO content. The resulting surface silanol groups eventually condense into an acid hydrated silica layer with local pH values of 6.5 during the first stage, which favour the OCP formation. The local acid pH does not occur in the surface of conventional bioglasses; and it can explain the reason why OCP has never been observed.
Figure 13. Bioactive in vitro study corresponding to an ordered mesoporous glass with 2D hexagonal structure and 58SiO2-37%CaO-5%P2O5 composition. (a) Schematic representation of 2D hexagonal pore arrangement. (b) Variation of pH as a function of time at the bioceramic surface and SBF, highlighting the pH range where OCP phase is more stable. (c) HRTEM study after different times of incubation showing a sequential transition from ACP to OCP and to CDHA. In each instance, a low magnification image, a higher magnification and its corresponding FT transform are shown. Reproduced from reference [80] with permission.
Biomimetism in templated bioglasses is a new property derived from their specific textural and structural characteristics. A sequential transition from amorphous calcium phosphate (ACP)–octacalcium phosphate (OCP)–calcium deficient carbonatehydroxyapatite (CDHA) maturation, similar to the in vivo biomineralization process, has been observed for ―templated bioglasses” [79]. Usually, all bioceramics obtained so far develop a CHDA phase through the direct crystallization of previously precipitated ACP [81], without formation of
Ordered Mesoporous Materials for Drug Delivery Applications 91
OCP phase which is formed in natural bone biomineralization process [82-85]. OCP is a metastable phase and will appear only if the pH in the crystallization system is below 7.
The influence of pore size of mesostructured CaO−SiO2 biomaterial on promoting HAP crystallization and growth has been reported by Deng et al. [86] It has been found that by tuning the pore size below or above the critical size, the HAP nucleation process can be switched off or on inside the mesopores. The pore size of 2.7 nm was below the threshold of the critical nucleation size, and the nucleation was suppressed within the mesopores due to its thermodynamic instability. However, the prohibited nucleation enabled Ca ions to freely transport to the outer surface to form a dense layer of crystalline HAP rapidly within one day.
A number of composite silica-HAP materials with enhanced bioactivity have been fabricated. For instance, a novel material hexagonal mesoporous silica-hydroxyapatite (HMS-HA) has been developed based on self-assembly of nanohydroxyapatite in mesoporous silica in situ [87]. The mesoporous amorphous calcium silicate (MACS) was synthesized using mesoporous silica SBA-15 as both the template and silicon source, and Ca (NO3)2 as the calcium source. The MACS shows a well-defined mesoporous structure with high sp. surface area. Owing to the high specific surface area and pore volume, the MACS had a significantly enhanced bone-forming bioactivity compared with the conventional amorphous CaSiO3 and develop a carbonate-containing hydroxyapatite (HCA) layer on the surface after being immersed in SBF for 4 h [88]. Andersson et al, reported synthesis of silica-calcium phosphate (hydroxyapatite or tricalcium phosphate) composite materials with high in vitro bioactivity [89].
Hierarchically 3D porous mesoporous bioactive glasses that scaffold with different chemical compositions have been prepared by a combination of polyurethane sponge and non-ionic block copolymer EO20PO70EO20 (P123) surfactant as co-templates and evaporation-induced self-assembly process. Scaffolds have the interconnected macroporous network (pore diameter of 200–400 m) and mesoporous walls (mesopore size of 4.9 nm). In
vitro bioactivity was dependent on the chemical composition. The introduction of Ca and P into the network facilitates the formation of hydroxylcarbonate apatite layer on the surfaces [90].
2.3.3. Mesoporous Bioglasses Microspheres
Synthesis methods for SiO2-based mesoporous materials described in previous sections lead to irregularly shaped particles, and consequently variable surface area inconvenient for therapeutic scaffolds where reproducible drug release is required. Control over both the external morphology and the mesostructure of the material leads to the development of more reliable and reproducible drug delivery systems [91]. Microspheres are widely accepted from a clinical point of view because of their ability to form suspensions that can be injected or dispersed into bone cements [92-94].
The synthesis of bioactive mesoporous microspheres in the system SiO2−CaO−P2O5 with an ordered mesopore arrangement has recently been reported [91]. The microspheres (SEM image is presented in Figure 16) have been synthesized by means of the evaporation-induced self-assembly (EISA) method followed by an aerosol-assisted route. This process is based on the use of a piezoelectric ceramic, which is placed below the precursor solution of the material. When the piezoelectric transducer is excited near its own resonance frequency, a geyser is formed at the surface of the liquid. This geyser produces ultrafine droplets, which
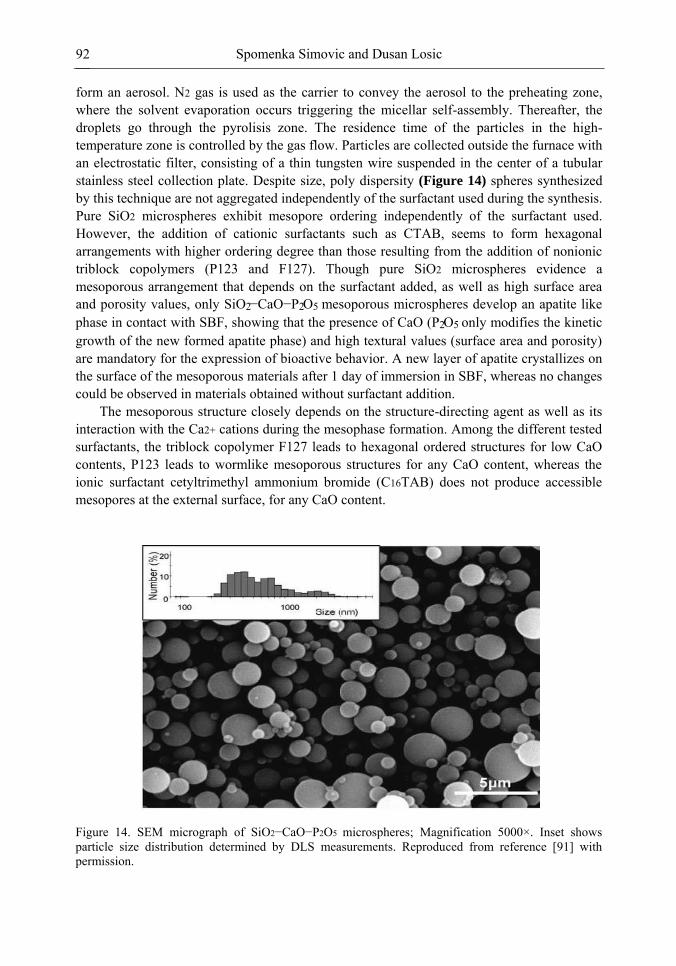
Spomenka Simovic and Dusan Losic 92
form an aerosol. N2 gas is used as the carrier to convey the aerosol to the preheating zone, where the solvent evaporation occurs triggering the micellar self-assembly. Thereafter, the droplets go through the pyrolisis zone. The residence time of the particles in the high-temperature zone is controlled by the gas flow. Particles are collected outside the furnace with an electrostatic filter, consisting of a thin tungsten wire suspended in the center of a tubular stainless steel collection plate. Despite size, poly dispersity (Figure 14) spheres synthesized by this technique are not aggregated independently of the surfactant used during the synthesis. Pure SiO2 microspheres exhibit mesopore ordering independently of the surfactant used. However, the addition of cationic surfactants such as CTAB, seems to form hexagonal arrangements with higher ordering degree than those resulting from the addition of nonionic triblock copolymers (P123 and F127). Though pure SiO2 microspheres evidence a mesoporous arrangement that depends on the surfactant added, as well as high surface area and porosity values, only SiO2−CaO−P2O5 mesoporous microspheres develop an apatite like phase in contact with SBF, showing that the presence of CaO (P2O5 only modifies the kinetic growth of the new formed apatite phase) and high textural values (surface area and porosity) are mandatory for the expression of bioactive behavior. A new layer of apatite crystallizes on the surface of the mesoporous materials after 1 day of immersion in SBF, whereas no changes could be observed in materials obtained without surfactant addition.
The mesoporous structure closely depends on the structure-directing agent as well as its interaction with the Ca2+ cations during the mesophase formation. Among the different tested surfactants, the triblock copolymer F127 leads to hexagonal ordered structures for low CaO contents, P123 leads to wormlike mesoporous structures for any CaO content, whereas the ionic surfactant cetyltrimethyl ammonium bromide (C16TAB) does not produce accessible mesopores at the external surface, for any CaO content.
Figure 14. SEM micrograph of SiO2−CaO−P2O5 microspheres; Magnification 5000×. Inset shows particle size distribution determined by DLS measurements. Reproduced from reference [91] with permission.
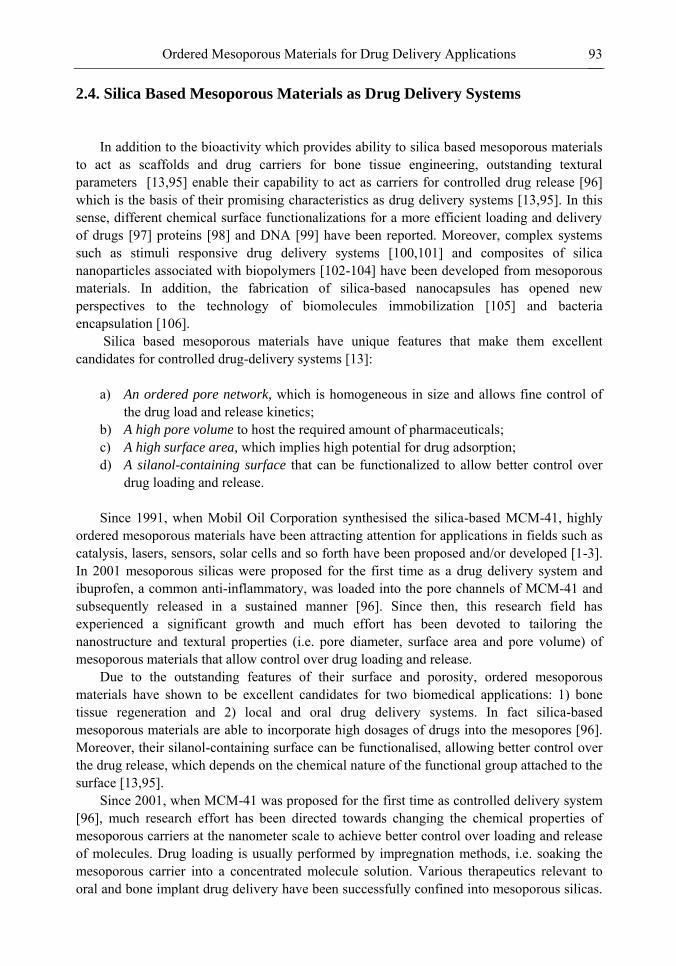
Ordered Mesoporous Materials for Drug Delivery Applications 93
2.4. Silica Based Mesoporous Materials as Drug Delivery Systems
In addition to the bioactivity which provides ability to silica based mesoporous materials
to act as scaffolds and drug carriers for bone tissue engineering, outstanding textural parameters [13,95] enable their capability to act as carriers for controlled drug release [96] which is the basis of their promising characteristics as drug delivery systems [13,95]. In this sense, different chemical surface functionalizations for a more efficient loading and delivery of drugs [97] proteins [98] and DNA [99] have been reported. Moreover, complex systems such as stimuli responsive drug delivery systems [100,101] and composites of silica nanoparticles associated with biopolymers [102-104] have been developed from mesoporous materials. In addition, the fabrication of silica-based nanocapsules has opened new perspectives to the technology of biomolecules immobilization [105] and bacteria encapsulation [106].
Silica based mesoporous materials have unique features that make them excellent candidates for controlled drug-delivery systems [13]:
a) An ordered pore network, which is homogeneous in size and allows fine control of
the drug load and release kinetics; b) A high pore volume to host the required amount of pharmaceuticals; c) A high surface area, which implies high potential for drug adsorption; d) A silanol-containing surface that can be functionalized to allow better control over
drug loading and release. Since 1991, when Mobil Oil Corporation synthesised the silica-based MCM-41, highly
ordered mesoporous materials have been attracting attention for applications in fields such as catalysis, lasers, sensors, solar cells and so forth have been proposed and/or developed [1-3]. In 2001 mesoporous silicas were proposed for the first time as a drug delivery system and ibuprofen, a common anti-inflammatory, was loaded into the pore channels of MCM-41 and subsequently released in a sustained manner [96]. Since then, this research field has experienced a significant growth and much effort has been devoted to tailoring the nanostructure and textural properties (i.e. pore diameter, surface area and pore volume) of mesoporous materials that allow control over drug loading and release.
Due to the outstanding features of their surface and porosity, ordered mesoporous materials have shown to be excellent candidates for two biomedical applications: 1) bone tissue regeneration and 2) local and oral drug delivery systems. In fact silica-based mesoporous materials are able to incorporate high dosages of drugs into the mesopores [96]. Moreover, their silanol-containing surface can be functionalised, allowing better control over the drug release, which depends on the chemical nature of the functional group attached to the surface [13,95].
Since 2001, when MCM-41 was proposed for the first time as controlled delivery system [96], much research effort has been directed towards changing the chemical properties of mesoporous carriers at the nanometer scale to achieve better control over loading and release of molecules. Drug loading is usually performed by impregnation methods, i.e. soaking the mesoporous carrier into a concentrated molecule solution. Various therapeutics relevant to oral and bone implant drug delivery have been successfully confined into mesoporous silicas.
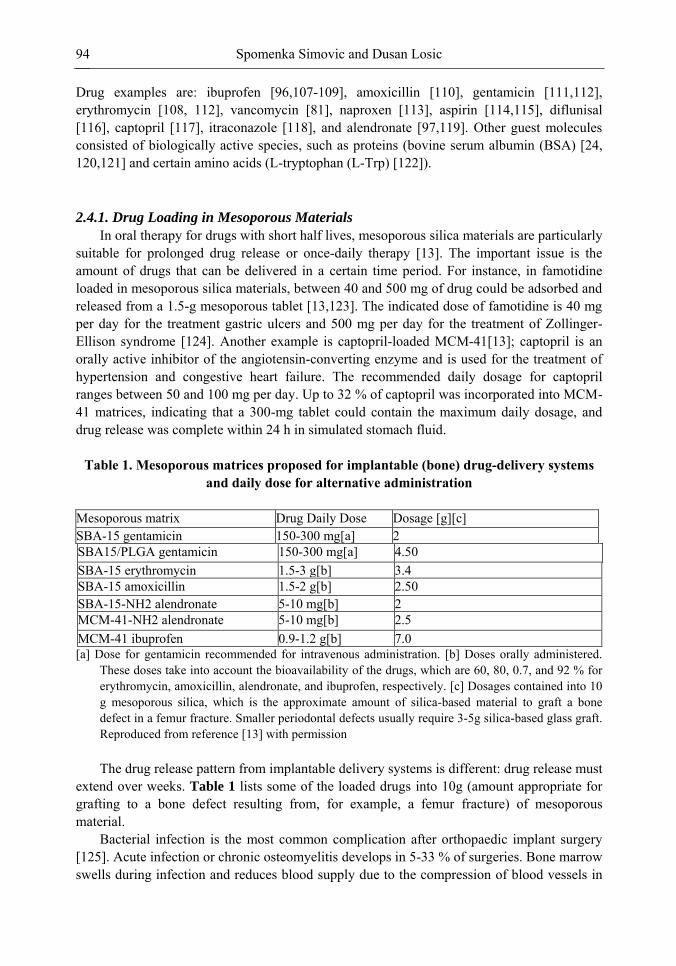
Spomenka Simovic and Dusan Losic 94
Drug examples are: ibuprofen [96,107-109], amoxicillin [110], gentamicin [111,112], erythromycin [108, 112], vancomycin [81], naproxen [113], aspirin [114,115], diflunisal [116], captopril [117], itraconazole [118], and alendronate [97,119]. Other guest molecules consisted of biologically active species, such as proteins (bovine serum albumin (BSA) [24, 120,121] and certain amino acids (L-tryptophan (L-Trp) [122]).
2.4.1. Drug Loading in Mesoporous Materials
In oral therapy for drugs with short half lives, mesoporous silica materials are particularly suitable for prolonged drug release or once-daily therapy [13]. The important issue is the amount of drugs that can be delivered in a certain time period. For instance, in famotidine loaded in mesoporous silica materials, between 40 and 500 mg of drug could be adsorbed and released from a 1.5-g mesoporous tablet [13,123]. The indicated dose of famotidine is 40 mg per day for the treatment gastric ulcers and 500 mg per day for the treatment of Zollinger-Ellison syndrome [124]. Another example is captopril-loaded MCM-41[13]; captopril is an orally active inhibitor of the angiotensin-converting enzyme and is used for the treatment of hypertension and congestive heart failure. The recommended daily dosage for captopril ranges between 50 and 100 mg per day. Up to 32 % of captopril was incorporated into MCM-41 matrices, indicating that a 300-mg tablet could contain the maximum daily dosage, and drug release was complete within 24 h in simulated stomach fluid.
Table 1. Mesoporous matrices proposed for implantable (bone) drug-delivery systems
and daily dose for alternative administration
Mesoporous matrix Drug Daily Dose Dosage [g][c] SBA-15 gentamicin 150-300 mg[a] 2 SBA15/PLGA gentamicin 150-300 mg[a] 4.50 SBA-15 erythromycin 1.5-3 g[b] 3.4 SBA-15 amoxicillin 1.5-2 g[b] 2.50 SBA-15-NH2 alendronate 5-10 mg[b] 2 MCM-41-NH2 alendronate 5-10 mg[b] 2.5 MCM-41 ibuprofen 0.9-1.2 g[b] 7.0 [a] Dose for gentamicin recommended for intravenous administration. [b] Doses orally administered.
These doses take into account the bioavailability of the drugs, which are 60, 80, 0.7, and 92 % for erythromycin, amoxicillin, alendronate, and ibuprofen, respectively. [c] Dosages contained into 10 g mesoporous silica, which is the approximate amount of silica-based material to graft a bone defect in a femur fracture. Smaller periodontal defects usually require 3-5g silica-based glass graft. Reproduced from reference [13] with permission The drug release pattern from implantable delivery systems is different: drug release must
extend over weeks. Table 1 lists some of the loaded drugs into 10g (amount appropriate for grafting to a bone defect resulting from, for example, a femur fracture) of mesoporous material.
Bacterial infection is the most common complication after orthopaedic implant surgery [125]. Acute infection or chronic osteomyelitis develops in 5-33 % of surgeries. Bone marrow swells during infection and reduces blood supply due to the compression of blood vessels in
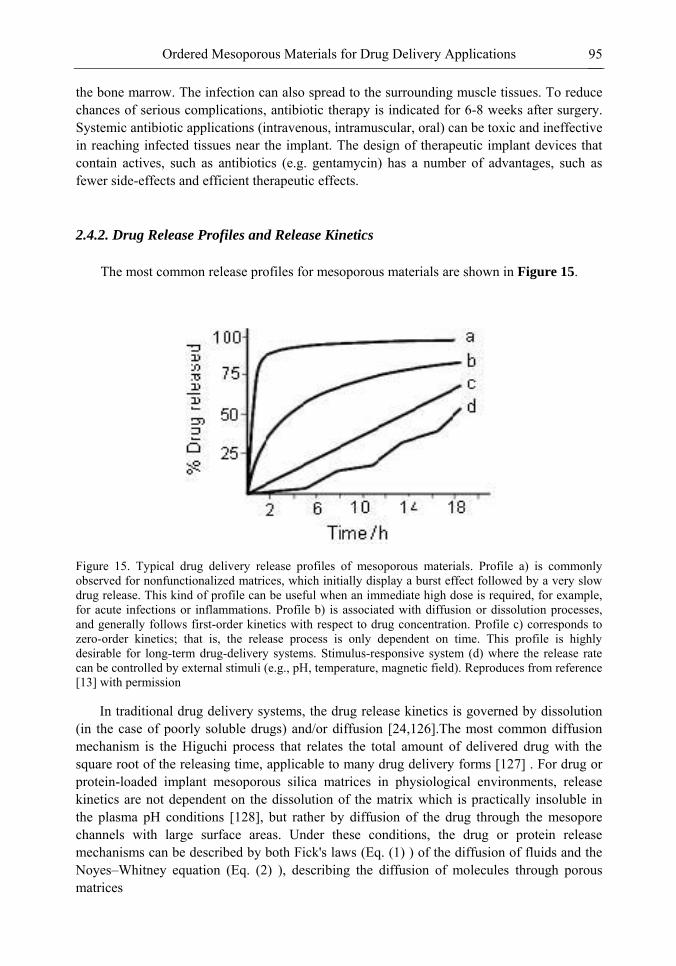
Ordered Mesoporous Materials for Drug Delivery Applications 95
the bone marrow. The infection can also spread to the surrounding muscle tissues. To reduce chances of serious complications, antibiotic therapy is indicated for 6-8 weeks after surgery. Systemic antibiotic applications (intravenous, intramuscular, oral) can be toxic and ineffective in reaching infected tissues near the implant. The design of therapeutic implant devices that contain actives, such as antibiotics (e.g. gentamycin) has a number of advantages, such as fewer side-effects and efficient therapeutic effects.
2.4.2. Drug Release Profiles and Release Kinetics
The most common release profiles for mesoporous materials are shown in Figure 15.
Figure 15. Typical drug delivery release profiles of mesoporous materials. Profile a) is commonly observed for nonfunctionalized matrices, which initially display a burst effect followed by a very slow drug release. This kind of profile can be useful when an immediate high dose is required, for example, for acute infections or inflammations. Profile b) is associated with diffusion or dissolution processes, and generally follows first-order kinetics with respect to drug concentration. Profile c) corresponds to zero-order kinetics; that is, the release process is only dependent on time. This profile is highly desirable for long-term drug-delivery systems. Stimulus-responsive system (d) where the release rate can be controlled by external stimuli (e.g., pH, temperature, magnetic field). Reproduces from reference [13] with permission
In traditional drug delivery systems, the drug release kinetics is governed by dissolution (in the case of poorly soluble drugs) and/or diffusion [24,126].The most common diffusion mechanism is the Higuchi process that relates the total amount of delivered drug with the square root of the releasing time, applicable to many drug delivery forms [127] . For drug or protein-loaded implant mesoporous silica matrices in physiological environments, release kinetics are not dependent on the dissolution of the matrix which is practically insoluble in the plasma pH conditions [128], but rather by diffusion of the drug through the mesopore channels with large surface areas. Under these conditions, the drug or protein release mechanisms can be described by both Fick's laws (Eq. (1) ) of the diffusion of fluids and the Noyes–Whitney equation (Eq. (2) ), describing the diffusion of molecules through porous matrices
Spomenka Simovic and Dusan Losic 96
(1)
(2)
where J is the flux through a continuous infinite porous matrix, Ct is the drug concentration at the time t, D is the diffusion coefficient and x is the direction of flux in one-dimensional approach. CS is the molecule solubility in the matrix in the tested conditions, S is the surface area in contact with the adsorbed molecules and the constant K gives information of the diffusion coefficient, D, and the dimensions and tortuosity of the porous framework.
The combination of Eqs. ( 1 ) and ( 2 ) in the appropriate manner yields that the relative amount of released drug, Qt/Q0, shows the following equation [129]:
(3)
where Qt and Q0 are, respectively, the drug or protein amount at time t and the initial amount of drug or protein in the porous matrix and K′ and k are the release constants that are independent of the drug or protein concentration in the ordered matrix as well as in the solvent accessible area.
The drug or protein release is influenced by the surface area exposed to the molecules inside the mesopores. It has been found that for larger surface areas release follows a first-order kinetics since the exponential part of the equation becomes larger. This is the case of MCM-41 materials where the surface area is around 1000 m2/g. When surface areas are lower, the exponential part of Eq. (3) is smaller than the linear part and the global effect is that the drug release follows zero-order kinetics, as can be found for SBA-15 materials. This effect is also found for functionalized matrices, where essentially surface areas are reduced but the overall effect is maintained [24]. When the mesoporous matrices show large mesopore size and the released molecule is big enough, it can be assumed that solvent accessible area does not significantly change along the release period and that no equilibrium conditions are achieved. Usually, for materials with high surface areas and small mesopores, the diffusion of the protein to the release environment is a surface-dependent process that is determined by the Noyes–Whitney equation.
We can assume that the drug release mechanism is due to diffusive transport through the ordered array of mesopores since the matrix is virtually insoluble in an aqueous environment. In materials with high surface areas and small mesopores, the diffusion of drug molecules to the liquid media is a surface-dependent phenomenon that can be predicted by first-order kinetics [97]. According to the Fick‘s first law, the equation 3 can be rearranged:
Qt/Qo = e-k1t (4)
where Qt and Qo represent the drug amount at the time t and initial amount, respectively, k1 is the first order release constant independent on the drug concentration and contains information about solvent accessibility and drug diffusion through mesopores.
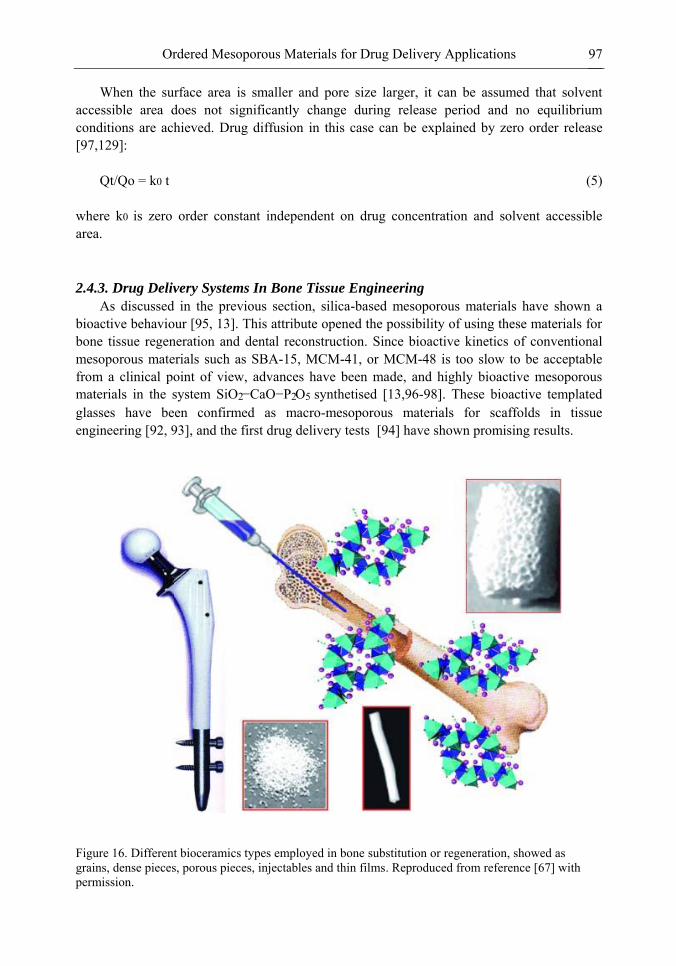
Ordered Mesoporous Materials for Drug Delivery Applications 97
When the surface area is smaller and pore size larger, it can be assumed that solvent accessible area does not significantly change during release period and no equilibrium conditions are achieved. Drug diffusion in this case can be explained by zero order release [97,129]:
Qt/Qo = k0 t (5)
where k0 is zero order constant independent on drug concentration and solvent accessible area.
2.4.3. Drug Delivery Systems In Bone Tissue Engineering
As discussed in the previous section, silica-based mesoporous materials have shown a bioactive behaviour [95, 13]. This attribute opened the possibility of using these materials for bone tissue regeneration and dental reconstruction. Since bioactive kinetics of conventional mesoporous materials such as SBA-15, MCM-41, or MCM-48 is too slow to be acceptable from a clinical point of view, advances have been made, and highly bioactive mesoporous materials in the system SiO2−CaO−P2O5 synthetised [13,96-98]. These bioactive templated glasses have been confirmed as macro-mesoporous materials for scaffolds in tissue engineering [92, 93], and the first drug delivery tests [94] have shown promising results.
Figure 16. Different bioceramics types employed in bone substitution or regeneration, showed as grains, dense pieces, porous pieces, injectables and thin films. Reproduced from reference [67] with permission.
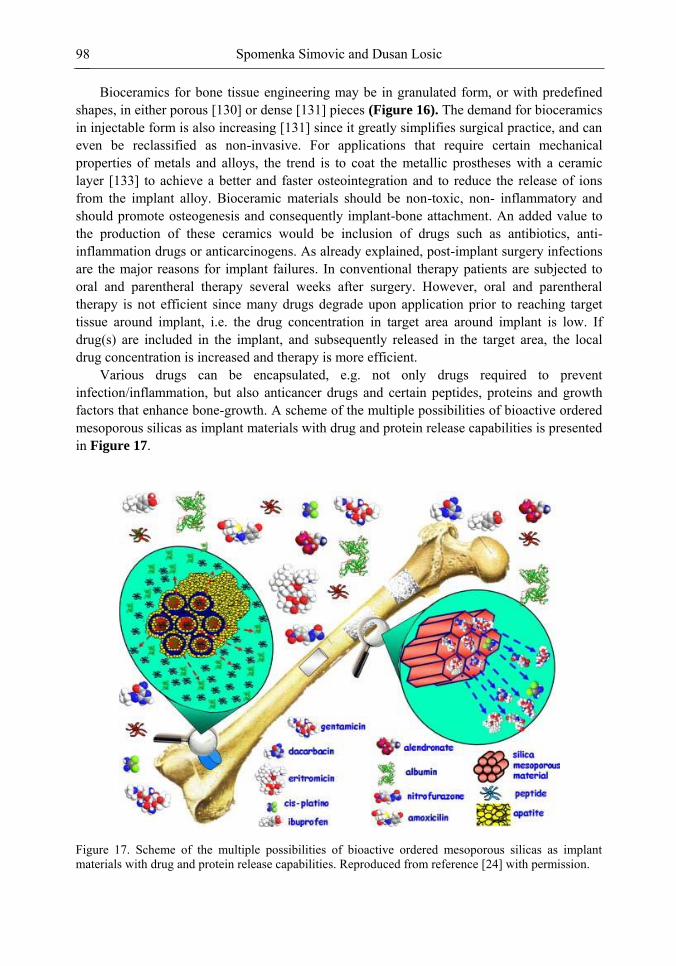
Spomenka Simovic and Dusan Losic 98
Bioceramics for bone tissue engineering may be in granulated form, or with predefined shapes, in either porous [130] or dense [131] pieces (Figure 16). The demand for bioceramics in injectable form is also increasing [131] since it greatly simplifies surgical practice, and can even be reclassified as non-invasive. For applications that require certain mechanical properties of metals and alloys, the trend is to coat the metallic prostheses with a ceramic layer [133] to achieve a better and faster osteointegration and to reduce the release of ions from the implant alloy. Bioceramic materials should be non-toxic, non- inflammatory and should promote osteogenesis and consequently implant-bone attachment. An added value to the production of these ceramics would be inclusion of drugs such as antibiotics, anti-inflammation drugs or anticarcinogens. As already explained, post-implant surgery infections are the major reasons for implant failures. In conventional therapy patients are subjected to oral and parentheral therapy several weeks after surgery. However, oral and parentheral therapy is not efficient since many drugs degrade upon application prior to reaching target tissue around implant, i.e. the drug concentration in target area around implant is low. If drug(s) are included in the implant, and subsequently released in the target area, the local drug concentration is increased and therapy is more efficient.
Various drugs can be encapsulated, e.g. not only drugs required to prevent infection/inflammation, but also anticancer drugs and certain peptides, proteins and growth factors that enhance bone-growth. A scheme of the multiple possibilities of bioactive ordered mesoporous silicas as implant materials with drug and protein release capabilities is presented in Figure 17.
Figure 17. Scheme of the multiple possibilities of bioactive ordered mesoporous silicas as implant materials with drug and protein release capabilities. Reproduced from reference [24] with permission.
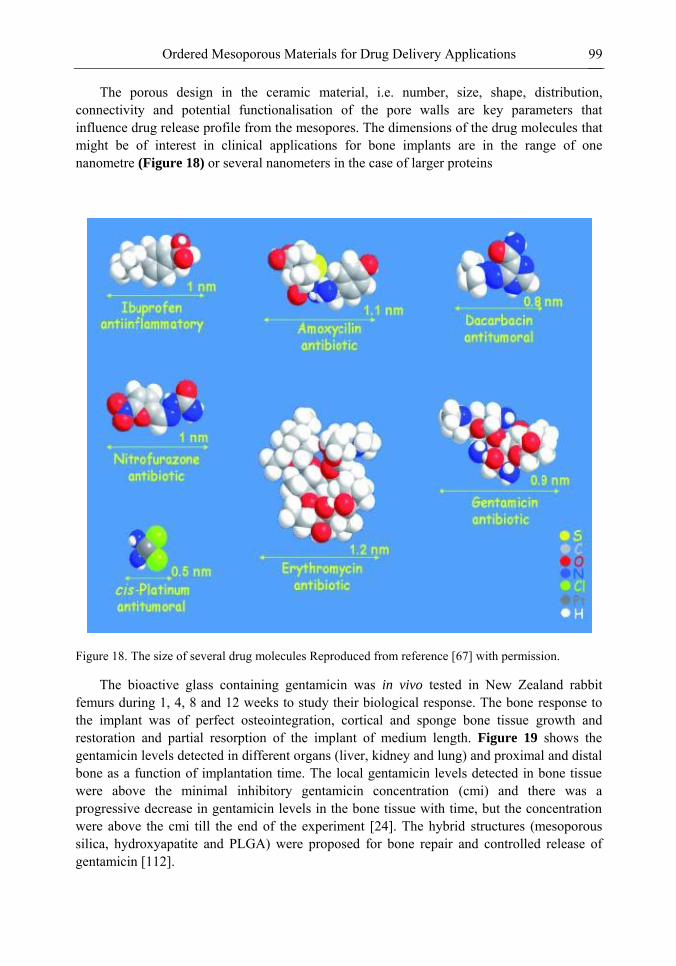
Ordered Mesoporous Materials for Drug Delivery Applications 99
The porous design in the ceramic material, i.e. number, size, shape, distribution, connectivity and potential functionalisation of the pore walls are key parameters that influence drug release profile from the mesopores. The dimensions of the drug molecules that might be of interest in clinical applications for bone implants are in the range of one nanometre (Figure 18) or several nanometers in the case of larger proteins
Figure 18. The size of several drug molecules Reproduced from reference [67] with permission.
The bioactive glass containing gentamicin was in vivo tested in New Zealand rabbit femurs during 1, 4, 8 and 12 weeks to study their biological response. The bone response to the implant was of perfect osteointegration, cortical and sponge bone tissue growth and restoration and partial resorption of the implant of medium length. Figure 19 shows the gentamicin levels detected in different organs (liver, kidney and lung) and proximal and distal bone as a function of implantation time. The local gentamicin levels detected in bone tissue were above the minimal inhibitory gentamicin concentration (cmi) and there was a progressive decrease in gentamicin levels in the bone tissue with time, but the concentration were above the cmi till the end of the experiment [24]. The hybrid structures (mesoporous silica, hydroxyapatite and PLGA) were proposed for bone repair and controlled release of gentamicin [112].
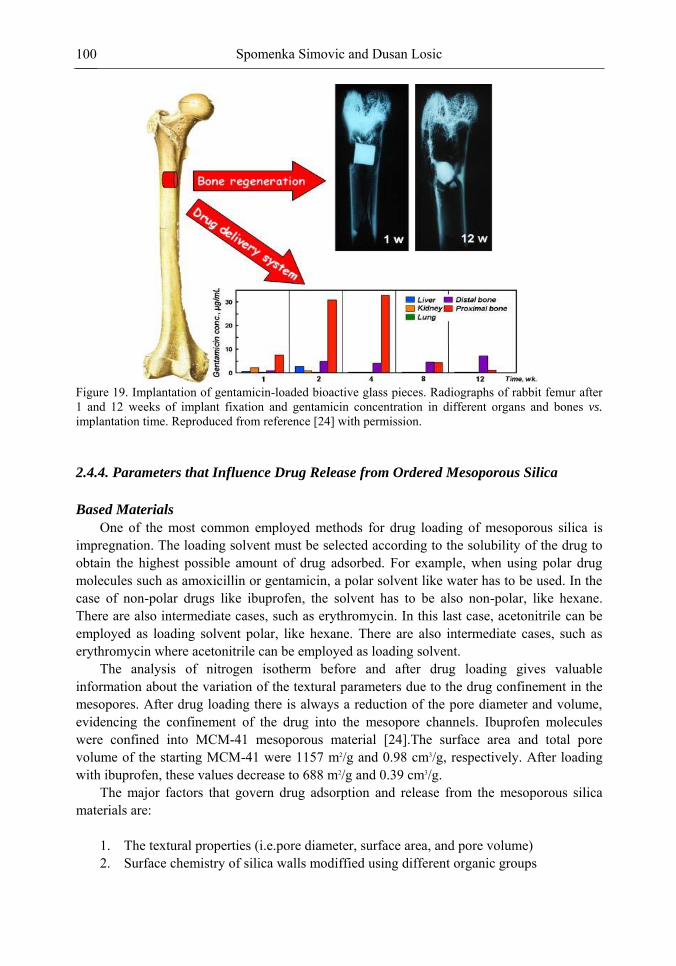
Spomenka Simovic and Dusan Losic 100
Figure 19. Implantation of gentamicin-loaded bioactive glass pieces. Radiographs of rabbit femur after 1 and 12 weeks of implant fixation and gentamicin concentration in different organs and bones vs. implantation time. Reproduced from reference [24] with permission.
2.4.4. Parameters that Influence Drug Release from Ordered Mesoporous Silica
Based Materials
One of the most common employed methods for drug loading of mesoporous silica is impregnation. The loading solvent must be selected according to the solubility of the drug to obtain the highest possible amount of drug adsorbed. For example, when using polar drug molecules such as amoxicillin or gentamicin, a polar solvent like water has to be used. In the case of non-polar drugs like ibuprofen, the solvent has to be also non-polar, like hexane. There are also intermediate cases, such as erythromycin. In this last case, acetonitrile can be employed as loading solvent polar, like hexane. There are also intermediate cases, such as erythromycin where acetonitrile can be employed as loading solvent.
The analysis of nitrogen isotherm before and after drug loading gives valuable information about the variation of the textural parameters due to the drug confinement in the mesopores. After drug loading there is always a reduction of the pore diameter and volume, evidencing the confinement of the drug into the mesopore channels. Ibuprofen molecules were confined into MCM-41 mesoporous material [24].The surface area and total pore volume of the starting MCM-41 were 1157 m2/g and 0.98 cm3/g, respectively. After loading with ibuprofen, these values decrease to 688 m2/g and 0.39 cm3/g.
The major factors that govern drug adsorption and release from the mesoporous silica materials are:
1. The textural properties (i.e.pore diameter, surface area, and pore volume) 2. Surface chemistry of silica walls modiffied using different organic groups
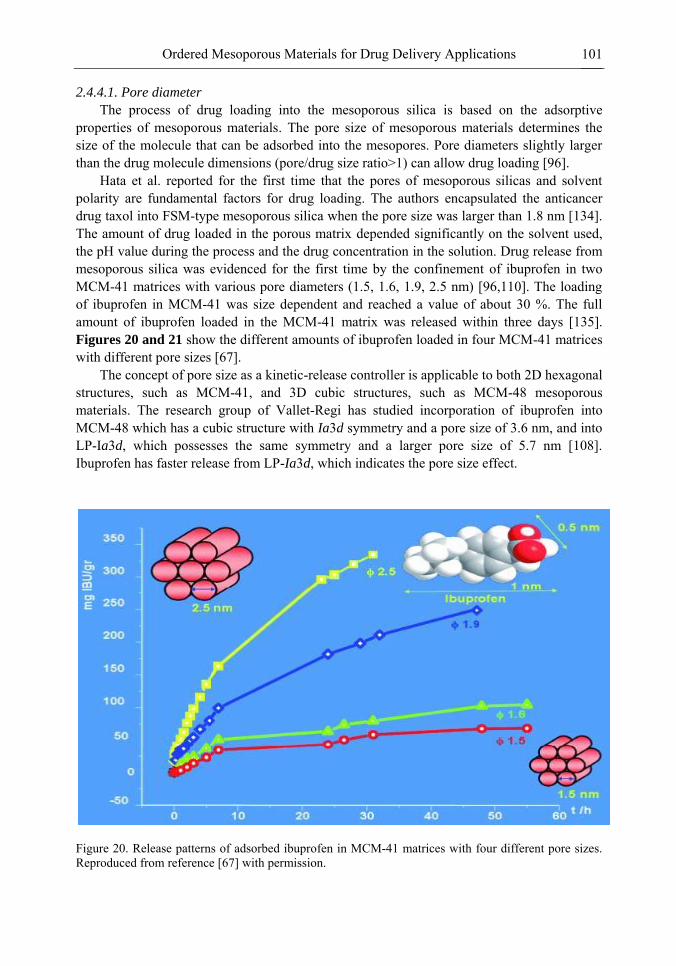
Ordered Mesoporous Materials for Drug Delivery Applications 101
2.4.4.1. Pore diameter
The process of drug loading into the mesoporous silica is based on the adsorptive properties of mesoporous materials. The pore size of mesoporous materials determines the size of the molecule that can be adsorbed into the mesopores. Pore diameters slightly larger than the drug molecule dimensions (pore/drug size ratio>1) can allow drug loading [96].
Hata et al. reported for the first time that the pores of mesoporous silicas and solvent polarity are fundamental factors for drug loading. The authors encapsulated the anticancer drug taxol into FSM-type mesoporous silica when the pore size was larger than 1.8 nm [134]. The amount of drug loaded in the porous matrix depended significantly on the solvent used, the pH value during the process and the drug concentration in the solution. Drug release from mesoporous silica was evidenced for the first time by the confinement of ibuprofen in two MCM-41 matrices with various pore diameters (1.5, 1.6, 1.9, 2.5 nm) [96,110]. The loading of ibuprofen in MCM-41 was size dependent and reached a value of about 30 %. The full amount of ibuprofen loaded in the MCM-41 matrix was released within three days [135]. Figures 20 and 21 show the different amounts of ibuprofen loaded in four MCM-41 matrices with different pore sizes [67].
The concept of pore size as a kinetic-release controller is applicable to both 2D hexagonal structures, such as MCM-41, and 3D cubic structures, such as MCM-48 mesoporous materials. The research group of Vallet-Regi has studied incorporation of ibuprofen into MCM-48 which has a cubic structure with Ia3d symmetry and a pore size of 3.6 nm, and into LP-Ia3d, which possesses the same symmetry and a larger pore size of 5.7 nm [108]. Ibuprofen has faster release from LP-Ia3d, which indicates the pore size effect.
Figure 20. Release patterns of adsorbed ibuprofen in MCM-41 matrices with four different pore sizes. Reproduced from reference [67] with permission.
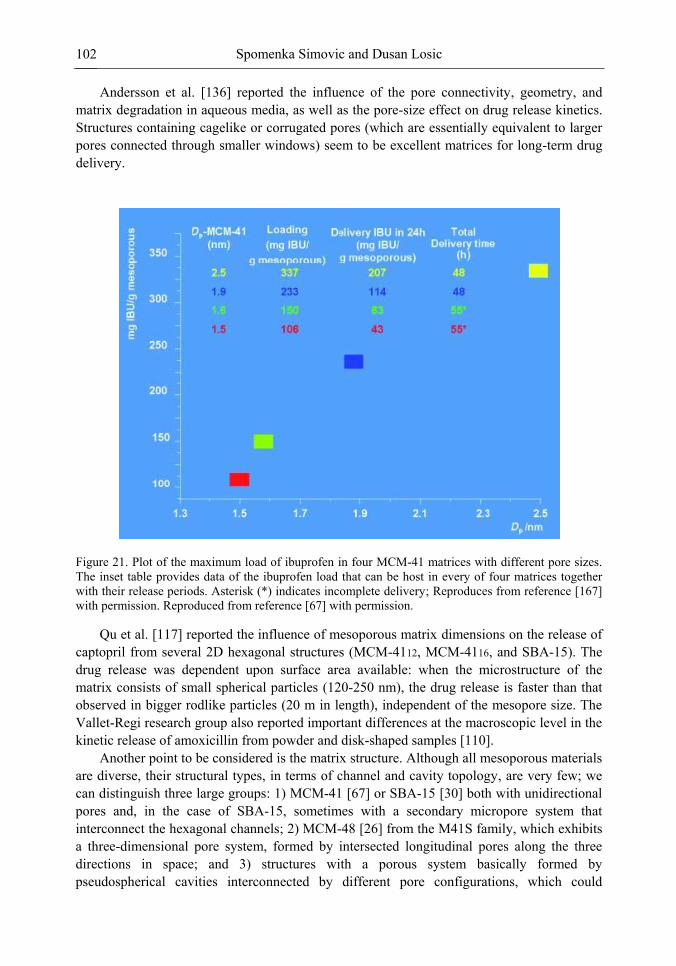
Spomenka Simovic and Dusan Losic 102
Andersson et al. [136] reported the influence of the pore connectivity, geometry, and matrix degradation in aqueous media, as well as the pore-size effect on drug release kinetics. Structures containing cagelike or corrugated pores (which are essentially equivalent to larger pores connected through smaller windows) seem to be excellent matrices for long-term drug delivery.
Figure 21. Plot of the maximum load of ibuprofen in four MCM-41 matrices with different pore sizes. The inset table provides data of the ibuprofen load that can be host in every of four matrices together with their release periods. Asterisk (*) indicates incomplete delivery; Reproduces from reference [167] with permission. Reproduced from reference [67] with permission.
Qu et al. [117] reported the influence of mesoporous matrix dimensions on the release of captopril from several 2D hexagonal structures (MCM-4112, MCM-4116, and SBA-15). The drug release was dependent upon surface area available: when the microstructure of the matrix consists of small spherical particles (120-250 nm), the drug release is faster than that observed in bigger rodlike particles (20 m in length), independent of the mesopore size. The Vallet-Regi research group also reported important differences at the macroscopic level in the kinetic release of amoxicillin from powder and disk-shaped samples [110].
Another point to be considered is the matrix structure. Although all mesoporous materials are diverse, their structural types, in terms of channel and cavity topology, are very few; we can distinguish three large groups: 1) MCM-41 [67] or SBA-15 [30] both with unidirectional pores and, in the case of SBA-15, sometimes with a secondary micropore system that interconnect the hexagonal channels; 2) MCM-48 [26] from the M41S family, which exhibits a three-dimensional pore system, formed by intersected longitudinal pores along the three directions in space; and 3) structures with a porous system basically formed by pseudospherical cavities interconnected by different pore configurations, which could
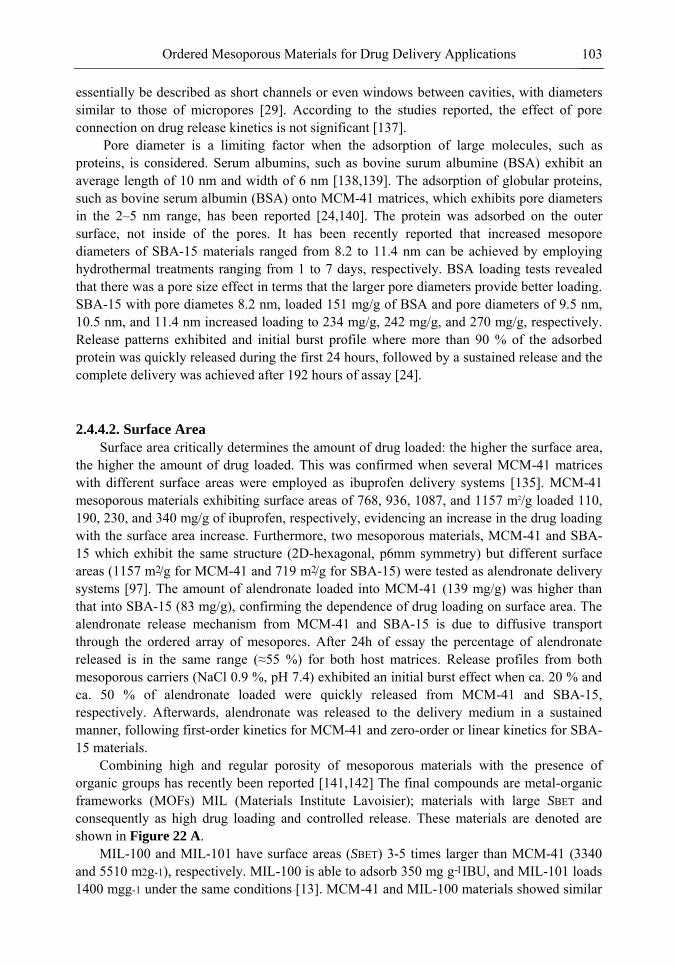
Ordered Mesoporous Materials for Drug Delivery Applications 103
essentially be described as short channels or even windows between cavities, with diameters similar to those of micropores [29]. According to the studies reported, the effect of pore connection on drug release kinetics is not significant [137].
Pore diameter is a limiting factor when the adsorption of large molecules, such as proteins, is considered. Serum albumins, such as bovine surum albumine (BSA) exhibit an average length of 10 nm and width of 6 nm [138,139]. The adsorption of globular proteins, such as bovine serum albumin (BSA) onto MCM-41 matrices, which exhibits pore diameters in the 2–5 nm range, has been reported [24,140]. The protein was adsorbed on the outer surface, not inside of the pores. It has been recently reported that increased mesopore diameters of SBA-15 materials ranged from 8.2 to 11.4 nm can be achieved by employing hydrothermal treatments ranging from 1 to 7 days, respectively. BSA loading tests revealed that there was a pore size effect in terms that the larger pore diameters provide better loading. SBA-15 with pore diametes 8.2 nm, loaded 151 mg/g of BSA and pore diameters of 9.5 nm, 10.5 nm, and 11.4 nm increased loading to 234 mg/g, 242 mg/g, and 270 mg/g, respectively. Release patterns exhibited and initial burst profile where more than 90 % of the adsorbed protein was quickly released during the first 24 hours, followed by a sustained release and the complete delivery was achieved after 192 hours of assay [24].
2.4.4.2. Surface Area
Surface area critically determines the amount of drug loaded: the higher the surface area, the higher the amount of drug loaded. This was confirmed when several MCM-41 matrices with different surface areas were employed as ibuprofen delivery systems [135]. MCM-41 mesoporous materials exhibiting surface areas of 768, 936, 1087, and 1157 m2/g loaded 110, 190, 230, and 340 mg/g of ibuprofen, respectively, evidencing an increase in the drug loading with the surface area increase. Furthermore, two mesoporous materials, MCM-41 and SBA-15 which exhibit the same structure (2D-hexagonal, p6mm symmetry) but different surface areas (1157 m2/g for MCM-41 and 719 m2/g for SBA-15) were tested as alendronate delivery systems [97]. The amount of alendronate loaded into MCM-41 (139 mg/g) was higher than that into SBA-15 (83 mg/g), confirming the dependence of drug loading on surface area. The alendronate release mechanism from MCM-41 and SBA-15 is due to diffusive transport through the ordered array of mesopores. After 24h of essay the percentage of alendronate released is in the same range (≈55 %) for both host matrices. Release profiles from both mesoporous carriers (NaCl 0.9 %, pH 7.4) exhibited an initial burst effect when ca. 20 % and ca. 50 % of alendronate loaded were quickly released from MCM-41 and SBA-15, respectively. Afterwards, alendronate was released to the delivery medium in a sustained manner, following first-order kinetics for MCM-41 and zero-order or linear kinetics for SBA-15 materials.
Combining high and regular porosity of mesoporous materials with the presence of organic groups has recently been reported [141,142] The final compounds are metal-organic frameworks (MOFs) MIL (Materials Institute Lavoisier); materials with large SBET and consequently as high drug loading and controlled release. These materials are denoted are shown in Figure 22 A.
MIL-100 and MIL-101 have surface areas (SBET) 3-5 times larger than MCM-41 (3340 and 5510 m2g-1), respectively. MIL-100 is able to adsorb 350 mg g-1 IBU, and MIL-101 loads 1400 mgg-1 under the same conditions [13]. MCM-41 and MIL-100 materials showed similar
Spomenka Simovic and Dusan Losic 104
ibuprofen release kinetics, and the drug content in MIL-101 is 4 times larger than in MCM-41. High drug adsorption levels are a consequence of high surface area of the external micropores. The IBU release profiles are compared in Figure 22 B for both the MIL materials and MCM-41. As it is suggested that most of the drug is adsorbed in the outermost micropores of MIL materials and only a small amount is retained in the closed mesopore cavities, the drug release follows different delivery kinetics from that of MCM-41. Two sections can be observed in the release profiles of the MIL materials, corresponding to the release from micropores and from mesopores. In MCM-41, as the drug is essentially loaded into the mesopore channels, the release profile only shows one exponential profile. The release from MCM-41 and MIL-100 is very similar even though the total surface area is different, whereas the release for MIL-101, with more open mesopores, is faster (Figure 22).
Figure 22. a)Structures of MIL-100 and MIL-101 built up from trimers of chromium octahedra as well as 1,3,5-BTC (benzene-1,3,5-tricarboxylic acid) and 1,4-BDC (benzene-1,4-dicarboxylic acid), respectively. b) IBU release as a function of time for MIL-101, MIL-100, and MCM-41. Reproduced from reference [13] with permission.
2.4.4.3. Pore Volume
When the confinement of really large molecules is targeted, the pore volume available to host the guest molecule plays an important role in loading [143]. Mesostructured cellular foams (MCFs) have been tested as host matrices for the adsorption of several enzymes and proteins [144,145]. These matrices seem suitable to be used as delivery systems for large molecules, such as proteins. The amount of BSA loaded was higher in MCF (240 mg/g) than in SBA-15 (150 mg/g), following the same trend as pore volume, being 1.9 cm3/g and 1.1 cm3/g for MCF and SBA-15, respectively.
2.4.4.4. Surface Functionalization
The pore walls in ceramic matrices can be functionalised with a wide range of chemical species in order to modify their adsorption and release properties. The lack of order in the
Ordered Mesoporous Materials for Drug Delivery Applications 105
space configuration of the tetrahedral lattice of silica matrices results in a large number of connectivity defects, that is, not all the tetrahedrons are connected to another four tetrahedrons sharing oxygen atoms. If an oxygen atom positioned at a tetrahedron corner is not shared with a neighbouring tetrahedron, a silanol group is formed. The presence of large amounts of connectivity defects in mesoporous materials is a direct consequence of their formation mechanism. The interaction between the tensioactive agent and the silicate oligomers in dissolution takes place through the silanol groups SiOH or through the corresponding anion, SiO¯. The concentration of SiOH groups in the material after eliminating the tensioactive agent depends also on the method chosen for this removal. Usually, calcination reduces the concentration of defects, since it promotes the condensation of Si--OH groups, in particular those that share hydrogen bonds. On the other hand, the solvent extraction of the tensioactive agent does not significantly modify the amount of silanol groups. The Si--OH groups exert a remarkable influence on the properties of the material. Generally, their affinity for polar molecules increases with the silanol concentration, but these groups can also react with a large variety of chemical products yielding covalent bonds of the Si-O-R type. This fact allows them to attach or anchor different chemical species on the material surface, i.e. to functionalise their surface [134]. If the H atom in silanol is replaced by chemical species R, which can be linked to the oxygen atom by a covalent bond, a whole family of hybrid materials can be obtained. The most common cases are those in which R is an organic functional group, that is, chemical species of the type of Si-O-Si-R.
Functionalisations can be carried out using in situ [146] and ex situ [147,148] techniques. The functional groups can be attached or anchored to the scaffold of the mesoporous material during the material synthesis, in a one-pot method, but also during a later post-synthesis stage. The main difference between methods is the additional stage of the functionalising precursor. In the former the alcoxy groups are hydrolysed and condensed with the silica scaffold precursors, which are usually also silicon alkoxydes; in the latter, the condensation reaction takes place between the functionalising precursor and the silanol groups present in the pore walls. In one-pot methods the organic groups R are linked to silicon atoms in the walls and to the inner part of the silica wall; therefore the functionalisation degree is reduced. Post-synthesis methods ensure that the modifying agents are in the outer surface of the pores, leading to a larger functionalisation degree [107]. The studies reported so far indicate that the postsynthesis functionalization method (i.e. functionalization after the removal of surfactant) leads to better results than the co-condensation method [107,121]. Recently Zeng et al. introduced a controversy in this issue, stating that owing to a higher degree of order and the uniform distribution of functional groups, a better control of drug release can be obtained by using the co-condensation method, rather than postsynthesis or solvothermal processes [114, 149].
The ionic interaction between the carboxy groups in ibuprofen and the amino groups on the silica matrix allows controlled release of ibuprofen from amino-functionalized mesoporous silica [107,121,150]. Ibuprofen molecules adsorbed in MCM-41 silica with and without amino group functionalisation have been characterised by 13C NMR spectroscopy. The 13C MAS single-pulse or cross-polarisation NMR spectra, as well as the 1H MAS NMR spectra show an extremely high mobility of the ibuprofen molecules when the matrix is not modified. It suggests the absence of any interactions between the ibuprofen molecules and the silica surface, despite the presence of a COOH function. This might be explained by the association of ibuprofen molecules into cyclic hydrogen-bonded dimmers: the dimer
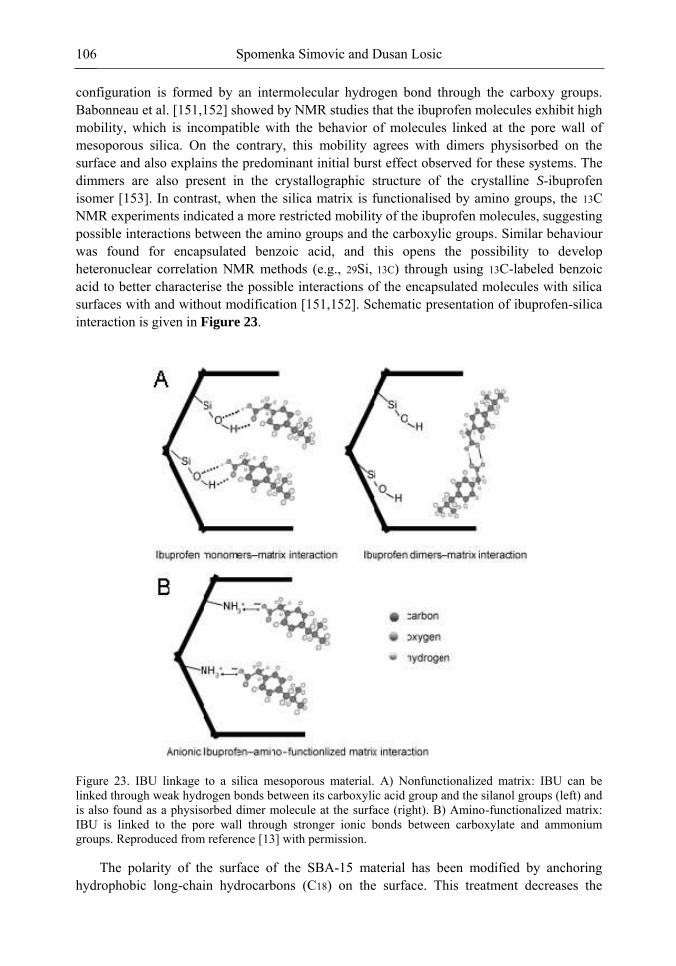
Spomenka Simovic and Dusan Losic 106
configuration is formed by an intermolecular hydrogen bond through the carboxy groups. Babonneau et al. [151,152] showed by NMR studies that the ibuprofen molecules exhibit high mobility, which is incompatible with the behavior of molecules linked at the pore wall of mesoporous silica. On the contrary, this mobility agrees with dimers physisorbed on the surface and also explains the predominant initial burst effect observed for these systems. The dimmers are also present in the crystallographic structure of the crystalline S-ibuprofen isomer [153]. In contrast, when the silica matrix is functionalised by amino groups, the 13C NMR experiments indicated a more restricted mobility of the ibuprofen molecules, suggesting possible interactions between the amino groups and the carboxylic groups. Similar behaviour was found for encapsulated benzoic acid, and this opens the possibility to develop
heteronuclear correlation NMR methods (e.g., 29Si, 13C) through using 13C-labeled benzoic acid to better characterise the possible interactions of the encapsulated molecules with silica surfaces with and without modification [151,152]. Schematic presentation of ibuprofen-silica interaction is given in Figure 23.
Figure 23. IBU linkage to a silica mesoporous material. A) Nonfunctionalized matrix: IBU can be linked through weak hydrogen bonds between its carboxylic acid group and the silanol groups (left) and is also found as a physisorbed dimer molecule at the surface (right). B) Amino-functionalized matrix: IBU is linked to the pore wall through stronger ionic bonds between carboxylate and ammonium groups. Reproduced from reference [13] with permission.
The polarity of the surface of the SBA-15 material has been modified by anchoring hydrophobic long-chain hydrocarbons (C18) on the surface. This treatment decreases the
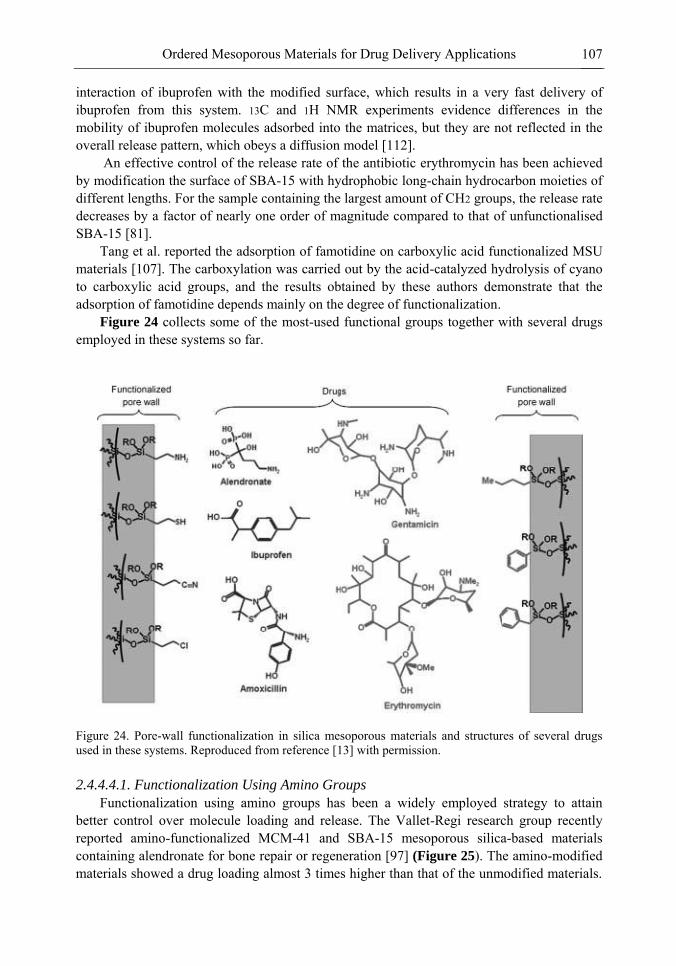
Ordered Mesoporous Materials for Drug Delivery Applications 107
interaction of ibuprofen with the modified surface, which results in a very fast delivery of ibuprofen from this system. 13C and 1H NMR experiments evidence differences in the mobility of ibuprofen molecules adsorbed into the matrices, but they are not reflected in the overall release pattern, which obeys a diffusion model [112].
An effective control of the release rate of the antibiotic erythromycin has been achieved by modification the surface of SBA-15 with hydrophobic long-chain hydrocarbon moieties of different lengths. For the sample containing the largest amount of CH2 groups, the release rate decreases by a factor of nearly one order of magnitude compared to that of unfunctionalised SBA-15 [81].
Tang et al. reported the adsorption of famotidine on carboxylic acid functionalized MSU materials [107]. The carboxylation was carried out by the acid-catalyzed hydrolysis of cyano to carboxylic acid groups, and the results obtained by these authors demonstrate that the adsorption of famotidine depends mainly on the degree of functionalization.
Figure 24 collects some of the most-used functional groups together with several drugs employed in these systems so far.
Figure 24. Pore-wall functionalization in silica mesoporous materials and structures of several drugs used in these systems. Reproduced from reference [13] with permission.
2.4.4.4.1. Functionalization Using Amino Groups
Functionalization using amino groups has been a widely employed strategy to attain better control over molecule loading and release. The Vallet-Regi research group recently reported amino-functionalized MCM-41 and SBA-15 mesoporous silica-based materials containing alendronate for bone repair or regeneration [97] (Figure 25). The amino-modified materials showed a drug loading almost 3 times higher than that of the unmodified materials.
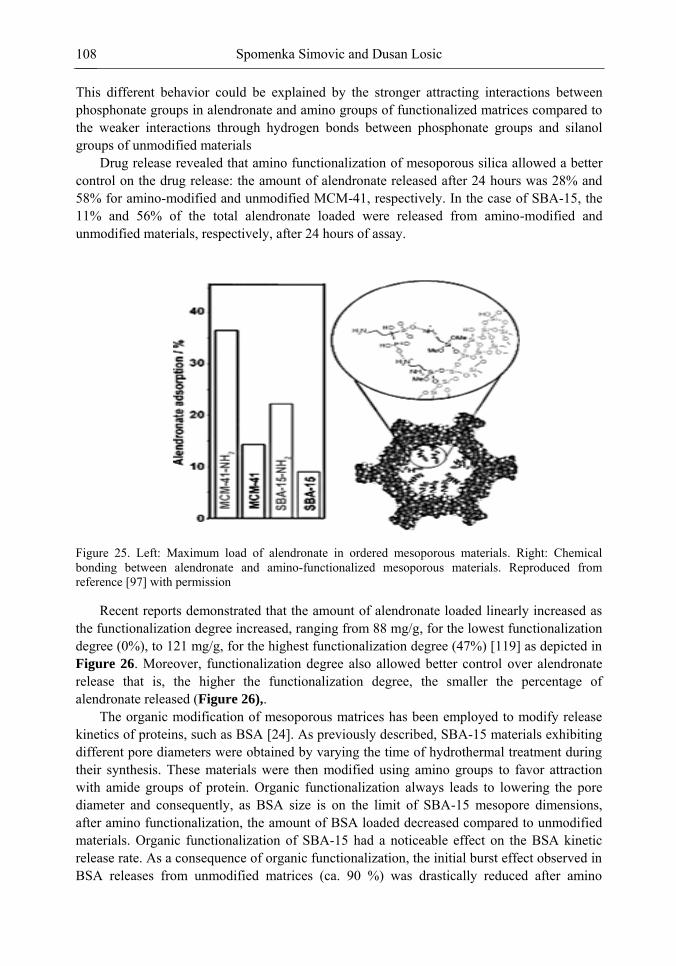
Spomenka Simovic and Dusan Losic 108
This different behavior could be explained by the stronger attracting interactions between phosphonate groups in alendronate and amino groups of functionalized matrices compared to the weaker interactions through hydrogen bonds between phosphonate groups and silanol groups of unmodified materials
Drug release revealed that amino functionalization of mesoporous silica allowed a better control on the drug release: the amount of alendronate released after 24 hours was 28% and 58% for amino-modified and unmodified MCM-41, respectively. In the case of SBA-15, the 11% and 56% of the total alendronate loaded were released from amino-modified and unmodified materials, respectively, after 24 hours of assay.
Figure 25. Left: Maximum load of alendronate in ordered mesoporous materials. Right: Chemical bonding between alendronate and amino-functionalized mesoporous materials. Reproduced from reference [97] with permission
Recent reports demonstrated that the amount of alendronate loaded linearly increased as the functionalization degree increased, ranging from 88 mg/g, for the lowest functionalization degree (0%), to 121 mg/g, for the highest functionalization degree (47%) [119] as depicted in Figure 26. Moreover, functionalization degree also allowed better control over alendronate release that is, the higher the functionalization degree, the smaller the percentage of alendronate released (Figure 26),.
The organic modification of mesoporous matrices has been employed to modify release kinetics of proteins, such as BSA [24]. As previously described, SBA-15 materials exhibiting different pore diameters were obtained by varying the time of hydrothermal treatment during their synthesis. These materials were then modified using amino groups to favor attraction with amide groups of protein. Organic functionalization always leads to lowering the pore diameter and consequently, as BSA size is on the limit of SBA-15 mesopore dimensions, after amino functionalization, the amount of BSA loaded decreased compared to unmodified materials. Organic functionalization of SBA-15 had a noticeable effect on the BSA kinetic release rate. As a consequence of organic functionalization, the initial burst effect observed in BSA releases from unmodified matrices (ca. 90 %) was drastically reduced after amino
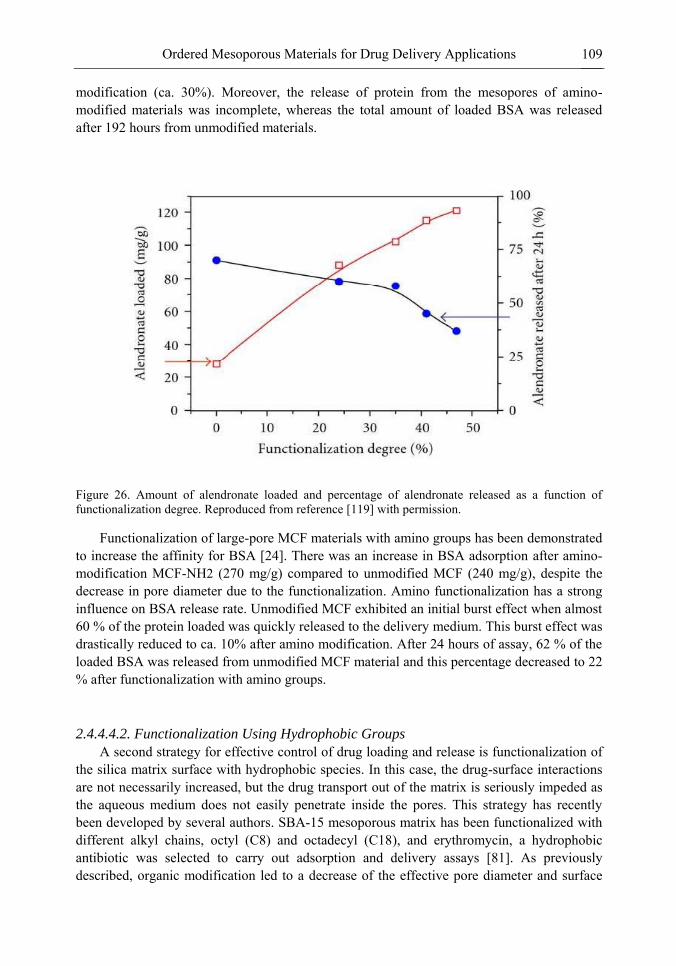
Ordered Mesoporous Materials for Drug Delivery Applications 109
modification (ca. 30%). Moreover, the release of protein from the mesopores of amino-modified materials was incomplete, whereas the total amount of loaded BSA was released after 192 hours from unmodified materials.
Figure 26. Amount of alendronate loaded and percentage of alendronate released as a function of functionalization degree. Reproduced from reference [119] with permission.
Functionalization of large-pore MCF materials with amino groups has been demonstrated to increase the affinity for BSA [24]. There was an increase in BSA adsorption after amino-modification MCF-NH2 (270 mg/g) compared to unmodified MCF (240 mg/g), despite the decrease in pore diameter due to the functionalization. Amino functionalization has a strong influence on BSA release rate. Unmodified MCF exhibited an initial burst effect when almost 60 % of the protein loaded was quickly released to the delivery medium. This burst effect was drastically reduced to ca. 10% after amino modification. After 24 hours of assay, 62 % of the loaded BSA was released from unmodified MCF material and this percentage decreased to 22 % after functionalization with amino groups.
2.4.4.4.2. Functionalization Using Hydrophobic Groups
A second strategy for effective control of drug loading and release is functionalization of the silica matrix surface with hydrophobic species. In this case, the drug-surface interactions are not necessarily increased, but the drug transport out of the matrix is seriously impeded as the aqueous medium does not easily penetrate inside the pores. This strategy has recently been developed by several authors. SBA-15 mesoporous matrix has been functionalized with different alkyl chains, octyl (C8) and octadecyl (C18), and erythromycin, a hydrophobic antibiotic was selected to carry out adsorption and delivery assays [81]. As previously described, organic modification led to a decrease of the effective pore diameter and surface
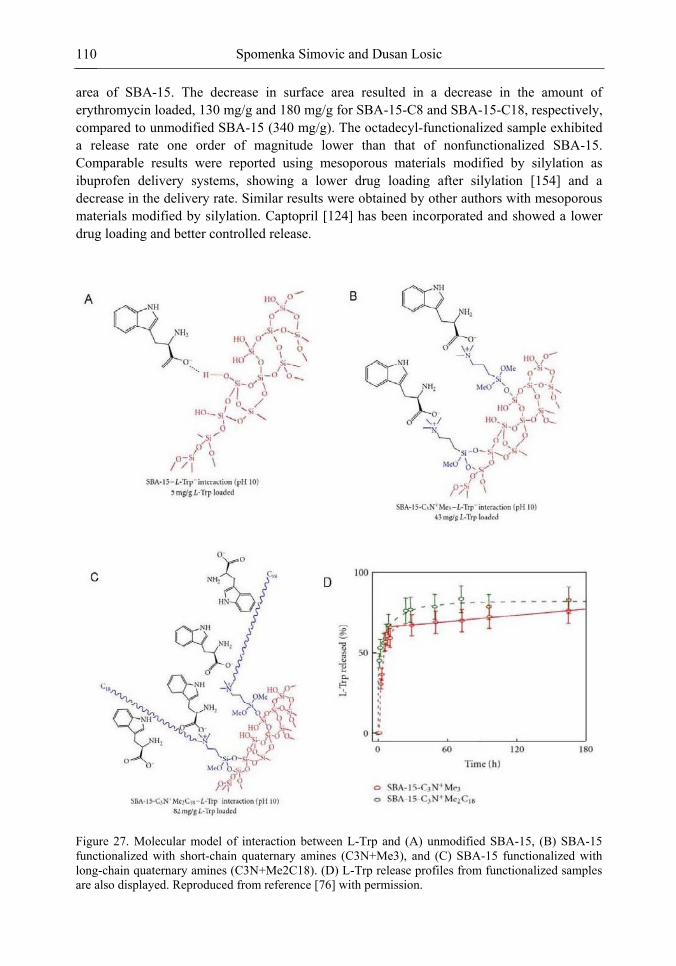
Spomenka Simovic and Dusan Losic 110
area of SBA-15. The decrease in surface area resulted in a decrease in the amount of erythromycin loaded, 130 mg/g and 180 mg/g for SBA-15-C8 and SBA-15-C18, respectively, compared to unmodified SBA-15 (340 mg/g). The octadecyl-functionalized sample exhibited a release rate one order of magnitude lower than that of nonfunctionalized SBA-15. Comparable results were reported using mesoporous materials modified by silylation as ibuprofen delivery systems, showing a lower drug loading after silylation [154] and a decrease in the delivery rate. Similar results were obtained by other authors with mesoporous materials modified by silylation. Captopril [124] has been incorporated and showed a lower drug loading and better controlled release.
Figure 27. Molecular model of interaction between L-Trp and (A) unmodified SBA-15, (B) SBA-15 functionalized with short-chain quaternary amines (C3N+Me3), and (C) SBA-15 functionalized with long-chain quaternary amines (C3N+Me2C18). (D) L-Trp release profiles from functionalized samples are also displayed. Reproduced from reference [76] with permission.
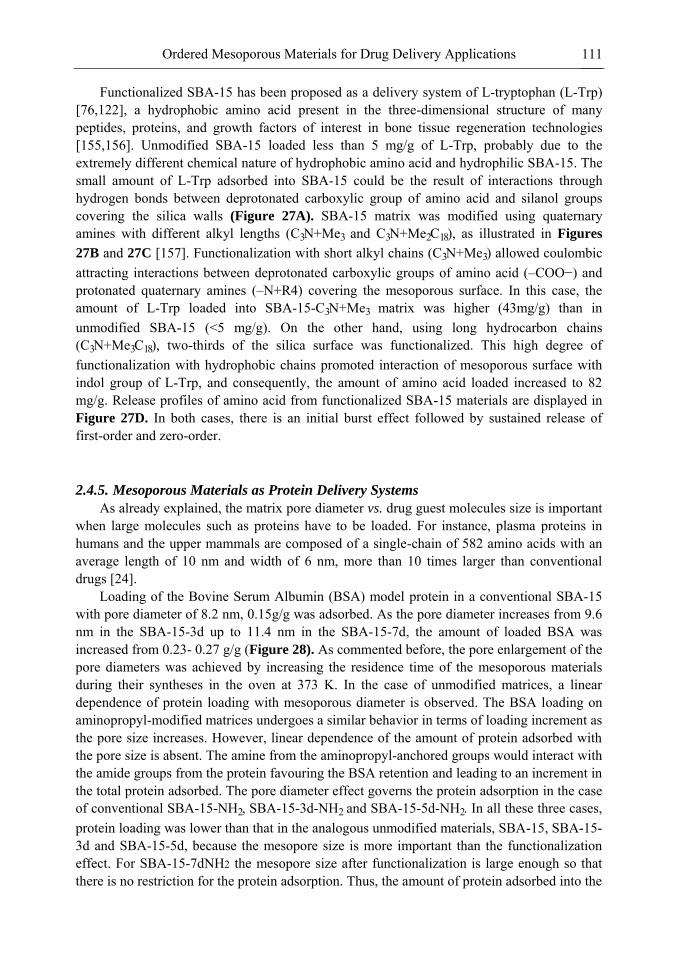
Ordered Mesoporous Materials for Drug Delivery Applications 111
Functionalized SBA-15 has been proposed as a delivery system of L-tryptophan (L-Trp) [76,122], a hydrophobic amino acid present in the three-dimensional structure of many peptides, proteins, and growth factors of interest in bone tissue regeneration technologies [155,156]. Unmodified SBA-15 loaded less than 5 mg/g of L-Trp, probably due to the extremely different chemical nature of hydrophobic amino acid and hydrophilic SBA-15. The small amount of L-Trp adsorbed into SBA-15 could be the result of interactions through hydrogen bonds between deprotonated carboxylic group of amino acid and silanol groups covering the silica walls (Figure 27A). SBA-15 matrix was modified using quaternary amines with different alkyl lengths (C3N+Me3 and C3N+Me2C18), as illustrated in Figures
27B and 27C [157]. Functionalization with short alkyl chains (C3N+Me3) allowed coulombic attracting interactions between deprotonated carboxylic groups of amino acid (–COO−) and
protonated quaternary amines (–N+R4) covering the mesoporous surface. In this case, the amount of L-Trp loaded into SBA-15-C3N+Me3 matrix was higher (43mg/g) than in unmodified SBA-15 (<5 mg/g). On the other hand, using long hydrocarbon chains (C3N+Me3C18), two-thirds of the silica surface was functionalized. This high degree of functionalization with hydrophobic chains promoted interaction of mesoporous surface with indol group of L-Trp, and consequently, the amount of amino acid loaded increased to 82 mg/g. Release profiles of amino acid from functionalized SBA-15 materials are displayed in Figure 27D. In both cases, there is an initial burst effect followed by sustained release of first-order and zero-order.
2.4.5. Mesoporous Materials as Protein Delivery Systems
As already explained, the matrix pore diameter vs. drug guest molecules size is important when large molecules such as proteins have to be loaded. For instance, plasma proteins in humans and the upper mammals are composed of a single-chain of 582 amino acids with an average length of 10 nm and width of 6 nm, more than 10 times larger than conventional drugs [24].
Loading of the Bovine Serum Albumin (BSA) model protein in a conventional SBA-15 with pore diameter of 8.2 nm, 0.15g/g was adsorbed. As the pore diameter increases from 9.6 nm in the SBA-15-3d up to 11.4 nm in the SBA-15-7d, the amount of loaded BSA was increased from 0.23- 0.27 g/g (Figure 28). As commented before, the pore enlargement of the pore diameters was achieved by increasing the residence time of the mesoporous materials during their syntheses in the oven at 373 K. In the case of unmodified matrices, a linear dependence of protein loading with mesoporous diameter is observed. The BSA loading on aminopropyl-modified matrices undergoes a similar behavior in terms of loading increment as the pore size increases. However, linear dependence of the amount of protein adsorbed with the pore size is absent. The amine from the aminopropyl-anchored groups would interact with the amide groups from the protein favouring the BSA retention and leading to an increment in the total protein adsorbed. The pore diameter effect governs the protein adsorption in the case of conventional SBA-15-NH2, SBA-15-3d-NH2 and SBA-15-5d-NH2. In all these three cases, protein loading was lower than that in the analogous unmodified materials, SBA-15, SBA-15-3d and SBA-15-5d, because the mesopore size is more important than the functionalization effect. For SBA-15-7dNH2 the mesopore size after functionalization is large enough so that there is no restriction for the protein adsorption. Thus, the amount of protein adsorbed into the
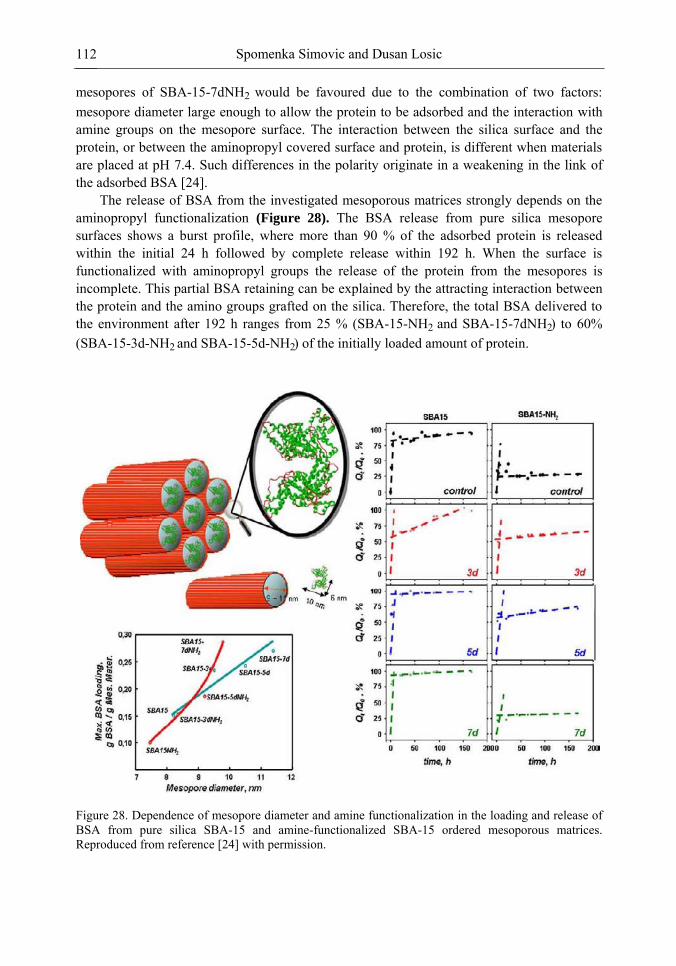
Spomenka Simovic and Dusan Losic 112
mesopores of SBA-15-7dNH2 would be favoured due to the combination of two factors: mesopore diameter large enough to allow the protein to be adsorbed and the interaction with amine groups on the mesopore surface. The interaction between the silica surface and the protein, or between the aminopropyl covered surface and protein, is different when materials are placed at pH 7.4. Such differences in the polarity originate in a weakening in the link of the adsorbed BSA [24].
The release of BSA from the investigated mesoporous matrices strongly depends on the aminopropyl functionalization (Figure 28). The BSA release from pure silica mesopore surfaces shows a burst profile, where more than 90 % of the adsorbed protein is released within the initial 24 h followed by complete release within 192 h. When the surface is functionalized with aminopropyl groups the release of the protein from the mesopores is incomplete. This partial BSA retaining can be explained by the attracting interaction between the protein and the amino groups grafted on the silica. Therefore, the total BSA delivered to the environment after 192 h ranges from 25 % (SBA-15-NH2 and SBA-15-7dNH2) to 60% (SBA-15-3d-NH2 and SBA-15-5d-NH2) of the initially loaded amount of protein.
Figure 28. Dependence of mesopore diameter and amine functionalization in the loading and release of BSA from pure silica SBA-15 and amine-functionalized SBA-15 ordered mesoporous matrices. Reproduced from reference [24] with permission.
Ordered Mesoporous Materials for Drug Delivery Applications 113
2.4.6. Stimuli-Responsive Mesoporous Silica Systems
In the conventional mesoporous systems described above the release of drug molecules is a diffusion process [13].
In recent years, several ordered mesoporous materials have been developed with stimuli-responsive ability. For example, Xiao and co-workers designed pH-responsive carriers in which polycations are grafted to anionic, carboxylic acid modified SBA-15 by ionic interactions [113] (Figure 29). When the ionized carboxylic acid groups are protonated due to a change in pH, the polycations are detached from the surface and the drug is released.
Figure 29. pH-responsive storage-release drug-delivery system based on the interaction between negative carboxylic acid modified SBA-15 silica rods with polycations (PDDA). Reproduced from the reference [13] with permission.
Thermoresponsive hybrid mesoporous materials consist of silica and thermally active polymers, such as poly (N-isopropylacryl amide) [158]. The sponge phases are formed by self-assembly during the formation of mesoporous inorganic materials. Drugs can be loaded into the spongelike mesoporous domains, and drug release is controlled by cyclic thermally induced polymer shrinkage.
Light–responsive delivery systems based on mesoporous silica have been reported by several authors. Lin et al. have modified the pore surface with photosensitive organic groups, so that molecules are adsorbed onto pore walls as a function of their fluorescence characteristics [159]. Fujiwara and co-workers have developed a light-sensitive system based on pore-entrance modification with coumarin group that undergo reversible dimerization upon irradiation with UV light at wavelengths longer than 310 nm and return to the monomer form by subsequent irradiation at shorter wavelengths (ca. 250 nm).
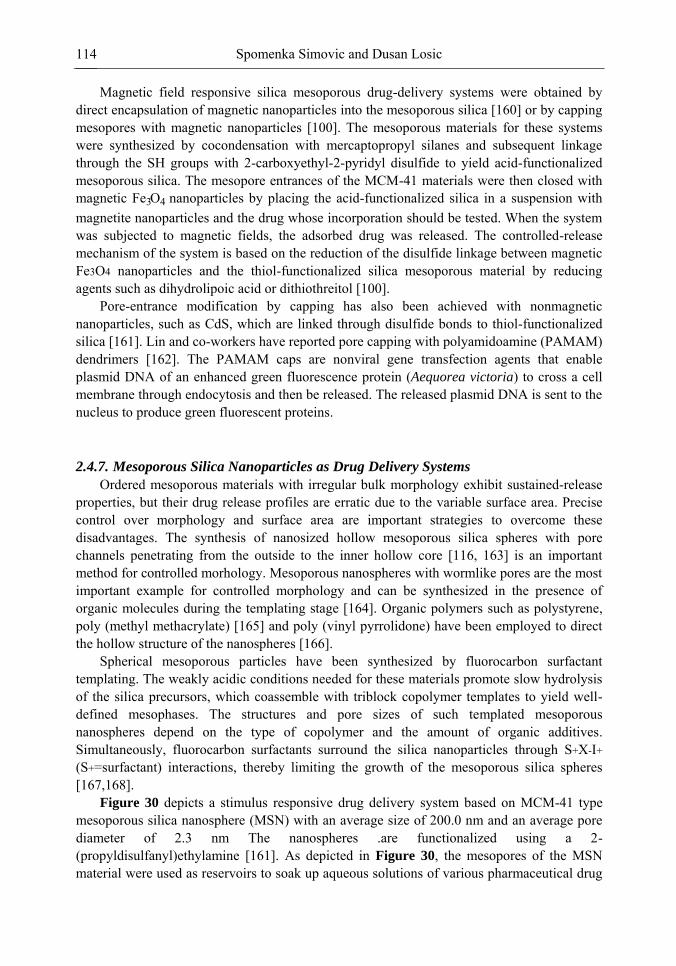
Spomenka Simovic and Dusan Losic 114
Magnetic field responsive silica mesoporous drug-delivery systems were obtained by direct encapsulation of magnetic nanoparticles into the mesoporous silica [160] or by capping mesopores with magnetic nanoparticles [100]. The mesoporous materials for these systems were synthesized by cocondensation with mercaptopropyl silanes and subsequent linkage through the SH groups with 2-carboxyethyl-2-pyridyl disulfide to yield acid-functionalized mesoporous silica. The mesopore entrances of the MCM-41 materials were then closed with magnetic Fe3O4 nanoparticles by placing the acid-functionalized silica in a suspension with magnetite nanoparticles and the drug whose incorporation should be tested. When the system was subjected to magnetic fields, the adsorbed drug was released. The controlled-release mechanism of the system is based on the reduction of the disulfide linkage between magnetic Fe3O4 nanoparticles and the thiol-functionalized silica mesoporous material by reducing agents such as dihydrolipoic acid or dithiothreitol [100].
Pore-entrance modification by capping has also been achieved with nonmagnetic nanoparticles, such as CdS, which are linked through disulfide bonds to thiol-functionalized silica [161]. Lin and co-workers have reported pore capping with polyamidoamine (PAMAM) dendrimers [162]. The PAMAM caps are nonviral gene transfection agents that enable plasmid DNA of an enhanced green fluorescence protein (Aequorea victoria) to cross a cell membrane through endocytosis and then be released. The released plasmid DNA is sent to the nucleus to produce green fluorescent proteins.
2.4.7. Mesoporous Silica Nanoparticles as Drug Delivery Systems
Ordered mesoporous materials with irregular bulk morphology exhibit sustained-release properties, but their drug release profiles are erratic due to the variable surface area. Precise control over morphology and surface area are important strategies to overcome these disadvantages. The synthesis of nanosized hollow mesoporous silica spheres with pore channels penetrating from the outside to the inner hollow core [116, 163] is an important method for controlled morhology. Mesoporous nanospheres with wormlike pores are the most important example for controlled morphology and can be synthesized in the presence of organic molecules during the templating stage [164]. Organic polymers such as polystyrene, poly (methyl methacrylate) [165] and poly (vinyl pyrrolidone) have been employed to direct the hollow structure of the nanospheres [166].
Spherical mesoporous particles have been synthesized by fluorocarbon surfactant templating. The weakly acidic conditions needed for these materials promote slow hydrolysis of the silica precursors, which coassemble with triblock copolymer templates to yield well-defined mesophases. The structures and pore sizes of such templated mesoporous nanospheres depend on the type of copolymer and the amount of organic additives. Simultaneously, fluorocarbon surfactants surround the silica nanoparticles through S+X-I+ (S+=surfactant) interactions, thereby limiting the growth of the mesoporous silica spheres [167,168].
Figure 30 depicts a stimulus responsive drug delivery system based on MCM-41 type mesoporous silica nanosphere (MSN) with an average size of 200.0 nm and an average pore diameter of 2.3 nm The nanospheres .are functionalized using a 2-(propyldisulfanyl)ethylamine [161]. As depicted in Figure 30, the mesopores of the MSN material were used as reservoirs to soak up aqueous solutions of various pharmaceutical drug
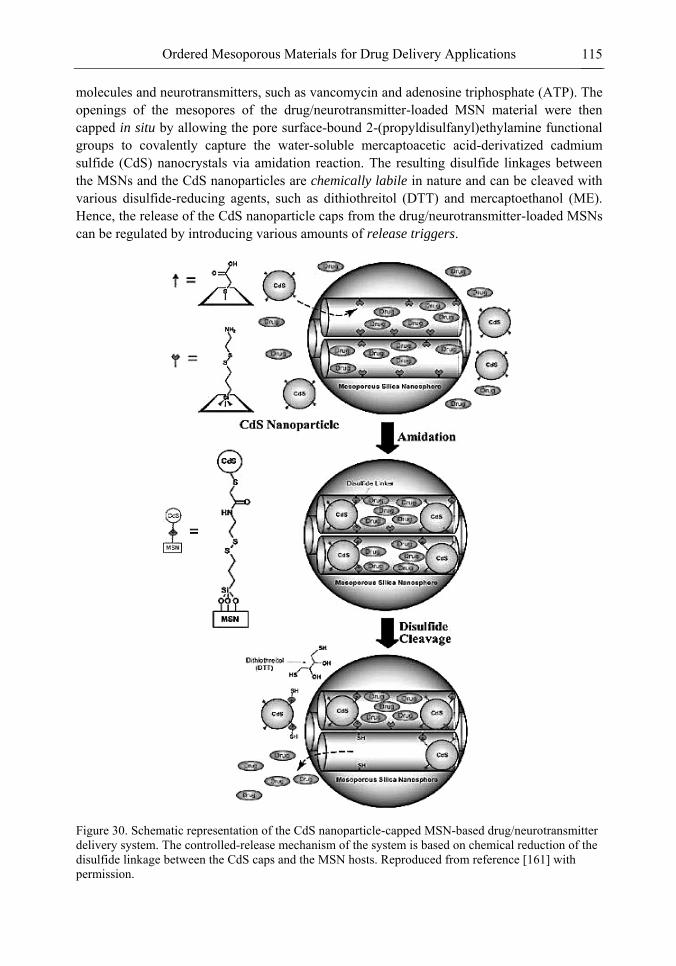
Ordered Mesoporous Materials for Drug Delivery Applications 115
molecules and neurotransmitters, such as vancomycin and adenosine triphosphate (ATP). The openings of the mesopores of the drug/neurotransmitter-loaded MSN material were then capped in situ by allowing the pore surface-bound 2-(propyldisulfanyl)ethylamine functional groups to covalently capture the water-soluble mercaptoacetic acid-derivatized cadmium sulfide (CdS) nanocrystals via amidation reaction. The resulting disulfide linkages between the MSNs and the CdS nanoparticles are chemically labile in nature and can be cleaved with various disulfide-reducing agents, such as dithiothreitol (DTT) and mercaptoethanol (ME). Hence, the release of the CdS nanoparticle caps from the drug/neurotransmitter-loaded MSNs can be regulated by introducing various amounts of release triggers.
Figure 30. Schematic representation of the CdS nanoparticle-capped MSN-based drug/neurotransmitter delivery system. The controlled-release mechanism of the system is based on chemical reduction of the disulfide linkage between the CdS caps and the MSN hosts. Reproduced from reference [161] with permission.
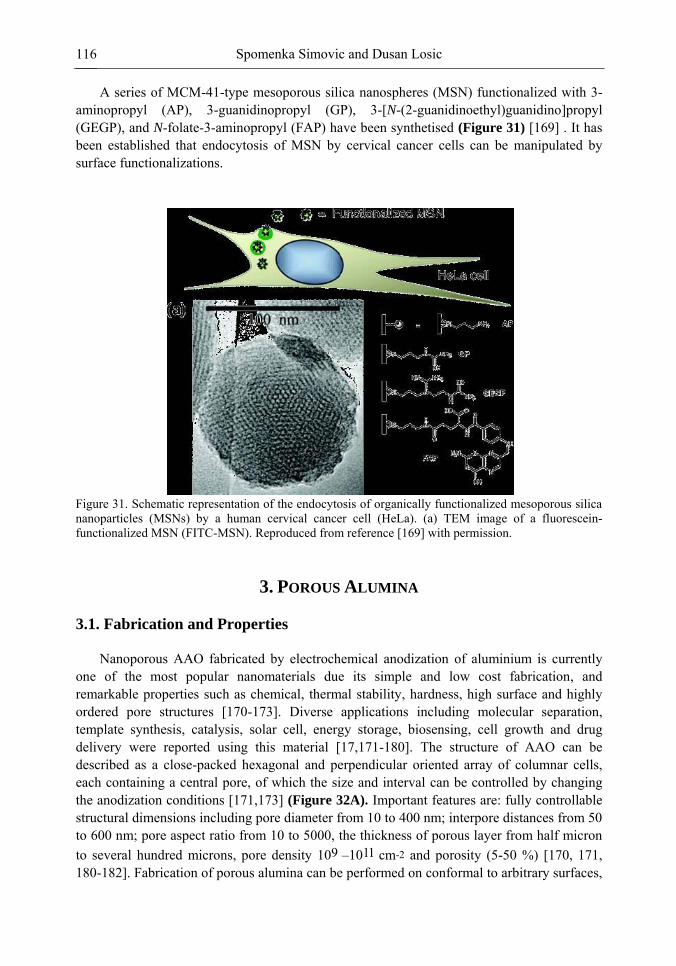
Spomenka Simovic and Dusan Losic 116
A series of MCM-41-type mesoporous silica nanospheres (MSN) functionalized with 3-aminopropyl (AP), 3-guanidinopropyl (GP), 3-[N-(2-guanidinoethyl)guanidino]propyl (GEGP), and N-folate-3-aminopropyl (FAP) have been synthetised (Figure 31) [169] . It has been established that endocytosis of MSN by cervical cancer cells can be manipulated by surface functionalizations.
Figure 31. Schematic representation of the endocytosis of organically functionalized mesoporous silica nanoparticles (MSNs) by a human cervical cancer cell (HeLa). (a) TEM image of a fluorescein-functionalized MSN (FITC-MSN). Reproduced from reference [169] with permission.
3. POROUS ALUMINA
3.1. Fabrication and Properties Nanoporous AAO fabricated by electrochemical anodization of aluminium is currently
one of the most popular nanomaterials due its simple and low cost fabrication, and remarkable properties such as chemical, thermal stability, hardness, high surface and highly ordered pore structures [170-173]. Diverse applications including molecular separation, template synthesis, catalysis, solar cell, energy storage, biosensing, cell growth and drug delivery were reported using this material [17,171-180]. The structure of AAO can be described as a close-packed hexagonal and perpendicular oriented array of columnar cells, each containing a central pore, of which the size and interval can be controlled by changing the anodization conditions [171,173] (Figure 32A). Important features are: fully controllable structural dimensions including pore diameter from 10 to 400 nm; interpore distances from 50 to 600 nm; pore aspect ratio from 10 to 5000, the thickness of porous layer from half micron to several hundred microns, pore density 109 –1011 cm-2 and porosity (5-50 %) [170, 171, 180-182]. Fabrication of porous alumina can be performed on conformal to arbitrary surfaces,
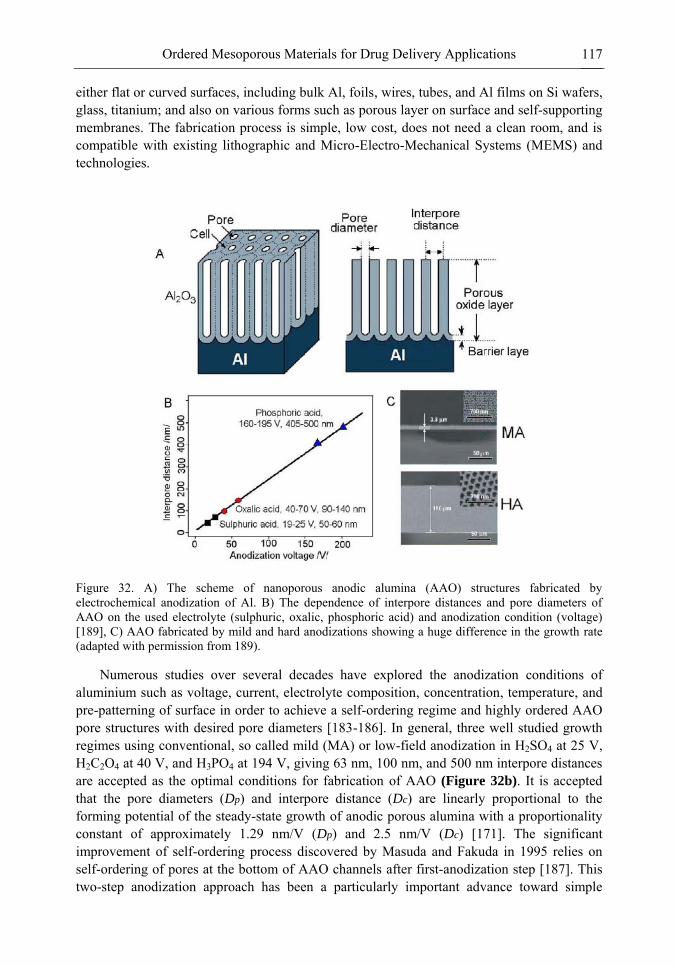
Ordered Mesoporous Materials for Drug Delivery Applications 117
either flat or curved surfaces, including bulk Al, foils, wires, tubes, and Al films on Si wafers, glass, titanium; and also on various forms such as porous layer on surface and self-supporting membranes. The fabrication process is simple, low cost, does not need a clean room, and is compatible with existing lithographic and Micro-Electro-Mechanical Systems (MEMS) and technologies.
Figure 32. A) The scheme of nanoporous anodic alumina (AAO) structures fabricated by electrochemical anodization of Al. B) The dependence of interpore distances and pore diameters of AAO on the used electrolyte (sulphuric, oxalic, phosphoric acid) and anodization condition (voltage) [189], C) AAO fabricated by mild and hard anodizations showing a huge difference in the growth rate (adapted with permission from 189).
Numerous studies over several decades have explored the anodization conditions of aluminium such as voltage, current, electrolyte composition, concentration, temperature, and pre-patterning of surface in order to achieve a self-ordering regime and highly ordered AAO pore structures with desired pore diameters [183-186]. In general, three well studied growth regimes using conventional, so called mild (MA) or low-field anodization in H2SO4 at 25 V, H2C2O4 at 40 V, and H3PO4 at 194 V, giving 63 nm, 100 nm, and 500 nm interpore distances are accepted as the optimal conditions for fabrication of AAO (Figure 32b). It is accepted that the pore diameters (Dp) and interpore distance (Dc) are linearly proportional to the forming potential of the steady-state growth of anodic porous alumina with a proportionality constant of approximately 1.29 nm/V (Dp) and 2.5 nm/V (Dc) [171]. The significant improvement of self-ordering process discovered by Masuda and Fakuda in 1995 relies on self-ordering of pores at the bottom of AAO channels after first-anodization step [187]. This two-step anodization approach has been a particularly important advance toward simple
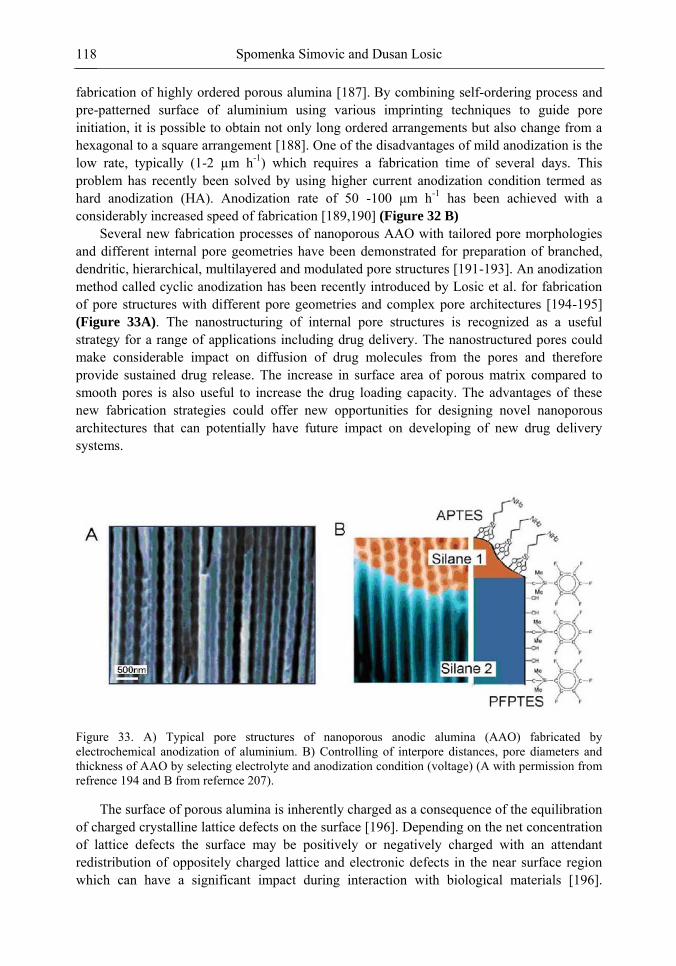
Spomenka Simovic and Dusan Losic 118
fabrication of highly ordered porous alumina [187]. By combining self-ordering process and pre-patterned surface of aluminium using various imprinting techniques to guide pore initiation, it is possible to obtain not only long ordered arrangements but also change from a hexagonal to a square arrangement [188]. One of the disadvantages of mild anodization is the low rate, typically (1-2 µm h-1) which requires a fabrication time of several days. This problem has recently been solved by using higher current anodization condition termed as hard anodization (HA). Anodization rate of 50 -100 μm h
-1 has been achieved with a considerably increased speed of fabrication [189,190] (Figure 32 B)
Several new fabrication processes of nanoporous AAO with tailored pore morphologies and different internal pore geometries have been demonstrated for preparation of branched, dendritic, hierarchical, multilayered and modulated pore structures [191-193]. An anodization method called cyclic anodization has been recently introduced by Losic et al. for fabrication of pore structures with different pore geometries and complex pore architectures [194-195] (Figure 33A). The nanostructuring of internal pore structures is recognized as a useful strategy for a range of applications including drug delivery. The nanostructured pores could make considerable impact on diffusion of drug molecules from the pores and therefore provide sustained drug release. The increase in surface area of porous matrix compared to smooth pores is also useful to increase the drug loading capacity. The advantages of these new fabrication strategies could offer new opportunities for designing novel nanoporous architectures that can potentially have future impact on developing of new drug delivery systems.
Figure 33. A) Typical pore structures of nanoporous anodic alumina (AAO) fabricated by electrochemical anodization of aluminium. B) Controlling of interpore distances, pore diameters and thickness of AAO by selecting electrolyte and anodization condition (voltage) (A with permission from refrence 194 and B from refernce 207).
The surface of porous alumina is inherently charged as a consequence of the equilibration of charged crystalline lattice defects on the surface [196]. Depending on the net concentration of lattice defects the surface may be positively or negatively charged with an attendant redistribution of oppositely charged lattice and electronic defects in the near surface region which can have a significant impact during interaction with biological materials [196].
Ordered Mesoporous Materials for Drug Delivery Applications 119
Therefore it is highly desirable to modify the surface of nanoporous AAO and improve biocompatibility for applications that involve interaction with biomolecules and cells such as protein separation, imunnoisolations, cell adsorption/growth, tissue engineering and drug delivery. Various solid and soft surface modification techniques of AAO have been explored in the past, including atomic layer deposition (ALD), chemical vapour deposition (CVD), thermal vapour metal deposition, chemical, electrochemical deposition, sol-gel, layer by layer deposition, and plasma polymerization [197-200]. A range of surface funtionalizations using organic molecules such as silanes, poltyhiols, n-alkanoic acids, polyelectrolyte layers, poly( ethylene glycol) (PEG), chitosan, poly(sodium styrenesulfonate) (PSS), lipid bilayers and plasma polymers have been reported [199-206]. The fabrication of AAO with layered surface chemistry and multifunctional and tailorable properties, inside of pores is a particularly important accomplishment toward designing AAO with controlled drug delivery properties [207]. (Figure 33B) Unlike with unmodified pore surfaces, drug molecules can be covalently immobilized in the modified pores or trapped between functional layers. Furthermore drug release can be controlled by triggering external stimulus such as pH, UV or temperature. These studies suggest that surface modification can be used as a promising strategy to improve the loading and release properties of AAO with good prospective to adjust their properties for specific drug delivery applications [208].
3.2. BIOCOMPATIBILITY Biocompatibility is the prerequisite for application of new biomaterials and it is defined
in terms of cellular response and tissue integration of implantable biomaterials. The bioceramic alumina is proven as biocompatible for implants in orthopaedic proteases and dental material, and consequently widely used clinically for these purposes [209]. Main biocompatibility studies were performed on nanoporous AAO related to their applications for orthopaedic and blood (coronary) implants and immunoissolation.
It is well established that surface composition, surface energy, surface roughness and surface topography of nanoporous alumina (and biomaterials in general) affects biocompatibility, i.e. cellular response and tissue integration [210]. However, the influence of surface micro and nano topography on osteogenesis is not well understood or even controversial. A major challenge in orthopedic biomaterials research is to design surfaces that will promote in vitro and in vivo osteogenesis. Efforts to use smooth surfaced alumina have been widely reported, but recent studies have moved towards nanostructured alumina which shows better bone in-growth [209-213]. The use of nanostructured biomaterials in bone engineering is biologically inspired. Bone is a naturally occurring porous ceramic material. Human bone is composed of nanosized organic and mineral phases that form a large macrostructure [210]. Proteins in extracellular bone matrix and calcium phosphate, important constituents of bone matrix, are nanostructured. The porosities in human bone are predominantly in the range 1-100 μm. The canaliculi and vasculature channels are within diameter range 1-5 μm. Osteocyte lacunae and Volksmann‘s canals are typically 5-15 μm in
diameter, and the larger Haversian canals are within the diameter range 50-100 μm. Osteoblast response to alumina surfaces has been widely investigated. Earlier studies
using oxide ceramics showed that a porous surface with pore diameter of ~ 100 μm is optimal
Spomenka Simovic and Dusan Losic 120
for bone in-growth to maintain blood supply in the connective tissues. However, recent studies using nanoporous alumina have revealed that much smaller pores of AAO allow bone in-growth [209-215]..
Takaok et al., 1996 [216] compared osteogenic response in porous alumina (pore size 200 μm) obtained by sintering and hydroxyapatite coating by grafting rat bone marrow cells with implants subcutaneously. The bone was formed only in the presence of marrow cells. Fibrous tissue was noticed between de novo bone and implant surface. Alkaline phosphatise activity and protein content were three times higher in hydroxyapatite coated implants. Bose et al. [217] studied porous alumina scaffolds (pore size 150-250 μm, coated by hydroxyapatite)
obtained by fused deposition modelling. In vitro tests showed that both uncoated and coated scaffolds promote proliferation of rat pituitary tumor cells and human osteosarcoma cells. One group of researchers found no influence of pore size 150-480 μm (pores were created by
fused deposition) on osteoblast proliferation. Osteoblasts cultured on alumina with pore sizes ranging up to 2 μm showed normal growth pattern and phenotype [213].These earlier works using oxide ceramics showed that a porous surface with pore diameter of ~ 100 μm is
required for bone in-growth. Minimum pore size of 100 μm was regarded as necessary for
tissue in-growth to maintaining blood supply in the connective tissues. The implant serves as a structural bridge or scaffold for bone formation as the bone cells grow within the interconnected pore channels.
However, recent studies using nanoporous alumina have revealed that much smaller pores of AAO allow bone in-growth [209-213,214,215,218]. Study of osteoblast response to nanoporous AAO membranes with the pore diameters of 30 nm to 80 nm confirm that extending growth of osteoblasts into the nanopores which produced active matrix in the form of fibrous extensions that contain calcium and phosphorus, typical elements of the bone matrix SEM images showed that the osteoblasts were extending growth processes into the nanopores; cells showed a spherical morphology after 1 day, and after 2 days spherical morphology was lost. By 4 days osteoblasts showed active matrix production in the form of fibrous extensions, i.e. normal phenotype and morphology. The lengths of these bundles were many times greater than the cell diameters [214]. Similar conclusion is reached by Popat et al. who reported that nanoporous AAO membranes showed significantly improved osteoblast adhesion and proliferation in comparison with amorphous alumina, aluminium and glass [209]. In this case, a nanoporous surface is revealed as a framework in which osteoblasts synthetise new bone. The authors investigated osteoblast adhesion after one day and proliferation on anodised alumina for up to 4 weeks. The results from nanoporous alumina membranes were compared with those of amorphous alumina. aluminium, commercially available ANOPORE and glass. Nanoporous alumina membranes showed improved short-term osteoblast adhesion and proliferation compared to other surfaces. Cells cultured on nanoporous alumina membranes showed higher protein content and more extracellular matrix, indicating significantly improved performance.
Figure 34A shows the cell count on various surfaces obtained by a hemacytometer. It can be seen that nanoporous alumina membranes supported the highest osteoblast adhesion compared to all other surfaces. As expected, latex, the negative control, showed the least adhesion since it is known to be incompatible with biological systems. Aluminum showed similar adhesion to that of glass, the control, suggesting that the material supports cell growth and does not negatively affect cell viability. Figure 34B shows the results of MTT assay which further support the cell adhesion results.
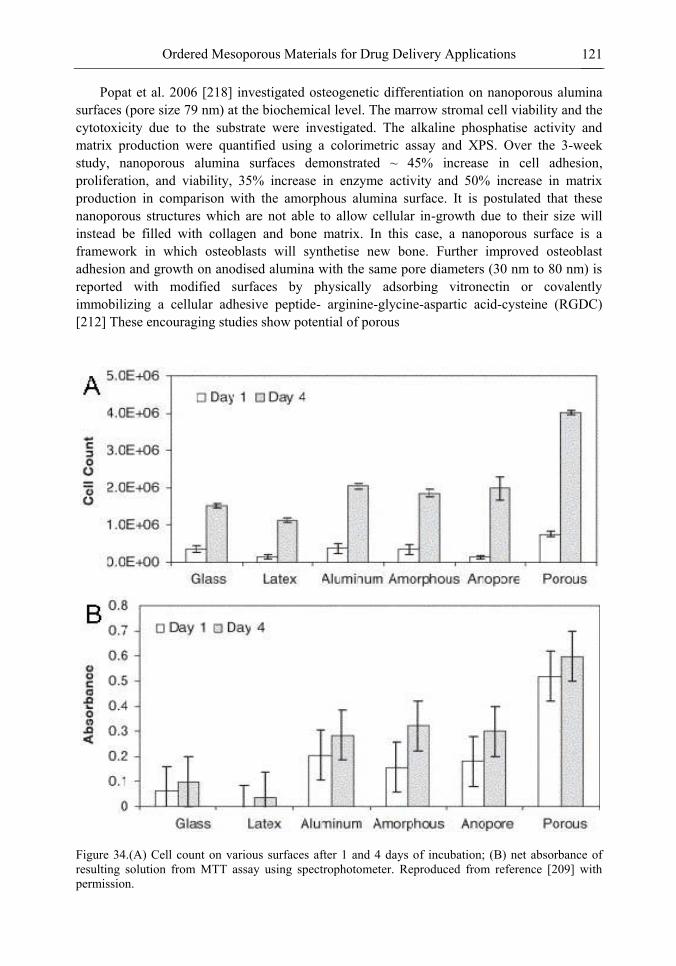
Ordered Mesoporous Materials for Drug Delivery Applications 121
Popat et al. 2006 [218] investigated osteogenetic differentiation on nanoporous alumina surfaces (pore size 79 nm) at the biochemical level. The marrow stromal cell viability and the cytotoxicity due to the substrate were investigated. The alkaline phosphatise activity and matrix production were quantified using a colorimetric assay and XPS. Over the 3-week study, nanoporous alumina surfaces demonstrated ~ 45% increase in cell adhesion, proliferation, and viability, 35% increase in enzyme activity and 50% increase in matrix production in comparison with the amorphous alumina surface. It is postulated that these nanoporous structures which are not able to allow cellular in-growth due to their size will instead be filled with collagen and bone matrix. In this case, a nanoporous surface is a framework in which osteoblasts will synthetise new bone. Further improved osteoblast adhesion and growth on anodised alumina with the same pore diameters (30 nm to 80 nm) is reported with modified surfaces by physically adsorbing vitronectin or covalently immobilizing a cellular adhesive peptide- arginine-glycine-aspartic acid-cysteine (RGDC) [212] These encouraging studies show potential of porous
Figure 34.(A) Cell count on various surfaces after 1 and 4 days of incubation; (B) net absorbance of resulting solution from MTT assay using spectrophotometer. Reproduced from reference [209] with permission.
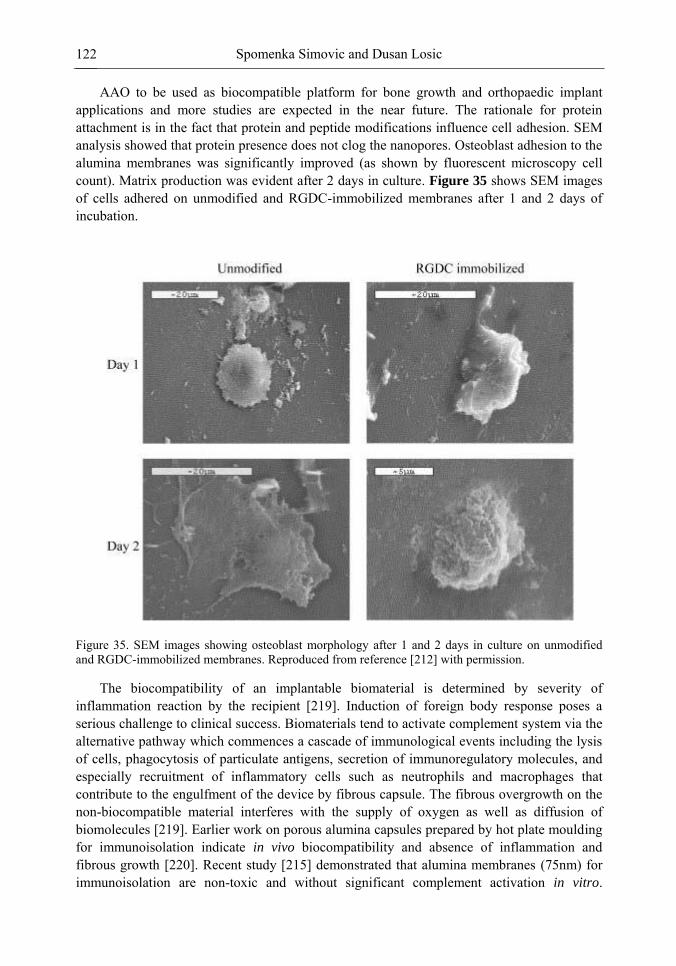
Spomenka Simovic and Dusan Losic 122
AAO to be used as biocompatible platform for bone growth and orthopaedic implant applications and more studies are expected in the near future. The rationale for protein attachment is in the fact that protein and peptide modifications influence cell adhesion. SEM analysis showed that protein presence does not clog the nanopores. Osteoblast adhesion to the alumina membranes was significantly improved (as shown by fluorescent microscopy cell count). Matrix production was evident after 2 days in culture. Figure 35 shows SEM images of cells adhered on unmodified and RGDC-immobilized membranes after 1 and 2 days of incubation.
Figure 35. SEM images showing osteoblast morphology after 1 and 2 days in culture on unmodified and RGDC-immobilized membranes. Reproduced from reference [212] with permission.
The biocompatibility of an implantable biomaterial is determined by severity of inflammation reaction by the recipient [219]. Induction of foreign body response poses a serious challenge to clinical success. Biomaterials tend to activate complement system via the alternative pathway which commences a cascade of immunological events including the lysis of cells, phagocytosis of particulate antigens, secretion of immunoregulatory molecules, and especially recruitment of inflammatory cells such as neutrophils and macrophages that contribute to the engulfment of the device by fibrous capsule. The fibrous overgrowth on the non-biocompatible material interferes with the supply of oxygen as well as diffusion of biomolecules [219]. Earlier work on porous alumina capsules prepared by hot plate moulding for immunoisolation indicate in vivo biocompatibility and absence of inflammation and fibrous growth [220]. Recent study [215] demonstrated that alumina membranes (75nm) for immunoisolation are non-toxic and without significant complement activation in vitro.
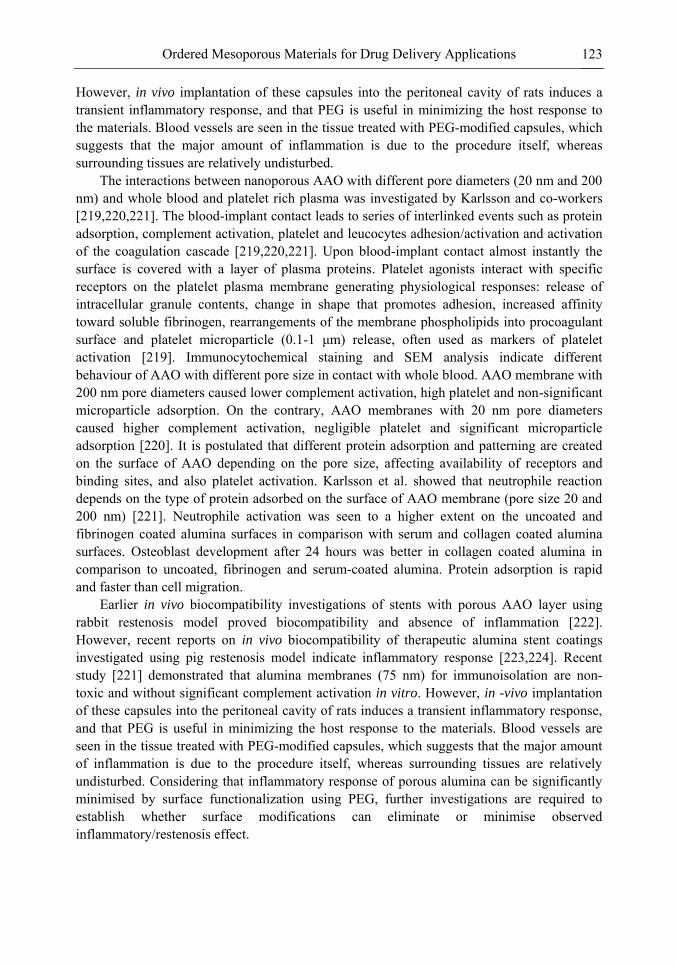
Ordered Mesoporous Materials for Drug Delivery Applications 123
However, in vivo implantation of these capsules into the peritoneal cavity of rats induces a transient inflammatory response, and that PEG is useful in minimizing the host response to the materials. Blood vessels are seen in the tissue treated with PEG-modified capsules, which suggests that the major amount of inflammation is due to the procedure itself, whereas surrounding tissues are relatively undisturbed.
The interactions between nanoporous AAO with different pore diameters (20 nm and 200 nm) and whole blood and platelet rich plasma was investigated by Karlsson and co-workers [219,220,221]. The blood-implant contact leads to series of interlinked events such as protein adsorption, complement activation, platelet and leucocytes adhesion/activation and activation of the coagulation cascade [219,220,221]. Upon blood-implant contact almost instantly the surface is covered with a layer of plasma proteins. Platelet agonists interact with specific receptors on the platelet plasma membrane generating physiological responses: release of intracellular granule contents, change in shape that promotes adhesion, increased affinity toward soluble fibrinogen, rearrangements of the membrane phospholipids into procoagulant surface and platelet microparticle (0.1-1 μm) release, often used as markers of platelet
activation [219]. Immunocytochemical staining and SEM analysis indicate different behaviour of AAO with different pore size in contact with whole blood. AAO membrane with 200 nm pore diameters caused lower complement activation, high platelet and non-significant microparticle adsorption. On the contrary, AAO membranes with 20 nm pore diameters caused higher complement activation, negligible platelet and significant microparticle adsorption [220]. It is postulated that different protein adsorption and patterning are created on the surface of AAO depending on the pore size, affecting availability of receptors and binding sites, and also platelet activation. Karlsson et al. showed that neutrophile reaction depends on the type of protein adsorbed on the surface of AAO membrane (pore size 20 and 200 nm) [221]. Neutrophile activation was seen to a higher extent on the uncoated and fibrinogen coated alumina surfaces in comparison with serum and collagen coated alumina surfaces. Osteoblast development after 24 hours was better in collagen coated alumina in comparison to uncoated, fibrinogen and serum-coated alumina. Protein adsorption is rapid and faster than cell migration.
Earlier in vivo biocompatibility investigations of stents with porous AAO layer using rabbit restenosis model proved biocompatibility and absence of inflammation [222]. However, recent reports on in vivo biocompatibility of therapeutic alumina stent coatings investigated using pig restenosis model indicate inflammatory response [223,224]. Recent study [221] demonstrated that alumina membranes (75 nm) for immunoisolation are non-toxic and without significant complement activation in vitro. However, in -vivo implantation of these capsules into the peritoneal cavity of rats induces a transient inflammatory response, and that PEG is useful in minimizing the host response to the materials. Blood vessels are seen in the tissue treated with PEG-modified capsules, which suggests that the major amount of inflammation is due to the procedure itself, whereas surrounding tissues are relatively undisturbed. Considering that inflammatory response of porous alumina can be significantly minimised by surface functionalization using PEG, further investigations are required to establish whether surface modifications can eliminate or minimise observed inflammatory/restenosis effect.
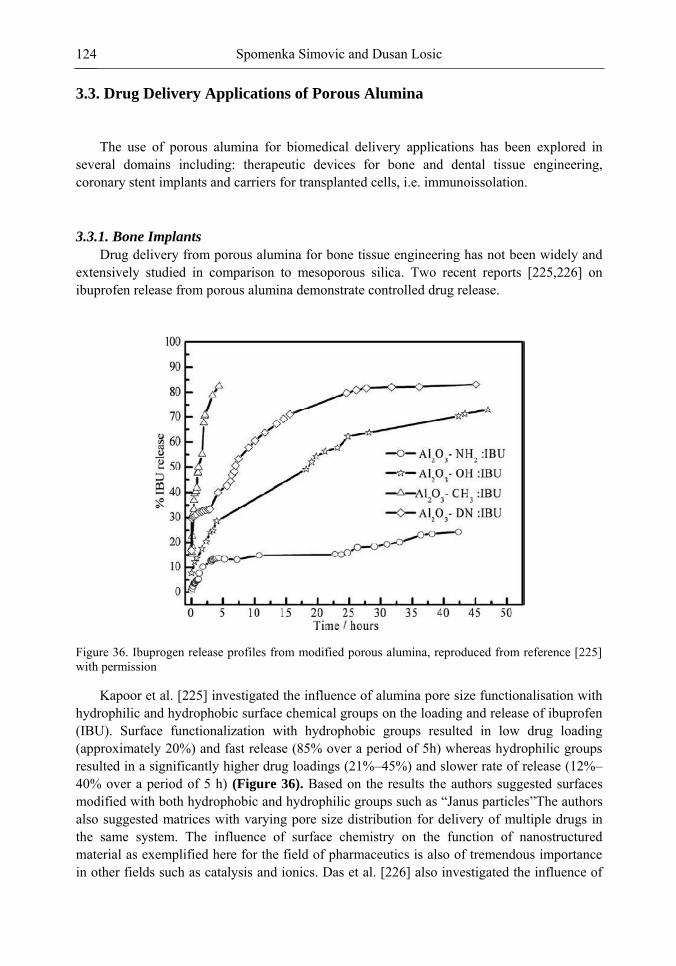
Spomenka Simovic and Dusan Losic 124
3.3. Drug Delivery Applications of Porous Alumina
The use of porous alumina for biomedical delivery applications has been explored in
several domains including: therapeutic devices for bone and dental tissue engineering, coronary stent implants and carriers for transplanted cells, i.e. immunoissolation.
3.3.1. Bone Implants
Drug delivery from porous alumina for bone tissue engineering has not been widely and extensively studied in comparison to mesoporous silica. Two recent reports [225,226] on ibuprofen release from porous alumina demonstrate controlled drug release.
Figure 36. Ibuprogen release profiles from modified porous alumina, reproduced from reference [225] with permission
Kapoor et al. [225] investigated the influence of alumina pore size functionalisation with hydrophilic and hydrophobic surface chemical groups on the loading and release of ibuprofen (IBU). Surface functionalization with hydrophobic groups resulted in low drug loading (approximately 20%) and fast release (85% over a period of 5h) whereas hydrophilic groups resulted in a significantly higher drug loadings (21%–45%) and slower rate of release (12%–
40% over a period of 5 h) (Figure 36). Based on the results the authors suggested surfaces modified with both hydrophobic and hydrophilic groups such as ―Janus particles‖The authors
also suggested matrices with varying pore size distribution for delivery of multiple drugs in the same system. The influence of surface chemistry on the function of nanostructured material as exemplified here for the field of pharmaceutics is also of tremendous importance in other fields such as catalysis and ionics. Das et al. [226] also investigated the influence of
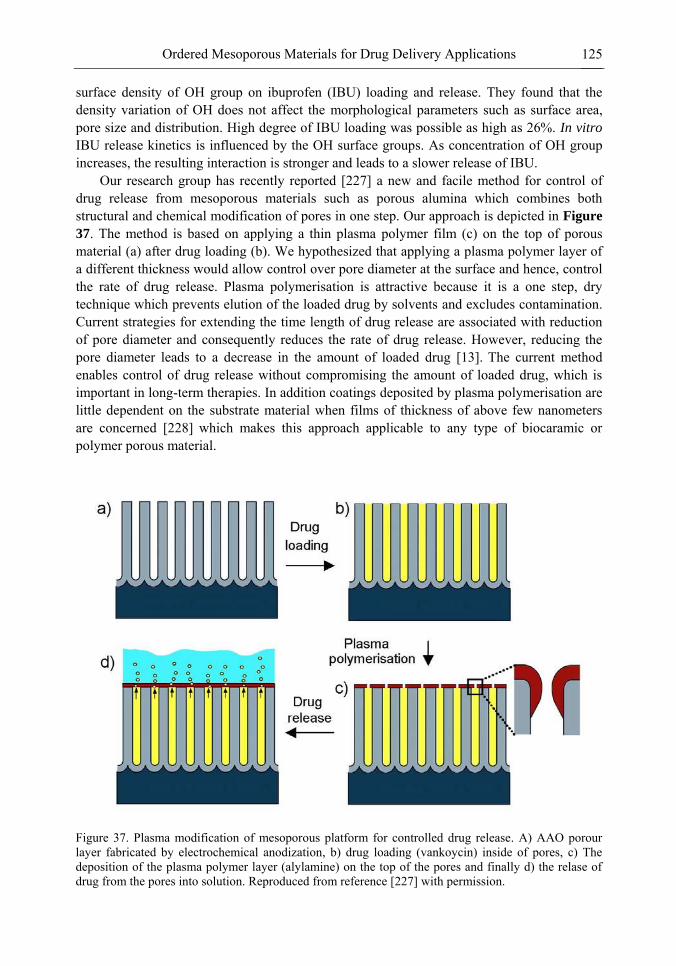
Ordered Mesoporous Materials for Drug Delivery Applications 125
surface density of OH group on ibuprofen (IBU) loading and release. They found that the density variation of OH does not affect the morphological parameters such as surface area, pore size and distribution. High degree of IBU loading was possible as high as 26%. In vitro IBU release kinetics is influenced by the OH surface groups. As concentration of OH group increases, the resulting interaction is stronger and leads to a slower release of IBU.
Our research group has recently reported [227] a new and facile method for control of drug release from mesoporous materials such as porous alumina which combines both structural and chemical modification of pores in one step. Our approach is depicted in Figure
37. The method is based on applying a thin plasma polymer film (c) on the top of porous material (a) after drug loading (b). We hypothesized that applying a plasma polymer layer of a different thickness would allow control over pore diameter at the surface and hence, control the rate of drug release. Plasma polymerisation is attractive because it is a one step, dry technique which prevents elution of the loaded drug by solvents and excludes contamination. Current strategies for extending the time length of drug release are associated with reduction of pore diameter and consequently reduces the rate of drug release. However, reducing the pore diameter leads to a decrease in the amount of loaded drug [13]. The current method enables control of drug release without compromising the amount of loaded drug, which is important in long-term therapies. In addition coatings deposited by plasma polymerisation are little dependent on the substrate material when films of thickness of above few nanometers are concerned [228] which makes this approach applicable to any type of biocaramic or polymer porous material.
Figure 37. Plasma modification of mesoporous platform for controlled drug release. A) AAO porour layer fabricated by electrochemical anodization, b) drug loading (vankoycin) inside of pores, c) The deposition of the plasma polymer layer (alylamine) on the top of the pores and finally d) the relase of drug from the pores into solution. Reproduced from reference [227] with permission.
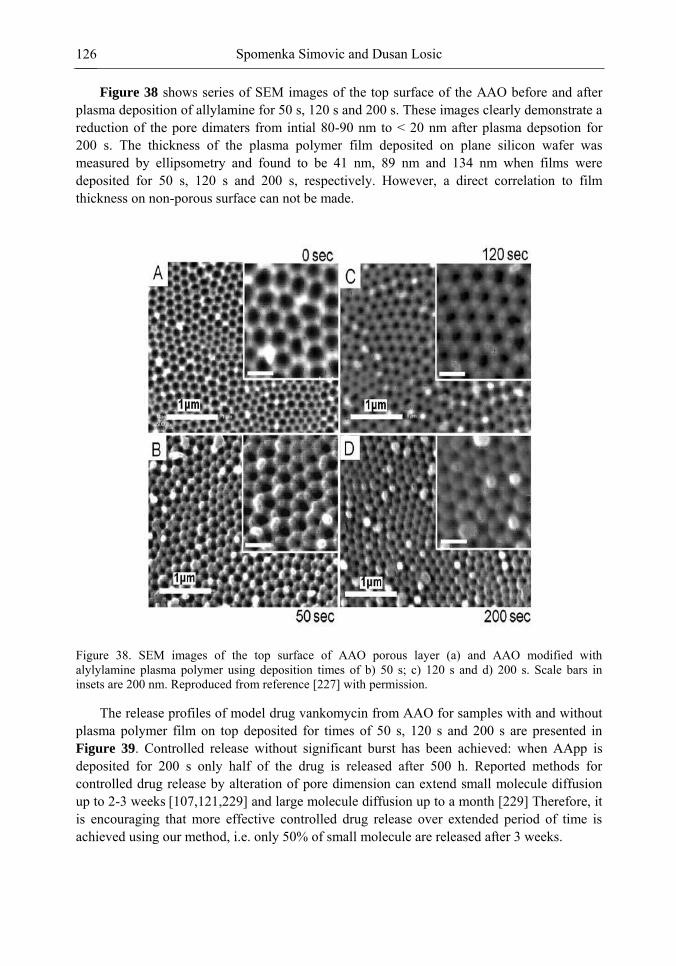
Spomenka Simovic and Dusan Losic 126
Figure 38 shows series of SEM images of the top surface of the AAO before and after plasma deposition of allylamine for 50 s, 120 s and 200 s. These images clearly demonstrate a reduction of the pore dimaters from intial 80-90 nm to < 20 nm after plasma depsotion for 200 s. The thickness of the plasma polymer film deposited on plane silicon wafer was measured by ellipsometry and found to be 41 nm, 89 nm and 134 nm when films were deposited for 50 s, 120 s and 200 s, respectively. However, a direct correlation to film thickness on non-porous surface can not be made.
Figure 38. SEM images of the top surface of AAO porous layer (a) and AAO modified with alylylamine plasma polymer using deposition times of b) 50 s; c) 120 s and d) 200 s. Scale bars in insets are 200 nm. Reproduced from reference [227] with permission.
The release profiles of model drug vankomycin from AAO for samples with and without plasma polymer film on top deposited for times of 50 s, 120 s and 200 s are presented in Figure 39. Controlled release without significant burst has been achieved: when AApp is deposited for 200 s only half of the drug is released after 500 h. Reported methods for controlled drug release by alteration of pore dimension can extend small molecule diffusion up to 2-3 weeks [107,121,229] and large molecule diffusion up to a month [229] Therefore, it is encouraging that more effective controlled drug release over extended period of time is achieved using our method, i.e. only 50% of small molecule are released after 3 weeks.
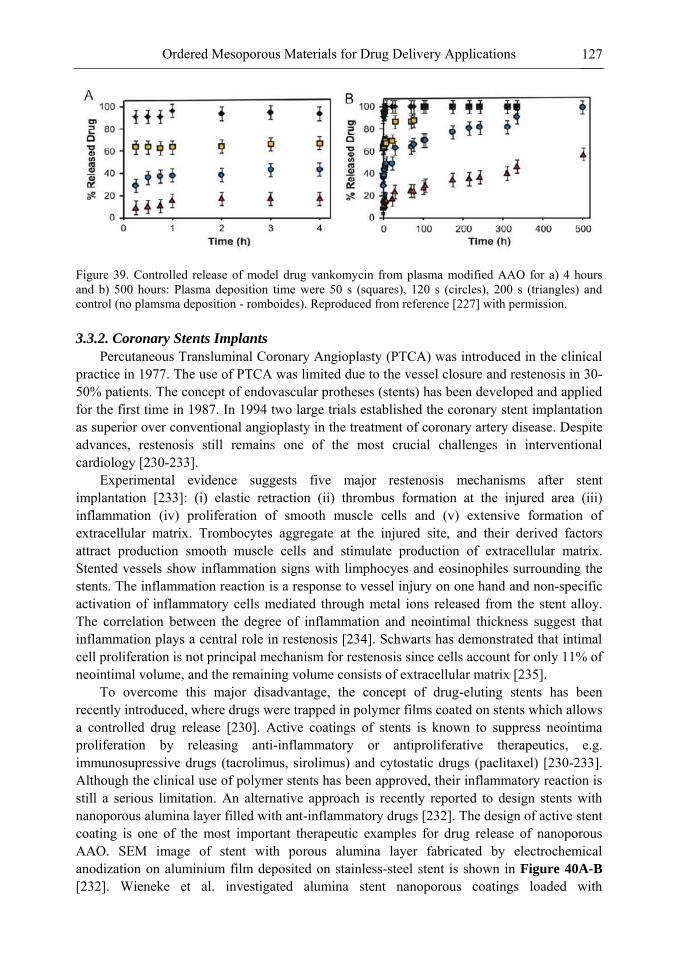
Ordered Mesoporous Materials for Drug Delivery Applications 127
Figure 39. Controlled release of model drug vankomycin from plasma modified AAO for a) 4 hours and b) 500 hours: Plasma deposition time were 50 s (squares), 120 s (circles), 200 s (triangles) and control (no plamsma deposition - romboides). Reproduced from reference [227] with permission.
3.3.2. Coronary Stents Implants
Percutaneous Transluminal Coronary Angioplasty (PTCA) was introduced in the clinical practice in 1977. The use of PTCA was limited due to the vessel closure and restenosis in 30-50% patients. The concept of endovascular protheses (stents) has been developed and applied for the first time in 1987. In 1994 two large trials established the coronary stent implantation as superior over conventional angioplasty in the treatment of coronary artery disease. Despite advances, restenosis still remains one of the most crucial challenges in interventional cardiology [230-233].
Experimental evidence suggests five major restenosis mechanisms after stent implantation [233]: (i) elastic retraction (ii) thrombus formation at the injured area (iii) inflammation (iv) proliferation of smooth muscle cells and (v) extensive formation of extracellular matrix. Trombocytes aggregate at the injured site, and their derived factors attract production smooth muscle cells and stimulate production of extracellular matrix. Stented vessels show inflammation signs with limphocyes and eosinophiles surrounding the stents. The inflammation reaction is a response to vessel injury on one hand and non-specific activation of inflammatory cells mediated through metal ions released from the stent alloy. The correlation between the degree of inflammation and neointimal thickness suggest that inflammation plays a central role in restenosis [234]. Schwarts has demonstrated that intimal cell proliferation is not principal mechanism for restenosis since cells account for only 11% of neointimal volume, and the remaining volume consists of extracellular matrix [235].
To overcome this major disadvantage, the concept of drug-eluting stents has been recently introduced, where drugs were trapped in polymer films coated on stents which allows a controlled drug release [230]. Active coatings of stents is known to suppress neointima proliferation by releasing anti-inflammatory or antiproliferative therapeutics, e.g. immunosupressive drugs (tacrolimus, sirolimus) and cytostatic drugs (paclitaxel) [230-233]. Although the clinical use of polymer stents has been approved, their inflammatory reaction is still a serious limitation. An alternative approach is recently reported to design stents with nanoporous alumina layer filled with ant-inflammatory drugs [232]. The design of active stent coating is one of the most important therapeutic examples for drug release of nanoporous AAO. SEM image of stent with porous alumina layer fabricated by electrochemical anodization on aluminium film deposited on stainless-steel stent is shown in Figure 40A-B
[232]. Wieneke et al. investigated alumina stent nanoporous coatings loaded with
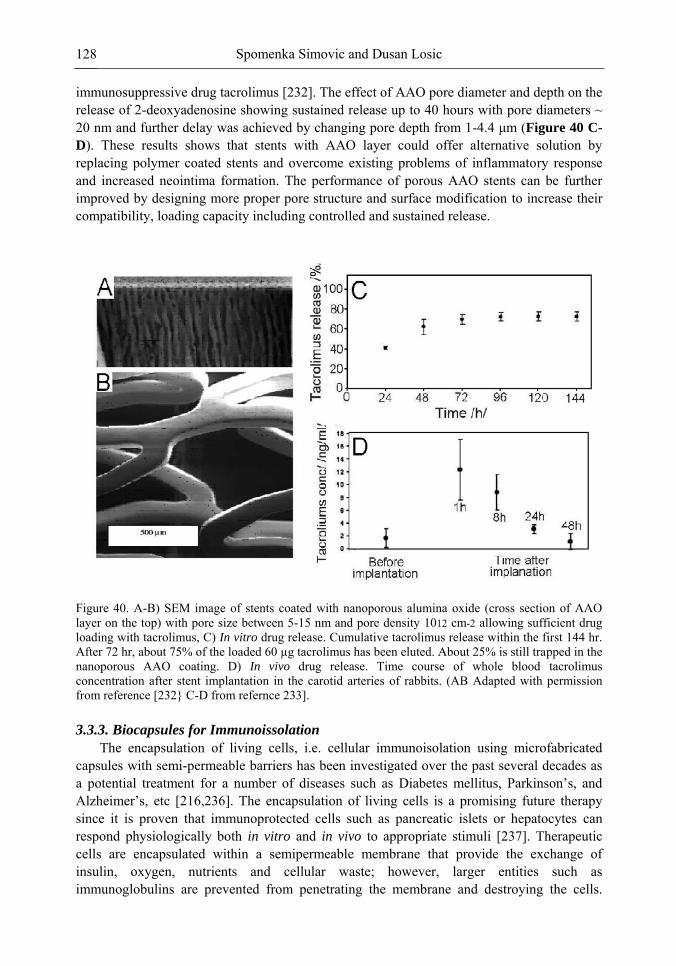
Spomenka Simovic and Dusan Losic 128
immunosuppressive drug tacrolimus [232]. The effect of AAO pore diameter and depth on the release of 2-deoxyadenosine showing sustained release up to 40 hours with pore diameters ~ 20 nm and further delay was achieved by changing pore depth from 1-4.4 μm (Figure 40 C-
D). These results shows that stents with AAO layer could offer alternative solution by replacing polymer coated stents and overcome existing problems of inflammatory response and increased neointima formation. The performance of porous AAO stents can be further improved by designing more proper pore structure and surface modification to increase their compatibility, loading capacity including controlled and sustained release.
Figure 40. A-B) SEM image of stents coated with nanoporous alumina oxide (cross section of AAO layer on the top) with pore size between 5-15 nm and pore density 1012 cm-2 allowing sufficient drug loading with tacrolimus, C) In vitro drug release. Cumulative tacrolimus release within the first 144 hr. After 72 hr, about 75% of the loaded 60 µg tacrolimus has been eluted. About 25% is still trapped in the nanoporous AAO coating. D) In vivo drug release. Time course of whole blood tacrolimus concentration after stent implantation in the carotid arteries of rabbits. (AB Adapted with permission from reference [232 C-D from refernce 233].
3.3.3. Biocapsules for Immunoissolation
The encapsulation of living cells, i.e. cellular immunoisolation using microfabricated capsules with semi-permeable barriers has been investigated over the past several decades as a potential treatment for a number of diseases such as Diabetes mellitus, Parkinson‘s, and
Alzheimer‘s, etc [216,236]. The encapsulation of living cells is a promising future therapy since it is proven that immunoprotected cells such as pancreatic islets or hepatocytes can respond physiologically both in vitro and in vivo to appropriate stimuli [237]. Therapeutic cells are encapsulated within a semipermeable membrane that provide the exchange of insulin, oxygen, nutrients and cellular waste; however, larger entities such as immunoglobulins are prevented from penetrating the membrane and destroying the cells.
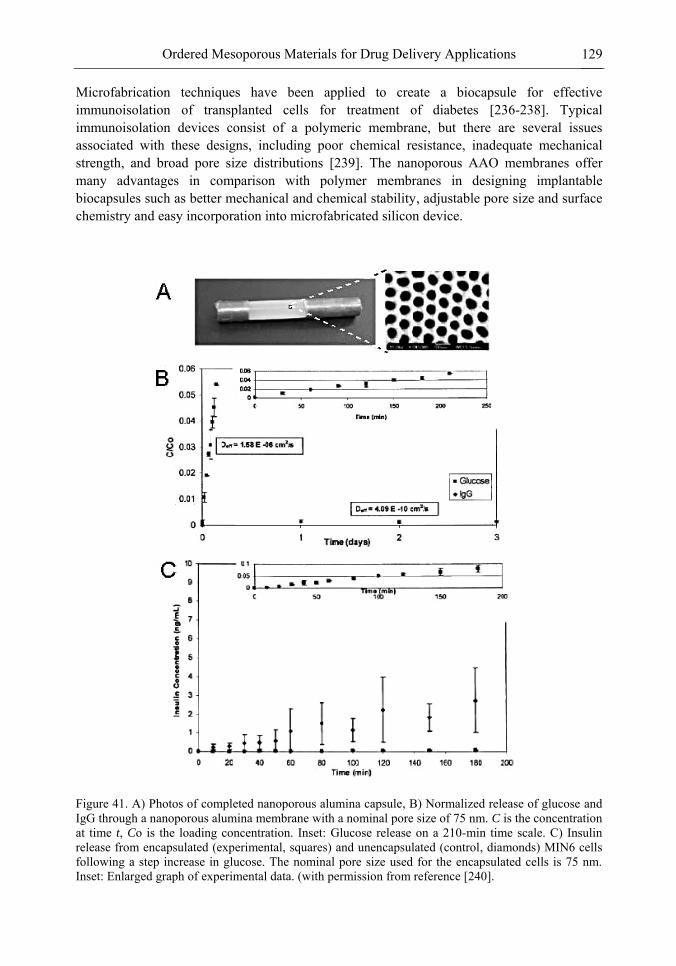
Ordered Mesoporous Materials for Drug Delivery Applications 129
Microfabrication techniques have been applied to create a biocapsule for effective immunoisolation of transplanted cells for treatment of diabetes [236-238]. Typical immunoisolation devices consist of a polymeric membrane, but there are several issues associated with these designs, including poor chemical resistance, inadequate mechanical strength, and broad pore size distributions [239]. The nanoporous AAO membranes offer many advantages in comparison with polymer membranes in designing implantable biocapsules such as better mechanical and chemical stability, adjustable pore size and surface chemistry and easy incorporation into microfabricated silicon device.
Figure 41. A) Photos of completed nanoporous alumina capsule, B) Normalized release of glucose and IgG through a nanoporous alumina membrane with a nominal pore size of 75 nm. C is the concentration at time t, Co is the loading concentration. Inset: Glucose release on a 210-min time scale. C) Insulin release from encapsulated (experimental, squares) and unencapsulated (control, diamonds) MIN6 cells following a step increase in glucose. The nominal pore size used for the encapsulated cells is 75 nm. Inset: Enlarged graph of experimental data. (with permission from reference [240].
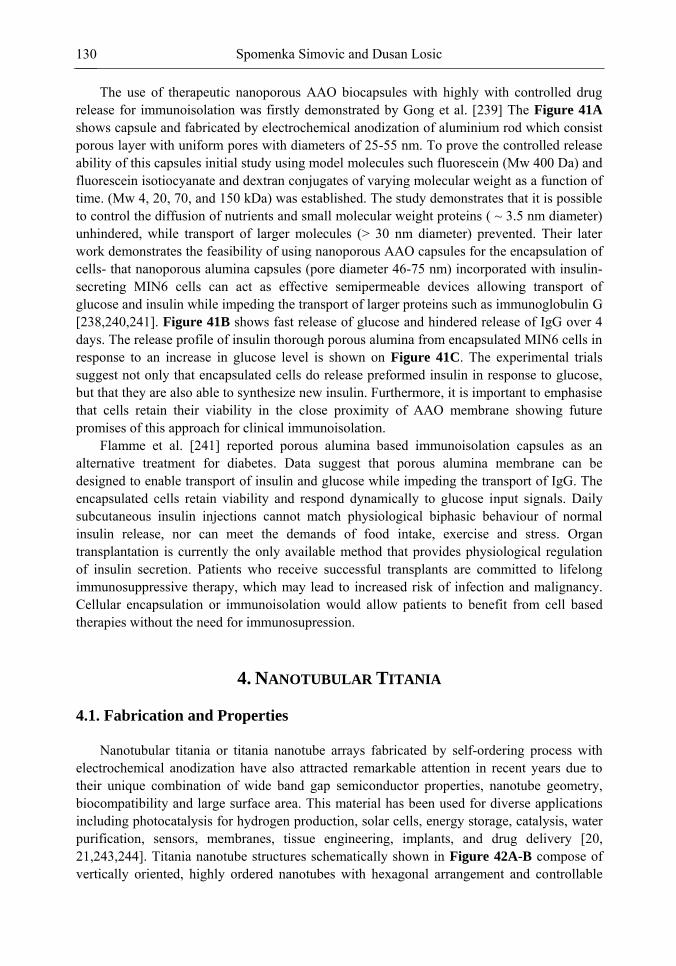
Spomenka Simovic and Dusan Losic 130
The use of therapeutic nanoporous AAO biocapsules with highly with controlled drug release for immunoisolation was firstly demonstrated by Gong et al. [239] The Figure 41A shows capsule and fabricated by electrochemical anodization of aluminium rod which consist porous layer with uniform pores with diameters of 25-55 nm. To prove the controlled release ability of this capsules initial study using model molecules such fluorescein (Mw 400 Da) and fluorescein isotiocyanate and dextran conjugates of varying molecular weight as a function of time. (Mw 4, 20, 70, and 150 kDa) was established. The study demonstrates that it is possible to control the diffusion of nutrients and small molecular weight proteins ( ~ 3.5 nm diameter) unhindered, while transport of larger molecules (> 30 nm diameter) prevented. Their later work demonstrates the feasibility of using nanoporous AAO capsules for the encapsulation of cells- that nanoporous alumina capsules (pore diameter 46-75 nm) incorporated with insulin-secreting MIN6 cells can act as effective semipermeable devices allowing transport of glucose and insulin while impeding the transport of larger proteins such as immunoglobulin G [238,240,241]. Figure 41B shows fast release of glucose and hindered release of IgG over 4 days. The release profile of insulin thorough porous alumina from encapsulated MIN6 cells in response to an increase in glucose level is shown on Figure 41C. The experimental trials suggest not only that encapsulated cells do release preformed insulin in response to glucose, but that they are also able to synthesize new insulin. Furthermore, it is important to emphasise that cells retain their viability in the close proximity of AAO membrane showing future promises of this approach for clinical immunoisolation.
Flamme et al. [241] reported porous alumina based immunoisolation capsules as an alternative treatment for diabetes. Data suggest that porous alumina membrane can be designed to enable transport of insulin and glucose while impeding the transport of IgG. The encapsulated cells retain viability and respond dynamically to glucose input signals. Daily subcutaneous insulin injections cannot match physiological biphasic behaviour of normal insulin release, nor can meet the demands of food intake, exercise and stress. Organ transplantation is currently the only available method that provides physiological regulation of insulin secretion. Patients who receive successful transplants are committed to lifelong immunosuppressive therapy, which may lead to increased risk of infection and malignancy. Cellular encapsulation or immunoisolation would allow patients to benefit from cell based therapies without the need for immunosupression.
4. NANOTUBULAR TITANIA
4.1. Fabrication and Properties Nanotubular titania or titania nanotube arrays fabricated by self-ordering process with
electrochemical anodization have also attracted remarkable attention in recent years due to their unique combination of wide band gap semiconductor properties, nanotube geometry, biocompatibility and large surface area. This material has been used for diverse applications including photocatalysis for hydrogen production, solar cells, energy storage, catalysis, water purification, sensors, membranes, tissue engineering, implants, and drug delivery [20, 21,243,244]. Titania nanotube structures schematically shown in Figure 42A-B compose of vertically oriented, highly ordered nanotubes with hexagonal arrangement and controllable
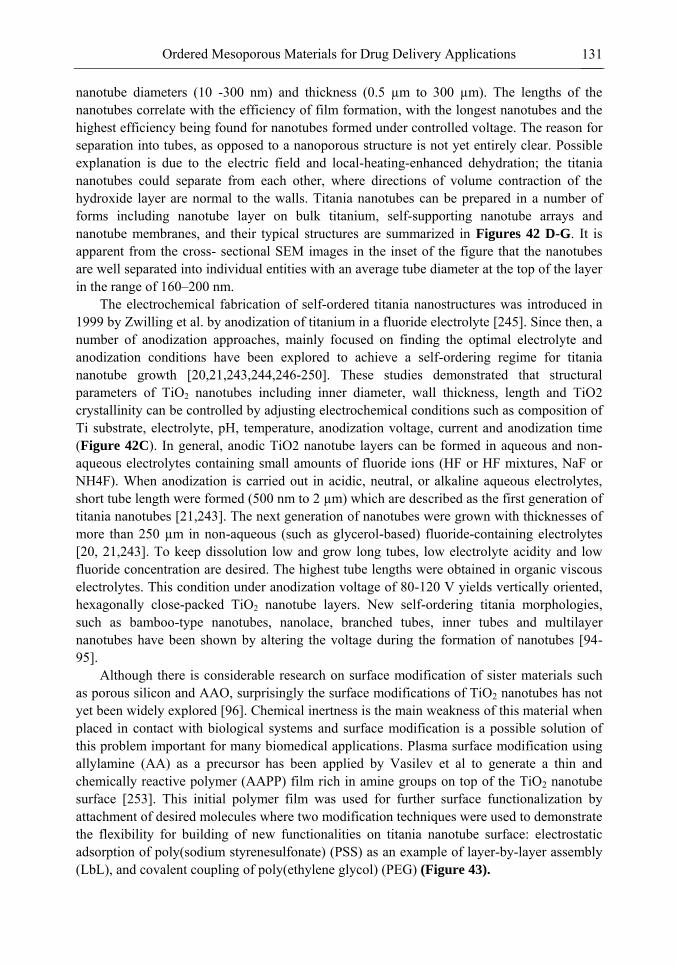
Ordered Mesoporous Materials for Drug Delivery Applications 131
nanotube diameters (10 -300 nm) and thickness (0.5 µm to 300 µm). The lengths of the nanotubes correlate with the efficiency of film formation, with the longest nanotubes and the highest efficiency being found for nanotubes formed under controlled voltage. The reason for separation into tubes, as opposed to a nanoporous structure is not yet entirely clear. Possible explanation is due to the electric field and local-heating-enhanced dehydration; the titania nanotubes could separate from each other, where directions of volume contraction of the hydroxide layer are normal to the walls. Titania nanotubes can be prepared in a number of forms including nanotube layer on bulk titanium, self-supporting nanotube arrays and nanotube membranes, and their typical structures are summarized in Figures 42 D-G. It is apparent from the cross- sectional SEM images in the inset of the figure that the nanotubes are well separated into individual entities with an average tube diameter at the top of the layer in the range of 160–200 nm.
The electrochemical fabrication of self-ordered titania nanostructures was introduced in 1999 by Zwilling et al. by anodization of titanium in a fluoride electrolyte [245]. Since then, a number of anodization approaches, mainly focused on finding the optimal electrolyte and anodization conditions have been explored to achieve a self-ordering regime for titania nanotube growth [20,21,243,244,246-250]. These studies demonstrated that structural parameters of TiO2 nanotubes including inner diameter, wall thickness, length and TiO2 crystallinity can be controlled by adjusting electrochemical conditions such as composition of Ti substrate, electrolyte, pH, temperature, anodization voltage, current and anodization time (Figure 42C). In general, anodic TiO2 nanotube layers can be formed in aqueous and non-aqueous electrolytes containing small amounts of fluoride ions (HF or HF mixtures, NaF or NH4F). When anodization is carried out in acidic, neutral, or alkaline aqueous electrolytes, short tube length were formed (500 nm to 2 µm) which are described as the first generation of titania nanotubes [21,243]. The next generation of nanotubes were grown with thicknesses of more than 250 µm in non-aqueous (such as glycerol-based) fluoride-containing electrolytes [20, 21,243]. To keep dissolution low and grow long tubes, low electrolyte acidity and low fluoride concentration are desired. The highest tube lengths were obtained in organic viscous electrolytes. This condition under anodization voltage of 80-120 V yields vertically oriented, hexagonally close-packed TiO2 nanotube layers. New self-ordering titania morphologies, such as bamboo-type nanotubes, nanolace, branched tubes, inner tubes and multilayer nanotubes have been shown by altering the voltage during the formation of nanotubes [94-95].
Although there is considerable research on surface modification of sister materials such as porous silicon and AAO, surprisingly the surface modifications of TiO2 nanotubes has not yet been widely explored [96]. Chemical inertness is the main weakness of this material when placed in contact with biological systems and surface modification is a possible solution of this problem important for many biomedical applications. Plasma surface modification using allylamine (AA) as a precursor has been applied by Vasilev et al to generate a thin and chemically reactive polymer (AAPP) film rich in amine groups on top of the TiO2 nanotube surface [253]. This initial polymer film was used for further surface functionalization by attachment of desired molecules where two modification techniques were used to demonstrate the flexibility for building of new functionalities on titania nanotube surface: electrostatic adsorption of poly(sodium styrenesulfonate) (PSS) as an example of layer-by-layer assembly (LbL), and covalent coupling of poly(ethylene glycol) (PEG) (Figure 43).
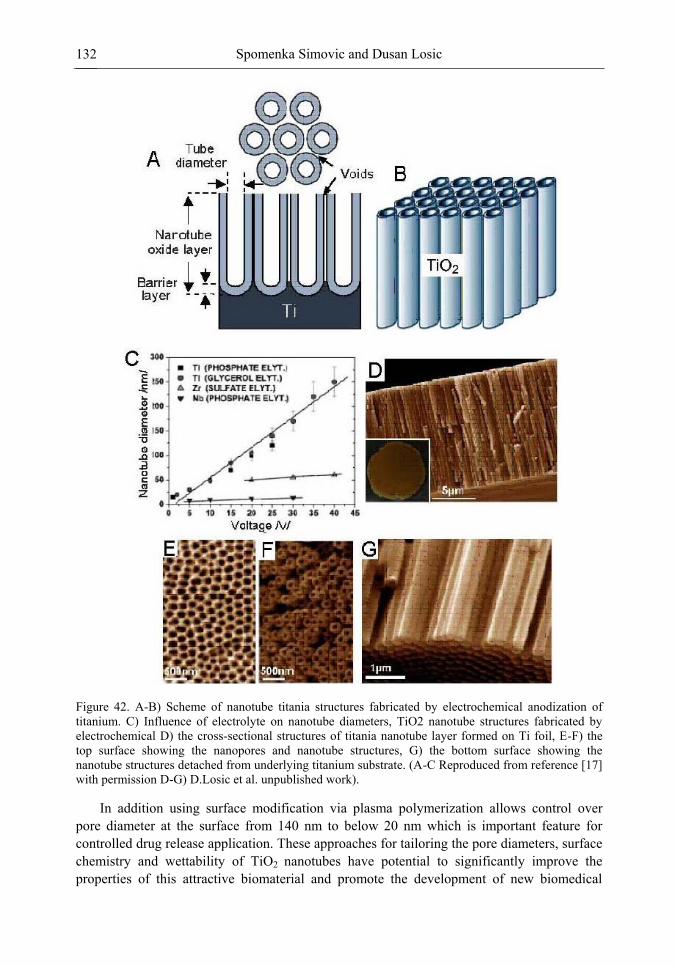
Spomenka Simovic and Dusan Losic 132
Figure 42. A-B) Scheme of nanotube titania structures fabricated by electrochemical anodization of titanium. C) Influence of electrolyte on nanotube diameters, TiO2 nanotube structures fabricated by electrochemical D) the cross-sectional structures of titania nanotube layer formed on Ti foil, E-F) the top surface showing the nanopores and nanotube structures, G) the bottom surface showing the nanotube structures detached from underlying titanium substrate. (A-C Reproduced from reference [17] with permission D-G) D.Losic et al. unpublished work).
In addition using surface modification via plasma polymerization allows control over pore diameter at the surface from 140 nm to below 20 nm which is important feature for controlled drug release application. These approaches for tailoring the pore diameters, surface chemistry and wettability of TiO2 nanotubes have potential to significantly improve the properties of this attractive biomaterial and promote the development of new biomedical
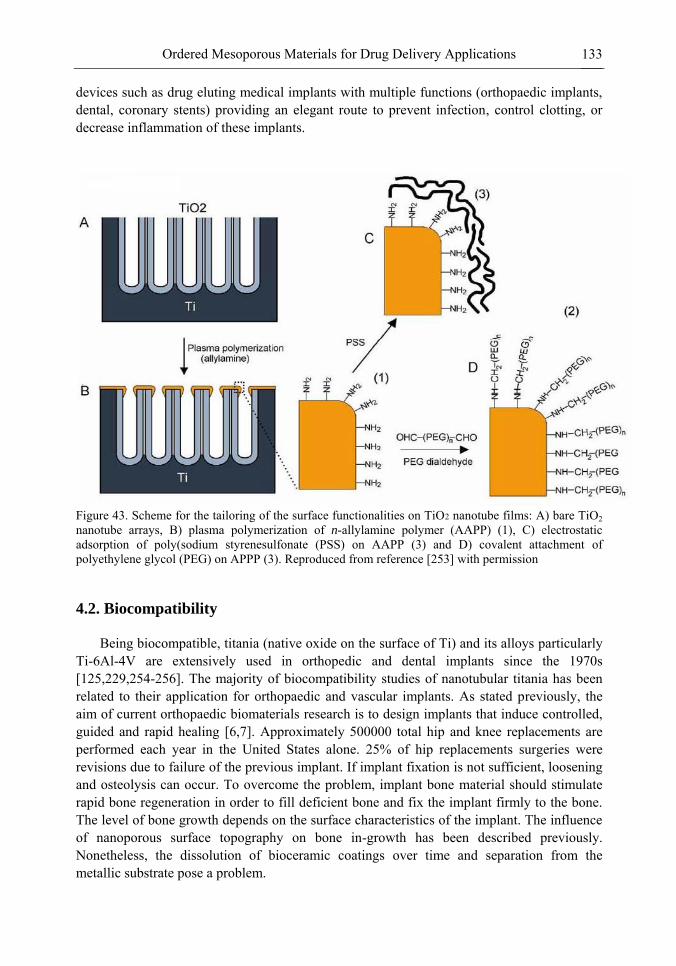
Ordered Mesoporous Materials for Drug Delivery Applications 133
devices such as drug eluting medical implants with multiple functions (orthopaedic implants, dental, coronary stents) providing an elegant route to prevent infection, control clotting, or decrease inflammation of these implants.
Figure 43. Scheme for the tailoring of the surface functionalities on TiO2 nanotube films: A) bare TiO2 nanotube arrays, B) plasma polymerization of n-allylamine polymer (AAPP) (1), C) electrostatic adsorption of poly(sodium styrenesulfonate (PSS) on AAPP (3) and D) covalent attachment of polyethylene glycol (PEG) on APPP (3). Reproduced from reference [253] with permission
4.2. Biocompatibility Being biocompatible, titania (native oxide on the surface of Ti) and its alloys particularly
Ti-6Al-4V are extensively used in orthopedic and dental implants since the 1970s [125,229,254-256]. The majority of biocompatibility studies of nanotubular titania has been related to their application for orthopaedic and vascular implants. As stated previously, the aim of current orthopaedic biomaterials research is to design implants that induce controlled, guided and rapid healing [6,7]. Approximately 500000 total hip and knee replacements are performed each year in the United States alone. 25% of hip replacements surgeries were revisions due to failure of the previous implant. If implant fixation is not sufficient, loosening and osteolysis can occur. To overcome the problem, implant bone material should stimulate rapid bone regeneration in order to fill deficient bone and fix the implant firmly to the bone. The level of bone growth depends on the surface characteristics of the implant. The influence of nanoporous surface topography on bone in-growth has been described previously. Nonetheless, the dissolution of bioceramic coatings over time and separation from the metallic substrate pose a problem.
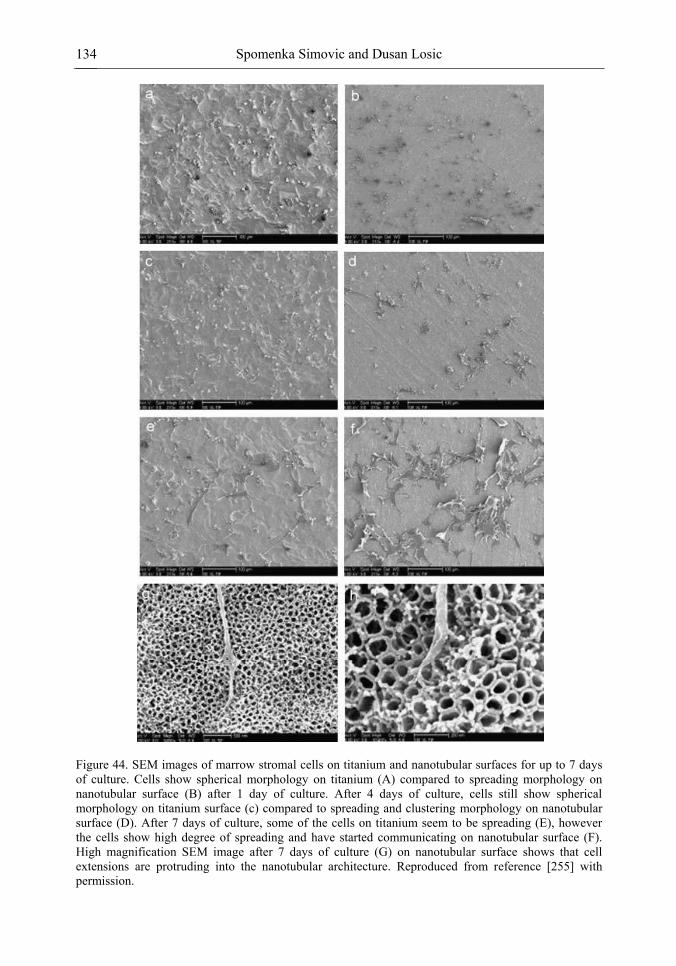
Spomenka Simovic and Dusan Losic 134
Figure 44. SEM images of marrow stromal cells on titanium and nanotubular surfaces for up to 7 days of culture. Cells show spherical morphology on titanium (A) compared to spreading morphology on nanotubular surface (B) after 1 day of culture. After 4 days of culture, cells still show spherical morphology on titanium surface (c) compared to spreading and clustering morphology on nanotubular surface (D). After 7 days of culture, some of the cells on titanium seem to be spreading (E), however the cells show high degree of spreading and have started communicating on nanotubular surface (F). High magnification SEM image after 7 days of culture (G) on nanotubular surface shows that cell extensions are protruding into the nanotubular architecture. Reproduced from reference [255] with permission.
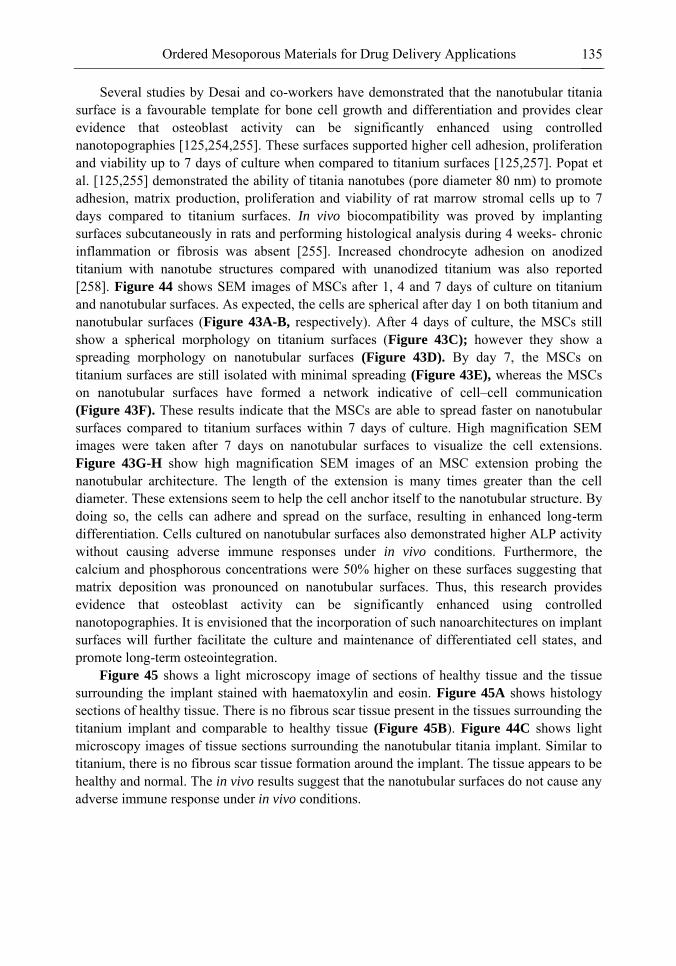
Ordered Mesoporous Materials for Drug Delivery Applications 135
Several studies by Desai and co-workers have demonstrated that the nanotubular titania surface is a favourable template for bone cell growth and differentiation and provides clear evidence that osteoblast activity can be significantly enhanced using controlled nanotopographies [125,254,255]. These surfaces supported higher cell adhesion, proliferation and viability up to 7 days of culture when compared to titanium surfaces [125,257]. Popat et al. [125,255] demonstrated the ability of titania nanotubes (pore diameter 80 nm) to promote adhesion, matrix production, proliferation and viability of rat marrow stromal cells up to 7 days compared to titanium surfaces. In vivo biocompatibility was proved by implanting surfaces subcutaneously in rats and performing histological analysis during 4 weeks- chronic inflammation or fibrosis was absent [255]. Increased chondrocyte adhesion on anodized titanium with nanotube structures compared with unanodized titanium was also reported [258]. Figure 44 shows SEM images of MSCs after 1, 4 and 7 days of culture on titanium and nanotubular surfaces. As expected, the cells are spherical after day 1 on both titanium and nanotubular surfaces (Figure 43A-B, respectively). After 4 days of culture, the MSCs still show a spherical morphology on titanium surfaces (Figure 43C); however they show a spreading morphology on nanotubular surfaces (Figure 43D). By day 7, the MSCs on titanium surfaces are still isolated with minimal spreading (Figure 43E), whereas the MSCs on nanotubular surfaces have formed a network indicative of cell–cell communication (Figure 43F). These results indicate that the MSCs are able to spread faster on nanotubular surfaces compared to titanium surfaces within 7 days of culture. High magnification SEM images were taken after 7 days on nanotubular surfaces to visualize the cell extensions. Figure 43G-H show high magnification SEM images of an MSC extension probing the nanotubular architecture. The length of the extension is many times greater than the cell diameter. These extensions seem to help the cell anchor itself to the nanotubular structure. By doing so, the cells can adhere and spread on the surface, resulting in enhanced long-term differentiation. Cells cultured on nanotubular surfaces also demonstrated higher ALP activity without causing adverse immune responses under in vivo conditions. Furthermore, the calcium and phosphorous concentrations were 50% higher on these surfaces suggesting that matrix deposition was pronounced on nanotubular surfaces. Thus, this research provides evidence that osteoblast activity can be significantly enhanced using controlled nanotopographies. It is envisioned that the incorporation of such nanoarchitectures on implant surfaces will further facilitate the culture and maintenance of differentiated cell states, and promote long-term osteointegration.
Figure 45 shows a light microscopy image of sections of healthy tissue and the tissue surrounding the implant stained with haematoxylin and eosin. Figure 45A shows histology sections of healthy tissue. There is no fibrous scar tissue present in the tissues surrounding the titanium implant and comparable to healthy tissue (Figure 45B). Figure 44C shows light microscopy images of tissue sections surrounding the nanotubular titania implant. Similar to titanium, there is no fibrous scar tissue formation around the implant. The tissue appears to be healthy and normal. The in vivo results suggest that the nanotubular surfaces do not cause any adverse immune response under in vivo conditions.
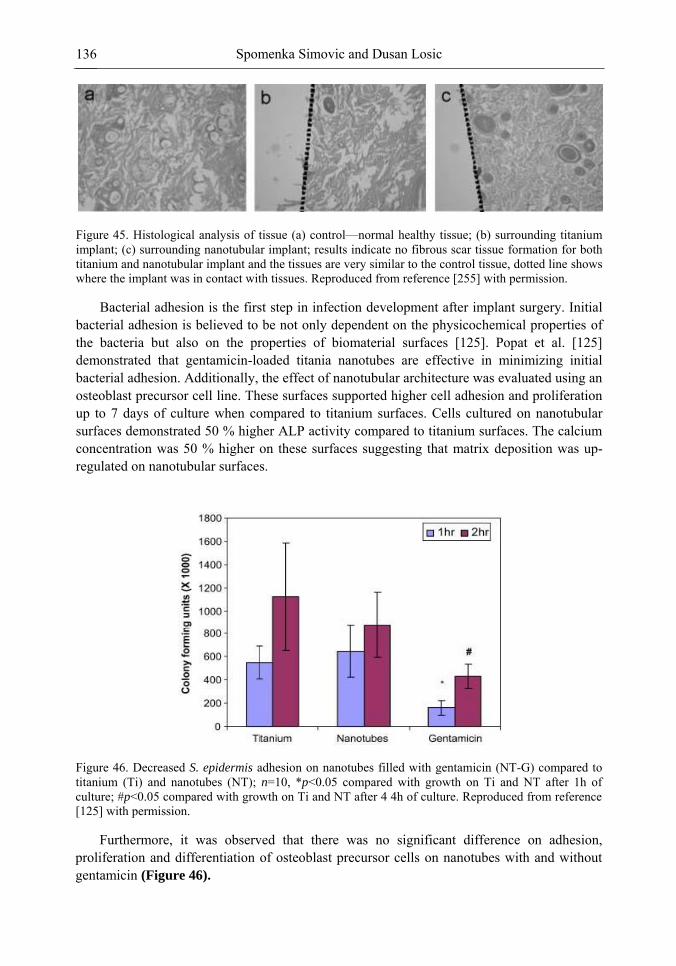
Spomenka Simovic and Dusan Losic 136
Figure 45. Histological analysis of tissue (a) control—normal healthy tissue; (b) surrounding titanium implant; (c) surrounding nanotubular implant; results indicate no fibrous scar tissue formation for both titanium and nanotubular implant and the tissues are very similar to the control tissue, dotted line shows where the implant was in contact with tissues. Reproduced from reference [255] with permission.
Bacterial adhesion is the first step in infection development after implant surgery. Initial bacterial adhesion is believed to be not only dependent on the physicochemical properties of the bacteria but also on the properties of biomaterial surfaces [125]. Popat et al. [125] demonstrated that gentamicin-loaded titania nanotubes are effective in minimizing initial bacterial adhesion. Additionally, the effect of nanotubular architecture was evaluated using an osteoblast precursor cell line. These surfaces supported higher cell adhesion and proliferation up to 7 days of culture when compared to titanium surfaces. Cells cultured on nanotubular surfaces demonstrated 50 % higher ALP activity compared to titanium surfaces. The calcium concentration was 50 % higher on these surfaces suggesting that matrix deposition was up-regulated on nanotubular surfaces.
Figure 46. Decreased S. epidermis adhesion on nanotubes filled with gentamicin (NT-G) compared to titanium (Ti) and nanotubes (NT); n=10, *p<0.05 compared with growth on Ti and NT after 1h of culture; #p<0.05 compared with growth on Ti and NT after 4 4h of culture. Reproduced from reference [125] with permission.
Furthermore, it was observed that there was no significant difference on adhesion, proliferation and differentiation of osteoblast precursor cells on nanotubes with and without gentamicin (Figure 46).
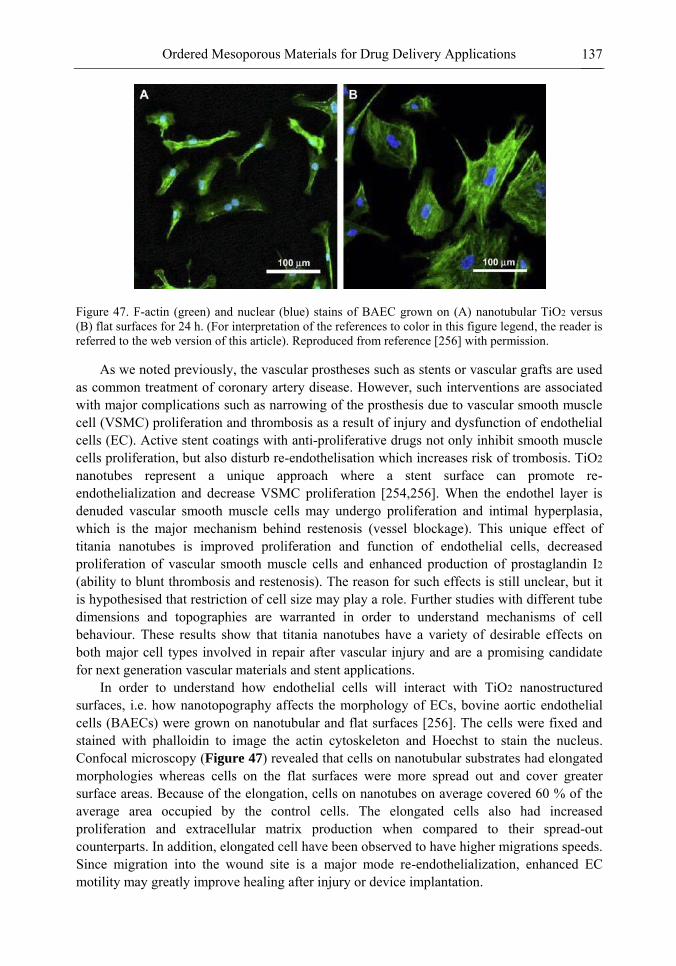
Ordered Mesoporous Materials for Drug Delivery Applications 137
Figure 47. F-actin (green) and nuclear (blue) stains of BAEC grown on (A) nanotubular TiO2 versus (B) flat surfaces for 24 h. (For interpretation of the references to color in this figure legend, the reader is referred to the web version of this article). Reproduced from reference [256] with permission.
As we noted previously, the vascular prostheses such as stents or vascular grafts are used as common treatment of coronary artery disease. However, such interventions are associated with major complications such as narrowing of the prosthesis due to vascular smooth muscle cell (VSMC) proliferation and thrombosis as a result of injury and dysfunction of endothelial cells (EC). Active stent coatings with anti-proliferative drugs not only inhibit smooth muscle cells proliferation, but also disturb re-endothelisation which increases risk of trombosis. TiO2 nanotubes represent a unique approach where a stent surface can promote re-endothelialization and decrease VSMC proliferation [254,256]. When the endothel layer is denuded vascular smooth muscle cells may undergo proliferation and intimal hyperplasia, which is the major mechanism behind restenosis (vessel blockage). This unique effect of titania nanotubes is improved proliferation and function of endothelial cells, decreased proliferation of vascular smooth muscle cells and enhanced production of prostaglandin I2 (ability to blunt thrombosis and restenosis). The reason for such effects is still unclear, but it is hypothesised that restriction of cell size may play a role. Further studies with different tube dimensions and topographies are warranted in order to understand mechanisms of cell behaviour. These results show that titania nanotubes have a variety of desirable effects on both major cell types involved in repair after vascular injury and are a promising candidate for next generation vascular materials and stent applications.
In order to understand how endothelial cells will interact with TiO2 nanostructured surfaces, i.e. how nanotopography affects the morphology of ECs, bovine aortic endothelial cells (BAECs) were grown on nanotubular and flat surfaces [256]. The cells were fixed and stained with phalloidin to image the actin cytoskeleton and Hoechst to stain the nucleus. Confocal microscopy (Figure 47) revealed that cells on nanotubular substrates had elongated morphologies whereas cells on the flat surfaces were more spread out and cover greater surface areas. Because of the elongation, cells on nanotubes on average covered 60 % of the average area occupied by the control cells. The elongated cells also had increased proliferation and extracellular matrix production when compared to their spread-out counterparts. In addition, elongated cell have been observed to have higher migrations speeds. Since migration into the wound site is a major mode re-endothelialization, enhanced EC motility may greatly improve healing after injury or device implantation.
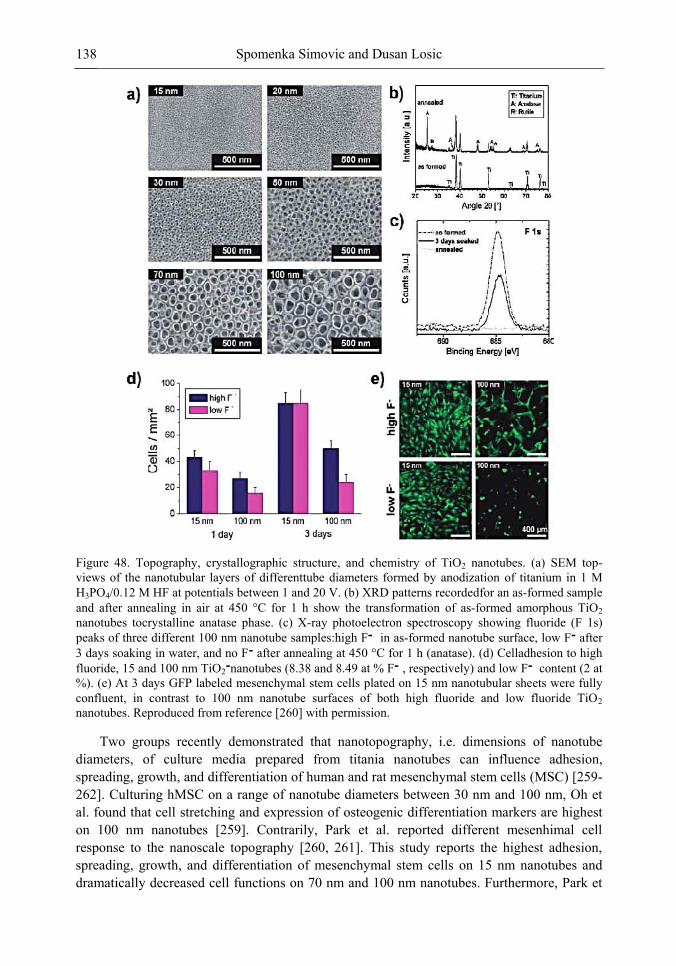
Spomenka Simovic and Dusan Losic 138
Figure 48. Topography, crystallographic structure, and chemistry of TiO2 nanotubes. (a) SEM top-views of the nanotubular layers of differenttube diameters formed by anodization of titanium in 1 M H3PO4/0.12 M HF at potentials between 1 and 20 V. (b) XRD patterns recordedfor an as-formed sample and after annealing in air at 450 °C for 1 h show the transformation of as-formed amorphous TiO2 nanotubes tocrystalline anatase phase. (c) X-ray photoelectron spectroscopy showing fluoride (F 1s) peaks of three different 100 nm nanotube samples:high F ־ in as-formed nanotube surface, low F־ after 3 days soaking in water, and no F־ after annealing at 450 °C for 1 h (anatase). (d) Celladhesion to high fluoride, 15 and 100 nm TiO2־nanotubes (8.38 and 8.49 at % F ־ , respectively) and low F ־ content (2 at %). (e) At 3 days GFP labeled mesenchymal stem cells plated on 15 nm nanotubular sheets were fully confluent, in contrast to 100 nm nanotube surfaces of both high fluoride and low fluoride TiO2 nanotubes. Reproduced from reference [260] with permission.
Two groups recently demonstrated that nanotopography, i.e. dimensions of nanotube diameters, of culture media prepared from titania nanotubes can influence adhesion, spreading, growth, and differentiation of human and rat mesenchymal stem cells (MSC) [259-262]. Culturing hMSC on a range of nanotube diameters between 30 nm and 100 nm, Oh et al. found that cell stretching and expression of osteogenic differentiation markers are highest on 100 nm nanotubes [259]. Contrarily, Park et al. reported different mesenhimal cell response to the nanoscale topography [260, 261]. This study reports the highest adhesion, spreading, growth, and differentiation of mesenchymal stem cells on 15 nm nanotubes and dramatically decreased cell functions on 70 nm and 100 nm nanotubes. Furthermore, Park et
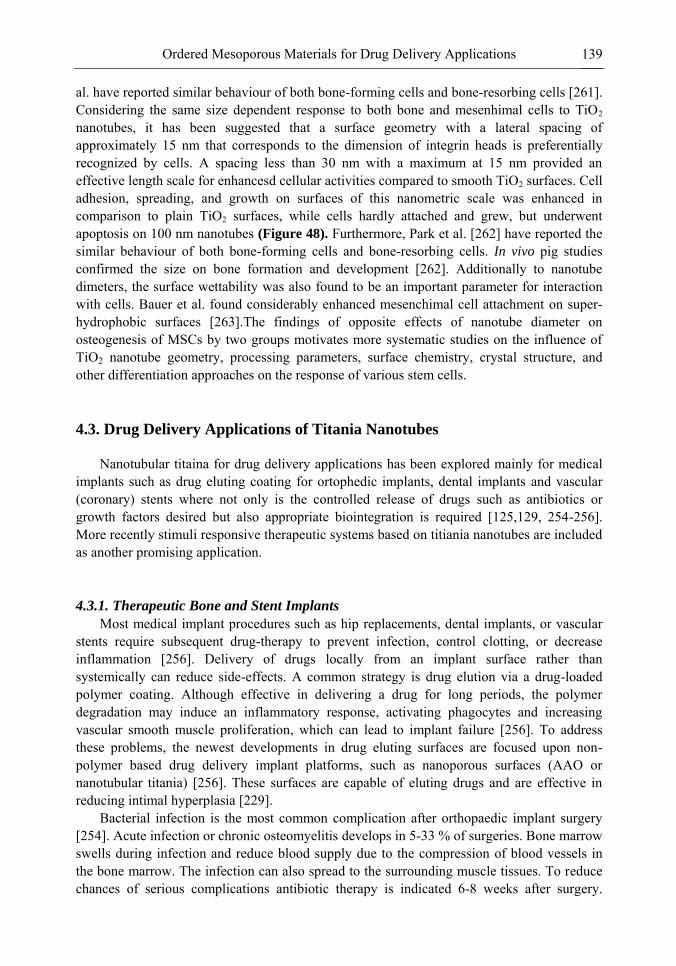
Ordered Mesoporous Materials for Drug Delivery Applications 139
al. have reported similar behaviour of both bone-forming cells and bone-resorbing cells [261]. Considering the same size dependent response to both bone and mesenhimal cells to TiO2 nanotubes, it has been suggested that a surface geometry with a lateral spacing of approximately 15 nm that corresponds to the dimension of integrin heads is preferentially recognized by cells. A spacing less than 30 nm with a maximum at 15 nm provided an effective length scale for enhancesd cellular activities compared to smooth TiO2 surfaces. Cell adhesion, spreading, and growth on surfaces of this nanometric scale was enhanced in comparison to plain TiO2 surfaces, while cells hardly attached and grew, but underwent apoptosis on 100 nm nanotubes (Figure 48). Furthermore, Park et al. [262] have reported the similar behaviour of both bone-forming cells and bone-resorbing cells. In vivo pig studies confirmed the size on bone formation and development [262]. Additionally to nanotube dimeters, the surface wettability was also found to be an important parameter for interaction with cells. Bauer et al. found considerably enhanced mesenchimal cell attachment on super-hydrophobic surfaces [263].The findings of opposite effects of nanotube diameter on osteogenesis of MSCs by two groups motivates more systematic studies on the influence of TiO2 nanotube geometry, processing parameters, surface chemistry, crystal structure, and other differentiation approaches on the response of various stem cells.
4.3. Drug Delivery Applications of Titania Nanotubes Nanotubular titaina for drug delivery applications has been explored mainly for medical
implants such as drug eluting coating for ortophedic implants, dental implants and vascular (coronary) stents where not only is the controlled release of drugs such as antibiotics or growth factors desired but also appropriate biointegration is required [125,129, 254-256]. More recently stimuli responsive therapeutic systems based on titiania nanotubes are included as another promising application.
4.3.1. Therapeutic Bone and Stent Implants
Most medical implant procedures such as hip replacements, dental implants, or vascular stents require subsequent drug-therapy to prevent infection, control clotting, or decrease inflammation [256]. Delivery of drugs locally from an implant surface rather than systemically can reduce side-effects. A common strategy is drug elution via a drug-loaded polymer coating. Although effective in delivering a drug for long periods, the polymer degradation may induce an inflammatory response, activating phagocytes and increasing vascular smooth muscle proliferation, which can lead to implant failure [256]. To address these problems, the newest developments in drug eluting surfaces are focused upon non-polymer based drug delivery implant platforms, such as nanoporous surfaces (AAO or nanotubular titania) [256]. These surfaces are capable of eluting drugs and are effective in reducing intimal hyperplasia [229].
Bacterial infection is the most common complication after orthopaedic implant surgery [254]. Acute infection or chronic osteomyelitis develops in 5-33 % of surgeries. Bone marrow swells during infection and reduce blood supply due to the compression of blood vessels in the bone marrow. The infection can also spread to the surrounding muscle tissues. To reduce chances of serious complications antibiotic therapy is indicated 6-8 weeks after surgery.
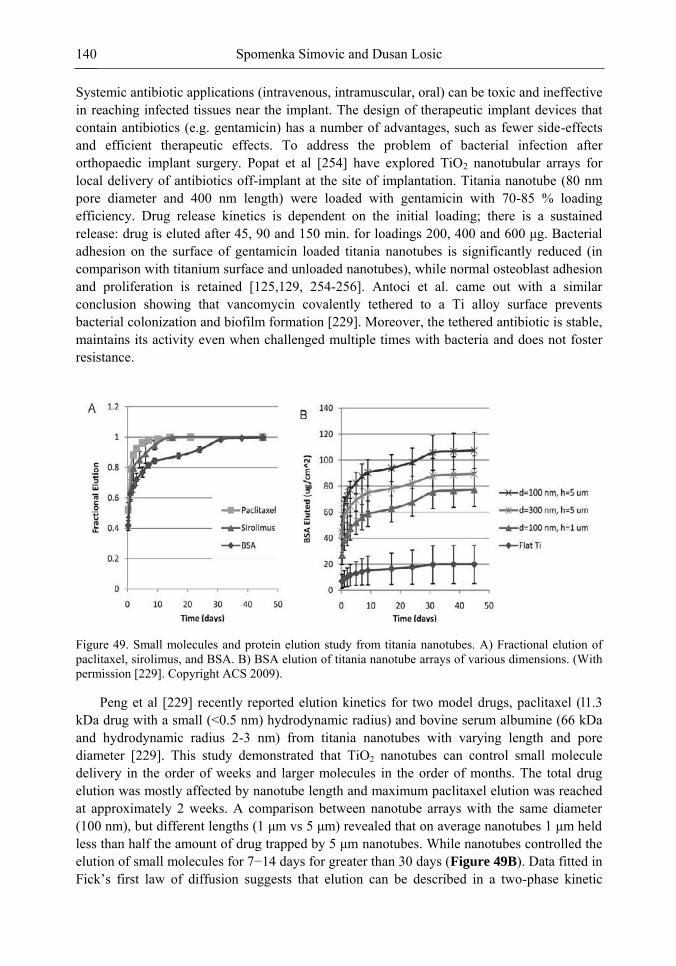
Spomenka Simovic and Dusan Losic 140
Systemic antibiotic applications (intravenous, intramuscular, oral) can be toxic and ineffective in reaching infected tissues near the implant. The design of therapeutic implant devices that contain antibiotics (e.g. gentamicin) has a number of advantages, such as fewer side-effects and efficient therapeutic effects. To address the problem of bacterial infection after orthopaedic implant surgery. Popat et al [254] have explored TiO2 nanotubular arrays for local delivery of antibiotics off-implant at the site of implantation. Titania nanotube (80 nm pore diameter and 400 nm length) were loaded with gentamicin with 70-85 % loading efficiency. Drug release kinetics is dependent on the initial loading; there is a sustained release: drug is eluted after 45, 90 and 150 min. for loadings 200, 400 and 600 μg. Bacterial
adhesion on the surface of gentamicin loaded titania nanotubes is significantly reduced (in comparison with titanium surface and unloaded nanotubes), while normal osteoblast adhesion and proliferation is retained [125,129, 254-256]. Antoci et al. came out with a similar conclusion showing that vancomycin covalently tethered to a Ti alloy surface prevents bacterial colonization and biofilm formation [229]. Moreover, the tethered antibiotic is stable, maintains its activity even when challenged multiple times with bacteria and does not foster resistance.
Figure 49. Small molecules and protein elution study from titania nanotubes. A) Fractional elution of paclitaxel, sirolimus, and BSA. B) BSA elution of titania nanotube arrays of various dimensions. (With permission [229]. Copyright ACS 2009).
Peng et al [229] recently reported elution kinetics for two model drugs, paclitaxel (l1.3 kDa drug with a small (<0.5 nm) hydrodynamic radius) and bovine serum albumine (66 kDa and hydrodynamic radius 2-3 nm) from titania nanotubes with varying length and pore diameter [229]. This study demonstrated that TiO2 nanotubes can control small molecule delivery in the order of weeks and larger molecules in the order of months. The total drug elution was mostly affected by nanotube length and maximum paclitaxel elution was reached at approximately 2 weeks. A comparison between nanotube arrays with the same diameter (100 nm), but different lengths (1 μm vs 5 μm) revealed that on average nanotubes 1 μm held
less than half the amount of drug trapped by 5 μm nanotubes. While nanotubes controlled the elution of small molecules for 7−14 days for greater than 30 days (Figure 49B). Data fitted in Fick‘s first law of diffusion suggests that elution can be described in a two-phase kinetic
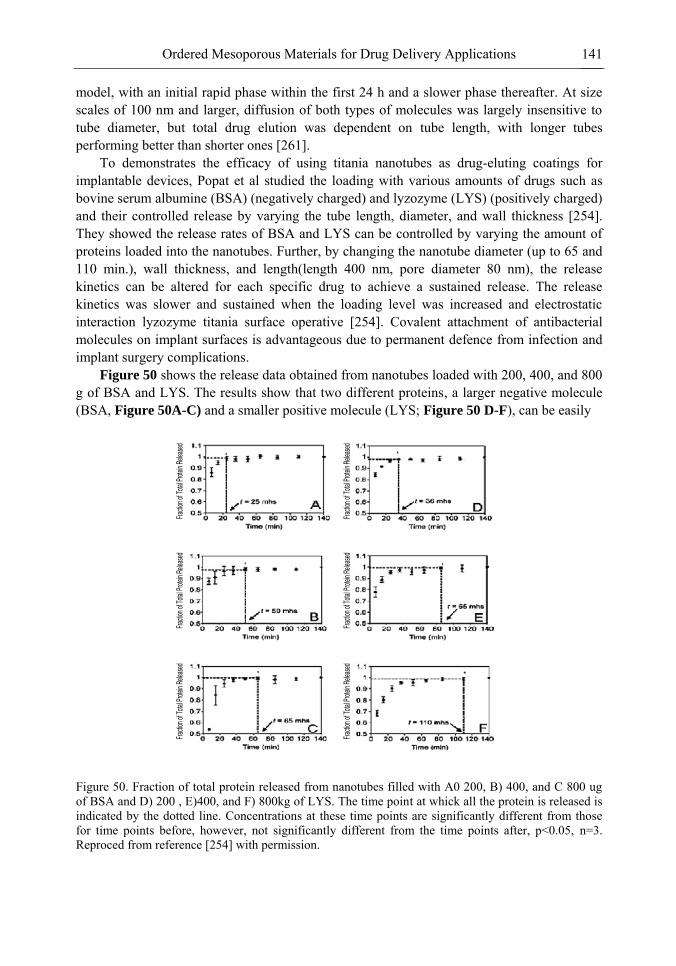
Ordered Mesoporous Materials for Drug Delivery Applications 141
model, with an initial rapid phase within the first 24 h and a slower phase thereafter. At size scales of 100 nm and larger, diffusion of both types of molecules was largely insensitive to tube diameter, but total drug elution was dependent on tube length, with longer tubes performing better than shorter ones [261].
To demonstrates the efficacy of using titania nanotubes as drug-eluting coatings for implantable devices, Popat et al studied the loading with various amounts of drugs such as bovine serum albumine (BSA) (negatively charged) and lyzozyme (LYS) (positively charged) and their controlled release by varying the tube length, diameter, and wall thickness [254]. They showed the release rates of BSA and LYS can be controlled by varying the amount of proteins loaded into the nanotubes. Further, by changing the nanotube diameter (up to 65 and 110 min.), wall thickness, and length(length 400 nm, pore diameter 80 nm), the release kinetics can be altered for each specific drug to achieve a sustained release. The release kinetics was slower and sustained when the loading level was increased and electrostatic interaction lyzozyme titania surface operative [254]. Covalent attachment of antibacterial molecules on implant surfaces is advantageous due to permanent defence from infection and implant surgery complications.
Figure 50 shows the release data obtained from nanotubes loaded with 200, 400, and 800 g of BSA and LYS. The results show that two different proteins, a larger negative molecule (BSA, Figure 50A-C) and a smaller positive molecule (LYS; Figure 50 D-F), can be easily
Figure 50. Fraction of total protein released from nanotubes filled with A0 200, B) 400, and C 800 ug of BSA and D) 200 , E)400, and F) 800kg of LYS. The time point at whick all the protein is released is indicated by the dotted line. Concentrations at these time points are significantly different from those for time points before, however, not significantly different from the time points after, p<0.05, n=3. Reproced from reference [254] with permission.
Fractio
n of T
otal P
rotein
Relea
sed
Fractio
n of T
otal P
rotein
Relea
sed
Fractio
n of T
otal P
rotein
Relea
sed
Fractio
n of T
otal P
rotein
Relea
sed
Fractio
n of T
otal P
rotein
Relea
sed
Fractio
n of T
otal P
rotein
Relea
sed
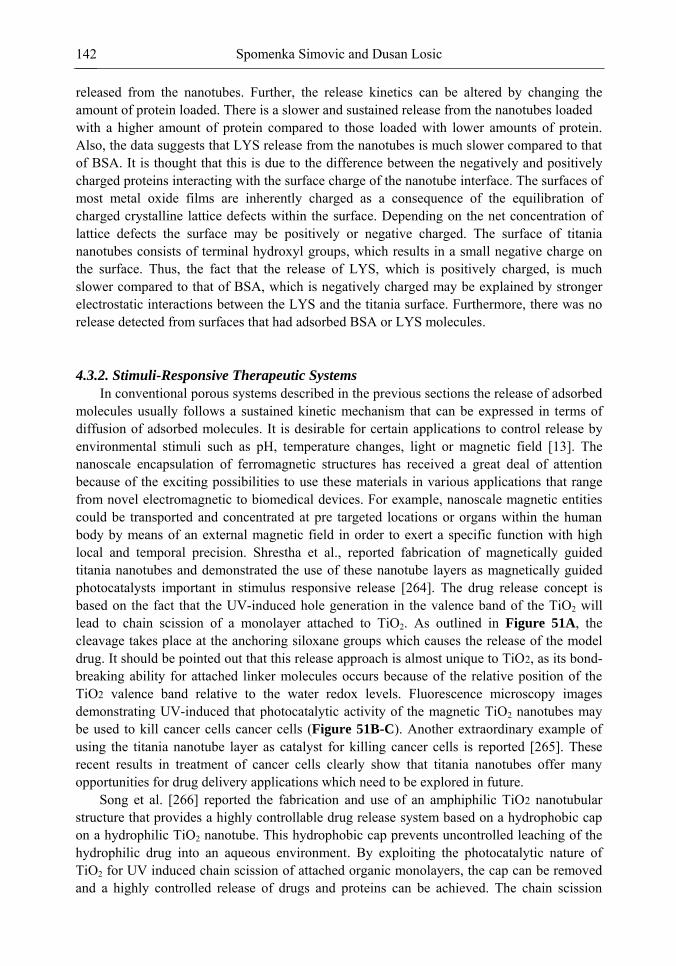
Spomenka Simovic and Dusan Losic 142
released from the nanotubes. Further, the release kinetics can be altered by changing the amount of protein loaded. There is a slower and sustained release from the nanotubes loaded with a higher amount of protein compared to those loaded with lower amounts of protein. Also, the data suggests that LYS release from the nanotubes is much slower compared to that of BSA. It is thought that this is due to the difference between the negatively and positively charged proteins interacting with the surface charge of the nanotube interface. The surfaces of most metal oxide films are inherently charged as a consequence of the equilibration of charged crystalline lattice defects within the surface. Depending on the net concentration of lattice defects the surface may be positively or negative charged. The surface of titania nanotubes consists of terminal hydroxyl groups, which results in a small negative charge on the surface. Thus, the fact that the release of LYS, which is positively charged, is much slower compared to that of BSA, which is negatively charged may be explained by stronger electrostatic interactions between the LYS and the titania surface. Furthermore, there was no release detected from surfaces that had adsorbed BSA or LYS molecules.
4.3.2. Stimuli-Responsive Therapeutic Systems
In conventional porous systems described in the previous sections the release of adsorbed molecules usually follows a sustained kinetic mechanism that can be expressed in terms of diffusion of adsorbed molecules. It is desirable for certain applications to control release by environmental stimuli such as pH, temperature changes, light or magnetic field [13]. The nanoscale encapsulation of ferromagnetic structures has received a great deal of attention because of the exciting possibilities to use these materials in various applications that range from novel electromagnetic to biomedical devices. For example, nanoscale magnetic entities could be transported and concentrated at pre targeted locations or organs within the human body by means of an external magnetic field in order to exert a specific function with high local and temporal precision. Shrestha et al., reported fabrication of magnetically guided titania nanotubes and demonstrated the use of these nanotube layers as magnetically guided photocatalysts important in stimulus responsive release [264]. The drug release concept is based on the fact that the UV-induced hole generation in the valence band of the TiO2 will lead to chain scission of a monolayer attached to TiO2. As outlined in Figure 51A, the cleavage takes place at the anchoring siloxane groups which causes the release of the model drug. It should be pointed out that this release approach is almost unique to TiO2, as its bond-breaking ability for attached linker molecules occurs because of the relative position of the TiO2 valence band relative to the water redox levels. Fluorescence microscopy images demonstrating UV-induced that photocatalytic activity of the magnetic TiO2 nanotubes may be used to kill cancer cells cancer cells (Figure 51B-C). Another extraordinary example of using the titania nanotube layer as catalyst for killing cancer cells is reported [265]. These recent results in treatment of cancer cells clearly show that titania nanotubes offer many opportunities for drug delivery applications which need to be explored in future.
Song et al. [266] reported the fabrication and use of an amphiphilic TiO2 nanotubular structure that provides a highly controllable drug release system based on a hydrophobic cap on a hydrophilic TiO2 nanotube. This hydrophobic cap prevents uncontrolled leaching of the hydrophilic drug into an aqueous environment. By exploiting the photocatalytic nature of TiO2 for UV induced chain scission of attached organic monolayers, the cap can be removed and a highly controlled release of drugs and proteins can be achieved. The chain scission
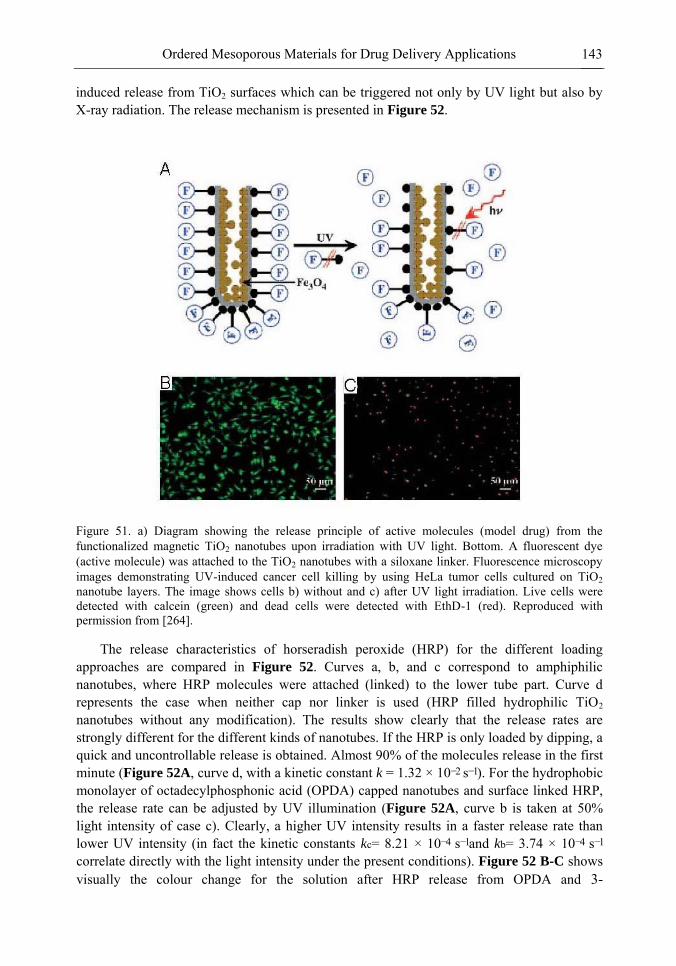
Ordered Mesoporous Materials for Drug Delivery Applications 143
induced release from TiO2 surfaces which can be triggered not only by UV light but also by X-ray radiation. The release mechanism is presented in Figure 52.
Figure 51. a) Diagram showing the release principle of active molecules (model drug) from the functionalized magnetic TiO2 nanotubes upon irradiation with UV light. Bottom. A fluorescent dye (active molecule) was attached to the TiO2 nanotubes with a siloxane linker. Fluorescence microscopy images demonstrating UV-induced cancer cell killing by using HeLa tumor cells cultured on TiO2 nanotube layers. The image shows cells b) without and c) after UV light irradiation. Live cells were detected with calcein (green) and dead cells were detected with EthD-1 (red). Reproduced with permission from [264].
The release characteristics of horseradish peroxide (HRP) for the different loading approaches are compared in Figure 52. Curves a, b, and c correspond to amphiphilic nanotubes, where HRP molecules were attached (linked) to the lower tube part. Curve d represents the case when neither cap nor linker is used (HRP filled hydrophilic TiO2 nanotubes without any modification). The results show clearly that the release rates are strongly different for the different kinds of nanotubes. If the HRP is only loaded by dipping, a quick and uncontrollable release is obtained. Almost 90% of the molecules release in the first minute (Figure 52A, curve d, with a kinetic constant k = 1.32 × 10⁻² s−1). For the hydrophobic monolayer of octadecylphosphonic acid (OPDA) capped nanotubes and surface linked HRP, the release rate can be adjusted by UV illumination (Figure 52A, curve b is taken at 50% light intensity of case c). Clearly, a higher UV intensity results in a faster release rate than lower UV intensity (in fact the kinetic constants kc= 8.21 × 10⁻⁴ s−1and kb= 3.74 × 10⁻⁴ s−1
correlate directly with the light intensity under the present conditions). Figure 52 B-C shows visually the colour change for the solution after HRP release from OPDA and 3-
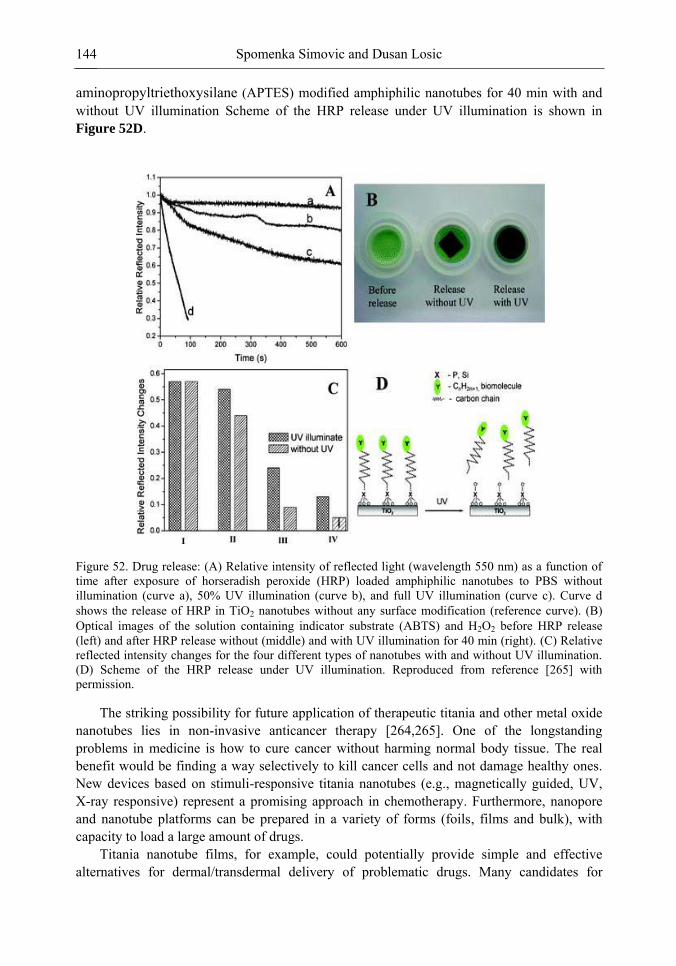
Spomenka Simovic and Dusan Losic 144
aminopropyltriethoxysilane (APTES) modified amphiphilic nanotubes for 40 min with and without UV illumination Scheme of the HRP release under UV illumination is shown in Figure 52D.
Figure 52. Drug release: (A) Relative intensity of reflected light (wavelength 550 nm) as a function of time after exposure of horseradish peroxide (HRP) loaded amphiphilic nanotubes to PBS without illumination (curve a), 50% UV illumination (curve b), and full UV illumination (curve c). Curve d shows the release of HRP in TiO2 nanotubes without any surface modification (reference curve). (B) Optical images of the solution containing indicator substrate (ABTS) and H2O2 before HRP release (left) and after HRP release without (middle) and with UV illumination for 40 min (right). (C) Relative reflected intensity changes for the four different types of nanotubes with and without UV illumination. (D) Scheme of the HRP release under UV illumination. Reproduced from reference [265] with permission.
The striking possibility for future application of therapeutic titania and other metal oxide nanotubes lies in non-invasive anticancer therapy [264,265]. One of the longstanding problems in medicine is how to cure cancer without harming normal body tissue. The real benefit would be finding a way selectively to kill cancer cells and not damage healthy ones. New devices based on stimuli-responsive titania nanotubes (e.g., magnetically guided, UV, X-ray responsive) represent a promising approach in chemotherapy. Furthermore, nanopore and nanotube platforms can be prepared in a variety of forms (foils, films and bulk), with capacity to load a large amount of drugs.
Titania nanotube films, for example, could potentially provide simple and effective alternatives for dermal/transdermal delivery of problematic drugs. Many candidates for
Ordered Mesoporous Materials for Drug Delivery Applications 145
dermal/transdermal application (e.g., vitamins, antioxidants) have poor stability against light, oxidation or physiological pH, and consequently poor bioavailability [8,267]. To overcome this problem, liposomes or emulsions are often applied, which are unstable systems and offer only limited solution, so that the use of nanotube platforms can potentially provide many advantages.
5. CONCLUSION This chapter presents the recent progress on using of porous materials such as mesporous
silica, alumina and nanotubular titania, produced by using various fabrication methods for drug delivery applications. The common characteristic for all those materials is monodisperse porosity and precise control of drug release, i.e. the possibility to precisely control dimensions on a micro and nanoscale, thus enabling innovative design of a new class of drug delivery devices based on such porous materials. These new nanomaterials showed to have many favourable properties for drug delivery including high surface area, controllable pore and nanotube dimensions, geometries and surface chemistry. This multidisciplinary and emerging field combines the areas of nanotechnology, surface chemistry, biomaterials and biomedical engineering. Although still in early stages few in vivo studies clearly show the potential of these materials for drug delivery devices in orthopedics implants, dental implants, and vascular stents, where not only is the controlled release of drugs such as antibiotics or growth factors desired, but also appropriate biointegration is needed. This is only beginning of the further research in terms of correlating biomaterial chemistry and tissue responses and new clinical approaches required not only for orthopaedics, but also treatment for a number of other diseases (hearth, cancer, diabetes, Parkinson‘s, Alzheimer‘s etc). In addition, MEMS
and NEMS, materials science, information technology, ANNs, wireless communication, and biology can all contribute to design of integrated therapeutic systems that have the potential to significantly improve the quality of medical care. Typically, a primary motivator for improved drug delivery systems is the avoidance of repeated parenteral administration. Due to the complexity and cost of device-based methods of administration, if a therapy can be accomplished by oral, pulmonary, or other nonparenteral routes, it is unlikely that sufficient advantage will be gained by introduction of an advanced delivery device.
The future research potentially has multiple directions which include: a) the increasing biocompatibility by covalent immobilisation of therapeutic molecules on the implant surfaces, e.g. anti-bacterial and anti-inflammatory drugs; b) the achieving of controlled and sustained drug elution over long period of the time using specific surface modification, structural design of pores and combining with biocompatible polymers, c) development of stimuli-responsive systems such as magnetic field, light, temperature, pH is particularly important for highly toxic drugs; d) implementation of nanoporous and nanotube membranes or films into microfabrication devices for creating chip based drug delivery platforms is also one of the future directions and e) further studies are necessary to understand how these small systems pass through different barriers in the body and to examine other long-term behaviors, including failure modes and component clearance.
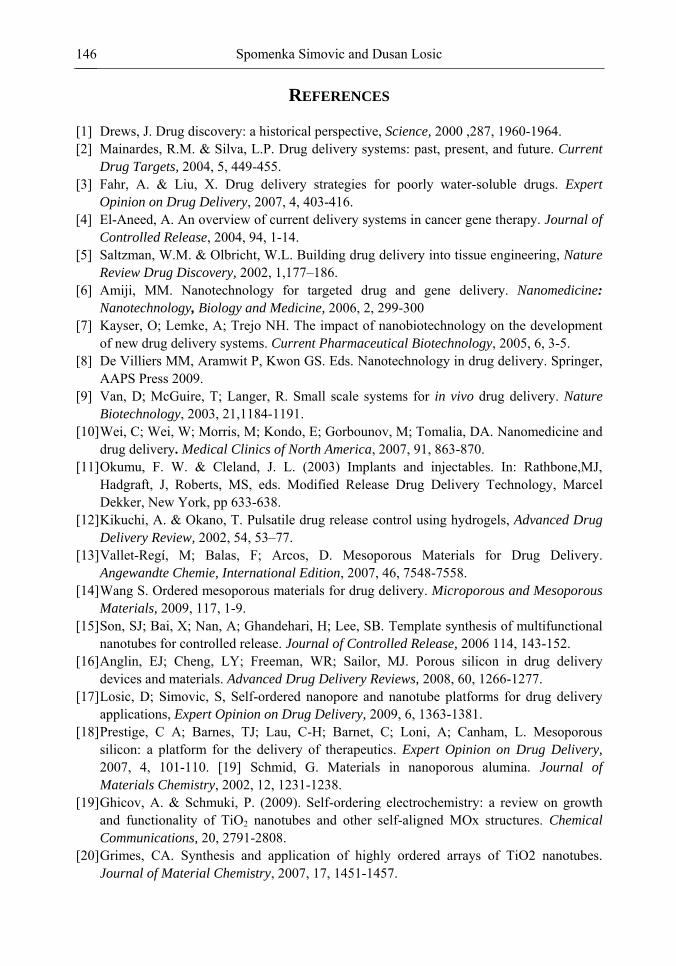
Spomenka Simovic and Dusan Losic 146
REFERENCES [1] Drews, J. Drug discovery: a historical perspective, Science, 2000 ,287, 1960-1964. [2] Mainardes, R.M. & Silva, L.P. Drug delivery systems: past, present, and future. Current
Drug Targets, 2004, 5, 449-455. [3] Fahr, A. & Liu, X. Drug delivery strategies for poorly water-soluble drugs. Expert
Opinion on Drug Delivery, 2007, 4, 403-416. [4] El-Aneed, A. An overview of current delivery systems in cancer gene therapy. Journal of
Controlled Release, 2004, 94, 1-14. [5] Saltzman, W.M. & Olbricht, W.L. Building drug delivery into tissue engineering, Nature
Review Drug Discovery, 2002, 1,177–186. [6] Amiji, MM. Nanotechnology for targeted drug and gene delivery. Nanomedicine:
Nanotechnology, Biology and Medicine, 2006, 2, 299-300 [7] Kayser, O; Lemke, A; Trejo NH. The impact of nanobiotechnology on the development
of new drug delivery systems. Current Pharmaceutical Biotechnology, 2005, 6, 3-5. [8] De Villiers MM, Aramwit P, Kwon GS. Eds. Nanotechnology in drug delivery. Springer,
AAPS Press 2009. [9] Van, D; McGuire, T; Langer, R. Small scale systems for in vivo drug delivery. Nature
Biotechnology, 2003, 21,1184-1191. [10] Wei, C; Wei, W; Morris, M; Kondo, E; Gorbounov, M; Tomalia, DA. Nanomedicine and
drug delivery. Medical Clinics of North America, 2007, 91, 863-870. [11] Okumu, F. W. & Cleland, J. L. (2003) Implants and injectables. In: Rathbone,MJ,
Hadgraft, J, Roberts, MS, eds. Modified Release Drug Delivery Technology, Marcel Dekker, New York, pp 633-638.
[12] Kikuchi, A. & Okano, T. Pulsatile drug release control using hydrogels, Advanced Drug
Delivery Review, 2002, 54, 53–77. [13] Vallet-Regí, M; Balas, F; Arcos, D. Mesoporous Materials for Drug Delivery.
Angewandte Chemie, International Edition, 2007, 46, 7548-7558. [14] Wang S. Ordered mesoporous materials for drug delivery. Microporous and Mesoporous
Materials, 2009, 117, 1-9. [15] Son, SJ; Bai, X; Nan, A; Ghandehari, H; Lee, SB. Template synthesis of multifunctional
nanotubes for controlled release. Journal of Controlled Release, 2006 114, 143-152. [16] Anglin, EJ; Cheng, LY; Freeman, WR; Sailor, MJ. Porous silicon in drug delivery
devices and materials. Advanced Drug Delivery Reviews, 2008, 60, 1266-1277. [17] Losic, D; Simovic, S, Self-ordered nanopore and nanotube platforms for drug delivery
applications, Expert Opinion on Drug Delivery, 2009, 6, 1363-1381. [18] Prestige, C A; Barnes, TJ; Lau, C-H; Barnet, C; Loni, A; Canham, L. Mesoporous
silicon: a platform for the delivery of therapeutics. Expert Opinion on Drug Delivery,
2007, 4, 101-110. [19] Schmid, G. Materials in nanoporous alumina. Journal of
Materials Chemistry, 2002, 12, 1231-1238. [19] Ghicov, A. & Schmuki, P. (2009). Self-ordering electrochemistry: a review on growth
and functionality of TiO2 nanotubes and other self-aligned MOx structures. Chemical
Communications, 20, 2791-2808. [20] Grimes, CA. Synthesis and application of highly ordered arrays of TiO2 nanotubes.
Journal of Material Chemistry, 2007, 17, 1451-1457.
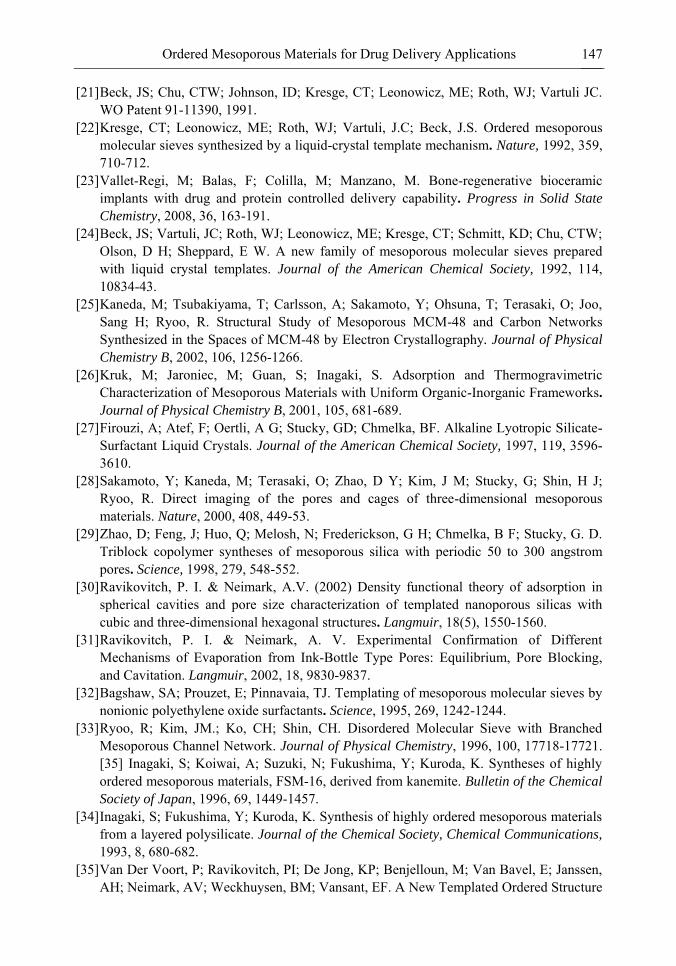
Ordered Mesoporous Materials for Drug Delivery Applications 147
[21] Beck, JS; Chu, CTW; Johnson, ID; Kresge, CT; Leonowicz, ME; Roth, WJ; Vartuli JC. WO Patent 91-11390, 1991.
[22] Kresge, CT; Leonowicz, ME; Roth, WJ; Vartuli, J.C; Beck, J.S. Ordered mesoporous molecular sieves synthesized by a liquid-crystal template mechanism. Nature, 1992, 359, 710-712.
[23] Vallet-Regi, M; Balas, F; Colilla, M; Manzano, M. Bone-regenerative bioceramic implants with drug and protein controlled delivery capability. Progress in Solid State
Chemistry, 2008, 36, 163-191. [24] Beck, JS; Vartuli, JC; Roth, WJ; Leonowicz, ME; Kresge, CT; Schmitt, KD; Chu, CTW;
Olson, D H; Sheppard, E W. A new family of mesoporous molecular sieves prepared with liquid crystal templates. Journal of the American Chemical Society, 1992, 114, 10834-43.
[25] Kaneda, M; Tsubakiyama, T; Carlsson, A; Sakamoto, Y; Ohsuna, T; Terasaki, O; Joo, Sang H; Ryoo, R. Structural Study of Mesoporous MCM-48 and Carbon Networks Synthesized in the Spaces of MCM-48 by Electron Crystallography. Journal of Physical
Chemistry B, 2002, 106, 1256-1266. [26] Kruk, M; Jaroniec, M; Guan, S; Inagaki, S. Adsorption and Thermogravimetric
Characterization of Mesoporous Materials with Uniform Organic-Inorganic Frameworks. Journal of Physical Chemistry B, 2001, 105, 681-689.
[27] Firouzi, A; Atef, F; Oertli, A G; Stucky, GD; Chmelka, BF. Alkaline Lyotropic Silicate-Surfactant Liquid Crystals. Journal of the American Chemical Society, 1997, 119, 3596-3610.
[28] Sakamoto, Y; Kaneda, M; Terasaki, O; Zhao, D Y; Kim, J M; Stucky, G; Shin, H J; Ryoo, R. Direct imaging of the pores and cages of three-dimensional mesoporous materials. Nature, 2000, 408, 449-53.
[29] Zhao, D; Feng, J; Huo, Q; Melosh, N; Frederickson, G H; Chmelka, B F; Stucky, G. D. Triblock copolymer syntheses of mesoporous silica with periodic 50 to 300 angstrom pores. Science, 1998, 279, 548-552.
[30] Ravikovitch, P. I. & Neimark, A.V. (2002) Density functional theory of adsorption in spherical cavities and pore size characterization of templated nanoporous silicas with cubic and three-dimensional hexagonal structures. Langmuir, 18(5), 1550-1560.
[31] Ravikovitch, P. I. & Neimark, A. V. Experimental Confirmation of Different Mechanisms of Evaporation from Ink-Bottle Type Pores: Equilibrium, Pore Blocking, and Cavitation. Langmuir, 2002, 18, 9830-9837.
[32] Bagshaw, SA; Prouzet, E; Pinnavaia, TJ. Templating of mesoporous molecular sieves by nonionic polyethylene oxide surfactants. Science, 1995, 269, 1242-1244.
[33] Ryoo, R; Kim, JM.; Ko, CH; Shin, CH. Disordered Molecular Sieve with Branched Mesoporous Channel Network. Journal of Physical Chemistry, 1996, 100, 17718-17721. [35] Inagaki, S; Koiwai, A; Suzuki, N; Fukushima, Y; Kuroda, K. Syntheses of highly ordered mesoporous materials, FSM-16, derived from kanemite. Bulletin of the Chemical
Society of Japan, 1996, 69, 1449-1457. [34] Inagaki, S; Fukushima, Y; Kuroda, K. Synthesis of highly ordered mesoporous materials
from a layered polysilicate. Journal of the Chemical Society, Chemical Communications,
1993, 8, 680-682. [35] Van Der Voort, P; Ravikovitch, PI; De Jong, KP; Benjelloun, M; Van Bavel, E; Janssen,
AH; Neimark, AV; Weckhuysen, BM; Vansant, EF. A New Templated Ordered Structure
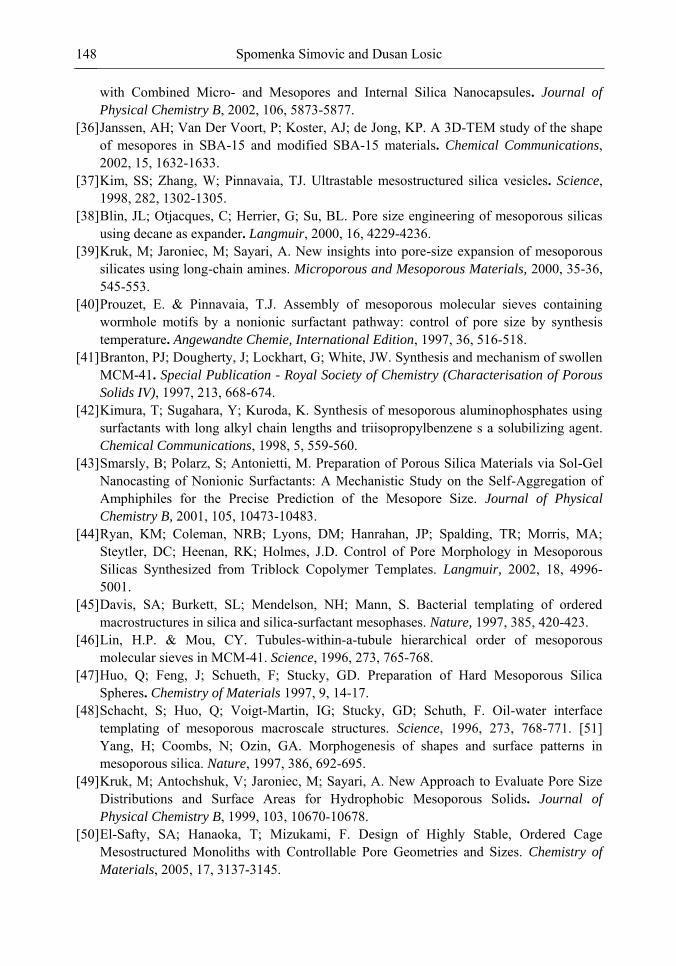
Spomenka Simovic and Dusan Losic 148
with Combined Micro- and Mesopores and Internal Silica Nanocapsules. Journal of
Physical Chemistry B, 2002, 106, 5873-5877. [36] Janssen, AH; Van Der Voort, P; Koster, AJ; de Jong, KP. A 3D-TEM study of the shape
of mesopores in SBA-15 and modified SBA-15 materials. Chemical Communications, 2002, 15, 1632-1633.
[37] Kim, SS; Zhang, W; Pinnavaia, TJ. Ultrastable mesostructured silica vesicles. Science, 1998, 282, 1302-1305.
[38] Blin, JL; Otjacques, C; Herrier, G; Su, BL. Pore size engineering of mesoporous silicas using decane as expander. Langmuir, 2000, 16, 4229-4236.
[39] Kruk, M; Jaroniec, M; Sayari, A. New insights into pore-size expansion of mesoporous silicates using long-chain amines. Microporous and Mesoporous Materials, 2000, 35-36, 545-553.
[40] Prouzet, E. & Pinnavaia, T.J. Assembly of mesoporous molecular sieves containing wormhole motifs by a nonionic surfactant pathway: control of pore size by synthesis temperature. Angewandte Chemie, International Edition, 1997, 36, 516-518.
[41] Branton, PJ; Dougherty, J; Lockhart, G; White, JW. Synthesis and mechanism of swollen MCM-41. Special Publication - Royal Society of Chemistry (Characterisation of Porous
Solids IV), 1997, 213, 668-674. [42] Kimura, T; Sugahara, Y; Kuroda, K. Synthesis of mesoporous aluminophosphates using
surfactants with long alkyl chain lengths and triisopropylbenzene s a solubilizing agent. Chemical Communications, 1998, 5, 559-560.
[43] Smarsly, B; Polarz, S; Antonietti, M. Preparation of Porous Silica Materials via Sol-Gel Nanocasting of Nonionic Surfactants: A Mechanistic Study on the Self-Aggregation of Amphiphiles for the Precise Prediction of the Mesopore Size. Journal of Physical
Chemistry B, 2001, 105, 10473-10483. [44] Ryan, KM; Coleman, NRB; Lyons, DM; Hanrahan, JP; Spalding, TR; Morris, MA;
Steytler, DC; Heenan, RK; Holmes, J.D. Control of Pore Morphology in Mesoporous Silicas Synthesized from Triblock Copolymer Templates. Langmuir, 2002, 18, 4996-5001.
[45] Davis, SA; Burkett, SL; Mendelson, NH; Mann, S. Bacterial templating of ordered macrostructures in silica and silica-surfactant mesophases. Nature, 1997, 385, 420-423.
[46] Lin, H.P. & Mou, CY. Tubules-within-a-tubule hierarchical order of mesoporous molecular sieves in MCM-41. Science, 1996, 273, 765-768.
[47] Huo, Q; Feng, J; Schueth, F; Stucky, GD. Preparation of Hard Mesoporous Silica Spheres. Chemistry of Materials 1997, 9, 14-17.
[48] Schacht, S; Huo, Q; Voigt-Martin, IG; Stucky, GD; Schuth, F. Oil-water interface templating of mesoporous macroscale structures. Science, 1996, 273, 768-771. [51] Yang, H; Coombs, N; Ozin, GA. Morphogenesis of shapes and surface patterns in mesoporous silica. Nature, 1997, 386, 692-695.
[49] Kruk, M; Antochshuk, V; Jaroniec, M; Sayari, A. New Approach to Evaluate Pore Size Distributions and Surface Areas for Hydrophobic Mesoporous Solids. Journal of
Physical Chemistry B, 1999, 103, 10670-10678. [50] El-Safty, SA; Hanaoka, T; Mizukami, F. Design of Highly Stable, Ordered Cage
Mesostructured Monoliths with Controllable Pore Geometries and Sizes. Chemistry of
Materials, 2005, 17, 3137-3145.
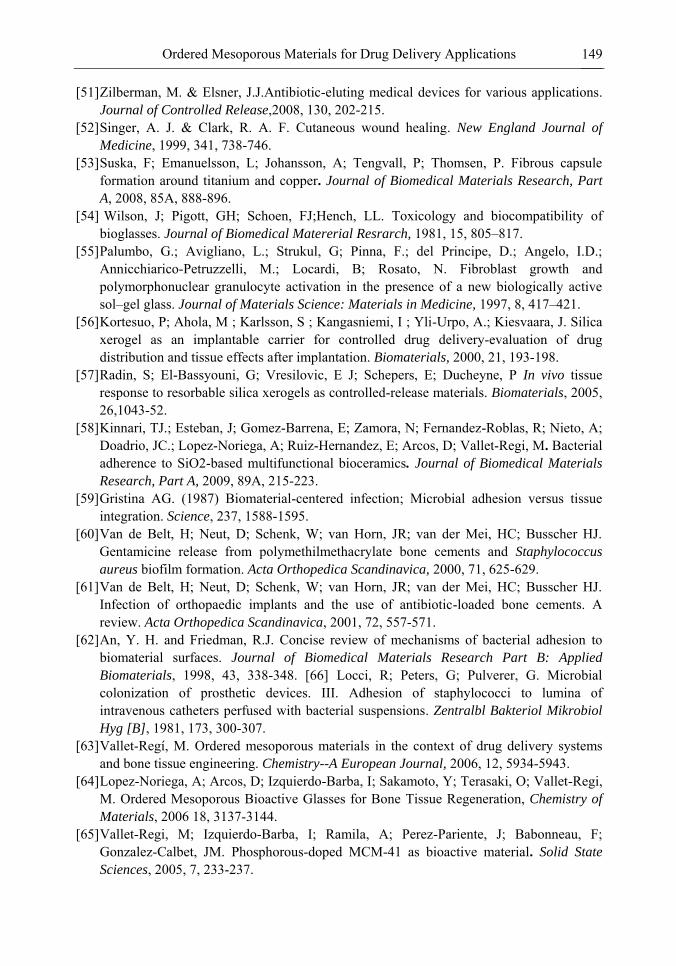
Ordered Mesoporous Materials for Drug Delivery Applications 149
[51] Zilberman, M. & Elsner, J.J.Antibiotic-eluting medical devices for various applications. Journal of Controlled Release,2008, 130, 202-215.
[52] Singer, A. J. & Clark, R. A. F. Cutaneous wound healing. New England Journal of
Medicine, 1999, 341, 738-746. [53] Suska, F; Emanuelsson, L; Johansson, A; Tengvall, P; Thomsen, P. Fibrous capsule
formation around titanium and copper. Journal of Biomedical Materials Research, Part
A, 2008, 85A, 888-896. [54] Wilson, J; Pigott, GH; Schoen, FJ;Hench, LL. Toxicology and biocompatibility of
bioglasses. Journal of Biomedical Matererial Resrarch, 1981, 15, 805–817. [55] Palumbo, G.; Avigliano, L.; Strukul, G; Pinna, F.; del Principe, D.; Angelo, I.D.;
Annicchiarico-Petruzzelli, M.; Locardi, B; Rosato, N. Fibroblast growth and polymorphonuclear granulocyte activation in the presence of a new biologically active sol–gel glass. Journal of Materials Science: Materials in Medicine, 1997, 8, 417–421.
[56] Kortesuo, P; Ahola, M ; Karlsson, S ; Kangasniemi, I ; Yli-Urpo, A.; Kiesvaara, J. Silica xerogel as an implantable carrier for controlled drug delivery-evaluation of drug distribution and tissue effects after implantation. Biomaterials, 2000, 21, 193-198.
[57] Radin, S; El-Bassyouni, G; Vresilovic, E J; Schepers, E; Ducheyne, P In vivo tissue response to resorbable silica xerogels as controlled-release materials. Biomaterials, 2005, 26,1043-52.
[58] Kinnari, TJ.; Esteban, J; Gomez-Barrena, E; Zamora, N; Fernandez-Roblas, R; Nieto, A; Doadrio, JC.; Lopez-Noriega, A; Ruiz-Hernandez, E; Arcos, D; Vallet-Regi, M. Bacterial adherence to SiO2-based multifunctional bioceramics. Journal of Biomedical Materials
Research, Part A, 2009, 89A, 215-223. [59] Gristina AG. (1987) Biomaterial-centered infection; Microbial adhesion versus tissue
integration. Science, 237, 1588-1595. [60] Van de Belt, H; Neut, D; Schenk, W; van Horn, JR; van der Mei, HC; Busscher HJ.
Gentamicine release from polymethilmethacrylate bone cements and Staphylococcus
aureus biofilm formation. Acta Orthopedica Scandinavica, 2000, 71, 625-629. [61] Van de Belt, H; Neut, D; Schenk, W; van Horn, JR; van der Mei, HC; Busscher HJ.
Infection of orthopaedic implants and the use of antibiotic-loaded bone cements. A review. Acta Orthopedica Scandinavica, 2001, 72, 557-571.
[62] An, Y. H. and Friedman, R.J. Concise review of mechanisms of bacterial adhesion to biomaterial surfaces. Journal of Biomedical Materials Research Part B: Applied
Biomaterials, 1998, 43, 338-348. [66] Locci, R; Peters, G; Pulverer, G. Microbial colonization of prosthetic devices. III. Adhesion of staphylococci to lumina of intravenous catheters perfused with bacterial suspensions. Zentralbl Bakteriol Mikrobiol
Hyg [B], 1981, 173, 300-307. [63] Vallet-Regí, M. Ordered mesoporous materials in the context of drug delivery systems
and bone tissue engineering. Chemistry--A European Journal, 2006, 12, 5934-5943. [64] Lopez-Noriega, A; Arcos, D; Izquierdo-Barba, I; Sakamoto, Y; Terasaki, O; Vallet-Regi,
M. Ordered Mesoporous Bioactive Glasses for Bone Tissue Regeneration, Chemistry of
Materials, 2006 18, 3137-3144. [65] Vallet-Regi, M; Izquierdo-Barba, I; Ramila, A; Perez-Pariente, J; Babonneau, F;
Gonzalez-Calbet, JM. Phosphorous-doped MCM-41 as bioactive material. Solid State
Sciences, 2005, 7, 233-237.
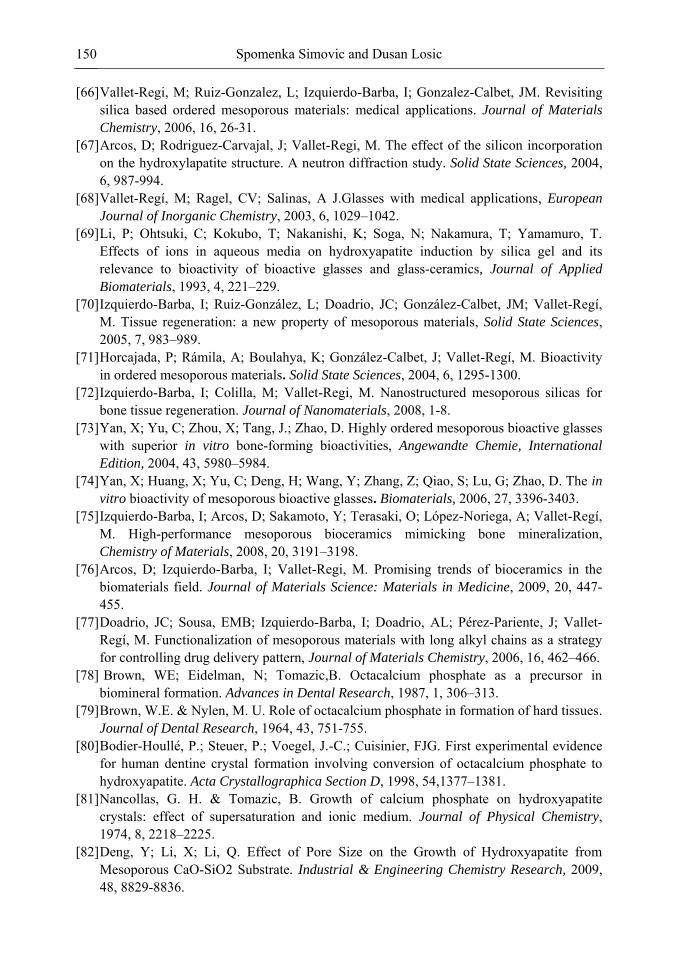
Spomenka Simovic and Dusan Losic 150
[66] Vallet-Regi, M; Ruiz-Gonzalez, L; Izquierdo-Barba, I; Gonzalez-Calbet, JM. Revisiting silica based ordered mesoporous materials: medical applications. Journal of Materials
Chemistry, 2006, 16, 26-31. [67] Arcos, D; Rodriguez-Carvajal, J; Vallet-Regi, M. The effect of the silicon incorporation
on the hydroxylapatite structure. A neutron diffraction study. Solid State Sciences, 2004, 6, 987-994.
[68] Vallet-Regí, M; Ragel, CV; Salinas, A J.Glasses with medical applications, European
Journal of Inorganic Chemistry, 2003, 6, 1029–1042. [69] Li, P; Ohtsuki, C; Kokubo, T; Nakanishi, K; Soga, N; Nakamura, T; Yamamuro, T.
Effects of ions in aqueous media on hydroxyapatite induction by silica gel and its relevance to bioactivity of bioactive glasses and glass-ceramics, Journal of Applied
Biomaterials, 1993, 4, 221–229. [70] Izquierdo-Barba, I; Ruiz-González, L; Doadrio, JC; González-Calbet, JM; Vallet-Regí,
M. Tissue regeneration: a new property of mesoporous materials, Solid State Sciences, 2005, 7, 983–989.
[71] Horcajada, P; Rámila, A; Boulahya, K; González-Calbet, J; Vallet-Regí, M. Bioactivity in ordered mesoporous materials. Solid State Sciences, 2004, 6, 1295-1300.
[72] Izquierdo-Barba, I; Colilla, M; Vallet-Regi, M. Nanostructured mesoporous silicas for bone tissue regeneration. Journal of Nanomaterials, 2008, 1-8.
[73] Yan, X; Yu, C; Zhou, X; Tang, J.; Zhao, D. Highly ordered mesoporous bioactive glasses with superior in vitro bone-forming bioactivities, Angewandte Chemie, International
Edition, 2004, 43, 5980–5984. [74] Yan, X; Huang, X; Yu, C; Deng, H; Wang, Y; Zhang, Z; Qiao, S; Lu, G; Zhao, D. The in
vitro bioactivity of mesoporous bioactive glasses. Biomaterials, 2006, 27, 3396-3403. [75] Izquierdo-Barba, I; Arcos, D; Sakamoto, Y; Terasaki, O; López-Noriega, A; Vallet-Regí,
M. High-performance mesoporous bioceramics mimicking bone mineralization, Chemistry of Materials, 2008, 20, 3191–3198.
[76] Arcos, D; Izquierdo-Barba, I; Vallet-Regi, M. Promising trends of bioceramics in the biomaterials field. Journal of Materials Science: Materials in Medicine, 2009, 20, 447-455.
[77] Doadrio, JC; Sousa, EMB; Izquierdo-Barba, I; Doadrio, AL; Pérez-Pariente, J; Vallet-Regí, M. Functionalization of mesoporous materials with long alkyl chains as a strategy for controlling drug delivery pattern, Journal of Materials Chemistry, 2006, 16, 462–466.
[78] Brown, WE; Eidelman, N; Tomazic,B. Octacalcium phosphate as a precursor in biomineral formation. Advances in Dental Research, 1987, 1, 306–313.
[79] Brown, W.E. & Nylen, M. U. Role of octacalcium phosphate in formation of hard tissues. Journal of Dental Research, 1964, 43, 751-755.
[80] Bodier-Houllé, P.; Steuer, P.; Voegel, J.-C.; Cuisinier, FJG. First experimental evidence for human dentine crystal formation involving conversion of octacalcium phosphate to hydroxyapatite. Acta Crystallographica Section D, 1998, 54,1377–1381.
[81] Nancollas, G. H. & Tomazic, B. Growth of calcium phosphate on hydroxyapatite crystals: effect of supersaturation and ionic medium. Journal of Physical Chemistry, 1974, 8, 2218–2225.
[82] Deng, Y; Li, X; Li, Q. Effect of Pore Size on the Growth of Hydroxyapatite from Mesoporous CaO-SiO2 Substrate. Industrial & Engineering Chemistry Research, 2009, 48, 8829-8836.
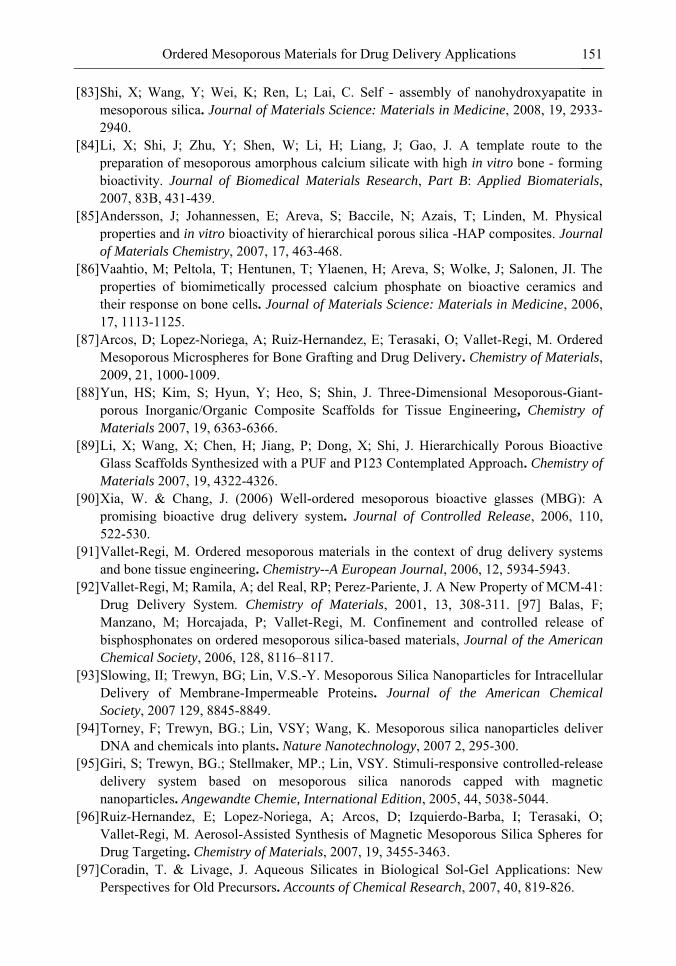
Ordered Mesoporous Materials for Drug Delivery Applications 151
[83] Shi, X; Wang, Y; Wei, K; Ren, L; Lai, C. Self - assembly of nanohydroxyapatite in mesoporous silica. Journal of Materials Science: Materials in Medicine, 2008, 19, 2933-2940.
[84] Li, X; Shi, J; Zhu, Y; Shen, W; Li, H; Liang, J; Gao, J. A template route to the preparation of mesoporous amorphous calcium silicate with high in vitro bone - forming bioactivity. Journal of Biomedical Materials Research, Part B: Applied Biomaterials, 2007, 83B, 431-439.
[85] Andersson, J; Johannessen, E; Areva, S; Baccile, N; Azais, T; Linden, M. Physical properties and in vitro bioactivity of hierarchical porous silica -HAP composites. Journal
of Materials Chemistry, 2007, 17, 463-468. [86] Vaahtio, M; Peltola, T; Hentunen, T; Ylaenen, H; Areva, S; Wolke, J; Salonen, JI. The
properties of biomimetically processed calcium phosphate on bioactive ceramics and their response on bone cells. Journal of Materials Science: Materials in Medicine, 2006, 17, 1113-1125.
[87] Arcos, D; Lopez-Noriega, A; Ruiz-Hernandez, E; Terasaki, O; Vallet-Regi, M. Ordered Mesoporous Microspheres for Bone Grafting and Drug Delivery. Chemistry of Materials, 2009, 21, 1000-1009.
[88] Yun, HS; Kim, S; Hyun, Y; Heo, S; Shin, J. Three-Dimensional Mesoporous-Giant-porous Inorganic/Organic Composite Scaffolds for Tissue Engineering, Chemistry of
Materials 2007, 19, 6363-6366. [89] Li, X; Wang, X; Chen, H; Jiang, P; Dong, X; Shi, J. Hierarchically Porous Bioactive
Glass Scaffolds Synthesized with a PUF and P123 Contemplated Approach. Chemistry of
Materials 2007, 19, 4322-4326. [90] Xia, W. & Chang, J. (2006) Well-ordered mesoporous bioactive glasses (MBG): A
promising bioactive drug delivery system. Journal of Controlled Release, 2006, 110, 522-530.
[91] Vallet-Regi, M. Ordered mesoporous materials in the context of drug delivery systems and bone tissue engineering. Chemistry--A European Journal, 2006, 12, 5934-5943.
[92] Vallet-Regi, M; Ramila, A; del Real, RP; Perez-Pariente, J. A New Property of MCM-41: Drug Delivery System. Chemistry of Materials, 2001, 13, 308-311. [97] Balas, F; Manzano, M; Horcajada, P; Vallet-Regi, M. Confinement and controlled release of bisphosphonates on ordered mesoporous silica-based materials, Journal of the American
Chemical Society, 2006, 128, 8116–8117. [93] Slowing, II; Trewyn, BG; Lin, V.S.-Y. Mesoporous Silica Nanoparticles for Intracellular
Delivery of Membrane-Impermeable Proteins. Journal of the American Chemical
Society, 2007 129, 8845-8849. [94] Torney, F; Trewyn, BG.; Lin, VSY; Wang, K. Mesoporous silica nanoparticles deliver
DNA and chemicals into plants. Nature Nanotechnology, 2007 2, 295-300. [95] Giri, S; Trewyn, BG.; Stellmaker, MP.; Lin, VSY. Stimuli-responsive controlled-release
delivery system based on mesoporous silica nanorods capped with magnetic nanoparticles. Angewandte Chemie, International Edition, 2005, 44, 5038-5044.
[96] Ruiz-Hernandez, E; Lopez-Noriega, A; Arcos, D; Izquierdo-Barba, I; Terasaki, O; Vallet-Regi, M. Aerosol-Assisted Synthesis of Magnetic Mesoporous Silica Spheres for Drug Targeting. Chemistry of Materials, 2007, 19, 3455-3463.
[97] Coradin, T. & Livage, J. Aqueous Silicates in Biological Sol-Gel Applications: New Perspectives for Old Precursors. Accounts of Chemical Research, 2007, 40, 819-826.
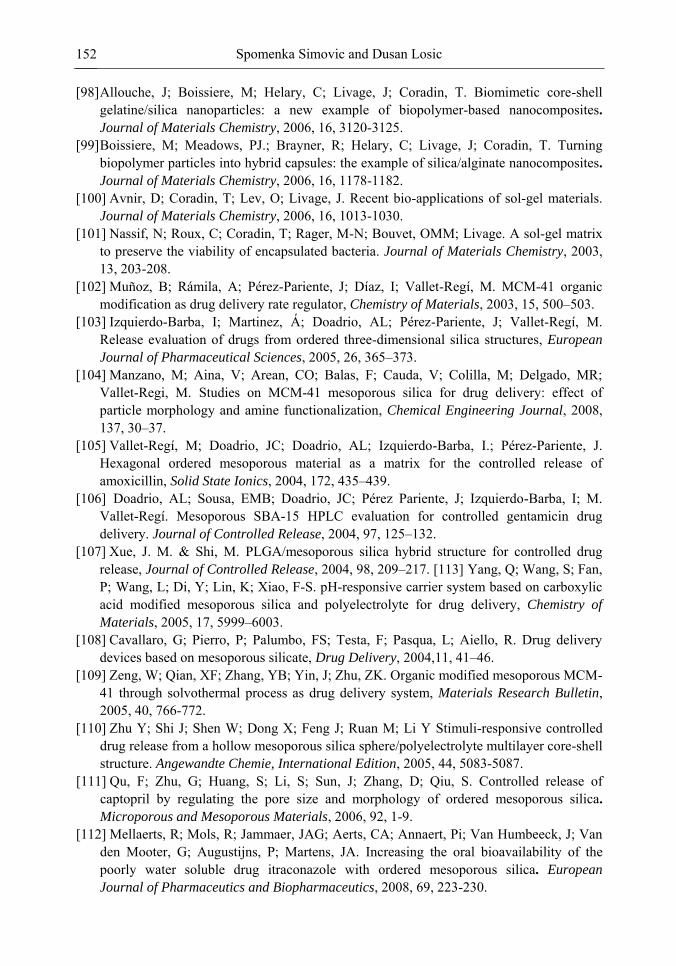
Spomenka Simovic and Dusan Losic 152
[98] Allouche, J; Boissiere, M; Helary, C; Livage, J; Coradin, T. Biomimetic core-shell gelatine/silica nanoparticles: a new example of biopolymer-based nanocomposites. Journal of Materials Chemistry, 2006, 16, 3120-3125.
[99] Boissiere, M; Meadows, PJ.; Brayner, R; Helary, C; Livage, J; Coradin, T. Turning biopolymer particles into hybrid capsules: the example of silica/alginate nanocomposites. Journal of Materials Chemistry, 2006, 16, 1178-1182.
[100] Avnir, D; Coradin, T; Lev, O; Livage, J. Recent bio-applications of sol-gel materials. Journal of Materials Chemistry, 2006, 16, 1013-1030.
[101] Nassif, N; Roux, C; Coradin, T; Rager, M-N; Bouvet, OMM; Livage. A sol-gel matrix to preserve the viability of encapsulated bacteria. Journal of Materials Chemistry, 2003, 13, 203-208.
[102] Muñoz, B; Rámila, A; Pérez-Pariente, J; Díaz, I; Vallet-Regí, M. MCM-41 organic modification as drug delivery rate regulator, Chemistry of Materials, 2003, 15, 500–503.
[103] Izquierdo-Barba, I; Martinez, Á; Doadrio, AL; Pérez-Pariente, J; Vallet-Regí, M. Release evaluation of drugs from ordered three-dimensional silica structures, European
Journal of Pharmaceutical Sciences, 2005, 26, 365–373. [104] Manzano, M; Aina, V; Arean, CO; Balas, F; Cauda, V; Colilla, M; Delgado, MR;
Vallet-Regi, M. Studies on MCM-41 mesoporous silica for drug delivery: effect of particle morphology and amine functionalization, Chemical Engineering Journal, 2008, 137, 30–37.
[105] Vallet-Regí, M; Doadrio, JC; Doadrio, AL; Izquierdo-Barba, I.; Pérez-Pariente, J. Hexagonal ordered mesoporous material as a matrix for the controlled release of amoxicillin, Solid State Ionics, 2004, 172, 435–439.
[106] Doadrio, AL; Sousa, EMB; Doadrio, JC; Pérez Pariente, J; Izquierdo-Barba, I; M. Vallet-Regí. Mesoporous SBA-15 HPLC evaluation for controlled gentamicin drug delivery. Journal of Controlled Release, 2004, 97, 125–132.
[107] Xue, J. M. & Shi, M. PLGA/mesoporous silica hybrid structure for controlled drug release, Journal of Controlled Release, 2004, 98, 209–217. [113] Yang, Q; Wang, S; Fan, P; Wang, L; Di, Y; Lin, K; Xiao, F-S. pH-responsive carrier system based on carboxylic acid modified mesoporous silica and polyelectrolyte for drug delivery, Chemistry of
Materials, 2005, 17, 5999–6003. [108] Cavallaro, G; Pierro, P; Palumbo, FS; Testa, F; Pasqua, L; Aiello, R. Drug delivery
devices based on mesoporous silicate, Drug Delivery, 2004,11, 41–46. [109] Zeng, W; Qian, XF; Zhang, YB; Yin, J; Zhu, ZK. Organic modified mesoporous MCM-
41 through solvothermal process as drug delivery system, Materials Research Bulletin, 2005, 40, 766-772.
[110] Zhu Y; Shi J; Shen W; Dong X; Feng J; Ruan M; Li Y Stimuli-responsive controlled drug release from a hollow mesoporous silica sphere/polyelectrolyte multilayer core-shell structure. Angewandte Chemie, International Edition, 2005, 44, 5083-5087.
[111] Qu, F; Zhu, G; Huang, S; Li, S; Sun, J; Zhang, D; Qiu, S. Controlled release of captopril by regulating the pore size and morphology of ordered mesoporous silica. Microporous and Mesoporous Materials, 2006, 92, 1-9.
[112] Mellaerts, R; Mols, R; Jammaer, JAG; Aerts, CA; Annaert, Pi; Van Humbeeck, J; Van den Mooter, G; Augustijns, P; Martens, JA. Increasing the oral bioavailability of the poorly water soluble drug itraconazole with ordered mesoporous silica. European
Journal of Pharmaceutics and Biopharmaceutics, 2008, 69, 223-230.
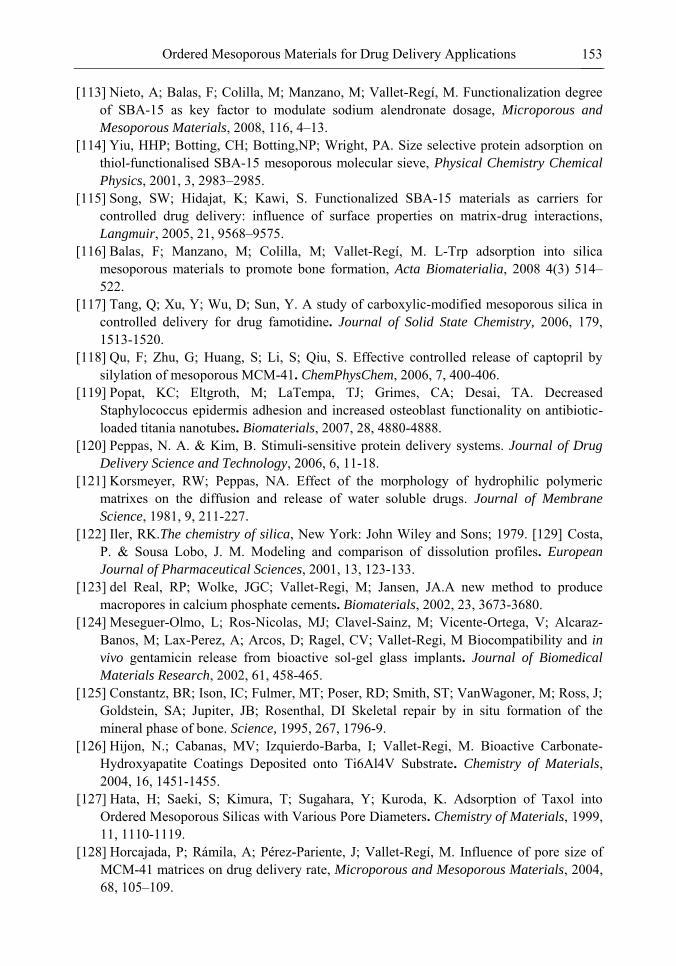
Ordered Mesoporous Materials for Drug Delivery Applications 153
[113] Nieto, A; Balas, F; Colilla, M; Manzano, M; Vallet-Regí, M. Functionalization degree of SBA-15 as key factor to modulate sodium alendronate dosage, Microporous and
Mesoporous Materials, 2008, 116, 4–13. [114] Yiu, HHP; Botting, CH; Botting,NP; Wright, PA. Size selective protein adsorption on
thiol-functionalised SBA-15 mesoporous molecular sieve, Physical Chemistry Chemical
Physics, 2001, 3, 2983–2985. [115] Song, SW; Hidajat, K; Kawi, S. Functionalized SBA-15 materials as carriers for
controlled drug delivery: influence of surface properties on matrix-drug interactions, Langmuir, 2005, 21, 9568–9575.
[116] Balas, F; Manzano, M; Colilla, M; Vallet-Regí, M. L-Trp adsorption into silica mesoporous materials to promote bone formation, Acta Biomaterialia, 2008 4(3) 514–
522. [117] Tang, Q; Xu, Y; Wu, D; Sun, Y. A study of carboxylic-modified mesoporous silica in
controlled delivery for drug famotidine. Journal of Solid State Chemistry, 2006, 179, 1513-1520.
[118] Qu, F; Zhu, G; Huang, S; Li, S; Qiu, S. Effective controlled release of captopril by silylation of mesoporous MCM-41. ChemPhysChem, 2006, 7, 400-406.
[119] Popat, KC; Eltgroth, M; LaTempa, TJ; Grimes, CA; Desai, TA. Decreased Staphylococcus epidermis adhesion and increased osteoblast functionality on antibiotic-loaded titania nanotubes. Biomaterials, 2007, 28, 4880-4888.
[120] Peppas, N. A. & Kim, B. Stimuli-sensitive protein delivery systems. Journal of Drug
Delivery Science and Technology, 2006, 6, 11-18. [121] Korsmeyer, RW; Peppas, NA. Effect of the morphology of hydrophilic polymeric
matrixes on the diffusion and release of water soluble drugs. Journal of Membrane
Science, 1981, 9, 211-227. [122] Iler, RK.The chemistry of silica, New York: John Wiley and Sons; 1979. [129] Costa,
P. & Sousa Lobo, J. M. Modeling and comparison of dissolution profiles. European
Journal of Pharmaceutical Sciences, 2001, 13, 123-133. [123] del Real, RP; Wolke, JGC; Vallet-Regi, M; Jansen, JA.A new method to produce
macropores in calcium phosphate cements. Biomaterials, 2002, 23, 3673-3680. [124] Meseguer-Olmo, L; Ros-Nicolas, MJ; Clavel-Sainz, M; Vicente-Ortega, V; Alcaraz-
Banos, M; Lax-Perez, A; Arcos, D; Ragel, CV; Vallet-Regi, M Biocompatibility and in
vivo gentamicin release from bioactive sol-gel glass implants. Journal of Biomedical
Materials Research, 2002, 61, 458-465. [125] Constantz, BR; Ison, IC; Fulmer, MT; Poser, RD; Smith, ST; VanWagoner, M; Ross, J;
Goldstein, SA; Jupiter, JB; Rosenthal, DI Skeletal repair by in situ formation of the mineral phase of bone. Science, 1995, 267, 1796-9.
[126] Hijon, N.; Cabanas, MV; Izquierdo-Barba, I; Vallet-Regi, M. Bioactive Carbonate-Hydroxyapatite Coatings Deposited onto Ti6Al4V Substrate. Chemistry of Materials, 2004, 16, 1451-1455.
[127] Hata, H; Saeki, S; Kimura, T; Sugahara, Y; Kuroda, K. Adsorption of Taxol into Ordered Mesoporous Silicas with Various Pore Diameters. Chemistry of Materials, 1999, 11, 1110-1119.
[128] Horcajada, P; Rámila, A; Pérez-Pariente, J; Vallet-Regí, M. Influence of pore size of MCM-41 matrices on drug delivery rate, Microporous and Mesoporous Materials, 2004, 68, 105–109.
Spomenka Simovic and Dusan Losic 154
[129] Andersson, J; Rosenholm, J; Areva, S; Linden, M. Influences of material Characteristics on Ibuprofen Drug Loading and Release Profiles from Ordered Micro- and Mesoporous Silica Matrices. Chemistry of Materials, 2004, 16, 4160-4167.
[130] Izquierdo-Barba, I; Ruiz-Gonzalez, L; Doadrio, JC.; Gonzalez-Calbet, JM.; Vallet-Regi, M.Tissue regeneration: A new property of mesoporous materials. Solid State
Sciences, 2005, 7, 983-989. [131] Peters, T. All about Albumin: Biochemistry, Genetics and Medical Applications, San
Diego, California, USA: Academic Press, 1995. [132] Sugio, S; Kashima, A; Mochizuki, S; Noda, M; Kobayashi, K. Crystal structure of
human serum albumin at 2.5 Å resolution, Protein Engineering, 1999 12(6), 439–446. [133] Deere, J; Magner, E; Wall, JG; Hodnett, BK. Mechanistic and structural features of
protein adsorption onto mesoporous silicates, Journal of Physical Chemistry B, 2002, 106, 7340–7347.
[134] Ferey, G; Mellot-Draznieks, C; Serre, C; Millange, F; Dutour, J; Surble, SMargiolaki, I. A Chromium Terephthalate-Based Solid with Unusually Large Pore Volumes and Surface Area, Science, 2005, 309, 2040-2042;
[135] Serre C; Millange F; Thouvenot C; Nogues M; Marsolier G; Louer D; Ferey G. Very large breathing effect in the first nanoporous chromium(III)-based solids: MIL-53 or Cr(III)(OH) x [O(2)C-C(6)H(4)-CO(2)] x [HO(2)C-C(6)H(4)-CO(2)H](x) x H(2)O(y). Journal of the American Chemical Society, 2002, 124, 13519-26.
[136] Azaies, T; Tourne-Peteilh, C; Aussenac, F; Baccile, N; Coelho, C; Devoisselle, JM; Babonneau, F. Solid-State NMR Study of Ibuprofen Confined in MCM-41 Material. Chemistry of Materials, 2006, 18, 6382-6390.
[137] Han, YJ; Stucky, GD; Butler, A. Mesoporous silicate sequestration and release of proteins, Journal of the American Chemical Society, 1999, 121, 9897–9898. [145] Zhang, X.; Guan, RF; Wu, DQ; Chan, KY. Preparation of amino-functionalized mesostructured cellular foams and application as hosts for large biomolecules. Journal of Materials
Science: Materials in Medicine, 2007, 18, 877–882. [138] Stein, A; Melde, BJ; Schroden, RC. Hybrid inorganic-organic meso-porous silicates-
nanoscopic reactors coming of age. Advanced Materials, 2000, 12, 1403-1419. [139] Zhao, XS; Lu, GQ; Hu, X. A novel method for tailoring the pore-opening size of
MCM-41 materials. Chemical Communications, 1999, 15, 1391-1392. [140] Jal, PK; Patel, S; Mishra, BK. Chemical modification of silica surface by
immobilization of functional groups for extractive concentration of metal ions. Talanta, 2004, 62, 1005-1028.
[141] Zeng, W; Qian, XF; Yin, J; Zhu, ZK. The drug delivery system of MCM-41 materials via co-condensation synthesis. Materials Chemistry and Physics, 2006, 97, 437-441.
[142] Ramila, A; Munoz, B; Perez-Pariente, J; Vallet-Regi, M. Mesoporous MCM-41 as Drug Host System. Journal of Sol-Gel Science and Technology, 2003, 26, 1199-1202.
[143] Babonneau, F; Yeung, L; Steunou, N; Gervais, C; Ramila, A; Vallet-Regi, M. Solid State NMR Characterization of Encapsulated Molecules in Mesoporous Silica. Journal of
Sol-Gel Science and Technology, 2004, 31, 219-223. [144] Babonneau, F; Camus, L; Steunou, N; Ramila, A; Vallet-Regi, M. Encapsulation of
ibuprofen in mesoporous silica: Solid state NMR characterization. Materials Research
Society Symposium Proceedings, (Self-Assembled Nanostructured Materials), 2003, 775, 77-82.
Ordered Mesoporous Materials for Drug Delivery Applications 155
[145] Shankland, N; Wilson, CC.; Florence, AJ; Cox, PJ. Refinement of ibuprofen at 100 K by single-crystal pulsed neutron diffraction. Acta Crystallographica, Section C: Crystal
Structure Communications, 1997, C53, 951-954. [146] Tang, Q; Xu,Y; Wu,D; Sun,Y. Hydrophobicity-controlled drug delivery system from
organic modified mesoporous silica, Chemistry Letters, 2006, 35, 474–475. [147] Suva, LJ; Winslow, GA; Wettenhall, REH; Hammonds, RG; Moseley, JM; Diefenbach-
Jagger, H; Rodda, CP; Kemp, BE; Rodriguez, H. A parathyroid hormone - related protein implicated in malignant hypercalcemia : cloning and expression. Science, 1987, 237, 893-896.
[148] Valín, A; García-Ocaña, A; De Miguel, F; Sarasa, JL; Esbrit, P. Antiproliferative effect of the C-terminal fragments of parathyroid hormone-related protein, PTHrP-(107–111) and (107–139), on osteoblastic osteosarcoma cells. Journal of Cellular Physiology, 1997, 170, 209–215.
[149] Davies, JE; Hosseini, MM. Histodinamics of endosseous world healing, in bone engineering, In: Davies, JE. Ed. Bone Engineering, Toronto, Canada: Em Squared: 2000, 1–14.
[150] Chang, JH; Shim, CH; Kim, BJ; Shin, Y; Exarhos, GJ.; Kim, KJ. Bicontinuous, thermoresponsive, L3-phase silica nanocomposites and their smart drug-delivery applications. Advanced Materials, 2005, 17, 634-637.
[151] Lin, V S; Lai, C Y; Huang, J; Song, S A; Xu, S Molecular recognition inside of multifunctionalized mesoporous silicas: toward selective fluorescence detection of dopamine and glucosamine. Journal of the American Chemical Society, 2001, 123, 11510-11511. [160] Arruebo, M; Galan, M; Navascues, N; Tellez, C; Marquina, C; Ibarra, MR; Santamaria, J. Development of Magnetic Nanostructured Silica-Based Materials as Potential Vectors for Drug-Delivery Applications. Chemistry of Materials, 2006, 18, 1911-1919.
[152] Lai, C-Y; Trewyn, BG; Jeftinija, DM; Jeftinija, K; Xu, S; Jeftinija, S; Lin, VS-Y. A mesoporous silica nanosphere-based carrier system with chemically removable CdS nanoparticle caps for stimuli-responsive controlled release of neurotransmitters and drug molecules. Journal of the American Chemical Society, 2003, 125, 4451-4459.
[153] Radu, DR.; Lai, C-Y; Jeftinija, K; Rowe, EW.; Jeftinija, S; Lin, VS.-Y. A Polyamidoamine Dendrimer-Capped Mesoporous Silica Nanosphere-Based Gene Transfection Reagent. Journal of the American Chemical Society, 2004, 126, 13216-13217.
[154] Li, Y; Shi, J; Chen, H; Hua, Z; Zhang, L; Ruan, M; Yan, J; Yan, D. One-step synthesis of hydrothermally stable cubic mesoporous aluminosilicates with a novel particle structure. Microporous and Mesoporous Materials, 2003 60(1-3), 51-56.
[155] Botterhuis, NE; Sun, Q; Magusin, PCMM.; van Santen, RA.; Sommerdijk, N A. J. M. Hollow silica spheres with an ordered pore structure and their application in controlled release studies. Chemistry-A European Journal, 2006, 12, 1448-1456.
[156] Chen, J-F; Ding, H-M; Wang, J-X; Shao, L. Preparation and characterization of porous hollow silica nanoparticles for drug delivery application. Biomaterials, 2004, 25, 723-727.
[157] Zhu, Y; Shi, J; Chen, H; Shen, W; Dong, X. A facile method to synthesize novel hollow mesoporous silica spheres and advanced storage property. Microporous and Mesoporous
Materials, 2005, 84, 218-222.
Spomenka Simovic and Dusan Losic 156
[158] Han, Y & Ying, JY. Generalized fluorocarbon-surfactant-mediated synthesis of nanoparticles with various mesoporous structures. Angewandte Chemie, International Edition, 2005, 44, 288-292.
[159] Salonen, J; Laitinen, L; Kaukonen, AM; Tuura, J; Bjoerkqvist, M; Heikkilae, T; Vaehae-Heikkilae, K; Hirvonen, J; Lehto, V-P. Mesoporous silicon microparticles for oral drug delivery: Loading and release of five model drugs. Journal of Controlled
Release, 2005, 108, 362-374. [160] Slowing, I; Trewyn, BG; Lin, VSY. Effect of surface functionalization of MCM-41-
type mesoporous silica nanoparticles on the endocytosis by human cancer cells. Journal
of the American Chemical Society, 2006, 128, 14792-14793. [161] Schmid. G. Materials in nanoporous alumina. Journal of Materials Chemistry, 2002 12,
1231-1238. [162] Sulka, GD. Highly ordered anodic porous alumina formation by self organized
anodizing. In: Eftekhari A, ed. Nanostructured Materials in electrochemistry. Wiley-VCH. 2008.
[163] Li, L; Koshizaki, N; Li, G. Nanotube arrays in porous alumina membranes. Journal of
Materials Science Technology, 2008, 24, 550-562. [164] Thompson, GE. Porous anodic alumina: Fabrication, characterization and applications.
Thin Solid Films, 1997, 297, 192-201. [165] Digle, JW; Downie, TC; Goulding, CW. Anodic oxide films on aluminium. Chemical
Review, 1969, 69, 365-405. [175] Lei, Y; Cai, WP; Wilde, G. Highly ordered nanostructures with tunable size, shape and properties: A new way to surface nano-patterning using ultra-thin alumina masks. Progress in Materials Science, 2007, 52, 465-539.
[166] Takmakov, P; Vlassiouk, I; Smirnov, S. Application of anodized aluminum in fluorescence detection of biological species. Analytical and Bioanalytical Chemistry, 2006, 385, 954-958.
[167] Steinhart, M, Wehrspohn, RB, Gosele, U; Wendorff, JH. Nanotubes by template wetting: A modular assembly system. Angewandte Chemie, International Edition, 2004, 43, 1334-1344.
[168] Velleman, L; Shapter, JG; Losic, D. Gold nanotube membranes functionalised with fluorinated thiols for selective molecular transport. Journal of Membrane Science, 2009 328, 121-126.
[169] Losic, D; Shapter, JG; Mitchell, JG; Voelcker, NH. Fabrication of gold nanorod arrays by templating from porous alumina. Nanotechnology 2005, 16 2275-2281.
[170] Lillo, M. & Losic, D. (2005) Ion-beam pore opening of porous anodic alumina: The formation of single nanopore and nanopore arrays. Materials Letters, 2009 63, 457-460.
[171] Ono, S; Saito, M; Asoh, H. Self-ordering of anodic porous alumina formed in organic acid electrolytes. Electrochimical Acta, 2005, 51, 827-833.
[172] Jessensky, O; Muller, F; Gosele, U. Self-organized formation of hexagonal pore arrays in anodic alumina. Applied Physics Letters, 1998 72, 1173-1175.
[173] Choi, J; Wehrspohn, RB; Gosele, U. Mechanism of guided self-organization producing quasi-monodomain porous alumina. Electrochimical Acta, 2005, 50, 2591-2595.
[174] Masuda, H; Hasegwa, F; Ono, S. Self-ordering of cell arrangement of anodic porous alumina formed in sulfuric acid solution. Journal of Electrochemical Society, 1997, 144, L127-L130.
Ordered Mesoporous Materials for Drug Delivery Applications 157
[175] Schneider, JJ; Engstler, N; Budna, KP; Teichert, C; Franzka, S. Freestanding, highly flexible, large area, nanoporous alumina membranes with complete through-hole pore morphology. European Journal of Inorganic Chemistry, 2005 12, 2352-2359.
[176] Vrublevsky, I; Parkoun, V; Schreckenbach, J. Analysis of porous oxide film growth on aluminum in phosphoric acid using re-anodizing technique. Applied Surface Science, 2005, 242, 333-338.
[177] Masuda, H. & Fukuda, K. (1995). Ordered metal nanohole arrays made by a 2-step replication of honeycomb structures of anodic alumina. Science, 268,1466-1468.
[178] Masuda, H; Asoh, H; Watanabe, M; Nishio, K; Nakao, M; Tamamura, T. Square and triangular nanohole array architectures in anodic alumina. Advanced Materials, 2001, 13, 189-192.
[179] Lee, W; Ji, R; Gosele, U; Nielsch, K. Fast fabrication of long-range ordered porous alumina membranes by hard anodization. Nature Materials, 2006 5, 741-747.
[180] Chu, SZ; Wada, K; Inoue, S; Isogai, M; Yasumori, A. Fabrication of ideally ordered nanoporous alumina films and integrated alumina nanotubule arrays by high-field anodization. Advanced Materials, 2005, 17, 2115-2121. [191] Meng, G; Jung, YJ; Cao, A; Vajtai, R; Ajayan, PM. Controlled fabrication of hierarchically branched nanopres, nanotubes and nanowires PNAS, 2005,102, 7074-7078.
[181] Ho, AYY; Gao, H; Lam, YC; Rodriguez, I. Controlled fabrication of multitiered three-dimensional nanostructures in porous alumina. Advanced Functional Materials, 2008, 18, 2057-2063.
[182] Zakeri, R; Watts, C; Wang, HB; Kohli, P. Synthesis and characterization of nonlinear nanopores in alumina films. Chemistry of Materials, 2007, 19, 1954-1963.
[183] Losic, D; Lillo, M; Losic, D. Jr. Porous alumina with shaped pore geometries and complex pore architectures fabricated by cyclic anodization. Small, 2009, 5, 1392-1397.
[184] Losic, D. & Losic, D. Jr. (2009). Preparation of porous anodic alumina with periodically perforated pores. Langmuir, 25, 5426-5431.
[185] Popat, KC; Mor, G; Grimes, CA; Desai, TA. Surface modification of nanoporous alumina surfaces with poly(ethylene glycol). Langmuir, 2004 20, 8035-8041.
[186] Losic, D; Cole, MA; Dollmann, B; Vasilev, K; Griesser, HJ. Surface modification of nanoporous alumina membranes by plasma polymerization. Nanotechnology, 2008 19, 245704 (7 pg).
[187] Cameron, MA; Gartland, IP; Smith, JA; Diaz, SF; George, SM. Atomic layer deposition of SiO2 and TiO2 in alumina tubular membranes: Pore reduction and effect of surface species on gas transport. Langmuir, 2000, 16, 7435-7444.
[188] Bruening, ML; Dotzauer, DM; Jain, P; Ouyang, L; Baker, GL. Creation of functional membranes using polyelectrolyte multilayers and polymer brushes. Langmuir, 2008, 24, 7663-7673.
[189] Velleman, L; Triani, G; Evans, PJ; Shapter, JG; Losic, D. Structural and chemical modification of porous anodic alumina membranes. Published online 12 june 2009. Microporous and Mesoporous Materials, 2009, 126, 87-94.
[190] Thormann, A; Teuscher, N; Pfannmoller, M; Rothe, U; Heilmann, A. Nanoporous aluminum oxide membranes for filtration and biofunctionalization. Small, 2007 3, 1032-1040.
Spomenka Simovic and Dusan Losic 158
[191] Chang, C.S. & Suen, S.Y. Modification of porous alumina membranes with n- alkanoic acids and their application in protein adsorption. Journal of Membrane Science, 2006, 275, 70-81.
[192] Bruening, ML; Dotzauer, DM; Jain, P; Ouyang, L; Baker, GL. Creation of functional membranes using polyelectrolyte multilayers and polymer brushes. Langmuir, 2008 24, 7663-7673.
[193] Darder, M; Aranda, P; Hernandez-Velez, M; Manova, E; Ruiz-Hitzky, E. Encapsulation of enzymes in alumina membranes of controlled pore size. Thin Solid Films, 2006, 495, 321-326.
[194] Dai, JH; Baker, GL; Bruening, ML. Use of porous membranes modified with polyelectrolyte multilayers as substrates for protein arrays with low nonspecific adsorption. Analytical Chemistry, 2006, 78, 135-140.
[195] Schmitt, EK, Nurnabi, M, Bushby, RJ, Steinem, C. Electrically insulating pore-suspending membranes on highly ordered porous alumina obtained from vesicle spreading. Soft Matter, 2008, 4, 250-253. [207] Md Jani, AM; Anglin, EJ; McInnes, SJP; Losic, D; Shapter, JG; Voelcker, NH. Nanoporous anodic aluminium oxide membranes with layered surface chemistry. Chemical Communications, 2009, 21, 3062-3064.
[196] Kipke, S. & Schmid, G. Nanoporous alumina membranes as diffusion controlling systems, Advanced Functional Materials, 2004 ,14, 1184-1188.
[197] Popat, KC; Leary Swan, EE; Mukhatyar, V; Chatvanichkul, K-I; Mor, GK; Grimes, CA; Desai, TA. Influence of nanoporous alumina membranes on long-term osteoblast response. Biomaterials, 2005, 26(22), 4516-22.
[198] Popat, KC; Chatvanichkul, K-I; Barnes, GL; Latempa, TJr; Grimes, CA; Desai, TA. Osteogenic differentiation of marrow stromal cells cultured on nanoporous alumina surfaces. Journal of Biomedical Materials Research, Part A, 2007, 80A, 955-964.
[199] Leary Swan, EE.; Popat, KC; Grimes, CA; Desai, TA. Fabrication and evaluation of nanoporous alumina membranes for osteoblast culture. Journal of Biomedical Materials
Research, Part A, 2005, 72A, 288-295. [200] Leary Swan, EE; Popat, KC; Desai, TA. Peptide-immobilized nanoporous alumina
membranes for enhanced osteoblast adhesion. Biomaterials, 2005, 26, 1969-1976. [201] Karlsson, M; Palsgard, E; Wilshaw, PR; Di Silvio, L. Initial in vitro interaction of
osteoblasts with nano-porous alumina. Biomaterials, 2003 24(18), 3039-3046. [202] Swan Leary, EE; Popat, KC; Grimes, CA; Desai, TA. Fabrication and evaluation of
nanoporous alumina membranes for osteoblast culture. Journal of Biomedical Materials
Research, Part A, 2005, 72A, 288-295. [203] La Flamme, KE; Popat, KC; Leoni, L; Markiewicz, E; La Tempa, TJ; Roman, B;
Grimes, CA; Desai, TA. Biocompatibility of nanoporous alumina membranes for immunoisolation. Biomaterials, 2007, 28, 2638-2645.
[204] Takaok, K; Miyamoto, S; Nakahara, H; Hashimoto, J; Yoshikawa, H. Problem and solutions in the practical use of bone morphogenetic proteins. Journal of Hard Tissue
Biology, 1996, 5, 133-141. [205] Bose, S; Darsell, J; Kintner, M; Hosick, H; Bandyopadhyay, A. Pore size and pore
volume effects on alumina and TCP ceramic scaffolds. Materials Science & Engineering,
C: Biomimetic and Supramolecular Systems, 2003, C23, 479-486. [206] Popat, KC; Daniels, RH; Dubrow, RS; Hardev, V; Desai, TA. Nanostructured surfaces
for bone biotemplating applications. Journal of orthopaedic research, 2006, 24, 619-627.
Ordered Mesoporous Materials for Drug Delivery Applications 159
[207] Ferraz, N; Carlsson, J; Hong, J; Ott, MK. Influence of nanopore size on platelet adhesion and activation. Journal of Materials Science: Materials in Medicine, 2008, 19, 3115-3121.
[208] Karlsson, M. & Tang, L. (2006) Surface morphology and adsorbed proteins affect phagocyte responses to nano-porous alumina. Journal of Materials Science: Materials in
Medicine, 2006, 17, 1101-1111. [209] Karlsson, M; Johansson, A; Tang, L; Boman, M. Nanoporous aluminum oxide affects
neutrophil behaviour. Microscopy Research and Technique, 2004, 63, 259-265. [210] Karoussos, IA; Wieneke, H; Sawitowski, T; Wnendt, S; Fischer, A; Dirsch, O;
Dahmen, U; Erbel, R. Inorganic materials as drug delivery systems in coronary artery stenting. Materialwissenschaft und Werkstofftechnik, 2002, 33, 738-746. [223] Kollum, M; Farb, A; Schreiber, Ra; Terfera, K; Arab, A; Geist, A; Haberstroh, J; Wnendt, S; Virmani, R; Hehrlein, C. Particle debris from a nanoporous stent coating obscures potential antiproliferative effects of tacrolimus-eluting stents in a porcine model of restenosis. Catheterization and cardiovascular interventions : official journal of the
Society for Cardiac Angiography & Interventions, 2005, 64, 85-90. [211] Sigler, M; Paul, T; Grabitz, RG. Biocompatibility screening in cardiovascular implants.
Zeitschrift fur Kardiologie, 2005, 94, 383-91. [212] Kapoor, S; Hegde, R; Bhattacharyya, AJ. Influence of surface chemistry of mesoporous
alumina with wide pore distribution on controlled drug release. Journal of Controlled
Release, 2009, 140, 34-39. [213] Das, SK; Kapoor, S; Yamada, H; Bhattacharyya, AJ. Effects of surface acidity and pore
size of mesoporous alumina on degree of loading and controlled release of ibuprofen. Microporous and Mesoporous Materials, 2009, 118, 267-272.
[214] Simovic, S; Losic, D; Vasilev, K. Controlled drug release from porous materials by plasma polymer deposition. Chemical Communications, 2010, DOI: 10.1039/ b919840g (in press).
[215] Vasilev, K; Michelmore, A; Griesser, HJ; Short, RD. Substrate influence on the initial growth phase of plasma-deposited polymer films. Chemical Communications 2009 24, 3600-3602.
[216] Peng, L; Mendelsohn, AD; LaTempa, T; Yoriya, S; Grimes, CA.; Desai, TA.. Long-Term Small Molecule and Protein Elution from TiO2 Nanotubes. Nano Letters, 2009, 9, 1932-1936.
[217] Camenzind E, DeScheerder IK. Local Drug delivery for coronary artery disease, Established and emerging applications. Taylor & Francis 2005.
[218] Wieneke, H; Sawitowski, T; Wnendt, S; Fischer, A; Dirsch, O; Karoussos, IA; Erbel, R. Stent coating: a new approach in interventional cardiology. Herz, 2002, 27, 518-26.
[219] Karoussos, IA; Wieneke, H; Sawitowski, T; Wnendt, S; Fischer, A; Dirsch, O; Dahmen, U; Erbel, R. Inorganic materials as drug delivery systems in coronary artery stenting. Materialwissenschaft und Werkstofftechnik, 2002, 33, 738-746.
[220] Wieneke, H, Olaf, D; MD; Sawitowski, T. Synergistic Effects of a Novel Nanoporous Stent Coating and Tacrolimus on Intima Proliferationin Rabbits Catheterization and
Cardiovascular Interventions, 2003, 399–407. [221] Kornowski, R; Hong, M K; Tio, FO; Bramwell, O; Wu, H; Leon, M B In- stent
restenosis: contributions of inflammatory responses and arterial injury to neointimal hyperplasia. Journal of the American College of Cardiology, 1998, 31, 224-30.
Spomenka Simovic and Dusan Losic 160
[222] Schwartz, RS; Holmes, DRJr; Topol, EJ. The restenosis paradigm revisited: an alternative proposal for cellular mechanisms. Journal of the American College of
Cardiology, 1992, 20, 1284-93. [223] Desai, T. Bhatia, S. Ferrari, M. Therrapeatic micro/nano technology. Springer Sci 2006. [224] Desai, TA; West, T; Cohen, M; Boiarski, T; Rampersaud, A. Nanoporous microsystems
for islet cell replacement. Advanced drug delivery reviews, 2004, 56, 1661-1673. [238] La Flamme, KE; LaTempa, TJ; Grimes, CA ; Desai, TA. The effects of cell density and device arrangement on the behavior of macroencapsulated beta-cells. Cell
Transplantation, 2007, 16, 765-774. [225] Darsell, J; Bose, S; Hosick, HL; Bandyopadhyay, A. From CT scan to ceramic bone
graft. Journal of the American Ceramic Society, 2003, 86, 1076-1080. [226] Gong, D; Yadavalli, V; Paulose, M; Pishko, M; Grimes, CA. Therapeutic micro and
nanotechnology: Controlled molecular release using nanoporous alumina capsules. Biomedical Microdevices, 2003, 5, 75-80.
[227] La Flamme, KE; Mor, G; Gong, D; La Tempa, T; Fusaro, VA; Grimes, CA; Desai, TA. Nanoporous Alumina Capsules for Cellular Macroencapsulation: Transport and Biocompatibility. Diabetes Technology & Therapeutics, 2005, 7, 684-694.
[228] Tao, S.L. & Desai, T.A. Microfabricated drug delivery systems. Advanced Drug
Delivery Reviews, 2003, 55, 315-328. [229] Mor, GK; Varghese, OK; Paulose, M; Shankar, K; Grimes, CA. A review on highly
ordered, vertically oriented TiO2 nanotube arrays: Fabrication, material properties, and solar energy applications. Solar Energy Materials and Solar Cells, 2006, 90, 2011-2075.
[230] Macak, JM; Tsuchiya, H; Ghicov, A; Yasuda, K; Hahn, R; Bauer, S. TiO2 nanotubes: Self-organized electrochemical formation, properties and applications. Current Opinion
on Solid State Materials Science, 2007, 11, 3-18. [231] Zwilling, V; Darque-Ceretti, E; Boutry-Forveille, A; David, D; Perrin, MY;
Aucouturier, M. Structure and physicochemistry of anodic oxide films on titanium and TA6V alloy. Surface and Interface Analysis, 1999, 27, 629-637.
[232] Macak, JM; Albu, SP; Schmuki, P. Towards ideal hexagonal self-ordering of TiO2 nanotubes. Physica Status Solidi-RRL, 2007, 1, 181-183.
[233] Prakasam, HE; Shankar, K; Paulose, M; Varghese, OK; Grimes, CA. A new benchmark for TiO2 nanotube array growth by anodization. Journal of Physical Chemistry C, 2007, 111, 7235-7241.
[234] Paulose, M; Peng, L; Popat, KC; Varghese, OK; LaTempa, TJ; Bao, NZ; Desai, TA; Grimes, CA. Fabrication of mechanically robust, large area, polycrystalline nanotubular/porous TiO2 membranes. Journal of Membrane Science, 2008, 319, 199-205.
[235] Macak, JM; Albu, SP; Kim, DH; Paramasivam, I; Aldabergerova, S; Schmuki, P. Multilayer TiO2-nanotube formation by two-step anodization. Electrochemical and Solid
State Letters, 2007, 10, K28-K31. [236] Macak, J. M. & Schmuki, P. (2006).Anodic growth of self-organized anodic TiO2
nanotubes in viscous electrolytes. Electrochimica Acta, 52, 1258-1264. [237] Bauer, S; Kleber, S; Schmuki, P. TiO2 nanotubes: Tailoring the geometry in
H3PO4/HF electrolytes. Electrochemical Communications, 2006, 8, 1321.
Ordered Mesoporous Materials for Drug Delivery Applications 161
[238] Albu, SP; Kim, D; Schmuki, P. Growth of aligned TiO2 bamboo-type nanotubes and highly ordered nanolace. Angewandte Chemie, International Edition, 2008, 47, 1916-1919.
[239] Vasilev, K; Poh, Z; Kant, K; Chan, J; Michelmore, A; Losic, D. Tailoring the surface functionalities of titania nanotube arrays, Biomaterials, 2010, 31,532-540. [254] Popat, KC.; Eltgroth, M; LaTempa, TJ; Grimes, CA; Desai, TA. Titania nanotubes: a novel platform for drug-eluting coatings for medical implants? Small, 2007 3, 1878-1881.
[240] Popat, KC; Leoni, L; Grimes, CA; Desai, TA. Influence of engineered titania nanotubular surfaces on bone cells. Biomaterials, 2007, 28, 3188-3197.
[241] Peng, L; Eltgroth, ML; LaTempa, TJ; Grimes, CA; Desai, TA. The effect of TiO2 nanotubes on endothelial function and smooth muscle proliferation. Biomaterials 2009, 30, 1268-1272.
[242] Matsuno, H; Yokoyama, A; Watari, F; Uo, M; Kawasaki, T. Biocompatibility and osteogenesis of refractory metal implants, titanium, hafnium, niobium, tantalum and rhenium. Biomaterials, 2001 22, 1253-1262.
[243] Burns, K; Yao, C; Webster, TJ. Increased chondrocyte adhesion on nanotubular anodized titanium. Journal of Biomedical Materials Research, Part A, 2009, 88A, 561-568.
[244] Oh S, Brammer KS, Li YSJ, Teng D, Engler AJ, Chien S, Jin S. Stem cell fate dictated solely by altered nanotube dimension. PNAS, 2009, 106, 2130-2135.
[245] Park, J; Bauer, SVD; Mark, K; Schmuki, P. Nanosize and vitality: TiO2 nanotube diameter directs cell fate, Nano Letters, 2007, 7, 1686–1691.
[246] Park, J; Bauer, S; Schlegel, KA; Neukam, FW; von der Mark, K; Schmuki, P. TiO2 nanotube surfaces: 15 nm - an optimal length scale of surface topography for cell adhesion and differentiation. Small, 2009, 5, 666-671.
[247] von Wilmowsky, C; Bauer, S; Lutz, R; Meisel, M; Neukam, FW; Toyoshima, T; Schmuki, Patrik; N, Emeka; S, Karl , A. In vivo evaluation of anodic TiO2 nanotubes: an experimental study in the pig. Journal of Biomedical Materials Research, Part B:
Applied Biomaterials, 2009, 89B,165-171. [248] Bauer, S; Park, J; von der Mark, K; Schmuki, P. Improved attachment of mesenchymal
stem cells on super-hydrophobic TiO2 nanotubes. Acta Biomaterialia, 2008, 4, 1576-1582.
[249] Shrestha, NK; Macak, JM; Schmidt-Stein, F; Hahn, R; Mierke, CT; Fabry, B. Magnetically Guided Titania Nanotubes for Site-Selective Photocatalysis and Drug Release. Angewandte Chemie, International Edition, 2009, 48, 969-972.
[250] Kalbacova, M; Macak, JM; Schmidt-Stein, F; Mierke, CT; Schmuki, P. TiO2 nanotubes: photocatalyst for cancer cell killing. Physica Status Solidi RRL, 2008, 2,194-196.
[251] Song, YY; Schmidt-Stein, F; Bauer, S; Schmuki, P. Amphiphilic TiO2 Nanotube Arrays: An Actively Controllable Drug Delivery System. Journal of American Chemical
Society, 2009, 131, 4230-4232. [252] Amselem, S; Friedman, D. Submicron Emulsions as Drug carriers for topical
Administration. In: Benita S, editor. Submicron Emulsions in Drug Targeting and
Delivery. Amsterdam: Harwood Academic Press,1998, 119-152.

In: Nanoporous Materials Types, Properties and Uses ISBN: 978-1-61668-182-1 Editor: Samuel B. Jenkins, pp. 163-189 © 2010 Nova Science Publishers, Inc.
Chapter 4
NANOCAVITY: A NOVEL FUNCTIONAL
NANOSTRUCTURAL UNIT
G. Ouyang 1,1*
and G. W. Yang 2,
1Key Laboratory of Low-Dimensional Quantum Structures and Quantum Control of Ministry of Education, and Department of Physics, Hunan Normal University,
Changsha 410081, Hunan, P. R. China 2State Key Laboratory of Optoelectronic Materials and Technologies, Institute of
Optoelectronic and Functional Composite Materials, Nanotechnology Research Center, School of Physics and Engineering, Zhongshan (Sun Yat-sen) University, Guangzhou
510275, Guangdong, P. R. China
1. INTRODUCTION
1.1. Scope
The discovery of the nanocavity structures marked a highlight point in the condensed matter physics and material science of low-dimensional systems. However, it is hard to get a deeper understanding for these unique nanostructures with negative curvature of the fundamental physics underlying from the perspective of classic method. Of great importance is the question of the many physical quantities, such as surface energy, cohesive energy and mechanical modulus, etc., keeping not constant due to under-coordinated atoms in the surface or interface layer of low-dimensional systems [1-3]. The most striking feature is the inner surface atomic state of nanocavity structures with negative curvature are different from those of multilayers, nanocrystals and bulk counterparts. Thus, the surface energy in inner surface of nanocavity structures is the most important quantity, which plays the dominant role and should be responsible for the novel performances.
The present chapter focuses on the basic physical principles of surface energy of nanocavity structures and its novel performances based on the nanothermodynamics and
* Corresponding author: Email: [email protected]
G. Ouyang and G. W. Yang 164
continuum mechanics considerations. Deeper insight into the physical mechanism behind and analytical solutions to the unusually mechanical behavior and thermal stability of nanocavities are presented. Correlation between the surface energy in inner surface of nanocavity structures and its effect on local stiffness, sink effect, interface diffusion and nonlinear shrinkage has been established. It is found that the inner surface energy of nanocavity increases with the size of nanocavity decreasing, which is the inverse of the size dependent surface energy of free nanocrystals. Accordingly, the method for nanocavity structures not only reveals the new physics and chemistry of nanostructural surface energy, but also provides general theoretical tools to calculate the surface energy and related properties.
The chapter starts with a brief overview on the novel phenomena in experiment of nanocavity structures. Some results are summarized in section 1 existing problems that are challenging consistent understanding in theoretical. Section 2 describes the surface energy model of a nanocavity in lattice matrix. The structural and the chemical contribution for surface energy of the inner surface of nanocavities are addressed in detail. In order to deal with the size dependence of the mechanic, thermal stability and related physical properties, the surface energy correlation has been extended to include the effect of thermal stimulus that has an influence on the nonlinear shrinkage behavior, sink effect and superheating, etc. In comparison with the available experimental observations and simulations, section 3 applies the derived methods to the relative size dependence of intrinsic physical performance. Agreement between our theoretical predictions and experimental observations has been realized with improved understanding of the surface or interface effect on low-dimensional systems. Section 4 summarizes the main contributions of this topic with suggestions for future directions in extending the established method. Further investigation of thermal transport and carriers‘ motion, as well as band structure tuned by external stimuli or porosity would stimulate new developments in condensed matter physics and material science.
1.2. Overview
As the new kind of novel nanostructures, nanocavities with negative curvature surface, have been attracted intensive attention due to their unique potential applications in mesoscopic physics, biology and medicine in recent years [4-7]. They not only provide a good system to study the electrical and thermal transport in nanosized confinement, but also are expected to play an important role in both interconnection and functional units in fabricating electronic, optoelectronic, and magnetic storage devices with nanoscaled dimension. Conventionally, nanocavities can be defined as a cluster of many vacancies in lattice matrix. In experimental, nanocavities have been produced in Si [8-10], Ni [11], amorphous Al [12] and Ge [13,14] by ion irradiation and then thermal annealing in inert gases. On the other hand, a number of interesting phenomena have shown through the cavity structures at the nanometer scale. For example, the nanocavities in lattice matrix would be shrunk during external thermal stimulus. The shrinking behaviors show a unique non-linear character with the radius of cavity size contracting to about 4 nm. Moreover, the shrinkage rate becomes slower and finally no detectable size change is observed when the cavity size is about 2 nm. Irradiation [7,15,16]. Meanwhile, in terms of related experiment, the nucleation
Nanocavity: A Novel Functional Nanostructural Unit 165
of the amorphous phase occurs near the inner skin of the cavity [6]. Interestingly, artificial cells with nanocavity structures can get rid of heavy poisonous elements such as heavy metallic atoms in human body [16]. Further, nanocavities in silicon host matrix are experimentally confirmed to effectively trap metallic impurity atoms near nanocavities [17-23]. The void volume and inner surface associated with such nanocavity structures act as the more preferential trapping centers for impurity, including Fe, Co, Pd and Ag gettered in micro-/nano-semiconductor devices [20,24-29].
Similarly, other nanostructures with negative curvature surface have shown special physical properties. For example, the surface-segregated nanoparticles with shell-core configurations are produced in the Pd-Ag alloying system, which is miscible in the bulk phase [30]. The anomalous size dependence of spontaneous interfacial alloying in shell-core nanostructures at ambient temperatures indicated that size effects are apparent in these binary metallic systems [31-35]. The elastic vibrational modes in shell-core nanoparticles shows the controllable behaviors with determination on overall size and shell thickness, confirmed by Brillouin light scattering measurements and numerical calculations [36]. Additionally, the nanoporous structures with negative curvature surfaces have prodigious combined inner surface area for enhancement chemical reactions and yield high-value products [37-40]. These nanostructures can allow only single molecular or clusters of certain shapes and sizes to transport the pores [41]. Recently, Lee and co-workers [42] reported that the thermal conductivity of the n-type crystalline Si with periodically arranged nanometer-sized pores is a up to two or four orders of magnitude lower than that of bulk silicon at room temperature by controlling the size and spacing of pores, leaving the electrical transport properties unchanged. Importantly, this exciting result may predict that the nanoporous semiconductors with aligned pores may be highly attractive materials comparable to those currently used for thermoelectric applications, but on that much easier to manipulate.
In addition, the atomic vacancies or point defects with coordination numbers imperfection of nearby atoms would largely influence on the mechanical strength of a material. It is generally known that vacancies can act as pinning centers restraining the motion of dislocations and then the mechanical strength enhancement. Smmalkorpi et al. explored the mechanical strength of carbon nanotubes with vacancies and related defects by analytic continuum theory, and found that the crucial role of the atomic defects on the mechanical properties [43]. Also, a carbon nanotube is much stiffer than the bulk graphite [44,45]. The Young‘s modulus increases as the wall thickness is reduced [46]. All in all, compared with nanostructures with positive curvature, the performances shown in nanostructures with negative curvature surface display antisymmetry character [47,48].
As we know, with the size decreasing, the ratio of surface/volume of nanostructures will increase, and then the surface and interface energies will greatly affect the physical and chemical properties. The anomalous surface energy of nanostructures always induces many novel size effects, which would open some doors toward technological potentials. However, there is a fundamental issue in the presented investigations of nanocavity structures with negative curvature surface that there are haven‘t been clear and detailed understandings in physical. In contrast to free nanocrystals, the nanocavity structures have the inverse physical and chemical properties such as in functionalities of the densified charge, the single bond energy, the surface stress or surface energy, etc [49-51]. So far, many attempts have been used to investigate the nanostructures with the negative curvature in experiment, which including the thermal treatment, the coordination polymer approach and the Kirkendall effect
G. Ouyang and G. W. Yang 166
employment, and so on [52-54]. Interestingly, many novel phenomena have taken place during the experimental process, which require new theoretical explanations. Up to date, a number of theoretical models have been developed from various perspectives to explain the intriguing nucleation and phase transition of the atomic vacancies and nanocavity systems, which include semi-empirical method [55,56], bond length and bond strength correlation [57] and molecular dynamics simulation (MD) [58], etc. Nevertheless, the theoretical progress on physical background of the mechanic and thermal stability performance in nanocavities is still lagging behind the experimental exploitations. The physical mechanism and analytical expressions for the size dependence of the surface energy and related size effects such as nonlinear shrinkage behaviors of nanocavities in lattice matrix are yet lacking.
1.3. Objectives
It is generally known that the physical and chemical properties of a macroscopic system can be well characterized by the classical thermodynamics or the continuum medium mechanics. In addition, the quantum effect is the key factor of systems at the atomic scale, of which physical and chemical quantities can be resorted to solve Schödinger equations. Nevertheless, for a system at nanometer scale, both classical thermodynamic methods and quantum approaches meet some difficulties. Evidently, the surface effect of low-dimensional systems plays a significant role on the binding energy per atom. In fact, many other physical or chemical quantities have shown size effect. For example, the interaction binding energy, the solid solubility limit in nanometer-sized binary alloying systems, the melting enthalpy, and the melting entropy, i.e., are size dependent [3,59,60]. Therefore, the above concepts are no longer applicable in small systems. Also, edge state, end state, surface or interface tapping, and broken bonds of low-dimensional systems should be taken into account. Therefore, some effective ways to deal with the difficulties as mentioned above has been a challenge for a long time.
Consequently, the thermodynamics in nanoscale is becoming increasingly relevant scientific method when the dimension of electronic devices enters the nanoscale [61,62]. The coordination deficiency and atomic bond contracting at surface or interface layer makes the nanoscaled systems dissimilarity in comparison with the corresponding bulk counterparts in performance. For example, Au-Au bond contraction will take place in the outermost two atomic layers of nanomultilayers, which is confirmed by electron cohesive diffraction [63]. The mean lattice constant of Co nanoislands deposited on Cu contracts by 6% compared with the bulk value, which is verified by theoretical calculations and scanning tunneling microscopy measurements [64]. It is fascinating that the new degree of the freedom of size or curvature and its derivatives not only offers us opportunities to tune the physical properties of a nanosolid but also allows us to gain insight atomic information that is beyond the scope of conventional classical calculations and quantum effect approaches.
Indeed, the new freedom of negative curvature such as nanocavity structures has led to dramatic change of many physical and chemical properties that are conventionally understandable in comparison with a bulk specimen and the nanostructures with the positive curvature. The examples of the surface and size effect from negative curvature on various properties are endless, as reviewed and developed by many researchers [15,65]. The surface
Nanocavity: A Novel Functional Nanostructural Unit 167
effects on related chemical and physical properties change of nanostructures with the negative curvature has inspired a number of theoretical models and experimental observations, all discussed from various aspects.
The main objective of this chapter is to present a survey and progress on the established thermodynamic approaches on nanoscale to elucidate and calculate the inner surface energy of nanocavity structures, so far. It has been emphasized that the novel physical properties could be induced by the cavity size dependence of inner surface energy. In next sections, key theoretical concepts related to inner surface energy of nanocavity structures and relative size effects are presented and compared with decisive experimental results based on the thermodynamics in nanometer scale and continuum mechanics considerations.
2. INNER SURFACE ENERGY OF NANOCAVITY
Surface and interface energies are the basic physical quantities to understand many physical phenomena including growth anisotropy, equilibrium shape, surface structure, reconstruction, relaxation, roughening, etc. For example, the equilibrium crystals shape of crystal at constant volume is determined by the Wulff‘s law [66] by i
i
i A =minimum ( i
is the surface energy of i crystalline surface and Ai is the area.), which depicts the orientation dependence of the surface energy. From the thermodynamics, the surface energy is defined as the reversible work per unit area involved in creating a new surface at constant temperature, volume and total numbers of moles [67]. Generally, the relationship of surface energy and surface stress tensor is 1,2, /1 AAg , in which
and A , respectively, denote the surface area per atom and the strain tensor [68]. For a
liquid situation, the diagonal components of g are numerically equal to . However, the
g is not equivalence to for solid. The energy required to create unit area of surface.
Consistent with the case of free nanocrystals [48], surface energy of a nanocavity in lattice matrix can be contributed from two parts: one is chemical and the other is structural. Hence, the surface energy can be written as
struchem (2-1)
The chemical part of surface energy is origin from thermodynamic consideration while the structural part is deduced in elastic strain energy in inner surface of nanocavity just one atomic layer be considered. Figure 1 shows the schematic illustration of a nanocavity in lattice matrix, and the surroundings are amorphous phase. Thus, we consider a two-phase region consisting of a liquid-like β and a vapor phase α with a spherical curve surface separating the two bulk phases. For the interface energy of liquid (l) and gas (v) or solid (s) and gas, the equation can be approximately yielded 00 // svsvlvlv DD , in which
G. Ouyang and G. W. Yang 168
0 is bulk value with independent of curvature [69]. Variation of total energy in the system, we can obtain
CdcdsdNTdS
dNdVpTdSdNdVpTdSdEdEdEdE
chemSSS
S
(2-2)
where E, S, N, T, , s, c and C are the energy, entropy, number of moles of the system, absolute temperature, chemical potential, interfacial area , curvature and the curvature term with an external force which is defined by Gibbs, respectively [70]. The superscripts of ,
and S represent the two phase regions and surface phase. We note the relations:
VVV , SEEEE , SSSSS , SNNNN (2-3)
whereV , E , S and N denote, respectively, volume, energy, total entropy and number of particles. Under the condition of equilibrium, the chemical potential will be equality, i.e.,
S . Considering the relationships above,
CdcdsdVpdNdVpTdSdE chem . Upon integration of the equation above at constant curvature and subsequent differentiation, we obtain the curve dependent surface energy as sCc T
chem // . Furthermore, from the Tolman [71] and Koenig [72] formula on the surface tension
3/121/3/1222
cccccc
chem
T
chem
(2-4)
Substituting rc /1
13///12//12
rrr
rr
chem
T
chem
(2-5)
where δ is Tolman‘s length. Note that h for the inner surface of nanocavity. For the special case of a spherical cavity of diameter rd 2 , Eq.(2-5) yields
d
hdd
lvchem
lvchem
svchem
svchem 4
100
(2-6)
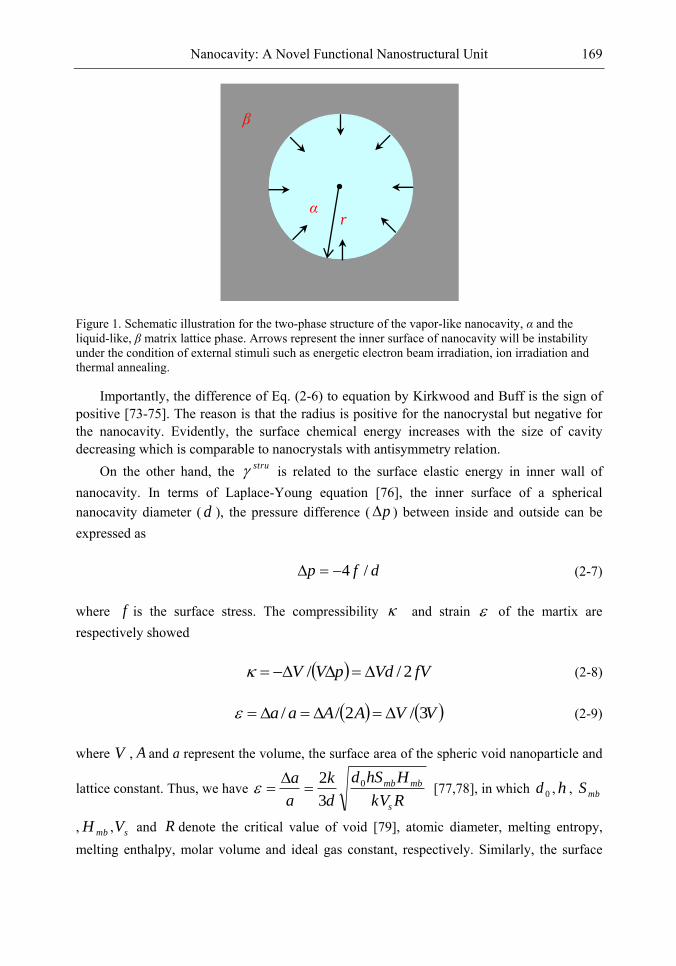
Nanocavity: A Novel Functional Nanostructural Unit 169
Figure 1. Schematic illustration for the two-phase structure of the vapor-like nanocavity, α and the liquid-like, β matrix lattice phase. Arrows represent the inner surface of nanocavity will be instability under the condition of external stimuli such as energetic electron beam irradiation, ion irradiation and thermal annealing.
Importantly, the difference of Eq. (2-6) to equation by Kirkwood and Buff is the sign of positive [73-75]. The reason is that the radius is positive for the nanocrystal but negative for the nanocavity. Evidently, the surface chemical energy increases with the size of cavity decreasing which is comparable to nanocrystals with antisymmetry relation.
On the other hand, the stru is related to the surface elastic energy in inner wall of nanocavity. In terms of Laplace-Young equation [76], the inner surface of a spherical nanocavity diameter ( d ), the pressure difference ( p ) between inside and outside can be expressed as
dfp /4 (2-7)
where f is the surface stress. The compressibility and strain of the martix are respectively showed
fVVdpVV 2// (2-8)
VVAAaa 3/2// (2-9)
where V , A and a represent the volume, the surface area of the spheric void nanoparticle and
lattice constant. Thus, we have RkV
HhSd
d
k
a
a
s
mbmb0
3
2
[77,78], in which 0d , h , mbS
, mbH , sV and R denote the critical value of void [79], atomic diameter, melting entropy, melting enthalpy, molar volume and ideal gas constant, respectively. Similarly, the surface
β
r α
G. Ouyang and G. W. Yang 170
strain ( s
) of a sphere is related to the absolute bulk strain ( ij ) within the particle through
a coordinate transformation [67]
ijji
s tt (2-10)
where , range from 1 to 2 and i , j range from 1 to 3 and it is transformation tensor. Therefore, from these deductions above, the structural part of surface energy can be obtained as
2stru (2-11)
where is the average spring constant of every pair of atoms in deformation lattice in inner surface of cavity.
3. SIZE EFFECTS INDUCED BY SURFACE ENERGY
3.1. Shrinkage and Local Hardening
Considering spherical coordinates ,,r are used at the center of the spherical cavity. The deformation behavior of the inner surface in matrix can be described by linear elasticity theory. As for the special case of spherical symmetry, the quantities of strain components, stress components and displacements are dependent on radial coordinate r and independent of and . The equilibrium equation and volume strain e are showed as
02
Tr
r
rr
(3-1)
rurrr
e 2
2
1
(3-2)
where r and T (i.e., and ) are the radial and tangential stress. Based on the Hooker
law and geometry equation, the component of the displacement ru can be solved as
2/ rBArur (3-3)
where A and B are constants. As for the case of nanocavity, a compressive stress would be build up on the inner surface of a nanocavity. Also, it will provide a driving force to drive to
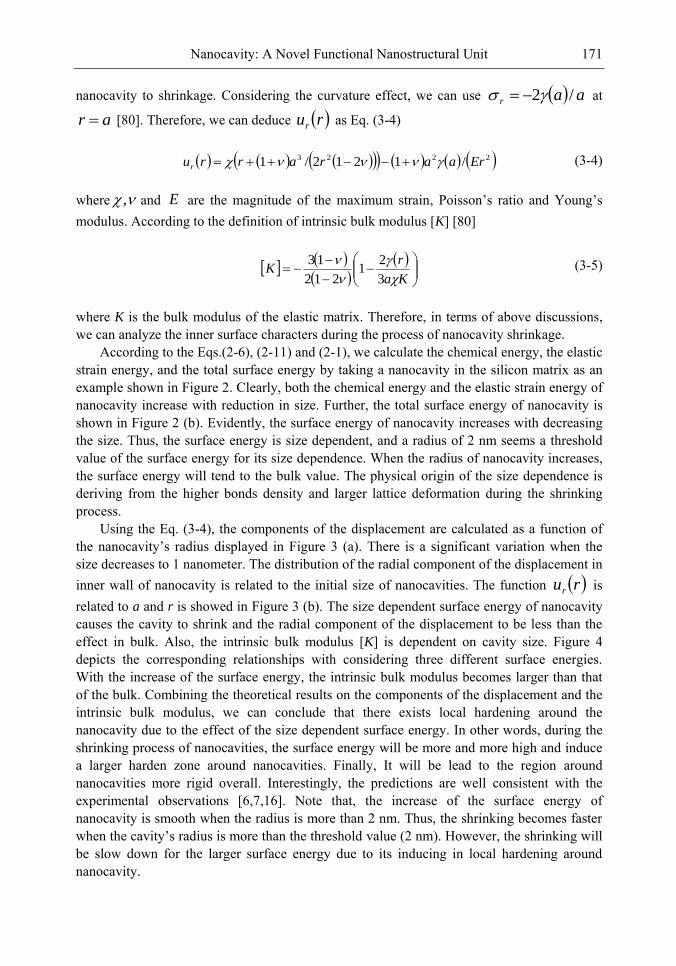
Nanocavity: A Novel Functional Nanostructural Unit 171
nanocavity to shrinkage. Considering the curvature effect, we can use aar /2 at
ar [80]. Therefore, we can deduce rur as Eq. (3-4)
2223 /1212/1 Eraararrur (3-4)
where , and E are the magnitude of the maximum strain, Poisson‘s ratio and Young‘s modulus. According to the definition of intrinsic bulk modulus [K] [80]
Ka
rK
3
21
212
13 (3-5)
where K is the bulk modulus of the elastic matrix. Therefore, in terms of above discussions, we can analyze the inner surface characters during the process of nanocavity shrinkage.
According to the Eqs.(2-6), (2-11) and (2-1), we calculate the chemical energy, the elastic strain energy, and the total surface energy by taking a nanocavity in the silicon matrix as an example shown in Figure 2. Clearly, both the chemical energy and the elastic strain energy of nanocavity increase with reduction in size. Further, the total surface energy of nanocavity is shown in Figure 2 (b). Evidently, the surface energy of nanocavity increases with decreasing the size. Thus, the surface energy is size dependent, and a radius of 2 nm seems a threshold value of the surface energy for its size dependence. When the radius of nanocavity increases, the surface energy will tend to the bulk value. The physical origin of the size dependence is deriving from the higher bonds density and larger lattice deformation during the shrinking process.
Using the Eq. (3-4), the components of the displacement are calculated as a function of the nanocavity‘s radius displayed in Figure 3 (a). There is a significant variation when the size decreases to 1 nanometer. The distribution of the radial component of the displacement in inner wall of nanocavity is related to the initial size of nanocavities. The function rur is related to a and r is showed in Figure 3 (b). The size dependent surface energy of nanocavity causes the cavity to shrink and the radial component of the displacement to be less than the effect in bulk. Also, the intrinsic bulk modulus [K] is dependent on cavity size. Figure 4 depicts the corresponding relationships with considering three different surface energies. With the increase of the surface energy, the intrinsic bulk modulus becomes larger than that of the bulk. Combining the theoretical results on the components of the displacement and the intrinsic bulk modulus, we can conclude that there exists local hardening around the nanocavity due to the effect of the size dependent surface energy. In other words, during the shrinking process of nanocavities, the surface energy will be more and more high and induce a larger harden zone around nanocavities. Finally, It will be lead to the region around nanocavities more rigid overall. Interestingly, the predictions are well consistent with the experimental observations [6,7,16]. Note that, the increase of the surface energy of nanocavity is smooth when the radius is more than 2 nm. Thus, the shrinking becomes faster when the cavity‘s radius is more than the threshold value (2 nm). However, the shrinking will be slow down for the larger surface energy due to its inducing in local hardening around nanocavity.
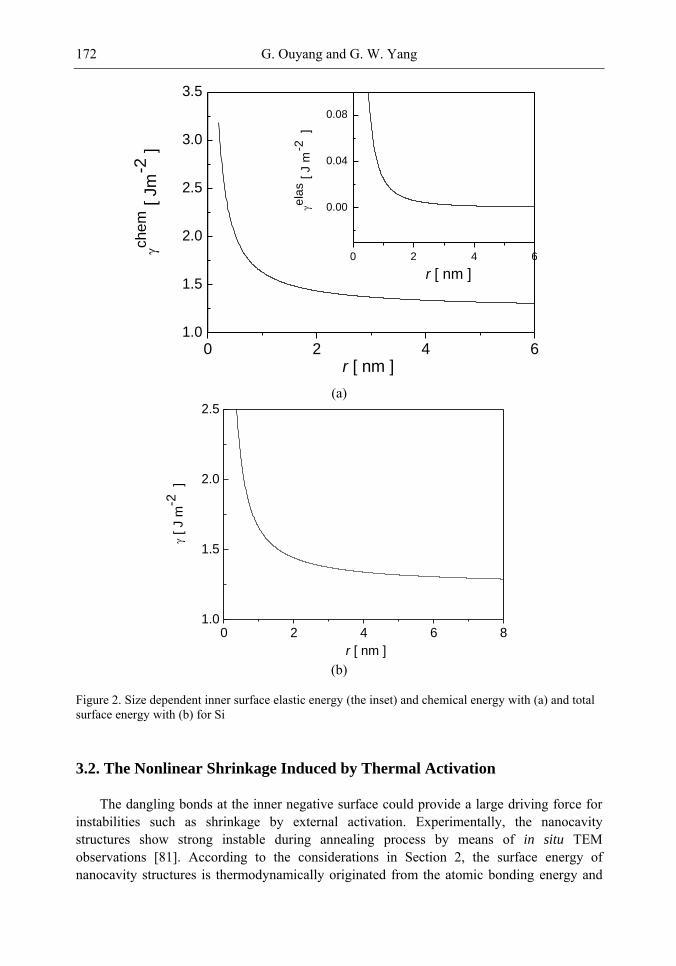
G. Ouyang and G. W. Yang 172
(a)
(b)
Figure 2. Size dependent inner surface elastic energy (the inset) and chemical energy with (a) and total surface energy with (b) for Si
3.2. The Nonlinear Shrinkage Induced by Thermal Activation
The dangling bonds at the inner negative surface could provide a large driving force for instabilities such as shrinkage by external activation. Experimentally, the nanocavity structures show strong instable during annealing process by means of in situ TEM observations [81]. According to the considerations in Section 2, the surface energy of nanocavity structures is thermodynamically originated from the atomic bonding energy and
0 2 4 6
0.00
0.04
0.08
0 2 4 61.0
1.5
2.0
2.5
3.0
3.5
ela
s [
J m
-2
]
r [ nm ]
chem
[ J
m-2
]
r [ nm ]
(a
)
0 2 4 6 81.0
1.5
2.0
2.5
[ J m
-2
]
r [ nm ]
(b)
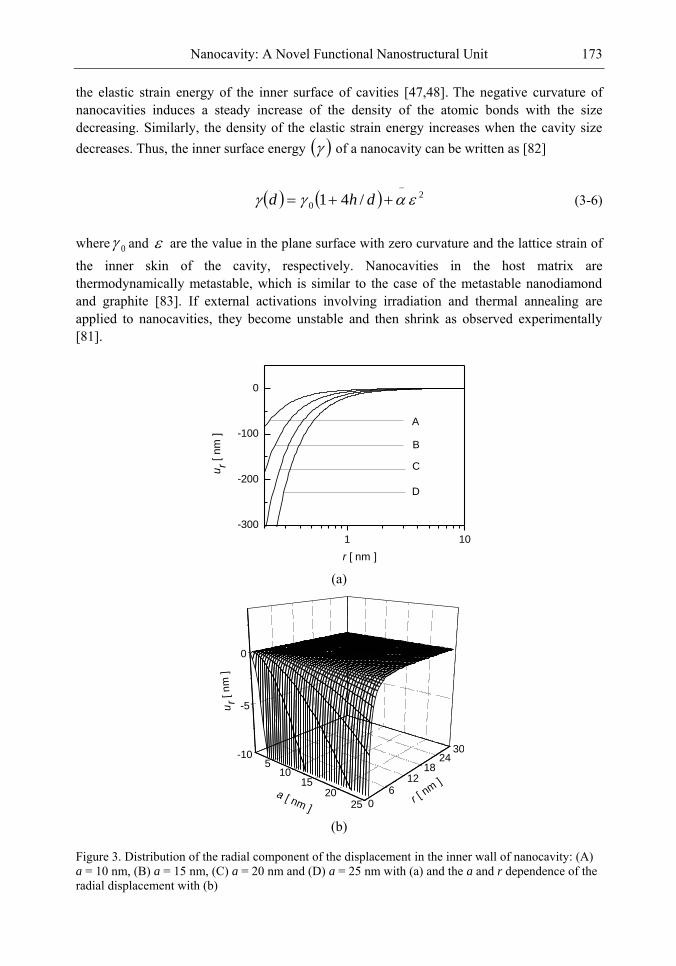
Nanocavity: A Novel Functional Nanostructural Unit 173
the elastic strain energy of the inner surface of cavities [47,48]. The negative curvature of nanocavities induces a steady increase of the density of the atomic bonds with the size decreasing. Similarly, the density of the elastic strain energy increases when the cavity size decreases. Thus, the inner surface energy of a nanocavity can be written as [82]
2
0 /41
dhd (3-6)
where 0 and are the value in the plane surface with zero curvature and the lattice strain of the inner skin of the cavity, respectively. Nanocavities in the host matrix are thermodynamically metastable, which is similar to the case of the metastable nanodiamond and graphite [83]. If external activations involving irradiation and thermal annealing are applied to nanocavities, they become unstable and then shrink as observed experimentally [81].
(a)
(b)
Figure 3. Distribution of the radial component of the displacement in the inner wall of nanocavity: (A) a = 10 nm, (B) a = 15 nm, (C) a = 20 nm and (D) a = 25 nm with (a) and the a and r dependence of the radial displacement with (b)
1 10
-300
-200
-100
0
ur [
nm
]
r [ nm ]
A
B
C
D
Fig.3 by Ouyang et al
(a)
510
1520
25 0
612
1824
30-10
-5
0
ur [
nm
]
r [ n
m ]
a [ nm ]
(b)
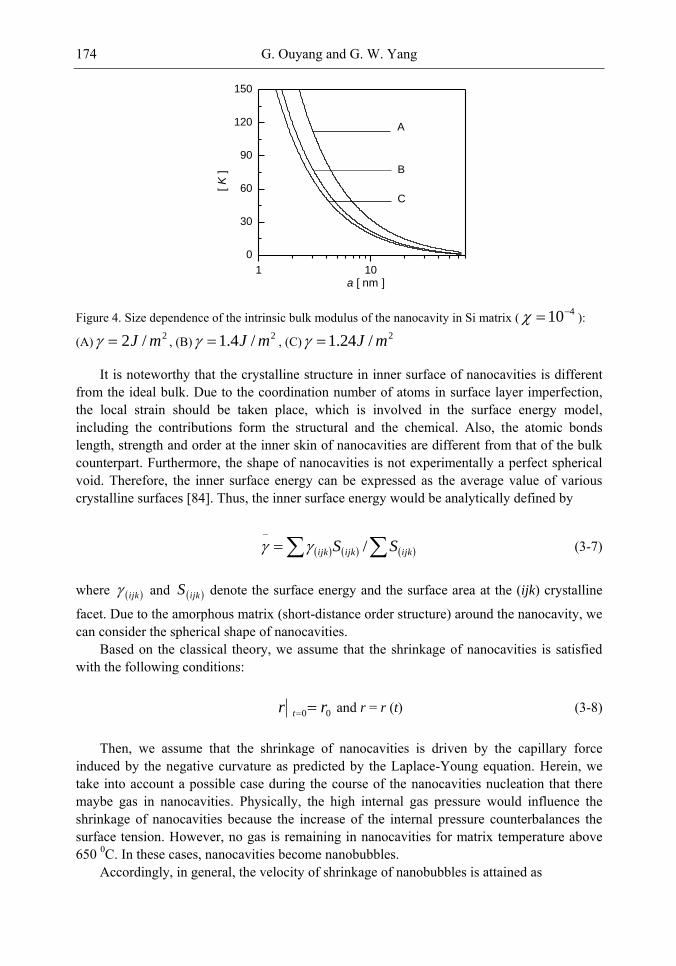
G. Ouyang and G. W. Yang 174
Figure 4. Size dependence of the intrinsic bulk modulus of the nanocavity in Si matrix ( 410 ):
(A) 2/2 mJ , (B) 2/4.1 mJ , (C) 2/24.1 mJ
It is noteworthy that the crystalline structure in inner surface of nanocavities is different from the ideal bulk. Due to the coordination number of atoms in surface layer imperfection, the local strain should be taken place, which is involved in the surface energy model, including the contributions form the structural and the chemical. Also, the atomic bonds length, strength and order at the inner skin of nanocavities are different from that of the bulk counterpart. Furthermore, the shape of nanocavities is not experimentally a perfect spherical void. Therefore, the inner surface energy can be expressed as the average value of various crystalline surfaces [84]. Thus, the inner surface energy would be analytically defined by
ijkijkijk SS / (3-7)
where ijk and ijkS denote the surface energy and the surface area at the (ijk) crystalline
facet. Due to the amorphous matrix (short-distance order structure) around the nanocavity, we can consider the spherical shape of nanocavities.
Based on the classical theory, we assume that the shrinkage of nanocavities is satisfied with the following conditions:
00 rr t
and r = r (t) (3-8)
Then, we assume that the shrinkage of nanocavities is driven by the capillary force induced by the negative curvature as predicted by the Laplace-Young equation. Herein, we take into account a possible case during the course of the nanocavities nucleation that there maybe gas in nanocavities. Physically, the high internal gas pressure would influence the shrinkage of nanocavities because the increase of the internal pressure counterbalances the surface tension. However, no gas is remaining in nanocavities for matrix temperature above 650 0C. In these cases, nanocavities become nanobubbles.
Accordingly, in general, the velocity of shrinkage of nanobubbles is attained as
1 10
0
30
60
90
120
150
[ K
]
a [ nm ]
A
B
C
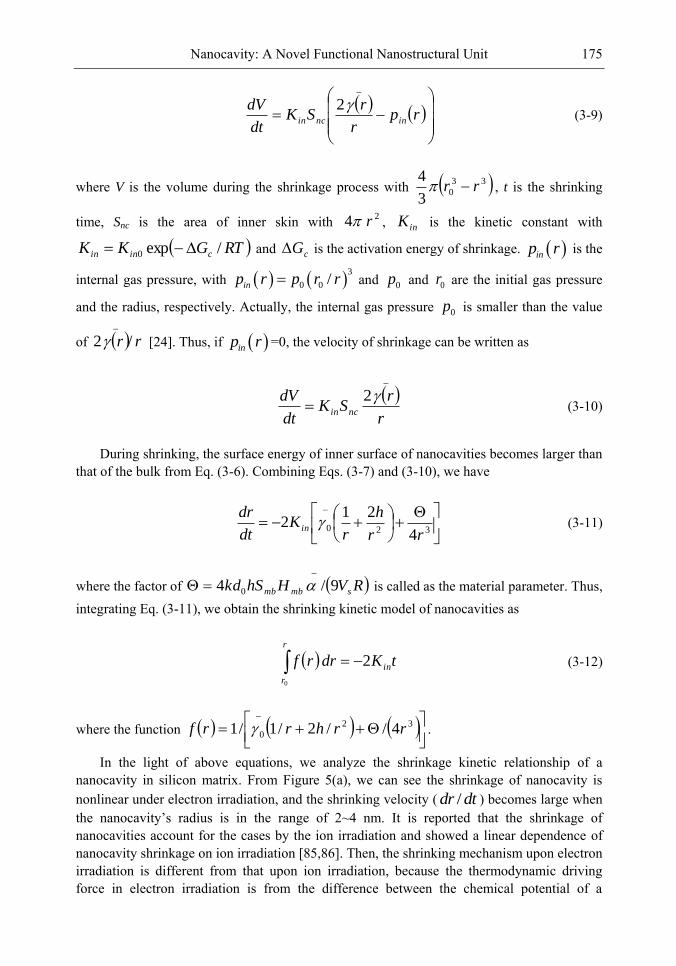
Nanocavity: A Novel Functional Nanostructural Unit 175
rpr
rSK
dt
dVinncin
2 (3-9)
where V is the volume during the shrinkage process with 33
03
4rr , t is the shrinking
time, Snc is the area of inner skin with 2 4 r , inK is the kinetic constant with
RTGKK cinin /exp0 and cG is the activation energy of shrinkage. inp r is the
internal gas pressure, with 3
0 0 /inp r p r r and 0p and 0r are the initial gas pressure
and the radius, respectively. Actually, the internal gas pressure 0p is smaller than the value
of rr /2
[24]. Thus, if inp r =0, the velocity of shrinkage can be written as
r
rSK
dt
dVncin
2
(3-10)
During shrinking, the surface energy of inner surface of nanocavities becomes larger than that of the bulk from Eq. (3-6). Combining Eqs. (3-7) and (3-10), we have
3204
212
rr
h
rK
dt
drin (3-11)
where the factor of RVHhSkd smbmb 9/ 4 0
is called as the material parameter. Thus, integrating Eq. (3-11), we obtain the shrinking kinetic model of nanocavities as
tKdrrf in
r
r
2
0
(3-12)
where the function
32
0 4//2/1/1 rrhrrf .
In the light of above equations, we analyze the shrinkage kinetic relationship of a nanocavity in silicon matrix. From Figure 5(a), we can see the shrinkage of nanocavity is nonlinear under electron irradiation, and the shrinking velocity ( dtdr / ) becomes large when the nanocavity‘s radius is in the range of 2~4 nm. It is reported that the shrinkage of nanocavities account for the cases by the ion irradiation and showed a linear dependence of nanocavity shrinkage on ion irradiation [85,86]. Then, the shrinking mechanism upon electron irradiation is different from that upon ion irradiation, because the thermodynamic driving force in electron irradiation is from the difference between the chemical potential of a
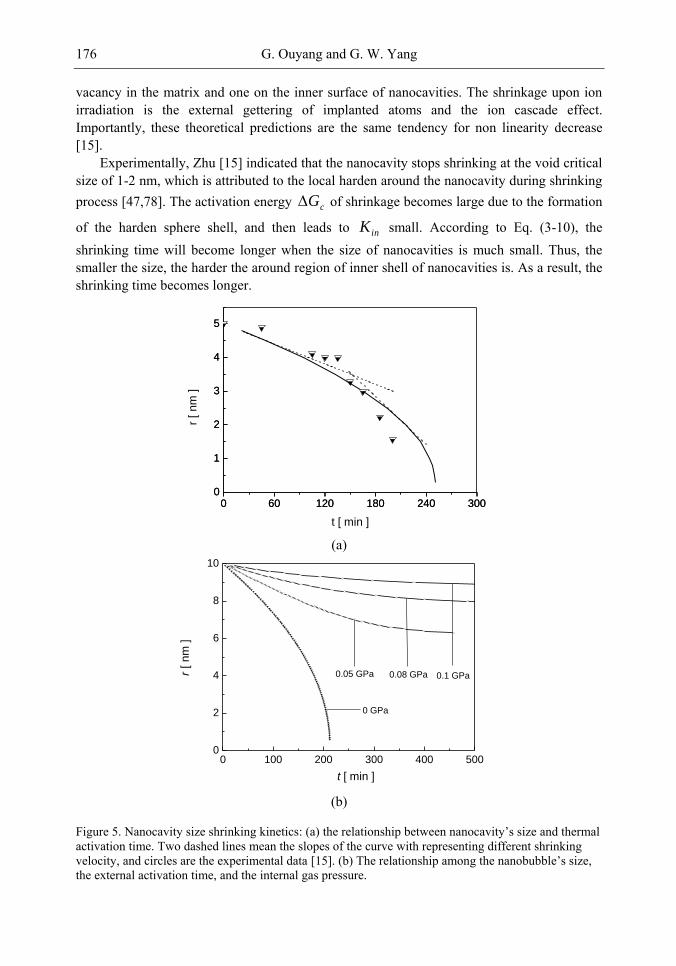
G. Ouyang and G. W. Yang 176
vacancy in the matrix and one on the inner surface of nanocavities. The shrinkage upon ion irradiation is the external gettering of implanted atoms and the ion cascade effect. Importantly, these theoretical predictions are the same tendency for non linearity decrease [15].
Experimentally, Zhu [15] indicated that the nanocavity stops shrinking at the void critical size of 1-2 nm, which is attributed to the local harden around the nanocavity during shrinking process [47,78]. The activation energy cG of shrinkage becomes large due to the formation
of the harden sphere shell, and then leads to inK small. According to Eq. (3-10), the shrinking time will become longer when the size of nanocavities is much small. Thus, the smaller the size, the harder the around region of inner shell of nanocavities is. As a result, the shrinking time becomes longer.
(a)
(b)
Figure 5. Nanocavity size shrinking kinetics: (a) the relationship between nanocavity‘s size and thermal
activation time. Two dashed lines mean the slopes of the curve with representing different shrinking velocity, and circles are the experimental data [15]. (b) The relationship among the nanobubble‘s size,
the external activation time, and the internal gas pressure.
(a)
0
1
2
3
4
5
0 60 120 180 240 3000
1
2
3
4
5
0 60 120 180 240 300
t [ min ]
r [
nm
]
(b)
0
2
4
6
8
10
0 100 200 300 400 500
r [
nm
]
t [ min ]
0 GPa
0.05 GPa 0.08 GPa 0.1 GPa
Nanocavity: A Novel Functional Nanostructural Unit 177
However, the rate of nanocavity shrinkage is evidently enhanced in the amorphous phase based on the related experiments [87]. In fact, the activation energy of shrinkage in a crystalline phase is larger than that in an amorphous phase [88,89]. The large activation energy can lead to the small kinetic factor inK and the long shrinkage time. Thus, the shrinkage velocity in the amorphous phase is faster than that in the crystalline phase. On the other hand, we perform the influence of the internal gas pressure on the shrinkage of nanobubbles under an external activation as shown in Figure 5(b). It is clear to see that the internal gas pressure can effectively slow down the shrinking velocity with the size decreasing. Accordingly, the shrinkage of nanocavities is a competing process among the capillary force induced by the negative curvature, the local hardening induced by the surface energy, and the internal gas pressure.
3.3. Melting and Superheating
Theoretically, Bai et al. studied the nucleation and melting in solids containing nanocavities by MD and found that the melting are different from the bulk counterparts and nanocrystals, which can be determined by the interface curvature, interface energy and elastic energy [58]. The results predict superheating will be taken place during nanocavity in melting process. In reality, the melting behaviors of nanostructures with curve surface have been investigated for a long time [90-93]. The melting mechanism of solids has attracted the attentions of researchers both theoretically and experimentally [94,95]. It is well known that the melting temperature of positive curvature nanostructures depression shows the strong size effect when the size is of the order of nanometers [96]. Thus, the reason is attributed to the surface-to-volume ratio of nanostructures higher than the bulk and the surface energy substantially affects the properties of the material. However, a complete theoretical understanding of the different phenomena with melting and superheating of nanocavity structures across the solid-liquid phase transition are not yet achieved. Therefore, based on the above considerations, we can clarify the melting and superheating mechanism of nanocavity structures from the perspective of thermodynamics at the nanometer scale, being consistent with the simulations.
According to the thermodynamics, the system of the solid-liquid phase transition must meet up three criteria: mechanical, thermal and phase equilibrium. Thus, the terms on solid-liquid phase equilibrium of the nanocavity system are given by
(3-13)
TT (3-14)
r
PP
2
(3-15)
G. Ouyang and G. W. Yang 178
where and T are the chemical potential and the temperature, P is the pressure, The
superscript and denote the solid and liquid phases, and r is the radius of the nanocavity
with d = 2r. Note that, in the planar case, the mechanic equilibrium condition is PP . Therefore, considering the thermodynamic relationship VdPSdTd , we have
rVddTSmb / 2 (3-16)
where SSSmb . Integrating Eq. (3-16), we attain the melting thermodynamic relationship of a nanocavity in lattice matrix as
mb
s
mb dH
Vd
T
T
4
(3-17)
where mbT is the melting temperature of bulk (matrix). Therefore, T mbTT > 0 means the superheating of nanocavities. Further, substituting Eq. (3-6) into Eq. (3-17), we deduce the melting model of a nanocavity in the host matrix as following
mb
mb
s
TdH
ddhV
T
2
0 //414
(3-18)
In terms of Eq. (3-18), we calculate the melting temperature of nanocavities in lattice matrix shown in Figure 6. It is clear to see that the superheating temperature of nanocavities rapidly increases with the size decreasing when nm 5d . However, when nm 5d , nanocavities show the weak superheating, and finally, the melting temperatures both the nanocavities and the host matrix become identical ( 0T ).
Interestingly, these theoretical results are well consistent with the MD [58]. Therewith, a complete melting picture of a nanocavity in the host matrix is further described as shown in Figure 7. In detail, a nanocavity in lattice matrix would shrink when an external thermal activation is applied. The shrinking kinetics of nanocavities displays nonlinear character, and the local hardening will form around the inner skin of nanocavities due to the size effect of the inner surface energy of nanocavities (Figure 6). Meanwhile, the shrinkage of nanocavities stops when their size close to a critical value and then nanocavities are thermodynamically stable and their sizes do not change under thermal annealing. Sequentially, when the temperature is promoted to the matrix melting point ( mbTT ), the matrix firstly melts and becomes liquid, but, nanocavities are still stiffening in the melting matrix due to the superheating effect (Figure 7(c)). Finally, when the temperature is raised to the melting
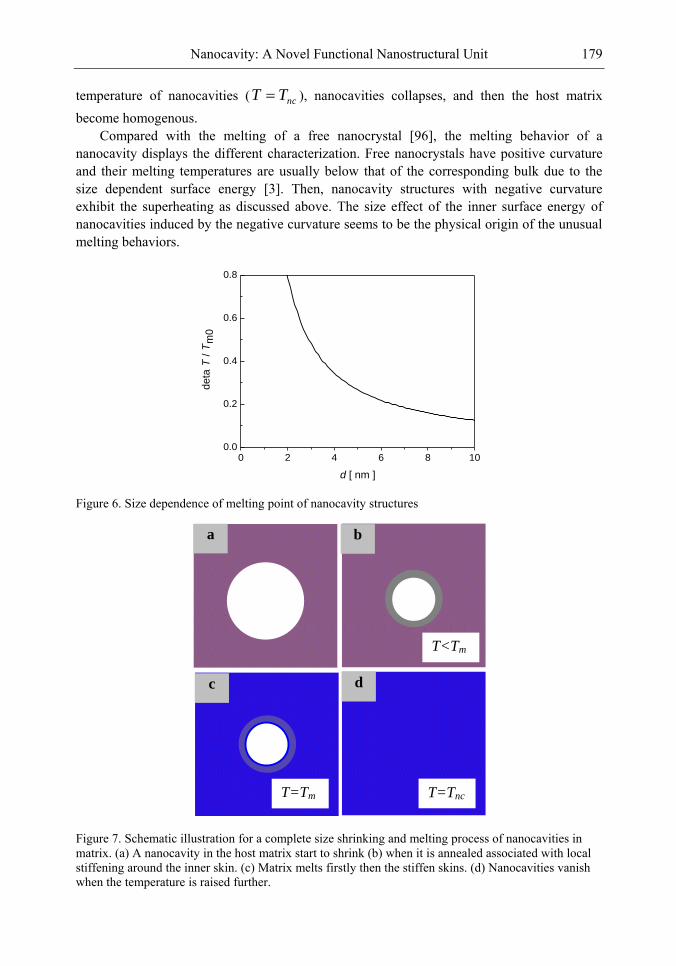
Nanocavity: A Novel Functional Nanostructural Unit 179
temperature of nanocavities ( ncTT ), nanocavities collapses, and then the host matrix become homogenous.
Compared with the melting of a free nanocrystal [96], the melting behavior of a nanocavity displays the different characterization. Free nanocrystals have positive curvature and their melting temperatures are usually below that of the corresponding bulk due to the size dependent surface energy [3]. Then, nanocavity structures with negative curvature exhibit the superheating as discussed above. The size effect of the inner surface energy of nanocavities induced by the negative curvature seems to be the physical origin of the unusual melting behaviors.
Figure 6. Size dependence of melting point of nanocavity structures
Figure 7. Schematic illustration for a complete size shrinking and melting process of nanocavities in matrix. (a) A nanocavity in the host matrix start to shrink (b) when it is annealed associated with local stiffening around the inner skin. (c) Matrix melts firstly then the stiffen skins. (d) Nanocavities vanish when the temperature is raised further.
0 2 4 6 8 100.0
0.2
0.4
0.6
0.8
de
ta T
/ T
m0
d [ nm ]
a
T<Tm
b
b
T=Tm
b
c
T=Tnc
d
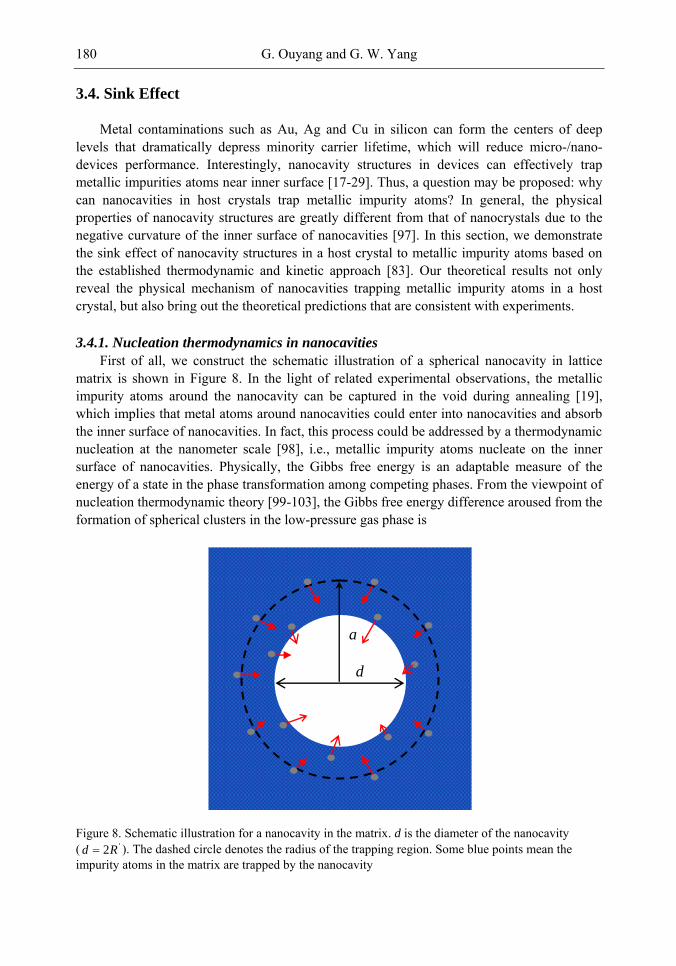
G. Ouyang and G. W. Yang 180
3.4. Sink Effect
Metal contaminations such as Au, Ag and Cu in silicon can form the centers of deep levels that dramatically depress minority carrier lifetime, which will reduce micro-/nano-devices performance. Interestingly, nanocavity structures in devices can effectively trap metallic impurities atoms near inner surface [17-29]. Thus, a question may be proposed: why can nanocavities in host crystals trap metallic impurity atoms? In general, the physical properties of nanocavity structures are greatly different from that of nanocrystals due to the negative curvature of the inner surface of nanocavities [97]. In this section, we demonstrate the sink effect of nanocavity structures in a host crystal to metallic impurity atoms based on the established thermodynamic and kinetic approach [83]. Our theoretical results not only reveal the physical mechanism of nanocavities trapping metallic impurity atoms in a host crystal, but also bring out the theoretical predictions that are consistent with experiments.
3.4.1. Nucleation thermodynamics in nanocavities
First of all, we construct the schematic illustration of a spherical nanocavity in lattice matrix is shown in Figure 8. In the light of related experimental observations, the metallic impurity atoms around the nanocavity can be captured in the void during annealing [19],
which implies that metal atoms around nanocavities could enter into nanocavities and absorb the inner surface of nanocavities. In fact, this process could be addressed by a thermodynamic nucleation at the nanometer scale [98], i.e., metallic impurity atoms nucleate on the inner surface of nanocavities. Physically, the Gibbs free energy is an adaptable measure of the energy of a state in the phase transformation among competing phases. From the viewpoint of nucleation thermodynamic theory [99-103], the Gibbs free energy difference aroused from the formation of spherical clusters in the low-pressure gas phase is
Figure 8. Schematic illustration for a nanocavity in the matrix. d is the diameter of the nanocavity ( '2Rd ). The dashed circle denotes the radius of the trapping region. Some blue points mean the impurity atoms in the matrix are trapped by the nanocavity
d
a
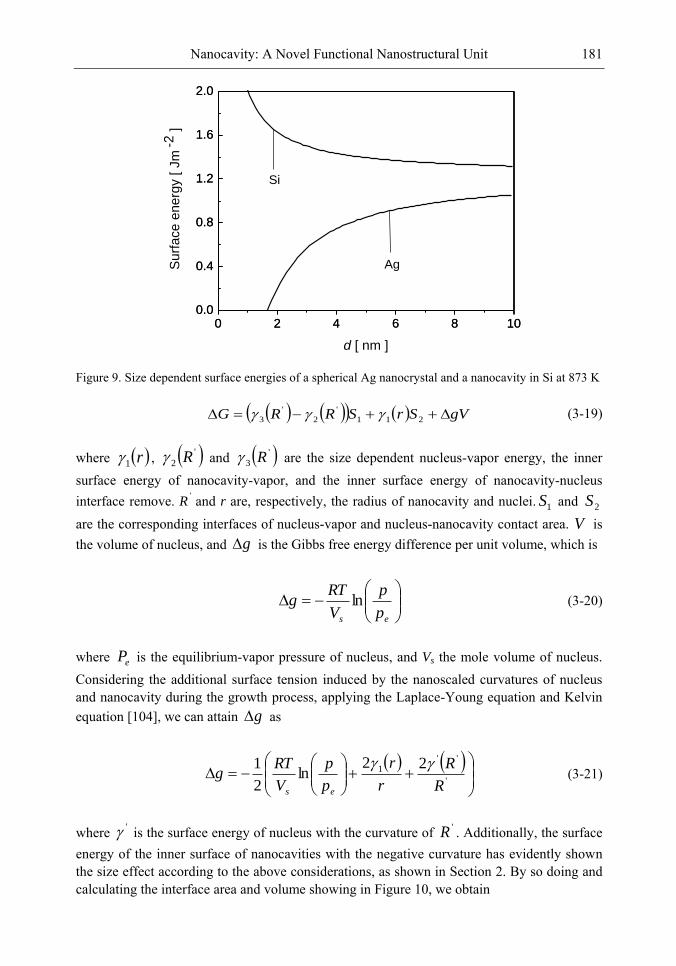
Nanocavity: A Novel Functional Nanostructural Unit 181
Figure 9. Size dependent surface energies of a spherical Ag nanocrystal and a nanocavity in Si at 873 K
gVSrSRRG 211
'
2
'
3 (3-19)
where r1 , '2 R and '3 R are the size dependent nucleus-vapor energy, the inner surface energy of nanocavity-vapor, and the inner surface energy of nanocavity-nucleus interface remove. R’ and r are, respectively, the radius of nanocavity and nuclei. 1S and 2S are the corresponding interfaces of nucleus-vapor and nucleus-nanocavity contact area. V is the volume of nucleus, and g is the Gibbs free energy difference per unit volume, which is
es p
p
V
RTg ln (3-20)
where eP is the equilibrium-vapor pressure of nucleus, and Vs the mole volume of nucleus. Considering the additional surface tension induced by the nanoscaled curvatures of nucleus and nanocavity during the growth process, applying the Laplace-Young equation and Kelvin equation [104], we can attain g as
'
''
1 22ln
2
1
R
R
r
r
p
p
V
RTg
es
(3-21)
where ' is the surface energy of nucleus with the curvature of 'R . Additionally, the surface energy of the inner surface of nanocavities with the negative curvature has evidently shown the size effect according to the above considerations, as shown in Section 2. By so doing and calculating the interface area and volume showing in Figure 10, we obtain
0 2 4 6 8 100.0
0.4
0.8
1.2
1.6
2.0
0 2 4 6 8 100.0
0.4
0.8
1.2
1.6
2.0
Su
rface e
nerg
y [
Jm
-2 ]
d [ nm ]
Si
Ag
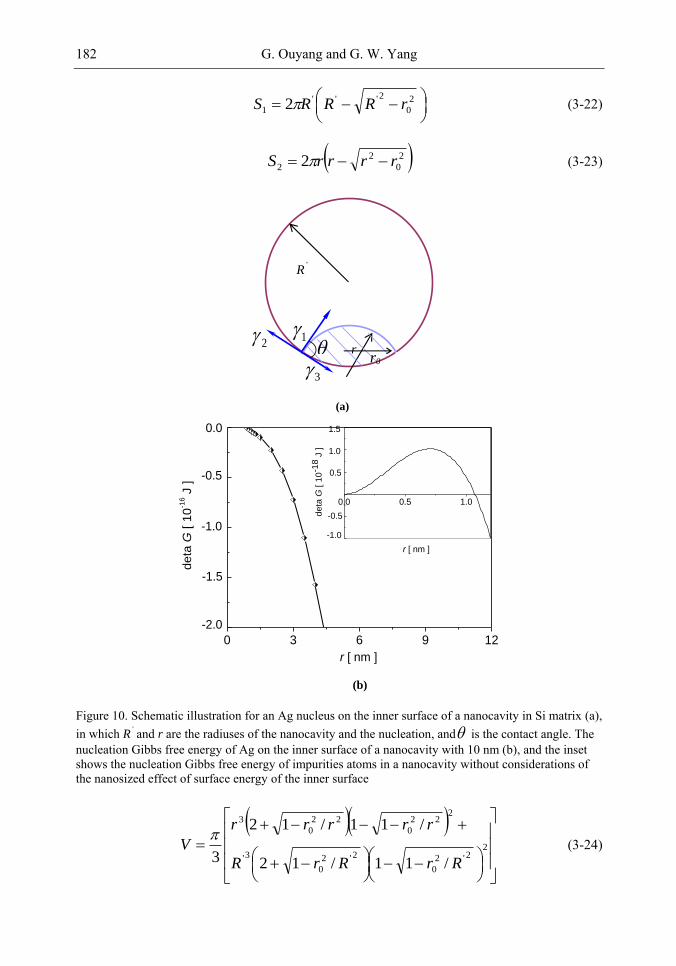
G. Ouyang and G. W. Yang 182
2
0
2'''
1 2 rRRRS (3-22)
2
0
2
2 2 rrrrS (3-23)
Figure 10. Schematic illustration for an Ag nucleus on the inner surface of a nanocavity in Si matrix (a), in which R’ and r are the radiuses of the nanocavity and the nucleation, and is the contact angle. The nucleation Gibbs free energy of Ag on the inner surface of a nanocavity with 10 nm (b), and the inset shows the nucleation Gibbs free energy of impurities atoms in a nanocavity without considerations of the nanosized effect of surface energy of the inner surface
22'2
0
2'2
0
3'
222
0
22
0
3
/11/12
/11/12
3 RrRrR
rrrrr
V
(3-24)
R’
r 1
2
3
r0
(a)
(b)
0 3 6 9 12
0.0
-0.5
-1.0
-1.5
r [ nm ]
de
ta G
[ 1
0-1
6 J
]
-2.0
0.0 0.5 1.0
1.5
1.0
0.5
-0.5
de
ta G
[ 1
0-1
8 J
]
r [ nm ]
-1.0
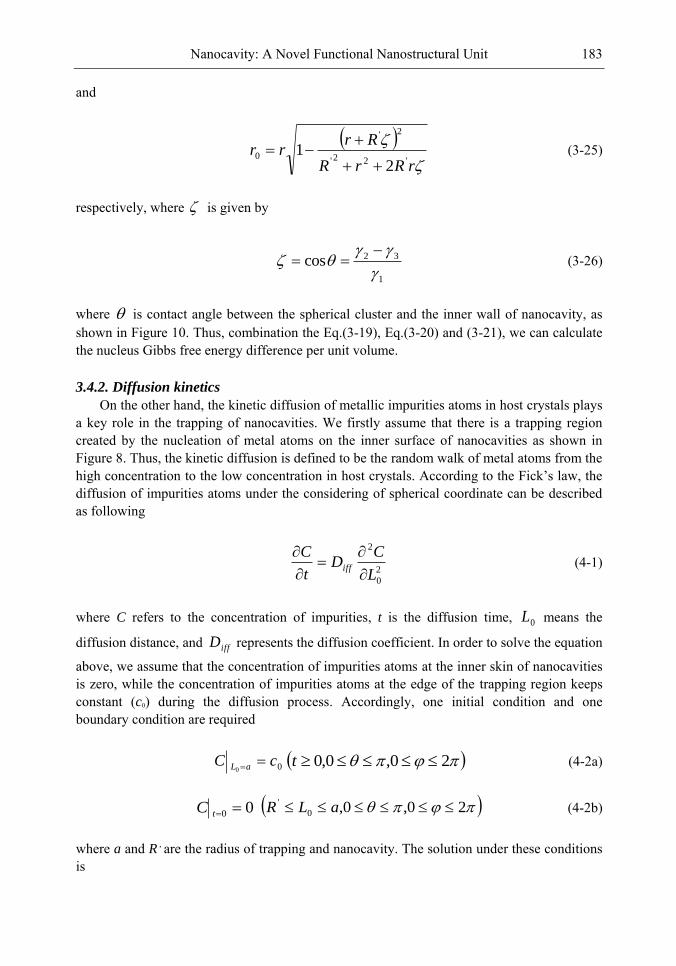
Nanocavity: A Novel Functional Nanostructural Unit 183
and
rRrR
Rrrr
'22'
2'
0
21
(3-25)
respectively, where is given by
1
32cos
(3-26)
where is contact angle between the spherical cluster and the inner wall of nanocavity, as shown in Figure 10. Thus, combination the Eq.(3-19), Eq.(3-20) and (3-21), we can calculate the nucleus Gibbs free energy difference per unit volume.
3.4.2. Diffusion kinetics
On the other hand, the kinetic diffusion of metallic impurities atoms in host crystals plays a key role in the trapping of nanocavities. We firstly assume that there is a trapping region created by the nucleation of metal atoms on the inner surface of nanocavities as shown in Figure 8. Thus, the kinetic diffusion is defined to be the random walk of metal atoms from the high concentration to the low concentration in host crystals. According to the Fick‘s law, the
diffusion of impurities atoms under the considering of spherical coordinate can be described as following
2
0
2
L
CD
t
Ciff
(4-1)
where C refers to the concentration of impurities, t is the diffusion time, 0L means the
diffusion distance, and iffD represents the diffusion coefficient. In order to solve the equation
above, we assume that the concentration of impurities atoms at the inner skin of nanocavities is zero, while the concentration of impurities atoms at the edge of the trapping region keeps constant (c0) during the diffusion process. Accordingly, one initial condition and one boundary condition are required
00cC aL 20,0,0 t (4-2a)
00 tC 20,0,0
' aLR (4-2b)
where a and R’ are the radius of trapping and nanocavity. The solution under these conditions is
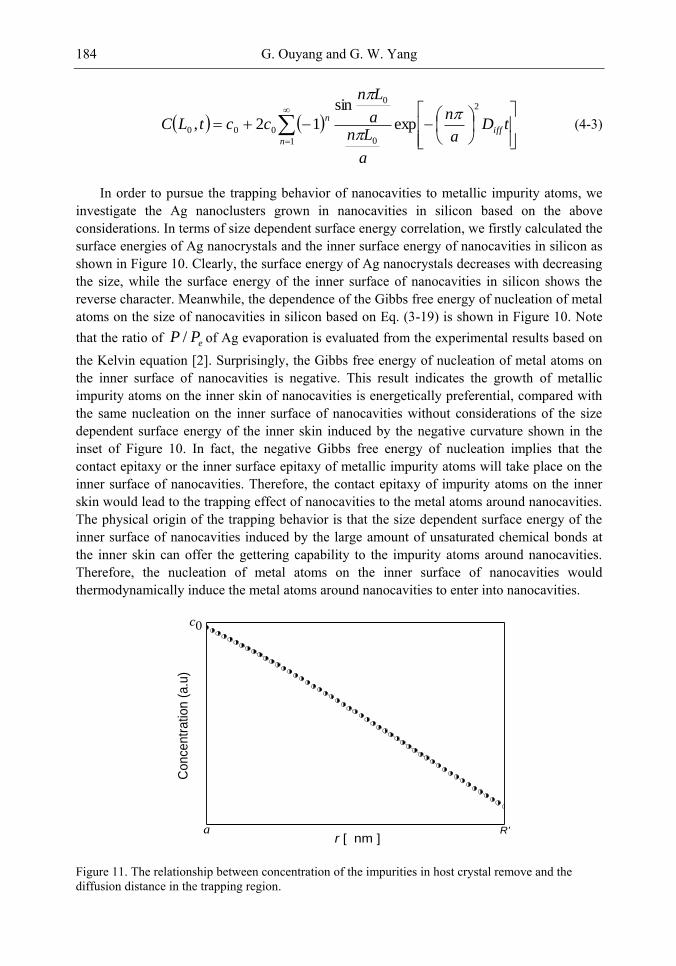
G. Ouyang and G. W. Yang 184
1
2
0
0
000 exp
sin
12,n
iff
ntD
a
n
a
Lna
Ln
cctLC
(4-3)
In order to pursue the trapping behavior of nanocavities to metallic impurity atoms, we investigate the Ag nanoclusters grown in nanocavities in silicon based on the above considerations. In terms of size dependent surface energy correlation, we firstly calculated the surface energies of Ag nanocrystals and the inner surface energy of nanocavities in silicon as shown in Figure 10. Clearly, the surface energy of Ag nanocrystals decreases with decreasing the size, while the surface energy of the inner surface of nanocavities in silicon shows the reverse character. Meanwhile, the dependence of the Gibbs free energy of nucleation of metal atoms on the size of nanocavities in silicon based on Eq. (3-19) is shown in Figure 10. Note that the ratio of ePP / of Ag evaporation is evaluated from the experimental results based on the Kelvin equation [2]. Surprisingly, the Gibbs free energy of nucleation of metal atoms on the inner surface of nanocavities is negative. This result indicates the growth of metallic impurity atoms on the inner skin of nanocavities is energetically preferential, compared with the same nucleation on the inner surface of nanocavities without considerations of the size dependent surface energy of the inner skin induced by the negative curvature shown in the inset of Figure 10. In fact, the negative Gibbs free energy of nucleation implies that the contact epitaxy or the inner surface epitaxy of metallic impurity atoms will take place on the inner surface of nanocavities. Therefore, the contact epitaxy of impurity atoms on the inner skin would lead to the trapping effect of nanocavities to the metal atoms around nanocavities. The physical origin of the trapping behavior is that the size dependent surface energy of the inner surface of nanocavities induced by the large amount of unsaturated chemical bonds at the inner skin can offer the gettering capability to the impurity atoms around nanocavities. Therefore, the nucleation of metal atoms on the inner surface of nanocavities would thermodynamically induce the metal atoms around nanocavities to enter into nanocavities.
Figure 11. The relationship between concentration of the impurities in host crystal remove and the diffusion distance in the trapping region.
R'a
Co
nce
ntr
atio
n (
a.u
)
c0
r [ nm ]
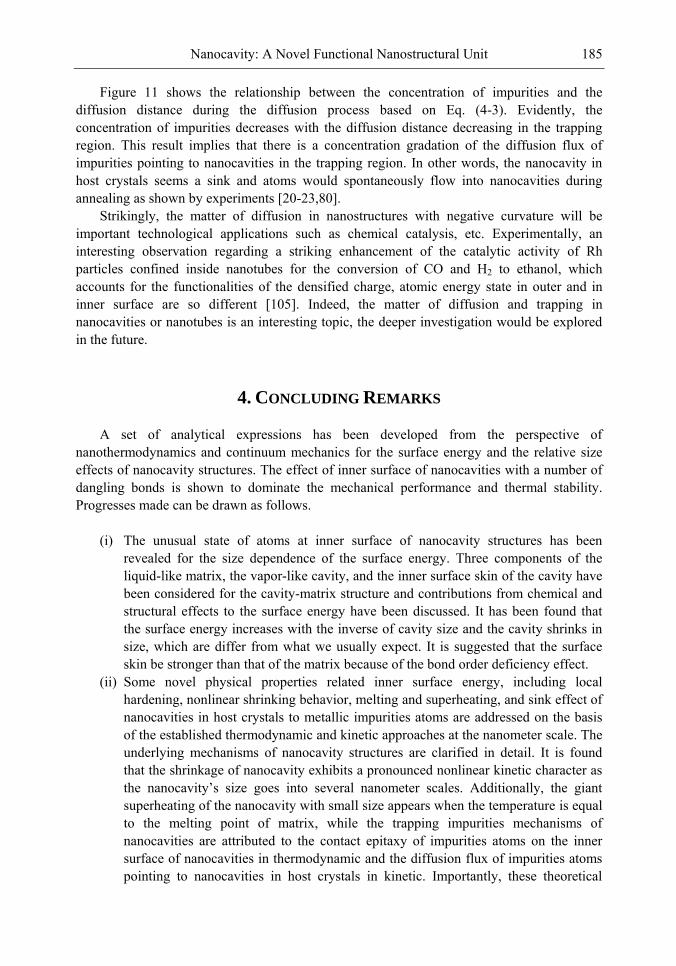
Nanocavity: A Novel Functional Nanostructural Unit 185
Figure 11 shows the relationship between the concentration of impurities and the diffusion distance during the diffusion process based on Eq. (4-3). Evidently, the concentration of impurities decreases with the diffusion distance decreasing in the trapping region. This result implies that there is a concentration gradation of the diffusion flux of impurities pointing to nanocavities in the trapping region. In other words, the nanocavity in host crystals seems a sink and atoms would spontaneously flow into nanocavities during annealing as shown by experiments [20-23,80].
Strikingly, the matter of diffusion in nanostructures with negative curvature will be important technological applications such as chemical catalysis, etc. Experimentally, an interesting observation regarding a striking enhancement of the catalytic activity of Rh particles confined inside nanotubes for the conversion of CO and H2 to ethanol, which accounts for the functionalities of the densified charge, atomic energy state in outer and in inner surface are so different [105]. Indeed, the matter of diffusion and trapping in nanocavities or nanotubes is an interesting topic, the deeper investigation would be explored in the future.
4. CONCLUDING REMARKS
A set of analytical expressions has been developed from the perspective of nanothermodynamics and continuum mechanics for the surface energy and the relative size effects of nanocavity structures. The effect of inner surface of nanocavities with a number of dangling bonds is shown to dominate the mechanical performance and thermal stability. Progresses made can be drawn as follows.
(i) The unusual state of atoms at inner surface of nanocavity structures has been
revealed for the size dependence of the surface energy. Three components of the liquid-like matrix, the vapor-like cavity, and the inner surface skin of the cavity have been considered for the cavity-matrix structure and contributions from chemical and structural effects to the surface energy have been discussed. It has been found that the surface energy increases with the inverse of cavity size and the cavity shrinks in size, which are differ from what we usually expect. It is suggested that the surface skin be stronger than that of the matrix because of the bond order deficiency effect.
(ii) Some novel physical properties related inner surface energy, including local hardening, nonlinear shrinking behavior, melting and superheating, and sink effect of nanocavities in host crystals to metallic impurities atoms are addressed on the basis of the established thermodynamic and kinetic approaches at the nanometer scale. The underlying mechanisms of nanocavity structures are clarified in detail. It is found that the shrinkage of nanocavity exhibits a pronounced nonlinear kinetic character as the nanocavity‘s size goes into several nanometer scales. Additionally, the giant
superheating of the nanocavity with small size appears when the temperature is equal to the melting point of matrix, while the trapping impurities mechanisms of nanocavities are attributed to the contact epitaxy of impurities atoms on the inner surface of nanocavities in thermodynamic and the diffusion flux of impurities atoms pointing to nanocavities in host crystals in kinetic. Importantly, these theoretical
G. Ouyang and G. W. Yang 186
results exhibit that the nanocavity in host crystals as a functional unit could be used to fabricate nanodevices. Evidently, the size dependent inner surface energy of nanocavities seems responsible for these anomalous melting behaviors above.
It should be emphasized that all the theoretical models mentioned above are successful
from different aspects such as mechanics, thermal stability and phase transition, etc., and with the size dependent surface energy of nanocavity structures with negative curvature as the complementary origin, they would be complete and in good accordance. More strikingly, as the current theoretical methods are the first order approximation, there is still plenty of room for improvement by involving other external stimulus such as temperature, pressure, electrical or magnetic field approaches that contribute to the surface state of nanostructures. Thus, it is really an open topic full of exciting challenges. Further investigation should be pursued in the near future.
ACKNOWLEDGMENTS This work was financially supported by the National Natural Science Foundation of
China (Grant Nos. 10804030 and U0734004), the Key Project of Chinese Ministry of Education (106126 and 209088) and the Scientific Research Fund of Hunan Provincial Education Department (08B052).
REFERENCES
[1] Nanda, K. K., Kruis, F. E. & Fissan, H. (2002). Phys. Rev. Lett., 89, 256103. [2] Nanda, K. K., Maisels, A., Kruis, F. E., Fissan, H. & Stappert, S. (2003). Phys. Rev.
Lett., 91, 106102. [3] Ouyang, G. , Tan, X., Wang, C. X. & Yang, G. W. (2006). Nanotechnology, 17, 4257. [4] Ouyang, G., Wang, C. X. & Yang, G. W. (2009). Chem. Rev., 109, 4221. [5] Gu, L. Q., Cheley, S. & Bayley, H. (2001). Science, 291, 636. [6] Zhu, X. F., Williams, J. S., Conway, M. J., Ridgway, M. C., Fortuna, F., Ruault, M. O.
& Bernas, H. (2001). Appl. Phys. Lett., 79, 3416. [7] Williams, J. S., Zhu, X. F., Ridgway, M. C., Conway, M. J., Williams, B. C., Fortuna,
F., Ruault, M. O. & Bernas, H. (2000). Appl. Phys. Lett., 77, 4280. [8] Ruault, M. O., Fortuna, F., Bernas, H., Ridgway, M. C. & Willams, J. S. (2002). Appl.
Phys. Lett., 81, 2617. [9] Brusa, R. S., Macchi, C., Mariazzi, S., Karwasz, G. P., Egger, W., Sperr, P. & Kögel, G.
(2005). Phys. Rev., B 71, 245320. [10] Seager, C. H. , Myers, S. M., Anderson, R. A., Warren, W. L. & Follstaedt, D. M.
(1994). Phys. Rev., B 50, 2458. [11] Rest, J. & Birtcher, R. C. (1989). J. Nucl. Mater., 168, 312. [12] Ishikawa, N., Awaji, M., Furuya, K., Birtcher, R. C. & Allen, C. W. (1997). Nucl.
Instrum. Methods Phys. Res., B, 127-128, 123. [13] Wang, L. M. & Birtcher, R. C. (1989). Appl. Phys. Lett., 55, 2494. [14] Kim, J. C. , David, G. & Cahill, R. S. (2003). Averback, Phys. Rev., B, 68, 094109.
Nanocavity: A Novel Functional Nanostructural Unit 187
[15] Zhu, X. F. (2006). J. Appl. Phys., 100, 034304. [16] Zhu, X. F. (2003). J. Phys: Condens., Matter, 15, L253. [17] Brett, D. A., Llewellyn, D. J. & Ridgway, M. C. (2006). Appl. Phys. Lett., 88, 222107. [18] Pe´richaud, I., Yakimov, E., Martinuzzi, S. & Dubois, C. J. (2001). J. Appl. Phys., 90,
2806. [19] Brett, D. A., de, G., Azevedo, M., Llewellyn, D. J. & Ridgway, M. C. (2003). Appl.
Phys. Lett., 83, 946. [20] Raineri, V., Fallica, P. G., Percolla, G., Bataglia, A., Barbagallo, M. & Campisano, S. U.
(1995). J. Appl. Phys., 78, 3727. [21] Myers, S. M., Petersen, G. A. & Seager, C. H. (1996). J. Appl. Phys., 80, 3717. [22] Roqueta, F., Ventura, L., Grob, J. J. & Jérisian, R. (2000). J. Appl. Phys., 88, 5000. [23] Brett, D. A., Llewellyn, D. J. & Ridgway, M. C. (2006). Nucl. Instr. and Meth., B 242,
576. [24] Cerofolini, G. F., Corni, F., Frabboni, S., Nobili, C., Ottaviani, G. & Tonini, R. (2000).
Mater. Sci. Eng., R, 27, 1. [25] Ou, X., Kögler, R., Mücklich, A., Skorupa, W., Möller, W., Wang, X., Gerlach, J. W. &
Rauschenbach, B. (2008). Appl. Phys. Lett., 93, 161907. [26] Ogura, A. (2003). Appl. Phys. Lett., 82, 4480. [27] Altug, H. & Englund, D. (2006). J. Vuckovic, Nature Phys., 2, 484. [28] Deweerd, W., Barancira, T., Langouche, G., Milants, K., Moons, R., Verheyden, J. &
Pattyn, H. (1996). Nucl. Instr. and Meth. B, 120, 51. [29] Kinomura, A., Williams, J. S., Wong-Leung, J. & Petravic, M. (1997). Nucl. Instr. and
Meth., B 127-128, 297. [30] Giorgio, S. & Henry, C. R. (2002). Eur. Phys. J. Appl. Phys., 20, 23. [31] Shibata, T., Bunker, B. A., Zhang, Z. & Meisel, D. (2002). J. Am. Chem. Soc., 124,
11989. [32] Loufova, S. S., Vlckova, B., Bastls, Z. & Hasslett, T. L. (2004). Langmuir, 20, 3407. [33] Selvakannan, P. R., Swami, A., Srisathiyanarayanan, D., Shirude, P. S., Pasricha, R.,
Mandale, A. B. & Sastry, M. (2004). Langmuir, 20, 7825. [34] Damle, C., Biswas, K. & Sastry, M. (2001). Langmuir, 17, 7156. [35] Doudna, C. M., Bertino, M. F., Blum, F. D., Tokuhiro, A. T., L-Dey, D.,
Chattopadhyay, S., Terry, J. (2003). J. Phys. Chem., B, 107, 2966. [36] Still, T., Sainidou, R., Retsch, M., Jonas, U., Spahn, P., Hellmann, G. P., Fytas, G.
(2008). Nano Lett., 8, 3194. [37] Fe´rey, G., Mellot-Draznieks, C., Sere, C., Millange, F., Dutour, J., Surbl e´, S. &
Margiolaki, I. (2005). Science, 309, 2040. [38] Li, R. & Sieradzki, K. (1992). Phys. Rev. Lett., 68, 1168. [39] Biener, J., Hodge, A. M., Hayes, J. R., Volkert, C. A., Zepeda-Ruiz, L. A., Hamza, A.
V. F. & Abraham, F. (2006). Nano Lett., 6, 2379. [40] Mathur, A. & Erlebacher, J. (2007). Appl. Phys. Lett., 90, 061910. [41] Rowsell, J. L. C., Millward, A. R., Park, K. S., Yaghi, O. M. (2004). J. Am. Chem. Soc.,
126, 5666. [42] Lee, J. H., Galli, G. A. & Grossman, J. C. (2008). Nano Lett., 8, 3750. [43] Smmalkorpi, M., Krasheninnikov, A., Kuronen, A., Nordlund, K. & Kaski, K. (2004).
Phys. Rev. B, 70, 245416. [44] Wong, E. W., Sheehan, P. E. & Lieber, C. M. (1997). Science, 277, 1971.
G. Ouyang and G. W. Yang 188
[45] Ren, Y., Fu, Y. Q., Liao, K., Li, F. & Cheng, H. M. (2004). Appl. Phys. Lett., 84, 2811. [46] Tu, Z. C. & Ouyang, Z. C. (2002). Phys. Rev., B 65, 233407. [47] Ouyang, G., Tan, X., Cai, M. Q., Yang, G. W. (2006). Appl. Phys. Lett., 89, 183104. [48] Ouyang, G., Tan, X. & Yang, G. W. (2006). Phys. Rev., B 74, 195408. [49] Caruso, F., Caruso, R. A. & Mohwald, H. (1998). Science, 282, 1111. [50] Sun, Y. G., Xia, Y. N. (2002). Science, 298, 2176. [51] Zeng, H. B., Cai, W. P., Liu, P. S., Xu, X. X., Zhou, H. J., Klingshirn, C. & Kalt, H.
(2008). ACS Nano, 2, 1661. [52] Chen, Z. T. & Gao, L. (2008). Cryst. Growth & Des., 8, 460. [53] Li, Z. Q., Xie, Y., Xiong, Y. J. & Zhang, R. (2003). New J. Chem., 27, 1518. [54] Tu, K. N. & Gösele, U. (2005). Appl. Phys. Lett., 86, 093111. [55] Brooks, H. (1955). Impurities and imperfection. Cleveland: American Society for
Metals. [56] Qi, W. H. & Wang, M. P. (2003). Phys., B 334, 432. [57] Sun, C. Q. (2007). Prog. Solid State Chem., 35, 1. [58] Bai, B. M. & Li, M. (2006). Nano Lett., 6, 2284. [59] Sun, C. Q., Tay, B. K., Lau, S. P., Sun, X., Zeng, X. T., Bai, H. L., Liu, H., Liu, Z. H.,
Jiang, E. Y. (2001). J. Appl. Phys., 90, 2615. [60] Seifert, G., Vietze, K. & Schmidt, R. (1996). J. Phys., B 29, 5183. [61] Hill, T. L. (1963). ― Thermodynamics of Small Systems‖, Vol.Ⅰ. W. A. Benjamin, New
York, NY. [62] Hill, T. L. (1964). ― Thermodynamics of Small Systems‖, Vol.Ⅱ. W. A. Benjamin, New
York, NY. [63] Huang, W. J., Sun, R., Tao, J., Menard, L. D., Nuzzo, R. G. & Zuo, J. M. (2008). Nature
Mater., 7, 308. [64] Mironets, O., Meyerheim, H. L., Tusche, C., Stepanyuk, V. S., Soyka, E., Zschack, P.,
Hong, H., Jeutter, N. & Felici, R. (2008). J. Kirschner, Phys. Rev. Lett., 100, 096103. [65] Feng, X. Q., Xia, R., Li, X. D. & Li, B. (2009). Appl. Phys. Lett., 94, 0119216. [66] Wulff, G. & Krystallogr, Z. (1901). Mineral., 34, 449. [67] Dingrevillea, R., Qu, J. M., Cherkaoui, M. (2005). J. Mech. Phys. Solids, 53, 1827. [68] Needs, R. J. (1987). Phys. Rev. Lett., 58, 53. [69] Lu, H. M. & Jiang, Q. (2004). J. Phys. Chem., B 108, 5617. [70] Buff, F. R. (1951). J. Chem. Phys., 19, 1591. [71] Tolman, R. C. (1949). J. Chem. Phys., 17, 333. [72] Koenig, F. O. (1950). J. Chem. Phys., 18, 449. [73] Kirkwood, J. G., Buff, F. P. (1949). J. Chem. Phys., 17, 338. [74] Nijmeijer, M. J. P., Bruin, C., van Woerkom, A. B. & BAakker, A. F. (1992). J. Chem.
Phys., 96, 565. [75] Moody, M. P. & Attard, P. (2001). J. Chem. Phys., 115, 8967. [76] Weissmuller, J., Cahn, J. W. (1997). Acta Mater., 45, 1899. [77] Lamber, R., Werjen, S. & Jaeger, N. I. (1998). Phys. Rev. B 51, 10968. [78] Liang, L. H., Li, J. C. & Jiang, Q. (2003). Physica B, 334, 49. [79] Chaudhari, P., Spaepen, F. & Steinhardt, P. J. (1983). Glass Metals II ed. H. Beck, H. J.
G¨untherodt (Berlin: Springer) ch 5. [80] Yang, F. Q. (2004). J. Appl. Phys., 95, 3516. [81] Ren, F., Jiang, G. Z., Liu, C. & Wang, J. B. (2006). Phys. Rev. Lett., 97, 165501.
Nanocavity: A Novel Functional Nanostructural Unit 189
[82] Ouyang, G., Li, X. L., Tan, X. & Yang, G. W. (2006). Appl. Phys. Lett., 89, 031904. [83] Wang, C. X., Yang, G. W. (2005). Mater. Sci. Eng., R 49, 157. [84] Eaglesham, D. J., White, A. E., Feldman, L. C., Moriya, N. & Jacobson, D. C. (1993).
Phys. Rev. Lett., 70, 1643. [85] Zhu, X. F. & Wang, Z. G. (2005). Chin. Phys. Lett., 22, 657. [86] Kovač, D., Otto, G., Hobler, G. (2005). Nucl. Instrum. Methods Phys. Res., B 228, 226. [87] Ruault, M. O., Ridgway, M. C., Fortuna, F., Bernas, H. & Williams, J. S. (2003). Nucl.
Inst. and Meth. B, 206, 912. [88] Schmidt, H., Borchardt, G., Rudolphi, M., Baumann, H. & Bruns, M. (2004). Appl.
Phys. Lett., 85, 582. [89] Schmidt, H., Gupta, M., Bruns, M. (2006). Phys. Rev. Lett., 96, 055901. [90] Takagi, M. (1954). J. Phys. Soc. Jpn., 9, 359. [91] Ph. Buffat, J. P. (1976). Borel, Phys. Rev., A, 13, 2287. [92] Reis, H., Mirabel, P. & Whetten, R. L. (1988). J. Phys. Chem., 92, 7241. [93] Couchman, P. R. & Jesser, W. A. (1977). Nature, 269, 481. [94] Boehler, R. (1993). Nature, 363, 534. [95] Cohen, R. & Gong, Z. (1994). Phys. Rev. B, 50, 12301. [96] Goldstein, A. N., Echer, C. M. & Alivisatos, A. P. (1992). Science, 256, 1425. [97] Ouyang, G., Li, X. L. & Yang, G. W. (2008). Appl. Phys. Lett., 92, 051902. [98] Ouyang, G., Li, X. L., Tan, X. & Yang, G. W. (2008). Nanotechnology, 19, 045709. [99] Volmer, M. & Weber, A. Z. (1925). Phys. Chem., 119, 277. [100] Farkas, L. Z. (1927). Phys. Chem., 125, 236. [101] Turnbull, D. & Fisher, J. C. (1949). J. Chem. Phys., 17, 71. [102] Turnbull, D. (1950). J. Chem. Phys., 18, 198. [103] Turnbull, D. (1952). J. Chem. Phys., 20, 411. [104] Defay, R. & Prigogine, I. (1951). Surface Tension and Adsorption, Wiley, New York,
(English translation, 1966). [105] Pan, X. L., Fan, Z. L., Chen, W., Ding, Y. J., Luo, H. Y., Bao, X. H. (2007). Nature
Mater., 6, 507.

In: Nanoporous Materials Types, Properties and Uses ISBN: 978-1-61668-182-1 Editor: Samuel B. Jenkins, pp. 191-209 © 2010 Nova Science Publishers, Inc.
Chapter 5
RECENT ADVANCES IN THE TITANIA POROUS
MATERIALS GROWTH THROUGH
MICRO-ARC OXIDATION
Arūnas Jagminas Institute of Chemistry, A. Goštauto 9, LT-01108 Vilnius, Lithuania
ABSTRACT
Micro-arc oxidation or so-called plasma electrolytic oxidation (PEO) is an effective way to make much thicker oxide films on the surface of titanium and its alloys surprisingly improving protection properties of this material. PEO operates at potentials above the breakdown voltage of the growing passive film on the Ti anode and is characterized by numerous arcs moving rapidly over the electrode. Due to a high temperature in the micro-plasma channels, penetrating continually the growing film from the surface to the metal/oxide interface during micro-arc oxidation, the fused components of solution are usually inserted into these films. Furthermore, the quantity of sintered compounds increases with the treatment time producing a ceramic layer with nonuniform distribution of elements, porosity, and properties. On the other hand, the anodizing of Ti under micro-arc conditions in the aqueous solutions of pure acids, such as sulphuric and phosphoric, results in the formation of rough films with a network of pores randomly distributed and nonuniform in size.
In this chapter, recent progress in fabrication, design, characterization and potential applications of quite pure, thick porous titania coatings by the PEO way are presented and discussed. We showed also that the growth of PEO coatings in strongly alkaline silicate solutions originates from the formation of low valence titanium oxides at the substrate surface as thick as several micrometers.
INTRODUCTION
During last two decades, great progress in materials science has been achieved mainly due to the developing of modern technologies and complex research of nanoporous and
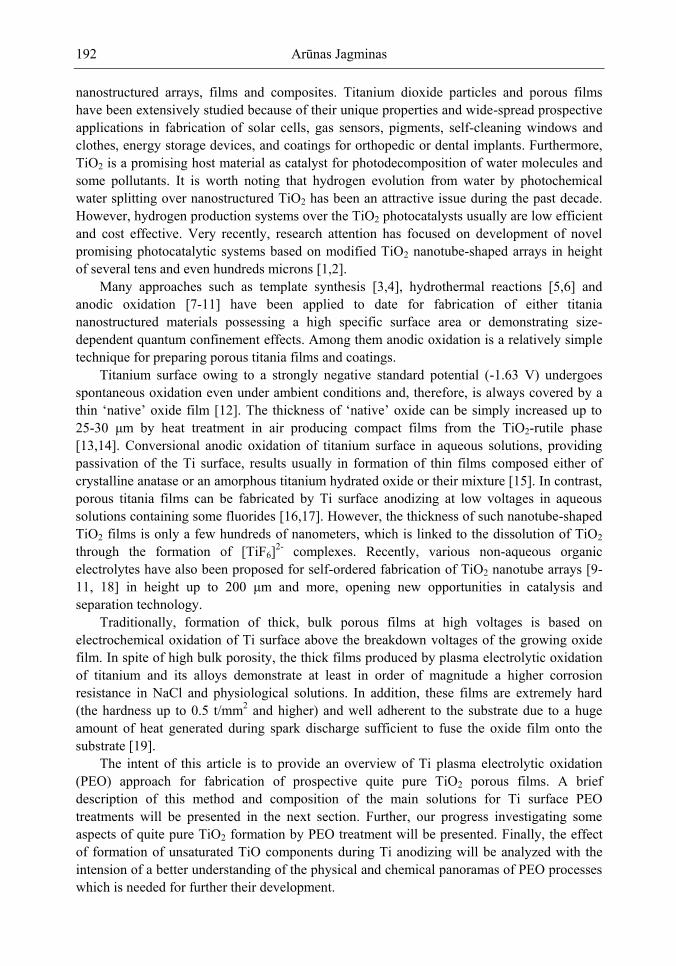
Arūnas Jagminas 192
nanostructured arrays, films and composites. Titanium dioxide particles and porous films have been extensively studied because of their unique properties and wide-spread prospective applications in fabrication of solar cells, gas sensors, pigments, self-cleaning windows and clothes, energy storage devices, and coatings for orthopedic or dental implants. Furthermore, TiO2 is a promising host material as catalyst for photodecomposition of water molecules and some pollutants. It is worth noting that hydrogen evolution from water by photochemical water splitting over nanostructured TiO2 has been an attractive issue during the past decade. However, hydrogen production systems over the TiO2 photocatalysts usually are low efficient and cost effective. Very recently, research attention has focused on development of novel promising photocatalytic systems based on modified TiO2 nanotube-shaped arrays in height of several tens and even hundreds microns [1,2].
Many approaches such as template synthesis [3,4], hydrothermal reactions [5,6] and anodic oxidation [7-11] have been applied to date for fabrication of either titania nanostructured materials possessing a high specific surface area or demonstrating size-dependent quantum confinement effects. Among them anodic oxidation is a relatively simple technique for preparing porous titania films and coatings.
Titanium surface owing to a strongly negative standard potential (-1.63 V) undergoes spontaneous oxidation even under ambient conditions and, therefore, is always covered by a thin ‗native‘ oxide film [12]. The thickness of ‗native‘ oxide can be simply increased up to
25-30 μm by heat treatment in air producing compact films from the TiO2-rutile phase [13,14]. Conversional anodic oxidation of titanium surface in aqueous solutions, providing passivation of the Ti surface, results usually in formation of thin films composed either of crystalline anatase or an amorphous titanium hydrated oxide or their mixture [15]. In contrast, porous titania films can be fabricated by Ti surface anodizing at low voltages in aqueous solutions containing some fluorides [16,17]. However, the thickness of such nanotube-shaped TiO2 films is only a few hundreds of nanometers, which is linked to the dissolution of TiO2 through the formation of [TiF6]2- complexes. Recently, various non-aqueous organic electrolytes have also been proposed for self-ordered fabrication of TiO2 nanotube arrays [9-11, 18] in height up to 200 μm and more, opening new opportunities in catalysis and separation technology.
Traditionally, formation of thick, bulk porous films at high voltages is based on electrochemical oxidation of Ti surface above the breakdown voltages of the growing oxide film. In spite of high bulk porosity, the thick films produced by plasma electrolytic oxidation of titanium and its alloys demonstrate at least in order of magnitude a higher corrosion resistance in NaCl and physiological solutions. In addition, these films are extremely hard (the hardness up to 0.5 t/mm2 and higher) and well adherent to the substrate due to a huge amount of heat generated during spark discharge sufficient to fuse the oxide film onto the substrate [19].
The intent of this article is to provide an overview of Ti plasma electrolytic oxidation (PEO) approach for fabrication of prospective quite pure TiO2 porous films. A brief description of this method and composition of the main solutions for Ti surface PEO treatments will be presented in the next section. Further, our progress investigating some aspects of quite pure TiO2 formation by PEO treatment will be presented. Finally, the effect of formation of unsaturated TiO components during Ti anodizing will be analyzed with the intension of a better understanding of the physical and chemical panoramas of PEO processes which is needed for further their development.
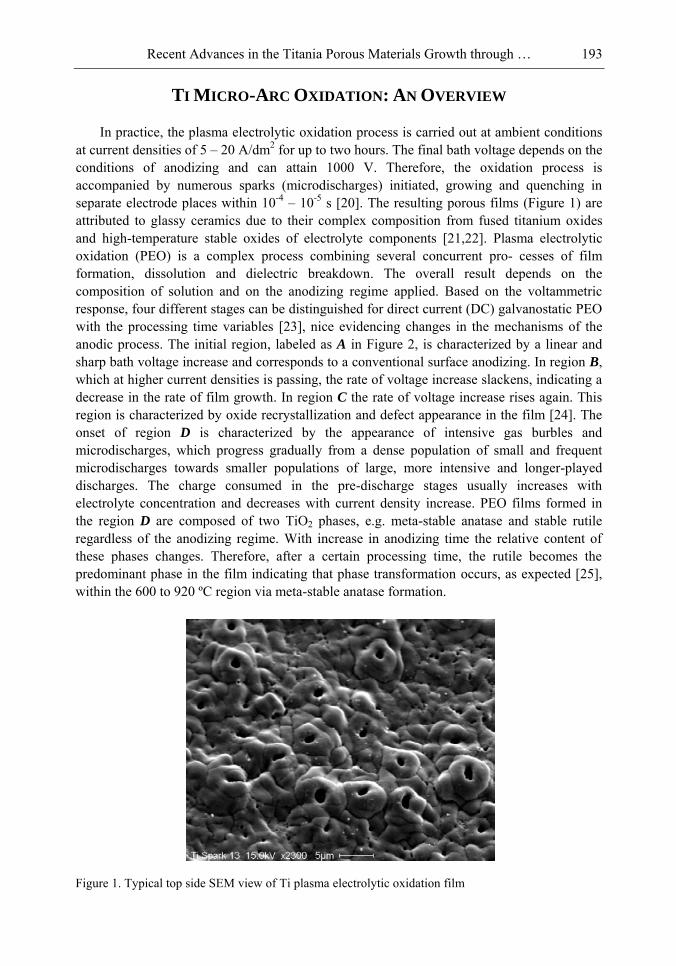
Recent Advances in the Titania Porous Materials Growth through … 193
TI MICRO-ARC OXIDATION: AN OVERVIEW
In practice, the plasma electrolytic oxidation process is carried out at ambient conditions at current densities of 5 – 20 A/dm2 for up to two hours. The final bath voltage depends on the conditions of anodizing and can attain 1000 V. Therefore, the oxidation process is accompanied by numerous sparks (microdischarges) initiated, growing and quenching in separate electrode places within 10-4 – 10-5 s [20]. The resulting porous films (Figure 1) are attributed to glassy ceramics due to their complex composition from fused titanium oxides and high-temperature stable oxides of electrolyte components [21,22]. Plasma electrolytic oxidation (PEO) is a complex process combining several concurrent pro- cesses of film formation, dissolution and dielectric breakdown. The overall result depends on the composition of solution and on the anodizing regime applied. Based on the voltammetric response, four different stages can be distinguished for direct current (DC) galvanostatic PEO with the processing time variables [23], nice evidencing changes in the mechanisms of the anodic process. The initial region, labeled as A in Figure 2, is characterized by a linear and sharp bath voltage increase and corresponds to a conventional surface anodizing. In region B, which at higher current densities is passing, the rate of voltage increase slackens, indicating a decrease in the rate of film growth. In region C the rate of voltage increase rises again. This region is characterized by oxide recrystallization and defect appearance in the film [24]. The onset of region D is characterized by the appearance of intensive gas burbles and microdischarges, which progress gradually from a dense population of small and frequent microdischarges towards smaller populations of large, more intensive and longer-played discharges. The charge consumed in the pre-discharge stages usually increases with electrolyte concentration and decreases with current density increase. PEO films formed in the region D are composed of two TiO2 phases, e.g. meta-stable anatase and stable rutile regardless of the anodizing regime. With increase in anodizing time the relative content of these phases changes. Therefore, after a certain processing time, the rutile becomes the predominant phase in the film indicating that phase transformation occurs, as expected [25], within the 600 to 920 ºC region via meta-stable anatase formation.
Figure 1. Typical top side SEM view of Ti plasma electrolytic oxidation film
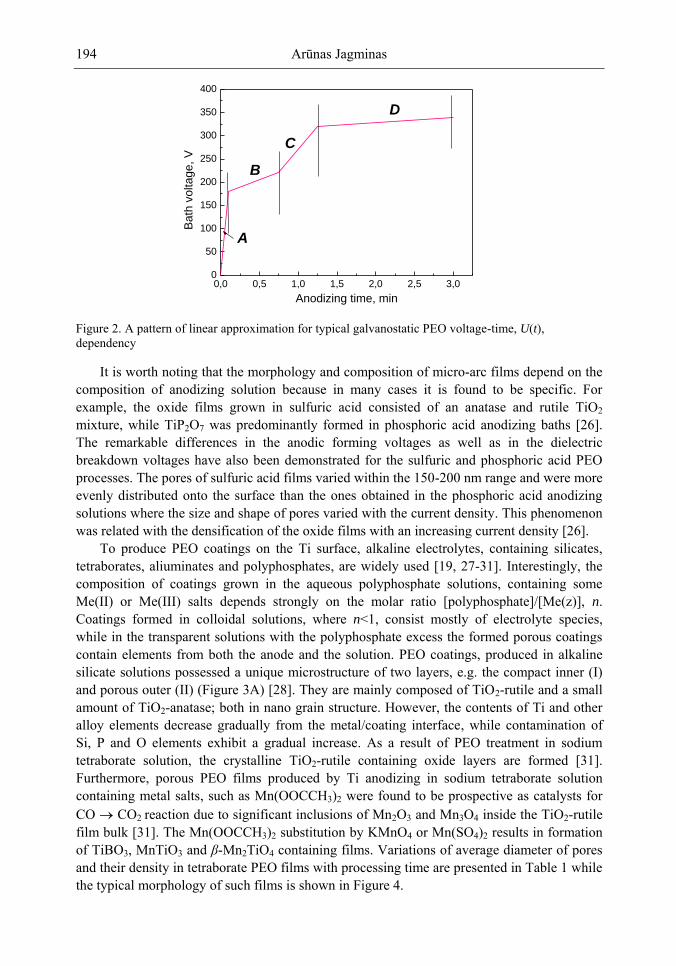
Arūnas Jagminas 194
0,0 0,5 1,0 1,5 2,0 2,5 3,00
50
100
150
200
250
300
350
400
A
D
C
BB
ath
voltage, V
Anodizing time, min
Figure 2. A pattern of linear approximation for typical galvanostatic PEO voltage-time, U(t), dependency
It is worth noting that the morphology and composition of micro-arc films depend on the composition of anodizing solution because in many cases it is found to be specific. For example, the oxide films grown in sulfuric acid consisted of an anatase and rutile TiO2 mixture, while TiP2O7 was predominantly formed in phosphoric acid anodizing baths [26]. The remarkable differences in the anodic forming voltages as well as in the dielectric breakdown voltages have also been demonstrated for the sulfuric and phosphoric acid PEO processes. The pores of sulfuric acid films varied within the 150-200 nm range and were more evenly distributed onto the surface than the ones obtained in the phosphoric acid anodizing solutions where the size and shape of pores varied with the current density. This phenomenon was related with the densification of the oxide films with an increasing current density [26].
To produce PEO coatings on the Ti surface, alkaline electrolytes, containing silicates, tetraborates, aliuminates and polyphosphates, are widely used [19, 27-31]. Interestingly, the composition of coatings grown in the aqueous polyphosphate solutions, containing some Me(II) or Me(III) salts depends strongly on the molar ratio [polyphosphate]/[Me(z)], n. Coatings formed in colloidal solutions, where n<1, consist mostly of electrolyte species, while in the transparent solutions with the polyphosphate excess the formed porous coatings contain elements from both the anode and the solution. PEO coatings, produced in alkaline silicate solutions possessed a unique microstructure of two layers, e.g. the compact inner (I) and porous outer (II) (Figure 3A) [28]. They are mainly composed of TiO2-rutile and a small amount of TiO2-anatase; both in nano grain structure. However, the contents of Ti and other alloy elements decrease gradually from the metal/coating interface, while contamination of Si, P and O elements exhibit a gradual increase. As a result of PEO treatment in sodium tetraborate solution, the crystalline TiO2-rutile containing oxide layers are formed [31]. Furthermore, porous PEO films produced by Ti anodizing in sodium tetraborate solution containing metal salts, such as Mn(OOCCH3)2 were found to be prospective as catalysts for CO CO2 reaction due to significant inclusions of Mn2O3 and Mn3O4 inside the TiO2-rutile film bulk [31]. The Mn(OOCCH3)2 substitution by KMnO4 or Mn(SO4)2 results in formation of TiBO3, MnTiO3 and β-Mn2TiO4 containing films. Variations of average diameter of pores and their density in tetraborate PEO films with processing time are presented in Table 1 while the typical morphology of such films is shown in Figure 4.
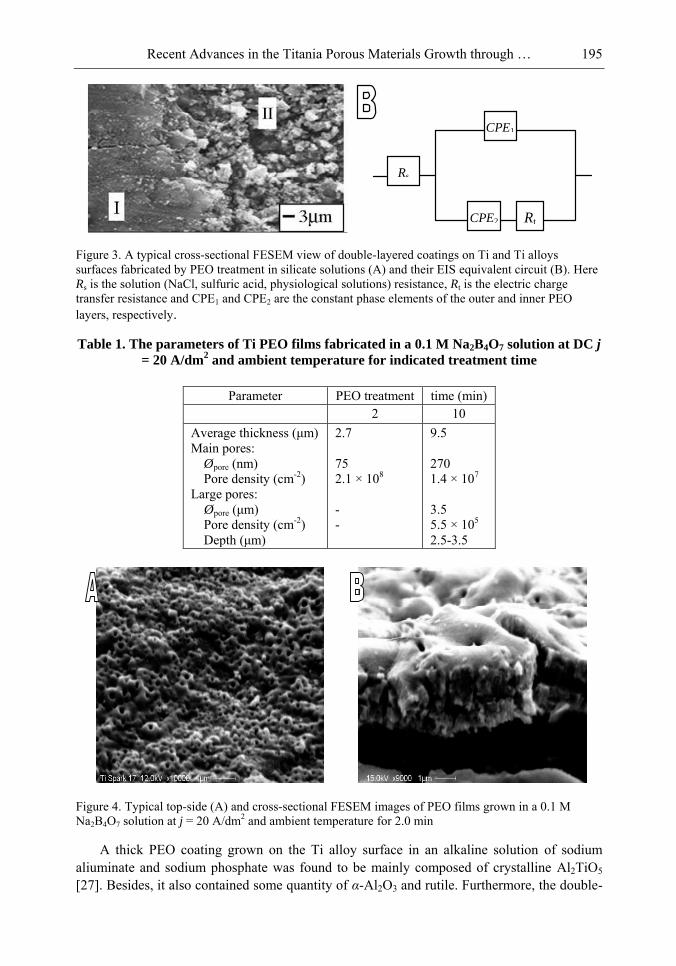
Recent Advances in the Titania Porous Materials Growth through … 195
Figure 3. A typical cross-sectional FESEM view of double-layered coatings on Ti and Ti alloys surfaces fabricated by PEO treatment in silicate solutions (A) and their EIS equivalent circuit (B). Here Rs is the solution (NaCl, sulfuric acid, physiological solutions) resistance, Rt is the electric charge transfer resistance and CPE1 and CPE2 are the constant phase elements of the outer and inner PEO layers, respectively.
Table 1. The parameters of Ti PEO films fabricated in a 0.1 M Na2B4O7 solution at DC j
= 20 A/dm2 and ambient temperature for indicated treatment time
Parameter PEO treatment time (min) 2 10
Average thickness (μm) Main pores:
Øpore (nm) Pore density (cm-2)
Large pores: Øpore (μm) Pore density (cm-2) Depth (μm)
2.7 75 2.1 × 10⁸ - -
9.5 270 1.4 × 10⁷ 3.5 5.5 × 10⁵ 2.5-3.5
Figure 4. Typical top-side (A) and cross-sectional FESEM images of PEO films grown in a 0.1 M Na2B4O7 solution at j = 20 A/dm2 and ambient temperature for 2.0 min
A thick PEO coating grown on the Ti alloy surface in an alkaline solution of sodium aliuminate and sodium phosphate was found to be mainly composed of crystalline Al2TiO5 [27]. Besides, it also contained some quantity of α-Al2O3 and rutile. Furthermore, the double-
Rs
CPE1
CPE2 Rt
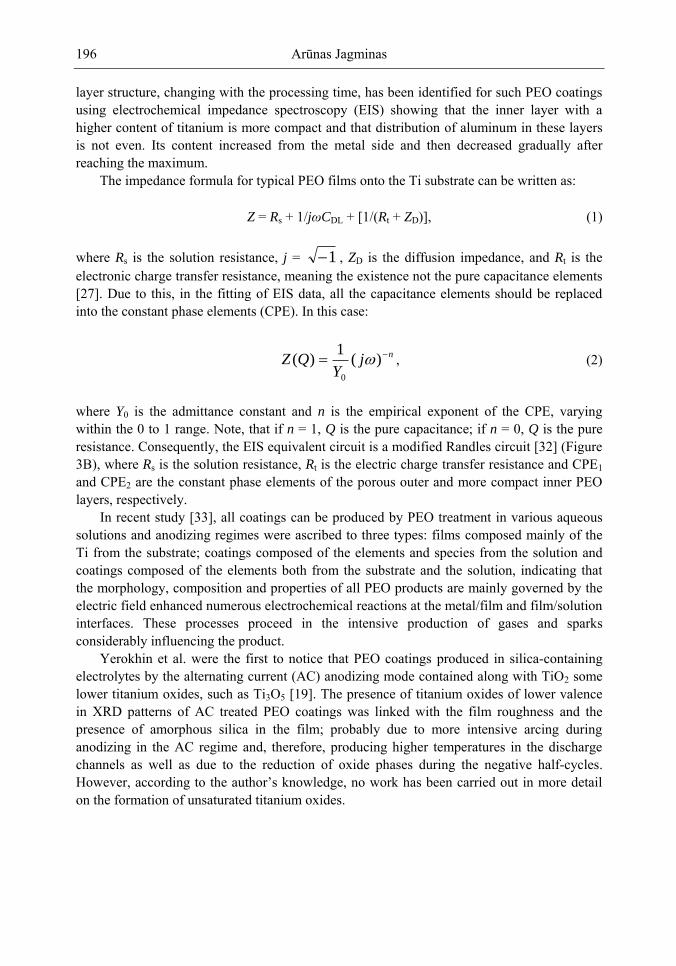
Arūnas Jagminas 196
layer structure, changing with the processing time, has been identified for such PEO coatings using electrochemical impedance spectroscopy (EIS) showing that the inner layer with a higher content of titanium is more compact and that distribution of aluminum in these layers is not even. Its content increased from the metal side and then decreased gradually after reaching the maximum.
The impedance formula for typical PEO films onto the Ti substrate can be written as:
Z = Rs + 1/jωCDL + [1/(Rt + ZD)], (1)
where Rs is the solution resistance, j = 1 , ZD is the diffusion impedance, and Rt is the electronic charge transfer resistance, meaning the existence not the pure capacitance elements [27]. Due to this, in the fitting of EIS data, all the capacitance elements should be replaced into the constant phase elements (CPE). In this case:
njY
QZ )(1
)(0
, (2)
where Y0 is the admittance constant and n is the empirical exponent of the CPE, varying within the 0 to 1 range. Note, that if n = 1, Q is the pure capacitance; if n = 0, Q is the pure resistance. Consequently, the EIS equivalent circuit is a modified Randles circuit [32] (Figure 3B), where Rs is the solution resistance, Rt is the electric charge transfer resistance and CPE1 and CPE2 are the constant phase elements of the porous outer and more compact inner PEO layers, respectively.
In recent study [33], all coatings can be produced by PEO treatment in various aqueous solutions and anodizing regimes were ascribed to three types: films composed mainly of the Ti from the substrate; coatings composed of the elements and species from the solution and coatings composed of the elements both from the substrate and the solution, indicating that the morphology, composition and properties of all PEO products are mainly governed by the electric field enhanced numerous electrochemical reactions at the metal/film and film/solution interfaces. These processes proceed in the intensive production of gases and sparks considerably influencing the product.
Yerokhin et al. were the first to notice that PEO coatings produced in silica-containing electrolytes by the alternating current (AC) anodizing mode contained along with TiO2 some lower titanium oxides, such as Ti3O5 [19]. The presence of titanium oxides of lower valence in XRD patterns of AC treated PEO coatings was linked with the film roughness and the presence of amorphous silica in the film; probably due to more intensive arcing during anodizing in the AC regime and, therefore, producing higher temperatures in the discharge channels as well as due to the reduction of oxide phases during the negative half-cycles. However, according to the author‘s knowledge, no work has been carried out in more detail
on the formation of unsaturated titanium oxides.
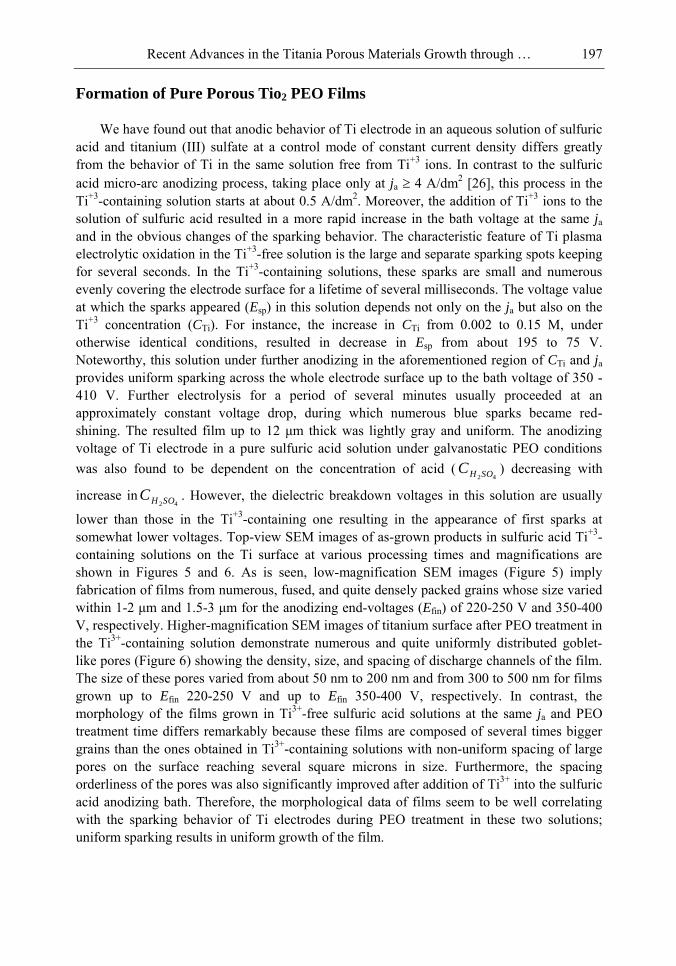
Recent Advances in the Titania Porous Materials Growth through … 197
Formation of Pure Porous Tio2 PEO Films
We have found out that anodic behavior of Ti electrode in an aqueous solution of sulfuric acid and titanium (III) sulfate at a control mode of constant current density differs greatly from the behavior of Ti in the same solution free from Ti+3 ions. In contrast to the sulfuric acid micro-arc anodizing process, taking place only at ja 4 A/dm2 [26], this process in the Ti+3-containing solution starts at about 0.5 A/dm2. Moreover, the addition of Ti+3 ions to the solution of sulfuric acid resulted in a more rapid increase in the bath voltage at the same ja and in the obvious changes of the sparking behavior. The characteristic feature of Ti plasma electrolytic oxidation in the Ti+3-free solution is the large and separate sparking spots keeping for several seconds. In the Ti+3-containing solutions, these sparks are small and numerous evenly covering the electrode surface for a lifetime of several milliseconds. The voltage value at which the sparks appeared (Esp) in this solution depends not only on the ja but also on the Ti+3 concentration (CTi). For instance, the increase in CTi from 0.002 to 0.15 M, under otherwise identical conditions, resulted in decrease in Esp from about 195 to 75 V. Noteworthy, this solution under further anodizing in the aforementioned region of CTi and ja provides uniform sparking across the whole electrode surface up to the bath voltage of 350 - 410 V. Further electrolysis for a period of several minutes usually proceeded at an approximately constant voltage drop, during which numerous blue sparks became red-shining. The resulted film up to 12 μm thick was lightly gray and uniform. The anodizing
voltage of Ti electrode in a pure sulfuric acid solution under galvanostatic PEO conditions was also found to be dependent on the concentration of acid (
42SOHC ) decreasing with
increase in42SOHC . However, the dielectric breakdown voltages in this solution are usually
lower than those in the Ti+3-containing one resulting in the appearance of first sparks at somewhat lower voltages. Top-view SEM images of as-grown products in sulfuric acid Ti+3-containing solutions on the Ti surface at various processing times and magnifications are shown in Figures 5 and 6. As is seen, low-magnification SEM images (Figure 5) imply fabrication of films from numerous, fused, and quite densely packed grains whose size varied within 1-2 μm and 1.5-3 μm for the anodizing end-voltages (Efin) of 220-250 V and 350-400 V, respectively. Higher-magnification SEM images of titanium surface after PEO treatment in the Ti3+-containing solution demonstrate numerous and quite uniformly distributed goblet-like pores (Figure 6) showing the density, size, and spacing of discharge channels of the film. The size of these pores varied from about 50 nm to 200 nm and from 300 to 500 nm for films grown up to Efin 220-250 V and up to Efin 350-400 V, respectively. In contrast, the morphology of the films grown in Ti3+-free sulfuric acid solutions at the same ja and PEO treatment time differs remarkably because these films are composed of several times bigger grains than the ones obtained in Ti3+-containing solutions with non-uniform spacing of large pores on the surface reaching several square microns in size. Furthermore, the spacing orderliness of the pores was also significantly improved after addition of Ti3+ into the sulfuric acid anodizing bath. Therefore, the morphological data of films seem to be well correlating with the sparking behavior of Ti electrodes during PEO treatment in these two solutions; uniform sparking results in uniform growth of the film.
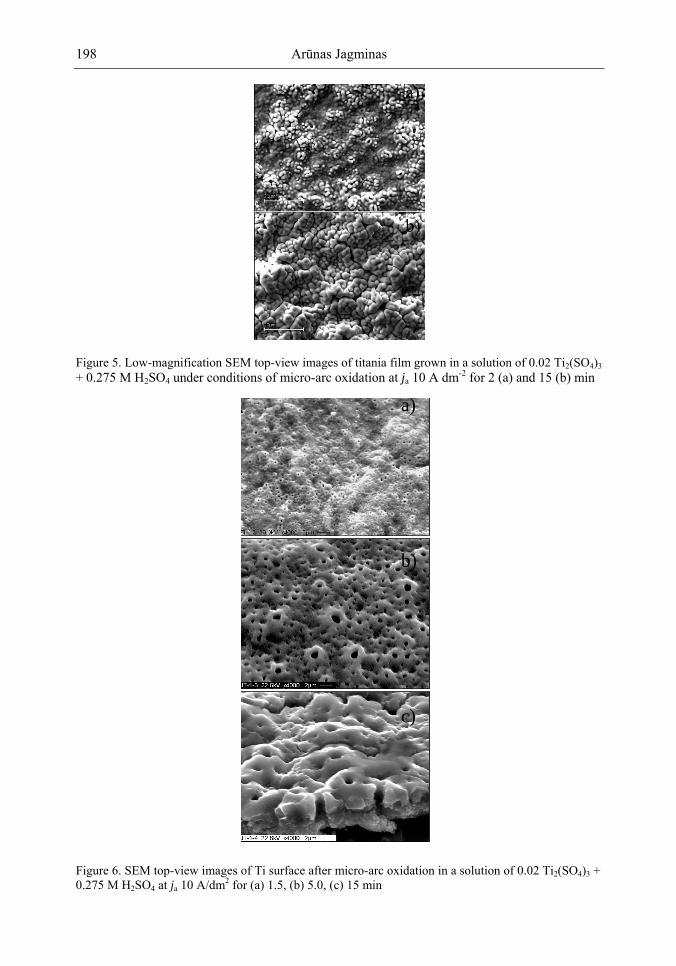
Arūnas Jagminas 198
Figure 5. Low-magnification SEM top-view images of titania film grown in a solution of 0.02 Ti2(SO4)3 + 0.275 M H2SO4 under conditions of micro-arc oxidation at ja 10 A dm-2 for 2 (a) and 15 (b) min
Figure 6. SEM top-view images of Ti surface after micro-arc oxidation in a solution of 0.02 Ti2(SO4)3 + 0.275 M H2SO4 at ja 10 A/dm2 for (a) 1.5, (b) 5.0, (c) 15 min
a)
b)
c)
a)
b)
c)
Recent Advances in the Titania Porous Materials Growth through … 199
Figure 7. Glancing angle XRD patterns of titania film fabricated by micro-arc oxidation of Ti surface under the conditions as in Figure 5 for 30, 300, and 1200 s. Peak labels correspond to the following phases: TiO2(R), rutile [21-2176]; TiO2(A), anatase [21-1227] and Ti, titanium [5-0682]
Glancing-angle XRD patterns of the film grown on the titanium surface in the Ti+3-containing sulfuric acid solution at different micro-arc oxidation periods are shown in Figure 7. The diffraction lines of the film at 2Θ 27.455
o (3.246 Å), 36.113o (2.485Å), 41.281o (2.185 Å), 54.329o (1.687 Å), 68.998o (1.360 Å), and 69.781o (1.347 Å) correspond well to the rutile phase of TiO2 (PDF 21-1272).
Two additional peaks at 2Θ 25.319o (3.515 Å) and 48.023o (1.893 Å) can be assigned to
the anatase phase of TiO2 (PDF 21-1276). Figure 8a. presents the Raman spectra of products fabricated by PEO treatment of Ti
electrode at different periods of this process. As seen, there are five main peaks in the spectra located at 635, 516, 395, 347, and 146 cm-1. The intensity of these features grows up with increasing treatment time.
Under ambient conditions titanium oxide exists in three main polymorphic forms: anatase (I41/amd space group, 19
4hD ), rutile (P42/mnm space group, 14
4hD ), and brookite (Pbca space
group, 15
2hD ). The optical phonons of anatase are distributed by the symmetry as follows [34]:
Γopt = A1g (R) + A2u (IR) + 2B1g (R) + B2u (S) +3Eg (R) + 2Eu (IR) (3)
The group theory predicts six Raman active modes with A1g, B1g, and Eg symmetries. The infrared active modes correspond to A2u and Eu symmetries, while the B2u mode is silent. The most intense band of bulk anatase was detected at 144 cm-1 and assigned to the δ(O-Ti-O) vibration mode with Eg symmetry [35]. Other vibration modes were observed at 197 (Eg), 399 (B1g), 519 (B1g), 513 (A1g), and 639 (Eg) cm-1 [35,36]. Thus, the experimentally observed Raman features (Figure 8) were assigned to anatase TiO2: 146 (Eg), 395 (B1g), 516 (unresolved A1g + B1g), and 635 (Eg) cm-1. In the 120 s-processed TiO2 sample a weak intensity band was observed in the vicinity of 444 cm-1. This peak was not detected in the
20 30 40 50 60 700
100
200
300
400
500
600
700
800
30 s
300 s
1200 s
TiO
2(R
)
TiO
2(R
)
TiO
2(R
)
TiO
2(A
)
TiO
2(A
)
TiO
2(R
)
TiO
2(R
)
TiO
2(R
)
TiO
2(R
)
Ti(110),
TiO
2(A
)
Ti(102)
Ti(101)
Ti(0
02
)
Ti(100)
Inte
nsity /
cp
s
2 / deg
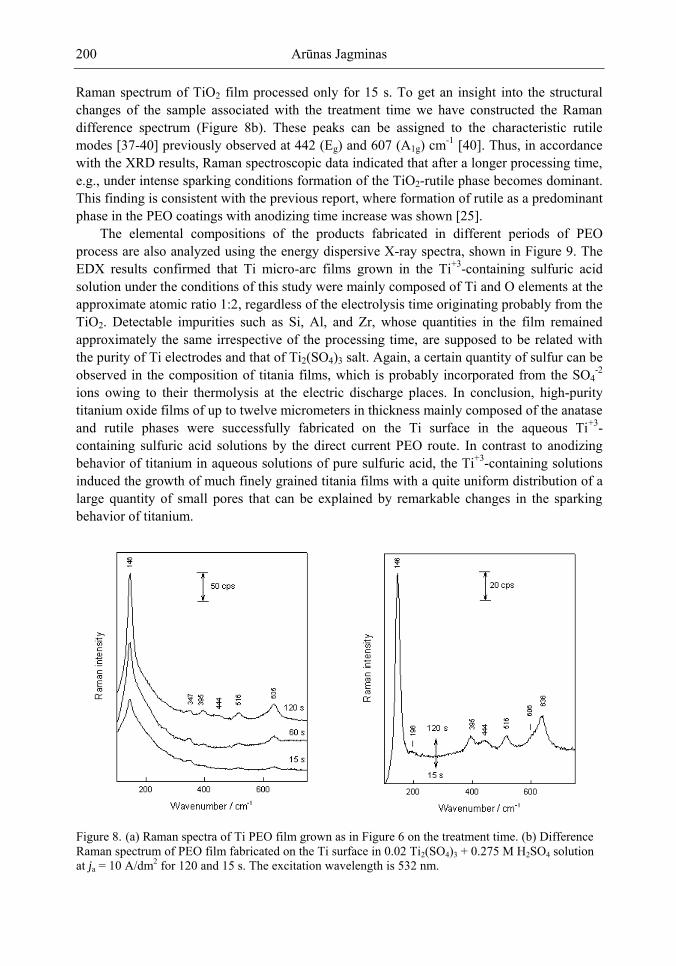
Arūnas Jagminas 200
Raman spectrum of TiO2 film processed only for 15 s. To get an insight into the structural changes of the sample associated with the treatment time we have constructed the Raman difference spectrum (Figure 8b). These peaks can be assigned to the characteristic rutile modes [37-40] previously observed at 442 (Eg) and 607 (A1g) cm-1 [40]. Thus, in accordance with the XRD results, Raman spectroscopic data indicated that after a longer processing time, e.g., under intense sparking conditions formation of the TiO2-rutile phase becomes dominant. This finding is consistent with the previous report, where formation of rutile as a predominant phase in the PEO coatings with anodizing time increase was shown [25].
The elemental compositions of the products fabricated in different periods of PEO process are also analyzed using the energy dispersive X-ray spectra, shown in Figure 9. The EDX results confirmed that Ti micro-arc films grown in the Ti+3-containing sulfuric acid solution under the conditions of this study were mainly composed of Ti and O elements at the approximate atomic ratio 1:2, regardless of the electrolysis time originating probably from the TiO2. Detectable impurities such as Si, Al, and Zr, whose quantities in the film remained approximately the same irrespective of the processing time, are supposed to be related with the purity of Ti electrodes and that of Ti2(SO4)3 salt. Again, a certain quantity of sulfur can be observed in the composition of titania films, which is probably incorporated from the SO4
-2 ions owing to their thermolysis at the electric discharge places. In conclusion, high-purity titanium oxide films of up to twelve micrometers in thickness mainly composed of the anatase and rutile phases were successfully fabricated on the Ti surface in the aqueous Ti+3-containing sulfuric acid solutions by the direct current PEO route. In contrast to anodizing behavior of titanium in aqueous solutions of pure sulfuric acid, the Ti+3-containing solutions induced the growth of much finely grained titania films with a quite uniform distribution of a large quantity of small pores that can be explained by remarkable changes in the sparking behavior of titanium.
Figure 8. (a) Raman spectra of Ti PEO film grown as in Figure 6 on the treatment time. (b) Difference Raman spectrum of PEO film fabricated on the Ti surface in 0.02 Ti2(SO4)3 + 0.275 M H2SO4 solution at ja = 10 A/dm2 for 120 and 15 s. The excitation wavelength is 532 nm.
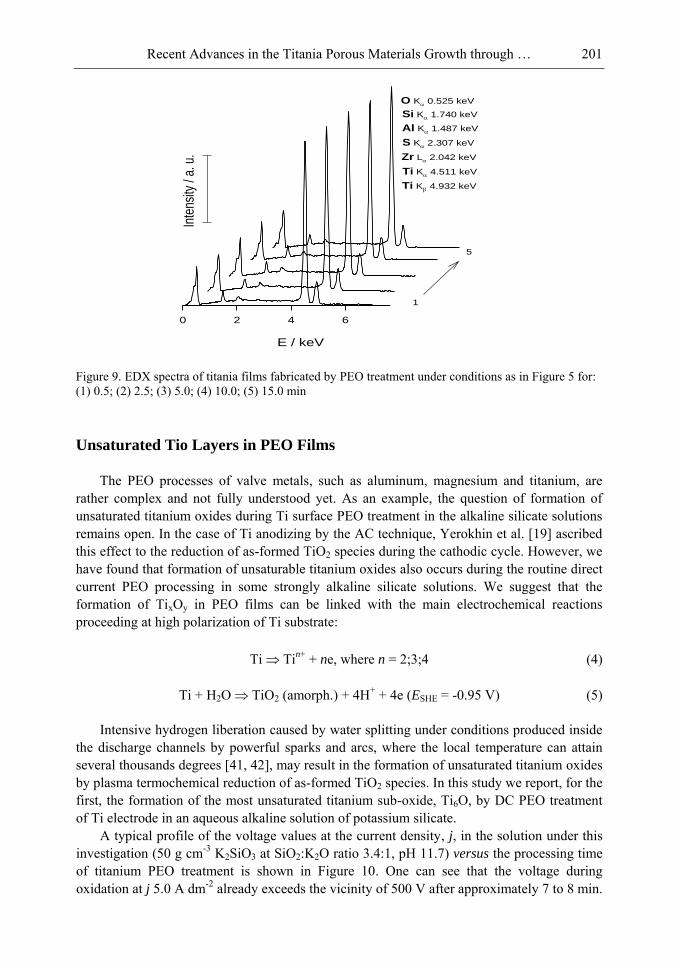
Recent Advances in the Titania Porous Materials Growth through … 201
E / keV
0 2 4 6 8 10 12
Inte
nsity
/ a.
u.
O K 0.525 keV
Si K 1.740 keV
Ti K 4.511 keV
Zr L 2.042 keV
Ti K 4.932 keV
Al K 1.487 keV
S K 2.307 keV
1
5
Figure 9. EDX spectra of titania films fabricated by PEO treatment under conditions as in Figure 5 for: (1) 0.5; (2) 2.5; (3) 5.0; (4) 10.0; (5) 15.0 min
Unsaturated Tio Layers in PEO Films
The PEO processes of valve metals, such as aluminum, magnesium and titanium, are rather complex and not fully understood yet. As an example, the question of formation of unsaturated titanium oxides during Ti surface PEO treatment in the alkaline silicate solutions remains open. In the case of Ti anodizing by the AC technique, Yerokhin et al. [19] ascribed this effect to the reduction of as-formed TiO2 species during the cathodic cycle. However, we have found that formation of unsaturable titanium oxides also occurs during the routine direct current PEO processing in some strongly alkaline silicate solutions. We suggest that the formation of TixOy in PEO films can be linked with the main electrochemical reactions proceeding at high polarization of Ti substrate:
Ti Tin+ + ne, where n = 2;3;4 (4)
Ti + H2O TiO2 (amorph.) + 4H+ + 4e (ESHE = -0.95 V) (5)
Intensive hydrogen liberation caused by water splitting under conditions produced inside the discharge channels by powerful sparks and arcs, where the local temperature can attain several thousands degrees [41, 42], may result in the formation of unsaturated titanium oxides by plasma termochemical reduction of as-formed TiO2 species. In this study we report, for the first, the formation of the most unsaturated titanium sub-oxide, Ti6O, by DC PEO treatment of Ti electrode in an aqueous alkaline solution of potassium silicate.
A typical profile of the voltage values at the current density, j, in the solution under this investigation (50 g cm-3 K2SiO3 at SiO2:K2O ratio 3.4:1, pH 11.7) versus the processing time of titanium PEO treatment is shown in Figure 10. One can see that the voltage during oxidation at j 5.0 A dm-2 already exceeds the vicinity of 500 V after approximately 7 to 8 min.
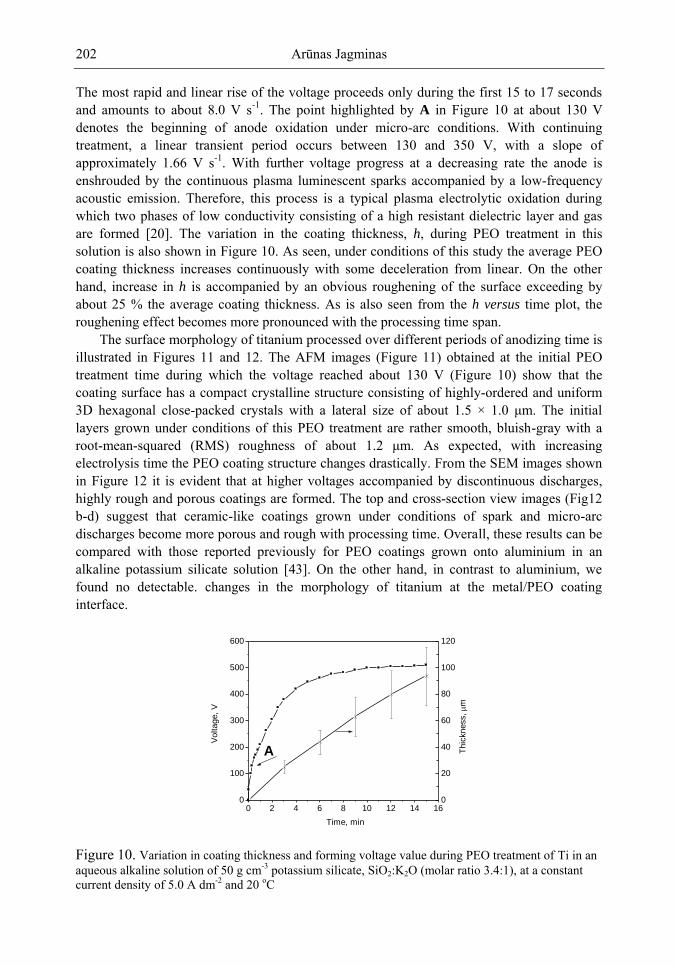
Arūnas Jagminas 202
The most rapid and linear rise of the voltage proceeds only during the first 15 to 17 seconds and amounts to about 8.0 V s-1. The point highlighted by A in Figure 10 at about 130 V denotes the beginning of anode oxidation under micro-arc conditions. With continuing treatment, a linear transient period occurs between 130 and 350 V, with a slope of approximately 1.66 V s-1. With further voltage progress at a decreasing rate the anode is enshrouded by the continuous plasma luminescent sparks accompanied by a low-frequency acoustic emission. Therefore, this process is a typical plasma electrolytic oxidation during which two phases of low conductivity consisting of a high resistant dielectric layer and gas are formed [20]. The variation in the coating thickness, h, during PEO treatment in this solution is also shown in Figure 10. As seen, under conditions of this study the average PEO coating thickness increases continuously with some deceleration from linear. On the other hand, increase in h is accompanied by an obvious roughening of the surface exceeding by about 25 % the average coating thickness. As is also seen from the h versus time plot, the roughening effect becomes more pronounced with the processing time span.
The surface morphology of titanium processed over different periods of anodizing time is illustrated in Figures 11 and 12. The AFM images (Figure 11) obtained at the initial PEO treatment time during which the voltage reached about 130 V (Figure 10) show that the coating surface has a compact crystalline structure consisting of highly-ordered and uniform 3D hexagonal close-packed crystals with a lateral size of about 1.5 × 1.0 μm. The initial
layers grown under conditions of this PEO treatment are rather smooth, bluish-gray with a root-mean-squared (RMS) roughness of about 1.2 μm. As expected, with increasing electrolysis time the PEO coating structure changes drastically. From the SEM images shown in Figure 12 it is evident that at higher voltages accompanied by discontinuous discharges, highly rough and porous coatings are formed. The top and cross-section view images (Fig12 b-d) suggest that ceramic-like coatings grown under conditions of spark and micro-arc discharges become more porous and rough with processing time. Overall, these results can be compared with those reported previously for PEO coatings grown onto aluminium in an alkaline potassium silicate solution [43]. On the other hand, in contrast to aluminium, we found no detectable. changes in the morphology of titanium at the metal/PEO coating interface.
Figure 10. Variation in coating thickness and forming voltage value during PEO treatment of Ti in an aqueous alkaline solution of 50 g cm-3 potassium silicate, SiO2:K2O (molar ratio 3.4:1), at a constant current density of 5.0 A dm-2 and 20 oC
0 2 4 6 8 10 12 14 160
100
200
300
400
500
600
A
Voltage,
V
Time, min
0
20
40
60
80
100
120
Thic
kness, m
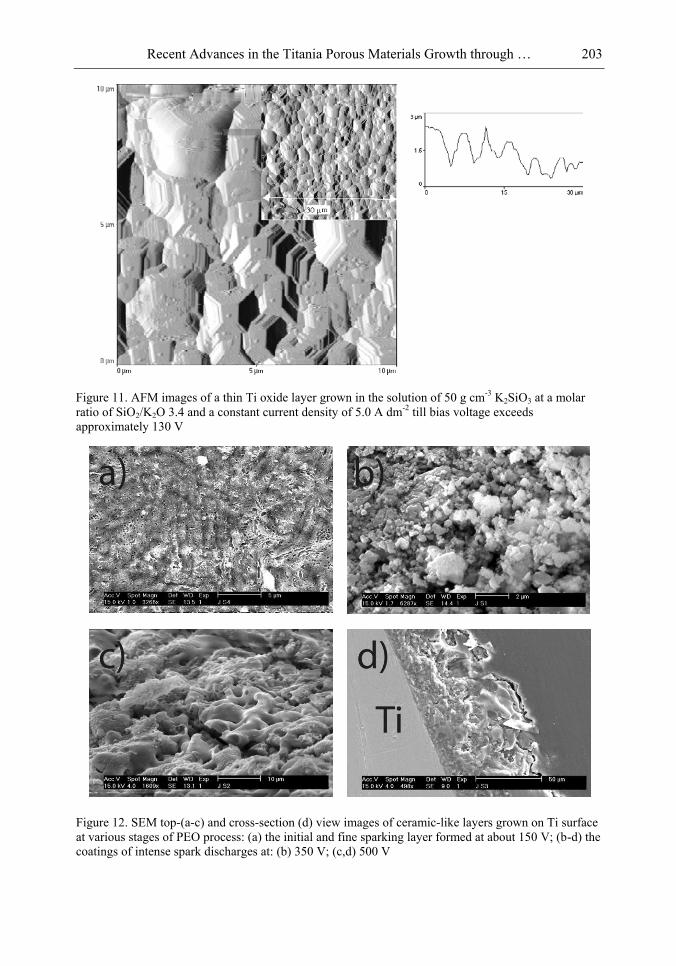
Recent Advances in the Titania Porous Materials Growth through … 203
Figure 11. AFM images of a thin Ti oxide layer grown in the solution of 50 g cm-3 K2SiO3 at a molar ratio of SiO2/K2O 3.4 and a constant current density of 5.0 A dm-2 till bias voltage exceeds approximately 130 V
Figure 12. SEM top-(a-c) and cross-section (d) view images of ceramic-like layers grown on Ti surface at various stages of PEO process: (a) the initial and fine sparking layer formed at about 150 V; (b-d) the coatings of intense spark discharges at: (b) 350 V; (c,d) 500 V
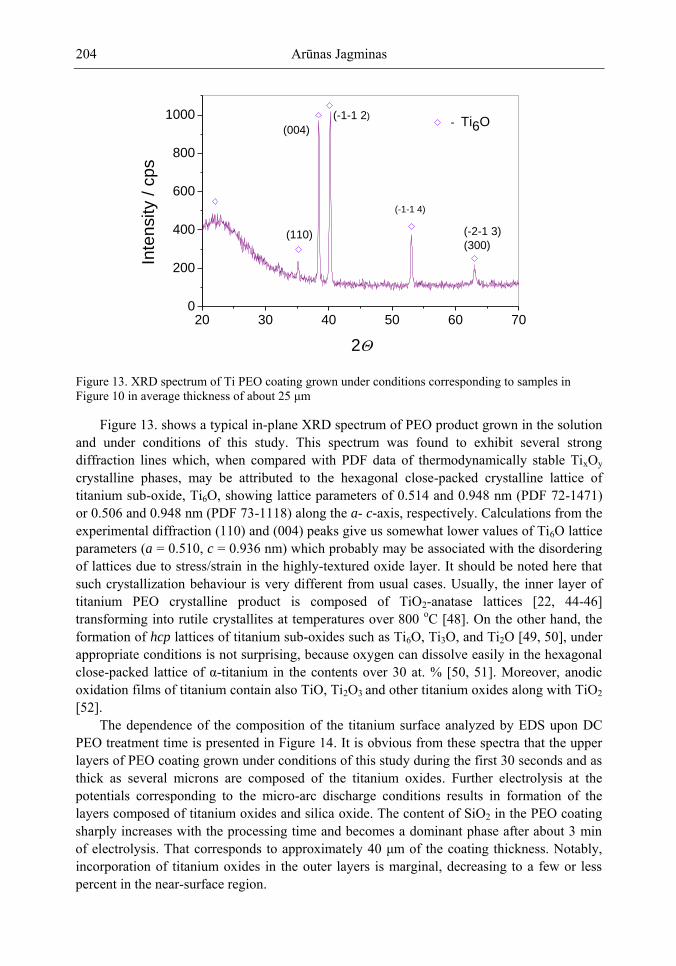
Arūnas Jagminas 204
Figure 13. XRD spectrum of Ti PEO coating grown under conditions corresponding to samples in Figure 10 in average thickness of about 25 μm
Figure 13. shows a typical in-plane XRD spectrum of PEO product grown in the solution and under conditions of this study. This spectrum was found to exhibit several strong diffraction lines which, when compared with PDF data of thermodynamically stable TixOy crystalline phases, may be attributed to the hexagonal close-packed crystalline lattice of titanium sub-oxide, Ti6O, showing lattice parameters of 0.514 and 0.948 nm (PDF 72-1471) or 0.506 and 0.948 nm (PDF 73-1118) along the a- c-axis, respectively. Calculations from the experimental diffraction (110) and (004) peaks give us somewhat lower values of Ti6O lattice parameters (a = 0.510, c = 0.936 nm) which probably may be associated with the disordering of lattices due to stress/strain in the highly-textured oxide layer. It should be noted here that such crystallization behaviour is very different from usual cases. Usually, the inner layer of titanium PEO crystalline product is composed of TiO2-anatase lattices [22, 44-46] transforming into rutile crystallites at temperatures over 800 oC [48]. On the other hand, the formation of hcp lattices of titanium sub-oxides such as Ti6O, Ti3O, and Ti2O [49, 50], under appropriate conditions is not surprising, because oxygen can dissolve easily in the hexagonal close-packed lattice of α-titanium in the contents over 30 at. % [50, 51]. Moreover, anodic oxidation films of titanium contain also TiO, Ti2O3 and other titanium oxides along with TiO2 [52].
The dependence of the composition of the titanium surface analyzed by EDS upon DC PEO treatment time is presented in Figure 14. It is obvious from these spectra that the upper layers of PEO coating grown under conditions of this study during the first 30 seconds and as thick as several microns are composed of the titanium oxides. Further electrolysis at the potentials corresponding to the micro-arc discharge conditions results in formation of the layers composed of titanium oxides and silica oxide. The content of SiO2 in the PEO coating sharply increases with the processing time and becomes a dominant phase after about 3 min of electrolysis. That corresponds to approximately 40 μm of the coating thickness. Notably,
incorporation of titanium oxides in the outer layers is marginal, decreasing to a few or less percent in the near-surface region.
20 30 40 50 60 700
200
400
600
800
1000
(-2-1 3)
(300)
(-1-1 4)
(-1-1 2)
(004)
(110)
- Ti6O
Inte
nsity /
cp
s
2
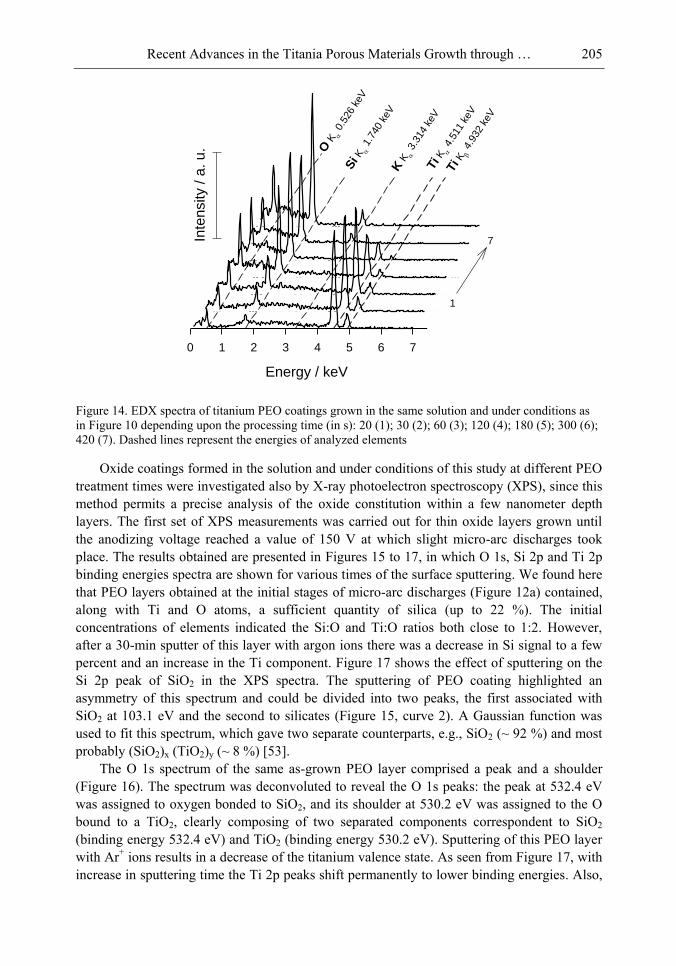
Recent Advances in the Titania Porous Materials Growth through … 205
Energy / keV
0 1 2 3 4 5 6 7 8 9 10 11
Inte
nsity /
a. u
.
1
7
O K 0
.526
keV
Si K
1
.740
keV
Ti K
4
.932
keV
Ti K
4
.511
keV
K K 3
.314
keV
Figure 14. EDX spectra of titanium PEO coatings grown in the same solution and under conditions as in Figure 10 depending upon the processing time (in s): 20 (1); 30 (2); 60 (3); 120 (4); 180 (5); 300 (6); 420 (7). Dashed lines represent the energies of analyzed elements
Oxide coatings formed in the solution and under conditions of this study at different PEO treatment times were investigated also by X-ray photoelectron spectroscopy (XPS), since this method permits a precise analysis of the oxide constitution within a few nanometer depth layers. The first set of XPS measurements was carried out for thin oxide layers grown until the anodizing voltage reached a value of 150 V at which slight micro-arc discharges took place. The results obtained are presented in Figures 15 to 17, in which O 1s, Si 2p and Ti 2p binding energies spectra are shown for various times of the surface sputtering. We found here that PEO layers obtained at the initial stages of micro-arc discharges (Figure 12a) contained, along with Ti and O atoms, a sufficient quantity of silica (up to 22 %). The initial concentrations of elements indicated the Si:O and Ti:O ratios both close to 1:2. However, after a 30-min sputter of this layer with argon ions there was a decrease in Si signal to a few percent and an increase in the Ti component. Figure 17 shows the effect of sputtering on the Si 2p peak of SiO2 in the XPS spectra. The sputtering of PEO coating highlighted an asymmetry of this spectrum and could be divided into two peaks, the first associated with SiO2 at 103.1 eV and the second to silicates (Figure 15, curve 2). A Gaussian function was used to fit this spectrum, which gave two separate counterparts, e.g., SiO2 (~ 92 %) and most probably (SiO2)x (TiO2)y (~ 8 %) [53].
The O 1s spectrum of the same as-grown PEO layer comprised a peak and a shoulder (Figure 16). The spectrum was deconvoluted to reveal the O 1s peaks: the peak at 532.4 eV was assigned to oxygen bonded to SiO2, and its shoulder at 530.2 eV was assigned to the O bound to a TiO2, clearly composing of two separated components correspondent to SiO2 (binding energy 532.4 eV) and TiO2 (binding energy 530.2 eV). Sputtering of this PEO layer with Ar+ ions results in a decrease of the titanium valence state. As seen from Figure 17, with increase in sputtering time the Ti 2p peaks shift permanently to lower binding energies. Also,
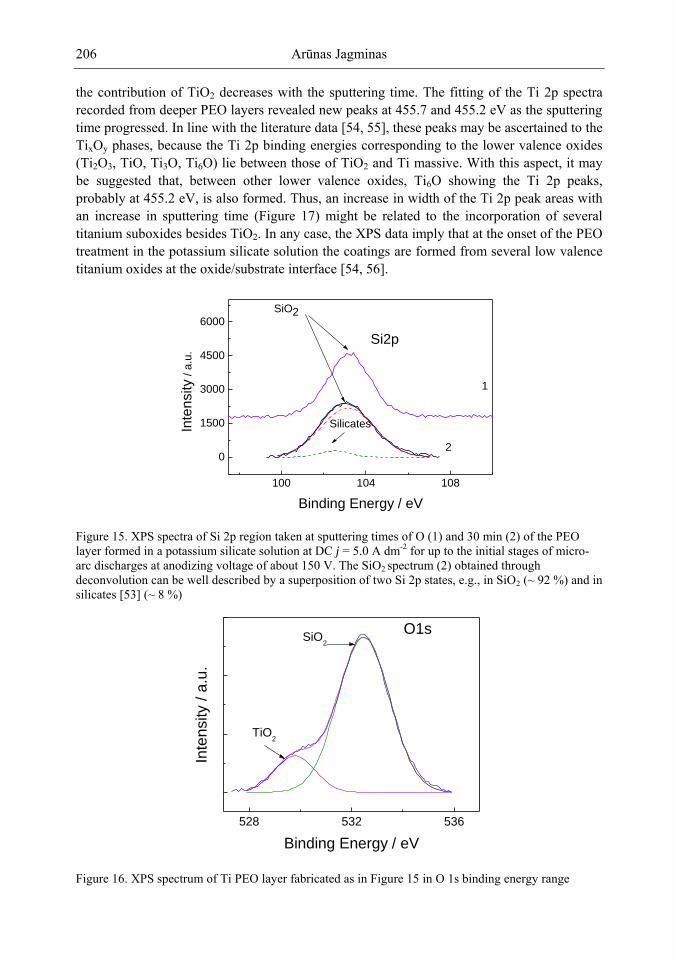
Arūnas Jagminas 206
the contribution of TiO2 decreases with the sputtering time. The fitting of the Ti 2p spectra recorded from deeper PEO layers revealed new peaks at 455.7 and 455.2 eV as the sputtering time progressed. In line with the literature data [54, 55], these peaks may be ascertained to the TixOy phases, because the Ti 2p binding energies corresponding to the lower valence oxides (Ti2O3, TiO, Ti3O, Ti6O) lie between those of TiO2 and Ti massive. With this aspect, it may be suggested that, between other lower valence oxides, Ti6O showing the Ti 2p peaks, probably at 455.2 eV, is also formed. Thus, an increase in width of the Ti 2p peak areas with an increase in sputtering time (Figure 17) might be related to the incorporation of several titanium suboxides besides TiO2. In any case, the XPS data imply that at the onset of the PEO treatment in the potassium silicate solution the coatings are formed from several low valence titanium oxides at the oxide/substrate interface [54, 56].
100 104 108
0
1500
3000
4500
6000
Si2p
2
1
SilicatesInte
nsity
/ a
.u.
Binding Energy / eV
SiO2
Figure 15. XPS spectra of Si 2p region taken at sputtering times of O (1) and 30 min (2) of the PEO layer formed in a potassium silicate solution at DC j = 5.0 A dm-2 for up to the initial stages of micro-arc discharges at anodizing voltage of about 150 V. The SiO2 spectrum (2) obtained through deconvolution can be well described by a superposition of two Si 2p states, e.g., in SiO2 (~ 92 %) and in silicates [53] (~ 8 %)
Figure 16. XPS spectrum of Ti PEO layer fabricated as in Figure 15 in O 1s binding energy range
528 532 536
SiO2
TiO2
O1s
Binding Energy / eV
Inte
nsity / a
.u.
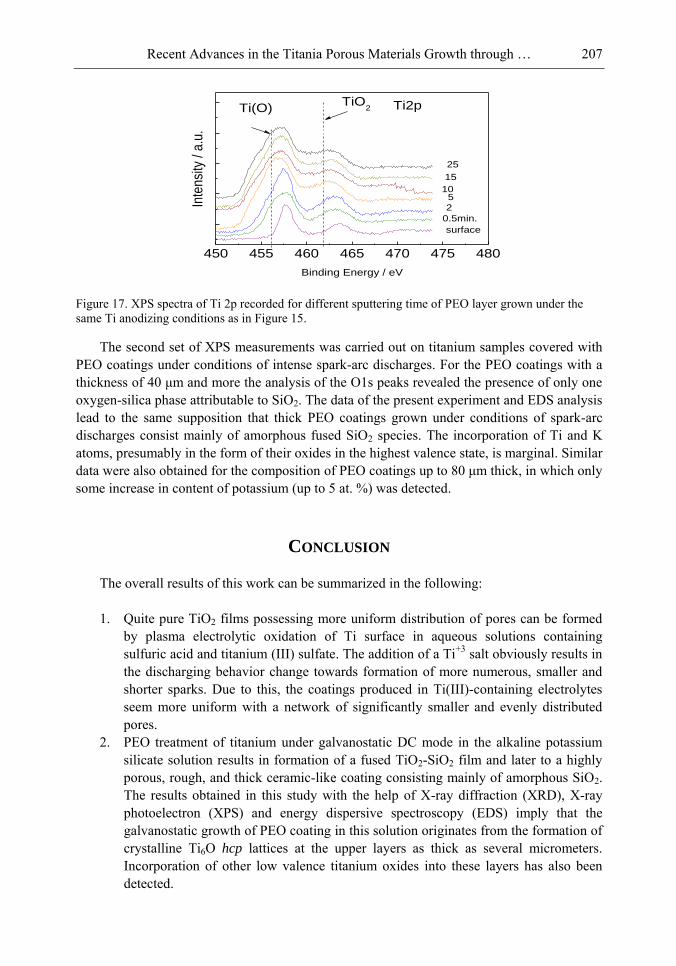
Recent Advances in the Titania Porous Materials Growth through … 207
Figure 17. XPS spectra of Ti 2p recorded for different sputtering time of PEO layer grown under the same Ti anodizing conditions as in Figure 15.
The second set of XPS measurements was carried out on titanium samples covered with PEO coatings under conditions of intense spark-arc discharges. For the PEO coatings with a thickness of 40 μm and more the analysis of the O1s peaks revealed the presence of only one oxygen-silica phase attributable to SiO2. The data of the present experiment and EDS analysis lead to the same supposition that thick PEO coatings grown under conditions of spark-arc discharges consist mainly of amorphous fused SiO2 species. The incorporation of Ti and K atoms, presumably in the form of their oxides in the highest valence state, is marginal. Similar data were also obtained for the composition of PEO coatings up to 80 μm thick, in which only
some increase in content of potassium (up to 5 at. %) was detected.
CONCLUSION
The overall results of this work can be summarized in the following: 1. Quite pure TiO2 films possessing more uniform distribution of pores can be formed
by plasma electrolytic oxidation of Ti surface in aqueous solutions containing sulfuric acid and titanium (III) sulfate. The addition of a Ti+3 salt obviously results in the discharging behavior change towards formation of more numerous, smaller and shorter sparks. Due to this, the coatings produced in Ti(III)-containing electrolytes seem more uniform with a network of significantly smaller and evenly distributed pores.
2. PEO treatment of titanium under galvanostatic DC mode in the alkaline potassium silicate solution results in formation of a fused TiO2-SiO2 film and later to a highly porous, rough, and thick ceramic-like coating consisting mainly of amorphous SiO2. The results obtained in this study with the help of X-ray diffraction (XRD), X-ray photoelectron (XPS) and energy dispersive spectroscopy (EDS) imply that the galvanostatic growth of PEO coating in this solution originates from the formation of crystalline Ti6O hcp lattices at the upper layers as thick as several micrometers. Incorporation of other low valence titanium oxides into these layers has also been detected.
450 455 460 465 470 475 480
Ti2pTi(O)TiO
2
25
15
105
2
0.5min.
surface
Inte
nsi
ty /
a.u
.
Binding Energy / eV
Arūnas Jagminas 208
REFERENCES
[1] Mor, GK; Vargheese, OK; Paulose, M; Shankar, K; Grimes, CA. Sol. Energy Mater.
Sol. Cells, 2006, 90, 2011-2075. [2] Bae, S; Shim, E; Yoon, J; Joo, H. Sol. Energy Mater. Sol. Cells, 2008, 92, 402-409. [3] Lakshmi, BB; Patrissi, CJ; Martin, CR. Chem. Mater., 1997, 9, 2544 -2550. [4] Limmer, SJ; Seraji, S; Forbess, MJ; Wu, Y; Chou, TP; Nguyen, C; Cao, G. Adv. Mater.,
2001, 13, 1269-1272. [5] Yang, P; Zhao, D; Margolese, DJ; Chelka, BF; Stucky, GD. Nature, 1998, 396, 152-
155. [6] On, DT. Langmuir, 1999, 15, 8561-8564. [7] Gong, D; Grimes, CA; Varghese, OK; Chen, Z; Hu, W; Singh, RS; Chen, Z; Dickey,
EC. J. Mater. Res., 2001,16, 3331-3334. [8] Linsebigler, AL; Lu, G; Yates, JT. Chem. Rev., 1995, 95, 735-758. [9] Macak, JM; Sirotna, K; Schmuki, P. Electrochim. Acta, 2005, 50, 3679-3684. [10] Wang, J; Lin, Z. Chem. Mater., 2008, 20, 1257-1261. [11] Shankar, K; Mor, GK; Prakasam, HE; Yoriya, S; Paulose, M; Varghese, OK; Grimes,
CA. Nanotechnology, 2007, 18, no. 065707. [12] Andreeva, VV. Corrosion, 1964, 20, 35-41. [13] Bloyce, A; Qi, PY; Dong, H; Bell, T. Surf. Coat. Technol., 1998, 107, 125-132. [14] Langlade, C; Vannes, AB; Krafft, JM; Martin, JR. Surf. Coat. Technol., 1998, 100/101,
383-387. [15] Cigada, A; Cabrini, M; Pedferri, P. J. Mater. Sci.: Mater. Med., 1992, 3, 408-412. [16] Beranek, R; Hildebrand, H; Schmuki, P. Electrochem. Solid-State Lett., 2003, 6, B12-
B14. [17] Ghicov, A; Tsuchiya, H; Macak, JM; Schmuki, P. Electrochem. Commun., 2005, 7, 505-
509. [18] Macak, JM; Schmuki, P. Electrochim. Acta, 2006, 52, 1258-1264. [19] Yerokhin, AL; Nie, X; Leyland, A; Matthews, A. Surf. Coat. Technol., 2000, 130, 195-
206. [20] Yerokhin, AL; Nie, X; Leyland, A; Matthews, A; Dowey, SJ. Surf. Coat. Technol.,
1999, 122, 73-93. [21] Morlidge, JR; Skeldon, P; Thompson, GE; Habazaki, H; Shimizu, K; Wood, GC.
Electrochim. Acta, 1999, 44, 2423-2435. [22] Gordienko, PS; Gnedenkov, SV. Microarc Oxidation of Titanium and its Alloys;
Dal‘nauka, Vladivostok, 1997, (ISBN 5-7442-0922-0), in Russian. [23] Snizhko, LO; Yerokhin, AL; Pilkington, A; Gurevina, NL; Misnyankin, DO; Leyland,
A; Matthews, A. Electrochim. Acta, 2004, 49, 2085-2095. [24] Moon, SM; Pyun, SI. Electrochim Acta, 1999, 44, 2445-2454. [25] Wang, Y; Jiang, B; Lei, Guo, L. Mater. Lett., 2004, 58, 1907-1911. [26] Park, YJ; Shin, KH; Song, HJ. Appl. Surf. Sci., 2007, 253, 6013-6018. [27] Yao, Z; Jiang, Z; Xin, S; Sun, X; Wu, X. Electrochim. Acta, 2005, 50, 3273-3279. [28] Wang, Y; Lei, T; Guo, L. Appl. Surf. Sci., 2006, 252, 8113-8120. [29] Wang, YM; Guo, LX; Quyang, JH; Zhou, Y; Jia, DC. Appl. Surf. Sci., 2009, 255, 6875-
6880.
Recent Advances in the Titania Porous Materials Growth through … 209
[30] Rudnev, VS; Yarovaya, TP; Boguta, DL; Tyrina, LM; Nedozorov, PM; Gordienko, PS. J. Electroanalyt. Chem., 2001, 497, 150-158.
[31] Rudnev, VS; Vasilyeva, MS; Kondrikov, NB; Tyrina, LM. Appl. Surf. Sci., 2005, 252, 1211-1220.
[32] Lasia, A. Electrochemical Impedance Spectroscopy and its Applications. In Modern
Aspects of Electrochemistry; Conway, B. E; Bockris, J; White, R. E; Edts; Kluwer Academic/Plenum Publishers, New York, 1999, Vol. 32, 26.
[33] Yao, Z; Jiang, Y; Jia, F; Jiang, Z; Wang, F. Appl. Surf. Sci., 2008, 254, 4084-4091. [34] Park, YJ; Shin, KH; Song, Ho-J. Appl. Surf. Sci., 2007, 253, 6013-6018. [35] Ohsaka, T; Izumi, F; Fujiki, Y. J. Raman Spectrosc., 1978, 7, 321-324. [36] Mikami, M; Nakamura, S; Kitao, O; Arakawa, H. Phys. Rev. B, 2002, 66, no. 155213. [37] Balachandran, U; Eror, NG. J. Solid State Chem., 1982, 42, 276-282. [38] Ma, W; Lu, Z; Zhang, M. Appl. Phys., A 1998, 66, 621-627. [39] Tompsett, GA; Bowmaker, GA; Gooney, RP; Metson, JB; Rodgers, KA; Seakins, JM. J.
Raman Spectrosc., 1995, 26, 57-62. [40] Wang, W; Gu, B; Liang, L; Hamilton, W; Wesolowski, DJ. J. Phys. Chem., B 2004,
108, 14789-14792. [41] Markov, GA; Tatarchuk, VV; Mironova, MK. Izv. SO AN SSSR. Ser. Khim. Nauka,
1977, 3(7), 34-38, in Russian. [42] Van, TB; Brown, SD; Wirtz, GP. Am. Ceram. Soc. Bull., 1977, 56, 563-567. [43] Tchernenko, VI; Snezhko, LA; Popanova, II. Coatings by Anodic Spark Electrolysis,
Khimiya, Leningrad, 1991, in Russian. [44] Xue, W; Wang, Ch; Chen, R; Deng, Z. Mater. Lett., 2002, 52, 435-441. [45] Han, Y; Hong, SH; Xu, KW. Surf. Coat. Technol., 2002, 154, 314-318. [46] Tang, GX; Zhang, RJ; Yan, YN; Zhu, ZX. Mater. Lett., 2004, 58, 1857-1860. [47] Fukuda, K; Sasaki, T; Watanabe, M; Nakai, I; Inaba, K; Omote, K. Crys. Growth
Design, 2003, 3, 281-283. [48] Yamaguchi, S; Koiwa, M; Hirabayashi, M. J. Phys. Soc. Japan, 1966, 21, 2096-2096. [49] Kornilov, II; Vavilova, VV; Fykin, LE; Ozerov, RP; Solovwiev, SP; Smirnov, VP.
Metallurgical Trans., 1970, 2569-2576. [50] Wahlbeck, PG; Gilles, PW. J. Amer. Ceram. Soc., 1966, 49, 180-183. [51] Murray, JL; Wriedt, HA. Bull. Alloy Phase Diagrams, 1987, 8, 148. [52] Pouilleau, J; Devilliers, D; Garrido, F; Durand-Vidal, S; Mahe, E. Mater. Sci. Eng., B
1997, 47, 235-243. [53] Netterfield, RP; Martin, PJ; Pacey, CG; Sainty, WG; McKenzie, DR. J. Appl. Phys.,
1989, 66, 1805 (5 p.). [54] Schmiedgen, M; Graat, PC. J; Baretzky, B; Mittemeijer, E. J. Thin Solid Films, 2002,
415, 114-122. [55] Wagner, CD; Naumkin, AV; Kraut-Vass, J; Allison, W; Powell, CJ; Rumble, JR. (Eds.),
NIST X-ray Photoelectron Spectroscopy Database, version 3.0, NIST, Gaithersburg, 2000.
[56] McCurdy, PR; Sturgess, LJ; Kohli, S; Fisher, ER. Appl. Surf. Sci., 2004,

In: Nanoporous Materials Types, Properties and Uses ISBN: 978-1-61668-182-1 Editor: Samuel B. Jenkins, pp. 211-232 © 2010 Nova Science Publishers, Inc.
Chapter 6
PREPARATION AND PROPERTIES OF
NANOPOROUS MATERIALS PREPARED
FROM NATURAL CLAY MINERALS
J. Temuujina,b,*
, K.J.D.MacKenziec, Ts.Jadambaa
d
and A.van Riessena
aCentre For Materials Research, Department of Imaging and Applied Physics, Curtin University of Technology, GPO Box U1987, Perth, WA 6845, Australia
bInstitute of Chemistry and Chemical Technology, Mongolian Academy of Sciences, Ulaanbaatar 51, Mongolia
cMacDiarmid Institute for Advanced Materials and Nanotechnology, Victoria University of Wellington, Wellington, New Zealand
dCentre for New Materials, Mongolian University of Science and Technology, Ulaanbaatar, Mongolia
ABSTRACT
In this chapter, we review recent work carried out in our research group on the preparation and characterisation of nanoporous materials from a variety of clay minerals by selective leaching methods. These nanoporous materials are prepared by exploiting the crystal architecture of layer-lattice minerals.
According to their layer periodicity, clay minerals are divided into different types, namely 1:1 type (kaolinite, antigorite etc), 2:1 (montmorillonite, vermiculite, pyrophillite, talc etc) and amorphous (allophane etc). The combination of tetrahedral Si2O5 and octahedral Al2(OH)4 or Mg2(OH)4 layers gives a range of unique crystal architectures.
Nanoporous materials have been prepared using a simple selective leaching technique. Differences in the solubility of the clay components at different pH values are exploited to leach a particular component from the clay structure and produce pores. Leaching occurs preferentially at moderate temperatures (80-90oC). The use of clay minerals to prepare nanoporous materials allows the pore size and shape to be controlled.
* Corresponding author: Email: [email protected]
J. Temuujin, K.J.D. MacKenzie, Ts. Jadambaa et al. 212
It is found that in most cases, preliminary amorphisation of the clay minerals favours the leaching process. However, some minerals such as vermiculite can be acid-treated directly, producing porous silica with the highest specific surface area of all the minerals (670 m2/g), by comparison with the silica of the lowest surface area (15 m2/g) produced from talc. Pore size distribution measurements reveal the presence of micro and nanopores.
Amorphisation of the clay minerals can be achieved by either thermal or mechanical treatment (grinding). Preliminary milling destroys the layer structure of the clay mineral, making it difficult to control the pore size and shape. Thermal amorphisation of the clay mineral favours the production of porous materials with high surface areas and controlled pore size distributions.
Nanoporous silica, -alumina and composite materials have been prepared from kaolin, montmorillonite, pyrophillite, phlogopite and talc show excellent decolorisation, adsorption and ion-exchange properties.
Keywords: nanoporous materials, clay minerals, calcining, grinding, selective leaching, porous properties
INTRODUCTION
Porous materials are mostly used as catalysts, catalyst supports, filter membranes, ion exchangers, adsorbents and humidity control agents [1]. The most important properties of porous materials are related to their surface chemistry (whether they are hydrophilic or hydrophobic) and geometrical properties (pore size and shape, surface area, pore volume).
According to the IUPAC (International Union of Pure and Applied Chemistry) recommendation the pores can be classified according to their size, as [2]:
Micropores (< 2 nm) Mesopores (2-50 nm) Macropores (> 50nm). Well-known examples of microporous materials are zeolites and activated carbons, while
various xerogels and mesoporous materials are typically prepared using organic templates. Large pore size materials such as ceramic membranes, honeycombs, foamed ceramics and filters are categorized as macroporous materials. The term ―nanoporous‖ can be used instead
of ―mesoporous‖, this term will be used in this chapter. In general there are two methods for preparing porous materials: [1, 3]: The build-up method, by which the material is synthesised from starting reagents, Leaching or post-synthesis treatment of parent materials. The first method is used to synthesize gels, -Al2O3, zeolites and pillared clays etc. while
the second method produces activated carbon and SiO2 or -Al2O3 based on clay minerals. Clay minerals can be used to obtain porous materials by both the build-up method and the
leaching method. Clays are hydrous aluminium or magnesium silicates with a layered crystal structure arranged in a variety of repeating units that can be used as templates for preparing
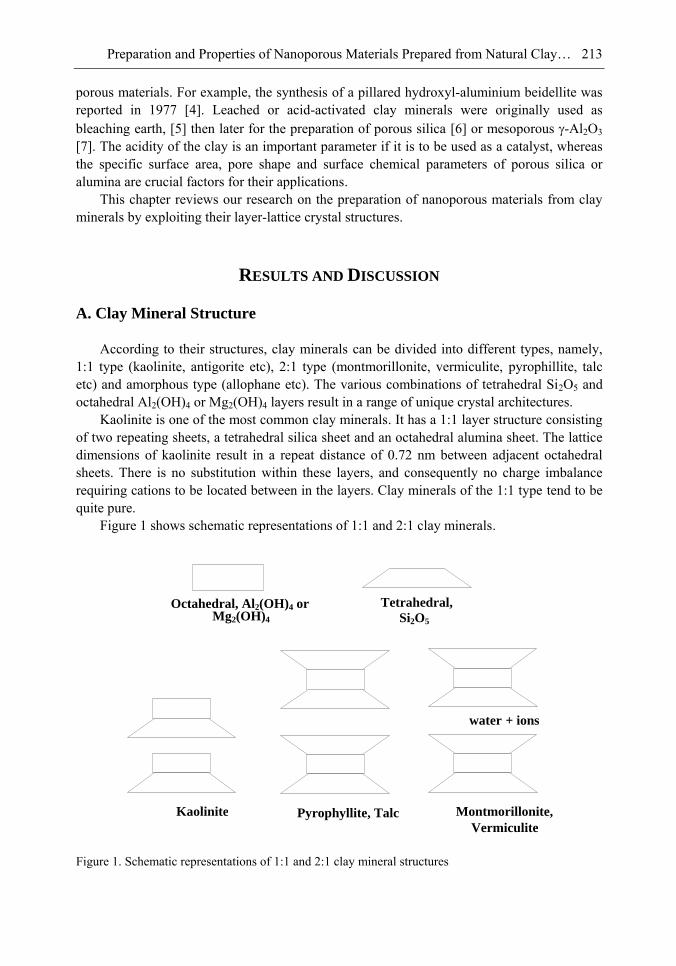
Preparation and Properties of Nanoporous Materials Prepared from Natural Clay… 213
porous materials. For example, the synthesis of a pillared hydroxyl-aluminium beidellite was reported in 1977 [4]. Leached or acid-activated clay minerals were originally used as bleaching earth, [5] then later for the preparation of porous silica [6] or mesoporous -Al2O3 [7]. The acidity of the clay is an important parameter if it is to be used as a catalyst, whereas the specific surface area, pore shape and surface chemical parameters of porous silica or alumina are crucial factors for their applications.
This chapter reviews our research on the preparation of nanoporous materials from clay minerals by exploiting their layer-lattice crystal structures.
RESULTS AND DISCUSSION
A. Clay Mineral Structure
According to their structures, clay minerals can be divided into different types, namely, 1:1 type (kaolinite, antigorite etc), 2:1 type (montmorillonite, vermiculite, pyrophillite, talc etc) and amorphous type (allophane etc). The various combinations of tetrahedral Si2O5 and octahedral Al2(OH)4 or Mg2(OH)4 layers result in a range of unique crystal architectures.
Kaolinite is one of the most common clay minerals. It has a 1:1 layer structure consisting of two repeating sheets, a tetrahedral silica sheet and an octahedral alumina sheet. The lattice dimensions of kaolinite result in a repeat distance of 0.72 nm between adjacent octahedral sheets. There is no substitution within these layers, and consequently no charge imbalance requiring cations to be located between in the layers. Clay minerals of the 1:1 type tend to be quite pure.
Figure 1 shows schematic representations of 1:1 and 2:1 clay minerals.
Figure 1. Schematic representations of 1:1 and 2:1 clay mineral structures
water + ions
Kaolinite Pyrophyllite, Talc Montmorillonite, Vermiculite
Octahedral, Al2(OH)4 or Mg2(OH)4
Tetrahedral, Si2O5
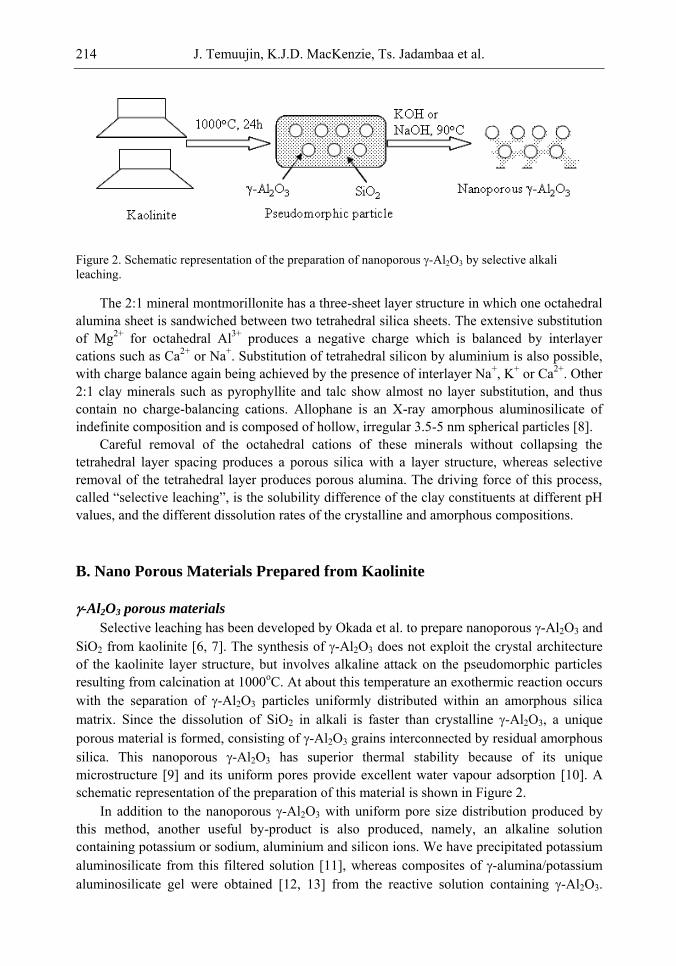
J. Temuujin, K.J.D. MacKenzie, Ts. Jadambaa et al. 214
Figure 2. Schematic representation of the preparation of nanoporous -Al2O3 by selective alkali leaching.
The 2:1 mineral montmorillonite has a three-sheet layer structure in which one octahedral alumina sheet is sandwiched between two tetrahedral silica sheets. The extensive substitution of Mg2+ for octahedral Al3+ produces a negative charge which is balanced by interlayer cations such as Ca2+ or Na+. Substitution of tetrahedral silicon by aluminium is also possible, with charge balance again being achieved by the presence of interlayer Na+, K+ or Ca2+. Other 2:1 clay minerals such as pyrophyllite and talc show almost no layer substitution, and thus contain no charge-balancing cations. Allophane is an X-ray amorphous aluminosilicate of indefinite composition and is composed of hollow, irregular 3.5-5 nm spherical particles [8].
Careful removal of the octahedral cations of these minerals without collapsing the tetrahedral layer spacing produces a porous silica with a layer structure, whereas selective removal of the tetrahedral layer produces porous alumina. The driving force of this process, called ―selective leaching‖, is the solubility difference of the clay constituents at different pH values, and the different dissolution rates of the crystalline and amorphous compositions.
B. Nano Porous Materials Prepared from Kaolinite
-Al2O3 porous materials
Selective leaching has been developed by Okada et al. to prepare nanoporous -Al2O3 and SiO2 from kaolinite [6, 7]. The synthesis of -Al2O3 does not exploit the crystal architecture of the kaolinite layer structure, but involves alkaline attack on the pseudomorphic particles resulting from calcination at 1000oC. At about this temperature an exothermic reaction occurs with the separation of -Al2O3 particles uniformly distributed within an amorphous silica matrix. Since the dissolution of SiO2 in alkali is faster than crystalline -Al2O3, a unique porous material is formed, consisting of -Al2O3 grains interconnected by residual amorphous silica. This nanoporous -Al2O3 has superior thermal stability because of its unique microstructure [9] and its uniform pores provide excellent water vapour adsorption [10]. A schematic representation of the preparation of this material is shown in Figure 2.
In addition to the nanoporous -Al2O3 with uniform pore size distribution produced by this method, another useful by-product is also produced, namely, an alkaline solution containing potassium or sodium, aluminium and silicon ions. We have precipitated potassium aluminosilicate from this filtered solution [11], whereas composites of -alumina/potassium aluminosilicate gel were obtained [12, 13] from the reactive solution containing -Al2O3.
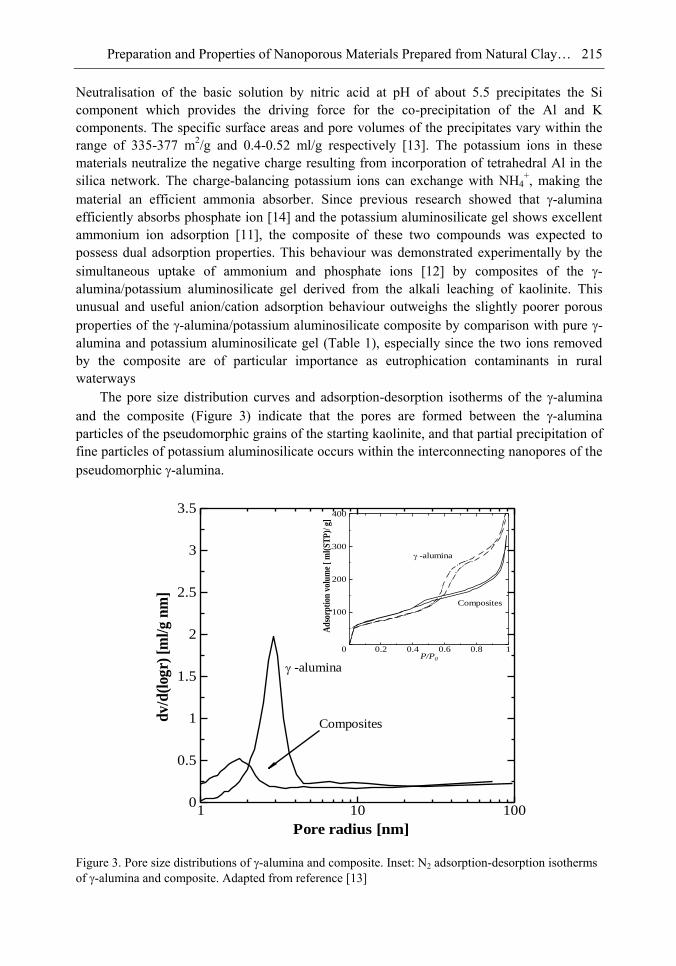
Preparation and Properties of Nanoporous Materials Prepared from Natural Clay… 215
Neutralisation of the basic solution by nitric acid at pH of about 5.5 precipitates the Si component which provides the driving force for the co-precipitation of the Al and K components. The specific surface areas and pore volumes of the precipitates vary within the range of 335-377 m2/g and 0.4-0.52 ml/g respectively [13]. The potassium ions in these materials neutralize the negative charge resulting from incorporation of tetrahedral Al in the silica network. The charge-balancing potassium ions can exchange with NH4
+, making the material an efficient ammonia absorber. Since previous research showed that -alumina efficiently absorbs phosphate ion [14] and the potassium aluminosilicate gel shows excellent ammonium ion adsorption [11], the composite of these two compounds was expected to possess dual adsorption properties. This behaviour was demonstrated experimentally by the simultaneous uptake of ammonium and phosphate ions [12] by composites of the -alumina/potassium aluminosilicate gel derived from the alkali leaching of kaolinite. This unusual and useful anion/cation adsorption behaviour outweighs the slightly poorer porous properties of the -alumina/potassium aluminosilicate composite by comparison with pure -alumina and potassium aluminosilicate gel (Table 1), especially since the two ions removed by the composite are of particular importance as eutrophication contaminants in rural waterways
The pore size distribution curves and adsorption-desorption isotherms of the -alumina and the composite (Figure 3) indicate that the pores are formed between the -alumina particles of the pseudomorphic grains of the starting kaolinite, and that partial precipitation of fine particles of potassium aluminosilicate occurs within the interconnecting nanopores of the pseudomorphic -alumina.
Figure 3. Pore size distributions of -alumina and composite. Inset: N2 adsorption-desorption isotherms of -alumina and composite. Adapted from reference [13]
Pore radius [nm]
dv
/d(l
ogr)
[m
l/g
nm
]
-alumina
Composites
.
1 10 1000
0.5
1
1.5
2
2.5
3
3.5
Composites
P/P0
Ad
sorp
tion
vol
um
e [
ml(
ST
P)/
g]
-alumina
0 0.2 0.4 0.6 0.8 1
100
200
300
400
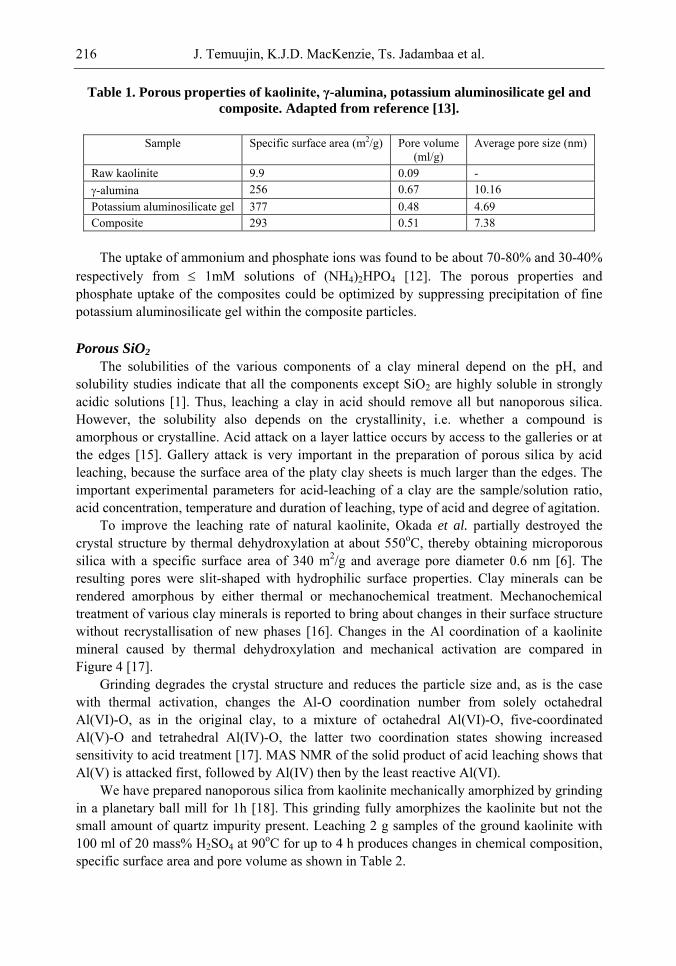
J. Temuujin, K.J.D. MacKenzie, Ts. Jadambaa et al. 216
Table 1. Porous properties of kaolinite, γ-alumina, potassium aluminosilicate gel and
composite. Adapted from reference [13].
Sample Specific surface area (m2/g) Pore volume (ml/g)
Average pore size (nm)
Raw kaolinite 9.9 0.09 - -alumina 256 0.67 10.16 Potassium aluminosilicate gel 377 0.48 4.69 Composite 293 0.51 7.38
The uptake of ammonium and phosphate ions was found to be about 70-80% and 30-40%
respectively from 1mM solutions of (NH4)2HPO4 [12]. The porous properties and phosphate uptake of the composites could be optimized by suppressing precipitation of fine potassium aluminosilicate gel within the composite particles.
Porous SiO2
The solubilities of the various components of a clay mineral depend on the pH, and solubility studies indicate that all the components except SiO2 are highly soluble in strongly acidic solutions [1]. Thus, leaching a clay in acid should remove all but nanoporous silica. However, the solubility also depends on the crystallinity, i.e. whether a compound is amorphous or crystalline. Acid attack on a layer lattice occurs by access to the galleries or at the edges [15]. Gallery attack is very important in the preparation of porous silica by acid leaching, because the surface area of the platy clay sheets is much larger than the edges. The important experimental parameters for acid-leaching of a clay are the sample/solution ratio, acid concentration, temperature and duration of leaching, type of acid and degree of agitation.
To improve the leaching rate of natural kaolinite, Okada et al. partially destroyed the crystal structure by thermal dehydroxylation at about 550oC, thereby obtaining microporous silica with a specific surface area of 340 m2/g and average pore diameter 0.6 nm [6]. The resulting pores were slit-shaped with hydrophilic surface properties. Clay minerals can be rendered amorphous by either thermal or mechanochemical treatment. Mechanochemical treatment of various clay minerals is reported to bring about changes in their surface structure without recrystallisation of new phases [16]. Changes in the Al coordination of a kaolinite mineral caused by thermal dehydroxylation and mechanical activation are compared in Figure 4 [17].
Grinding degrades the crystal structure and reduces the particle size and, as is the case with thermal activation, changes the Al-O coordination number from solely octahedral Al(VI)-O, as in the original clay, to a mixture of octahedral Al(VI)-O, five-coordinated Al(V)-O and tetrahedral Al(IV)-O, the latter two coordination states showing increased sensitivity to acid treatment [17]. MAS NMR of the solid product of acid leaching shows that Al(V) is attacked first, followed by Al(IV) then by the least reactive Al(VI).
We have prepared nanoporous silica from kaolinite mechanically amorphized by grinding in a planetary ball mill for 1h [18]. This grinding fully amorphizes the kaolinite but not the small amount of quartz impurity present. Leaching 2 g samples of the ground kaolinite with 100 ml of 20 mass% H2SO4 at 90oC for up to 4 h produces changes in chemical composition, specific surface area and pore volume as shown in Table 2.
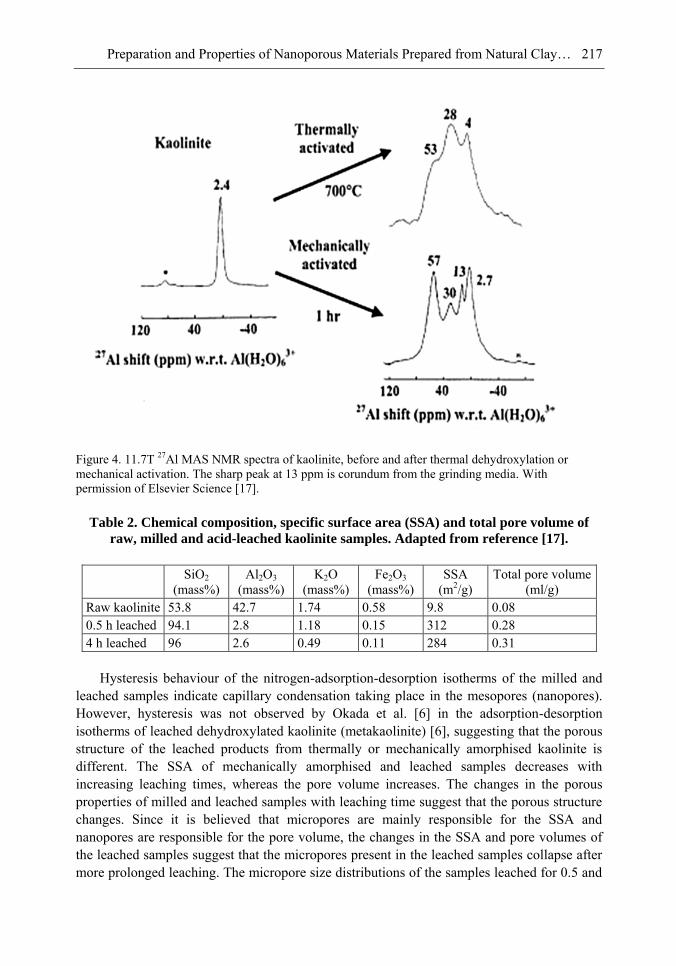
Preparation and Properties of Nanoporous Materials Prepared from Natural Clay… 217
Figure 4. 11.7T 27Al MAS NMR spectra of kaolinite, before and after thermal dehydroxylation or mechanical activation. The sharp peak at 13 ppm is corundum from the grinding media. With permission of Elsevier Science [17].
Table 2. Chemical composition, specific surface area (SSA) and total pore volume of
raw, milled and acid-leached kaolinite samples. Adapted from reference [17].
SiO2 (mass%)
Al2O3 (mass%)
K2O (mass%)
Fe2O3 (mass%)
SSA (m2/g)
Total pore volume (ml/g)
Raw kaolinite 53.8 42.7 1.74 0.58 9.8 0.08 0.5 h leached 94.1 2.8 1.18 0.15 312 0.28 4 h leached 96 2.6 0.49 0.11 284 0.31
Hysteresis behaviour of the nitrogen-adsorption-desorption isotherms of the milled and
leached samples indicate capillary condensation taking place in the mesopores (nanopores). However, hysteresis was not observed by Okada et al. [6] in the adsorption-desorption isotherms of leached dehydroxylated kaolinite (metakaolinite) [6], suggesting that the porous structure of the leached products from thermally or mechanically amorphised kaolinite is different. The SSA of mechanically amorphised and leached samples decreases with increasing leaching times, whereas the pore volume increases. The changes in the porous properties of milled and leached samples with leaching time suggest that the porous structure changes. Since it is believed that micropores are mainly responsible for the SSA and nanopores are responsible for the pore volume, the changes in the SSA and pore volumes of the leached samples suggest that the micropores present in the leached samples collapse after more prolonged leaching. The micropore size distributions of the samples leached for 0.5 and
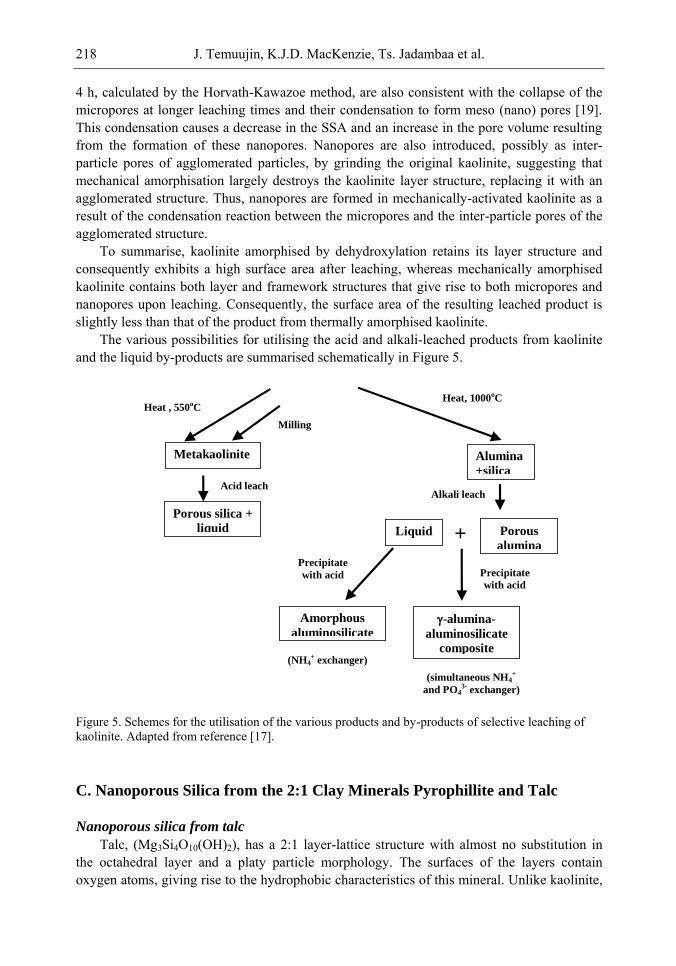
J. Temuujin, K.J.D. MacKenzie, Ts. Jadambaa et al. 218
4 h, calculated by the Horvath-Kawazoe method, are also consistent with the collapse of the micropores at longer leaching times and their condensation to form meso (nano) pores [19]. This condensation causes a decrease in the SSA and an increase in the pore volume resulting from the formation of these nanopores. Nanopores are also introduced, possibly as inter-particle pores of agglomerated particles, by grinding the original kaolinite, suggesting that mechanical amorphisation largely destroys the kaolinite layer structure, replacing it with an agglomerated structure. Thus, nanopores are formed in mechanically-activated kaolinite as a result of the condensation reaction between the micropores and the inter-particle pores of the agglomerated structure.
To summarise, kaolinite amorphised by dehydroxylation retains its layer structure and consequently exhibits a high surface area after leaching, whereas mechanically amorphised kaolinite contains both layer and framework structures that give rise to both micropores and nanopores upon leaching. Consequently, the surface area of the resulting leached product is slightly less than that of the product from thermally amorphised kaolinite.
The various possibilities for utilising the acid and alkali-leached products from kaolinite and the liquid by-products are summarised schematically in Figure 5.
Figure 5. Schemes for the utilisation of the various products and by-products of selective leaching of kaolinite. Adapted from reference [17].
C. Nanoporous Silica from the 2:1 Clay Minerals Pyrophillite and Talc
Nanoporous silica from talc
Talc, (Mg3Si4O10(OH)2), has a 2:1 layer-lattice structure with almost no substitution in the octahedral layer and a platy particle morphology. The surfaces of the layers contain oxygen atoms, giving rise to the hydrophobic characteristics of this mineral. Unlike kaolinite,
Heat , 550oC
Milling
Metakaolinite
Acid leach
Porous silica +
liquid
Alumina
+silica
Heat, 1000oC
Alkali leach
Liquid + Porous
alumina
Amorphous
aluminosilicate
Precipitate
with acid Precipitate
with acid
-alumina-
aluminosilicate
composite (NH4
+ exchanger)
(simultaneous NH4+
and PO43- exchanger)
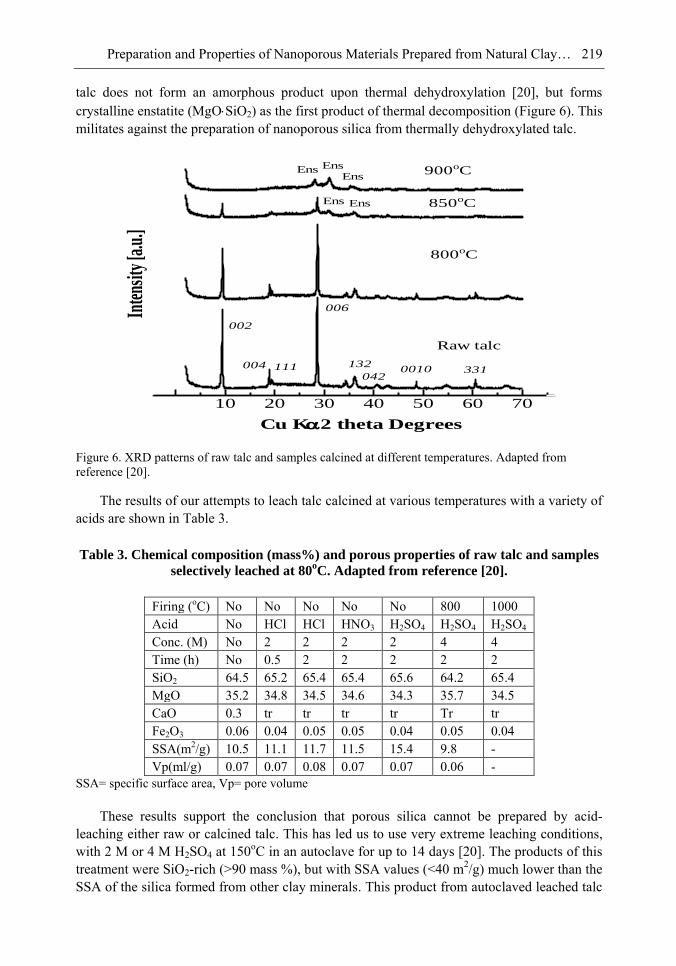
Preparation and Properties of Nanoporous Materials Prepared from Natural Clay… 219
talc does not form an amorphous product upon thermal dehydroxylation [20], but forms crystalline enstatite (MgOSiO2) as the first product of thermal decomposition (Figure 6). This militates against the preparation of nanoporous silica from thermally dehydroxylated talc.
Figure 6. XRD patterns of raw talc and samples calcined at different temperatures. Adapted from reference [20].
The results of our attempts to leach talc calcined at various temperatures with a variety of acids are shown in Table 3.
Table 3. Chemical composition (mass%) and porous properties of raw talc and samples
selectively leached at 80oC. Adapted from reference [20].
Firing (oC) No No No No No 800 1000 Acid No HCl HCl HNO3 H2SO4 H2SO4 H2SO4 Conc. (M) No 2 2 2 2 4 4 Time (h) No 0.5 2 2 2 2 2 SiO2 64.5 65.2 65.4 65.4 65.6 64.2 65.4 MgO 35.2 34.8 34.5 34.6 34.3 35.7 34.5 CaO 0.3 tr tr tr tr Tr tr Fe2O3 0.06 0.04 0.05 0.05 0.04 0.05 0.04 SSA(m2/g) 10.5 11.1 11.7 11.5 15.4 9.8 - Vp(ml/g) 0.07 0.07 0.08 0.07 0.07 0.06 -
SSA= specific surface area, Vp= pore volume
These results support the conclusion that porous silica cannot be prepared by acid-leaching either raw or calcined talc. This has led us to use very extreme leaching conditions, with 2 M or 4 M H2SO4 at 150oC in an autoclave for up to 14 days [20]. The products of this treatment were SiO2-rich (>90 mass %), but with SSA values (<40 m2/g) much lower than the SSA of the silica formed from other clay minerals. This product from autoclaved leached talc
Raw talc
800oC
850oC
900oC
002
004 111
006
1320010 331
042
EnsEns
EnsEnsEns
Cu K 2 theta Degrees
Inte
nsity
[a.u
.]
10 20 30 40 50 60 70
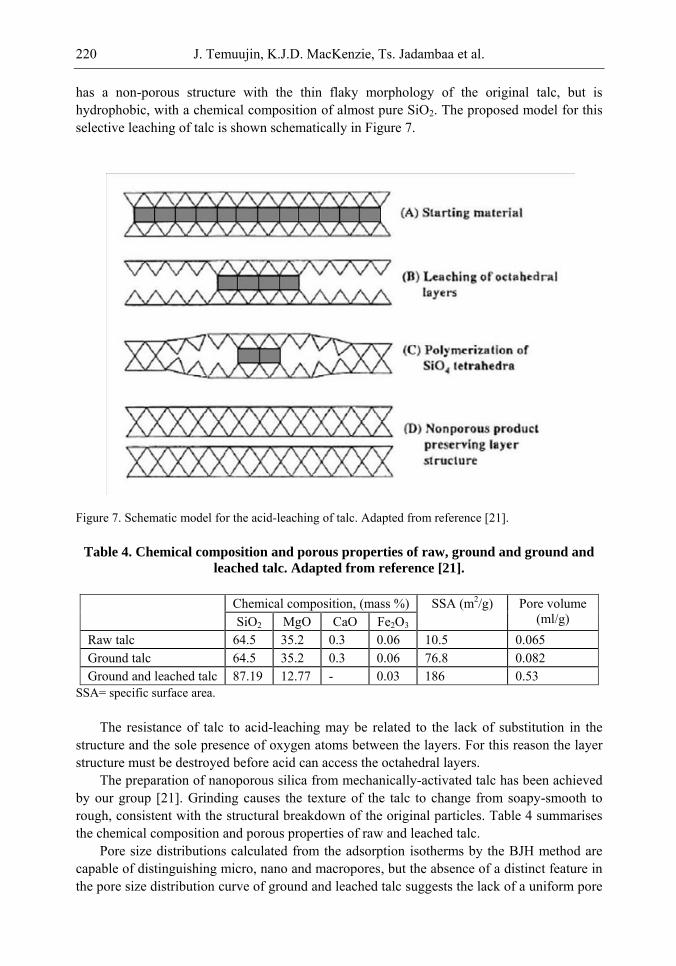
J. Temuujin, K.J.D. MacKenzie, Ts. Jadambaa et al. 220
has a non-porous structure with the thin flaky morphology of the original talc, but is hydrophobic, with a chemical composition of almost pure SiO2. The proposed model for this selective leaching of talc is shown schematically in Figure 7.
Figure 7. Schematic model for the acid-leaching of talc. Adapted from reference [21].
Table 4. Chemical composition and porous properties of raw, ground and ground and
leached talc. Adapted from reference [21].
Chemical composition, (mass %) SSA (m2/g) Pore volume (ml/g) SiO2 MgO CaO Fe2O3
Raw talc 64.5 35.2 0.3 0.06 10.5 0.065 Ground talc 64.5 35.2 0.3 0.06 76.8 0.082 Ground and leached talc 87.19 12.77 - 0.03 186 0.53
SSA= specific surface area. The resistance of talc to acid-leaching may be related to the lack of substitution in the
structure and the sole presence of oxygen atoms between the layers. For this reason the layer structure must be destroyed before acid can access the octahedral layers.
The preparation of nanoporous silica from mechanically-activated talc has been achieved by our group [21]. Grinding causes the texture of the talc to change from soapy-smooth to rough, consistent with the structural breakdown of the original particles. Table 4 summarises the chemical composition and porous properties of raw and leached talc.
Pore size distributions calculated from the adsorption isotherms by the BJH method are capable of distinguishing micro, nano and macropores, but the absence of a distinct feature in the pore size distribution curve of ground and leached talc suggests the lack of a uniform pore
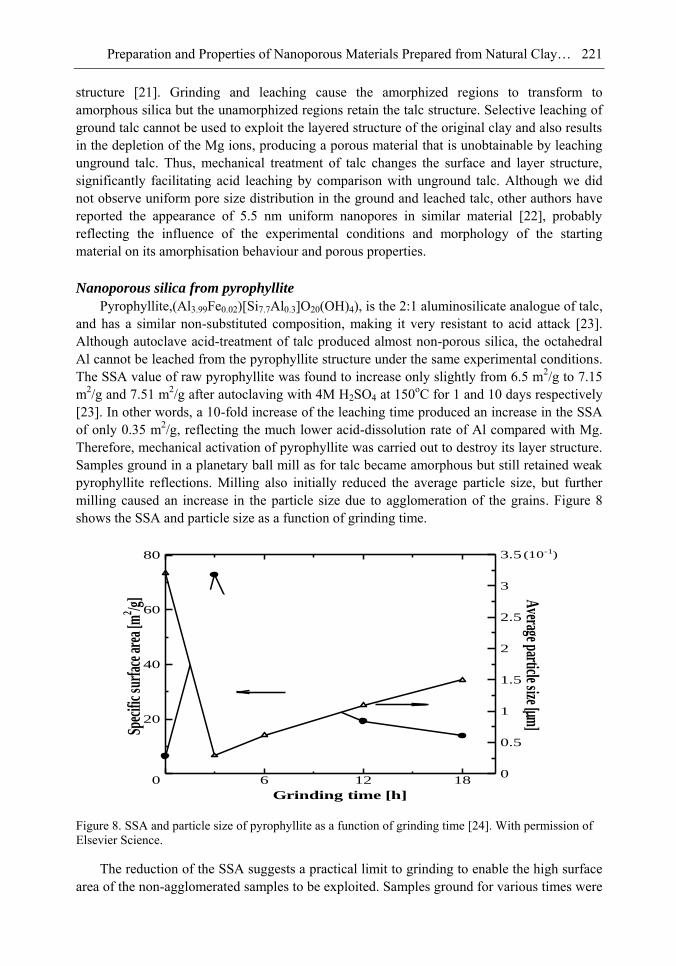
Preparation and Properties of Nanoporous Materials Prepared from Natural Clay… 221
structure [21]. Grinding and leaching cause the amorphized regions to transform to amorphous silica but the unamorphized regions retain the talc structure. Selective leaching of ground talc cannot be used to exploit the layered structure of the original clay and also results in the depletion of the Mg ions, producing a porous material that is unobtainable by leaching unground talc. Thus, mechanical treatment of talc changes the surface and layer structure, significantly facilitating acid leaching by comparison with unground talc. Although we did not observe uniform pore size distribution in the ground and leached talc, other authors have reported the appearance of 5.5 nm uniform nanopores in similar material [22], probably reflecting the influence of the experimental conditions and morphology of the starting material on its amorphisation behaviour and porous properties.
Nanoporous silica from pyrophyllite
Pyrophyllite,(Al3.99Fe0.02)[Si7.7Al0.3]O20(OH)4), is the 2:1 aluminosilicate analogue of talc, and has a similar non-substituted composition, making it very resistant to acid attack [23]. Although autoclave acid-treatment of talc produced almost non-porous silica, the octahedral Al cannot be leached from the pyrophyllite structure under the same experimental conditions. The SSA value of raw pyrophyllite was found to increase only slightly from 6.5 m2/g to 7.15 m2/g and 7.51 m2/g after autoclaving with 4M H2SO4 at 150oC for 1 and 10 days respectively [23]. In other words, a 10-fold increase of the leaching time produced an increase in the SSA of only 0.35 m2/g, reflecting the much lower acid-dissolution rate of Al compared with Mg. Therefore, mechanical activation of pyrophyllite was carried out to destroy its layer structure. Samples ground in a planetary ball mill as for talc became amorphous but still retained weak pyrophyllite reflections. Milling also initially reduced the average particle size, but further milling caused an increase in the particle size due to agglomeration of the grains. Figure 8 shows the SSA and particle size as a function of grinding time.
Figure 8. SSA and particle size of pyrophyllite as a function of grinding time [24]. With permission of Elsevier Science.
The reduction of the SSA suggests a practical limit to grinding to enable the high surface area of the non-agglomerated samples to be exploited. Samples ground for various times were
(10-1)
Grinding time [h]
Spec
ific
surf
ace a
rea
[m2 /g
] Average particle size [ m
]
0 6 12 18
20
40
60
80
0
0.5
1
1.5
2
2.5
3
3.5
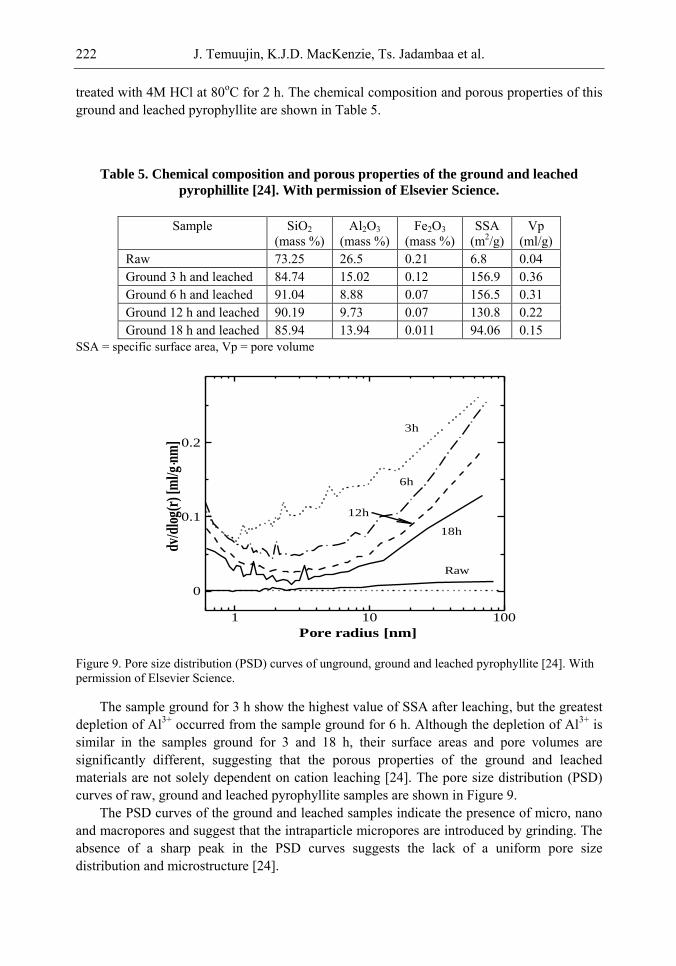
J. Temuujin, K.J.D. MacKenzie, Ts. Jadambaa et al. 222
treated with 4M HCl at 80oC for 2 h. The chemical composition and porous properties of this ground and leached pyrophyllite are shown in Table 5.
Table 5. Chemical composition and porous properties of the ground and leached
pyrophillite [24]. With permission of Elsevier Science.
Sample SiO2 (mass %)
Al2O3 (mass %)
Fe2O3 (mass %)
SSA (m2/g)
Vp (ml/g)
Raw 73.25 26.5 0.21 6.8 0.04 Ground 3 h and leached 84.74 15.02 0.12 156.9 0.36 Ground 6 h and leached 91.04 8.88 0.07 156.5 0.31 Ground 12 h and leached 90.19 9.73 0.07 130.8 0.22 Ground 18 h and leached 85.94 13.94 0.011 94.06 0.15
SSA = specific surface area, Vp = pore volume
Figure 9. Pore size distribution (PSD) curves of unground, ground and leached pyrophyllite [24]. With permission of Elsevier Science.
The sample ground for 3 h show the highest value of SSA after leaching, but the greatest depletion of Al3+ occurred from the sample ground for 6 h. Although the depletion of Al3+ is similar in the samples ground for 3 and 18 h, their surface areas and pore volumes are significantly different, suggesting that the porous properties of the ground and leached materials are not solely dependent on cation leaching [24]. The pore size distribution (PSD) curves of raw, ground and leached pyrophyllite samples are shown in Figure 9.
The PSD curves of the ground and leached samples indicate the presence of micro, nano and macropores and suggest that the intraparticle micropores are introduced by grinding. The absence of a sharp peak in the PSD curves suggests the lack of a uniform pore size distribution and microstructure [24].
Pore radius [nm]
dv/d
log(
r) [m
l/g n
m]
.
Raw
18h
3h
6h
12h
1 10 100
0
0.1
0.2
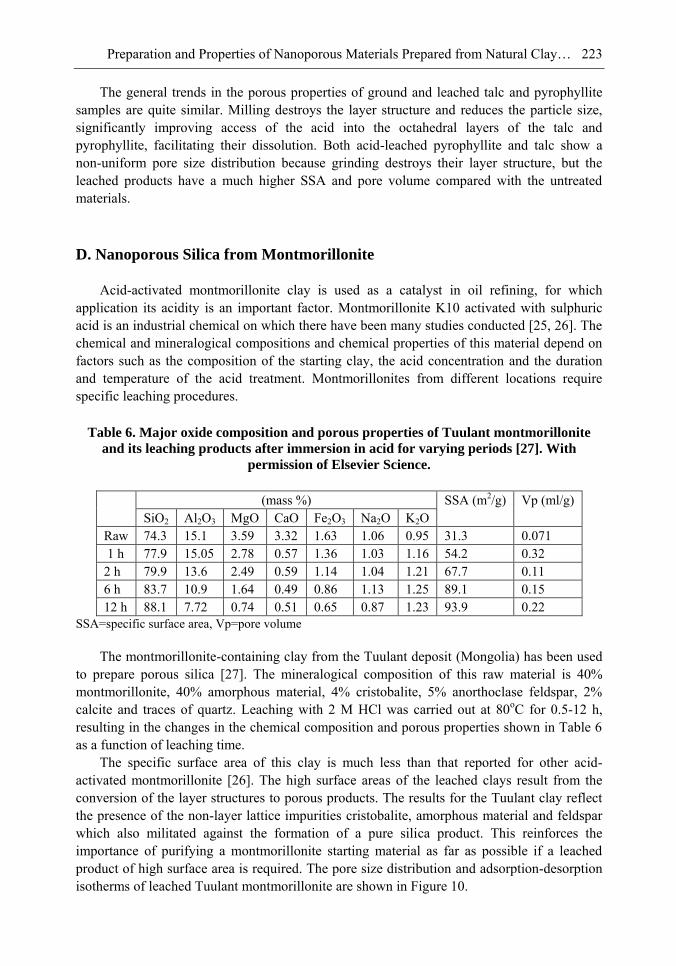
Preparation and Properties of Nanoporous Materials Prepared from Natural Clay… 223
The general trends in the porous properties of ground and leached talc and pyrophyllite samples are quite similar. Milling destroys the layer structure and reduces the particle size, significantly improving access of the acid into the octahedral layers of the talc and pyrophyllite, facilitating their dissolution. Both acid-leached pyrophyllite and talc show a non-uniform pore size distribution because grinding destroys their layer structure, but the leached products have a much higher SSA and pore volume compared with the untreated materials.
D. Nanoporous Silica from Montmorillonite
Acid-activated montmorillonite clay is used as a catalyst in oil refining, for which application its acidity is an important factor. Montmorillonite K10 activated with sulphuric acid is an industrial chemical on which there have been many studies conducted [25, 26]. The chemical and mineralogical compositions and chemical properties of this material depend on factors such as the composition of the starting clay, the acid concentration and the duration and temperature of the acid treatment. Montmorillonites from different locations require specific leaching procedures.
Table 6. Major oxide composition and porous properties of Tuulant montmorillonite
and its leaching products after immersion in acid for varying periods [27]. With
permission of Elsevier Science.
(mass %) SSA (m2/g) Vp (ml/g) SiO2 Al2O3 MgO CaO Fe2O3 Na2O K2O
Raw 74.3 15.1 3.59 3.32 1.63 1.06 0.95 31.3 0.071 1 h 77.9 15.05 2.78 0.57 1.36 1.03 1.16 54.2 0.32 2 h 79.9 13.6 2.49 0.59 1.14 1.04 1.21 67.7 0.11 6 h 83.7 10.9 1.64 0.49 0.86 1.13 1.25 89.1 0.15 12 h 88.1 7.72 0.74 0.51 0.65 0.87 1.23 93.9 0.22
SSA=specific surface area, Vp=pore volume
The montmorillonite-containing clay from the Tuulant deposit (Mongolia) has been used to prepare porous silica [27]. The mineralogical composition of this raw material is 40% montmorillonite, 40% amorphous material, 4% cristobalite, 5% anorthoclase feldspar, 2% calcite and traces of quartz. Leaching with 2 M HCl was carried out at 80oC for 0.5-12 h, resulting in the changes in the chemical composition and porous properties shown in Table 6 as a function of leaching time.
The specific surface area of this clay is much less than that reported for other acid-activated montmorillonite [26]. The high surface areas of the leached clays result from the conversion of the layer structures to porous products. The results for the Tuulant clay reflect the presence of the non-layer lattice impurities cristobalite, amorphous material and feldspar which also militated against the formation of a pure silica product. This reinforces the importance of purifying a montmorillonite starting material as far as possible if a leached product of high surface area is required. The pore size distribution and adsorption-desorption isotherms of leached Tuulant montmorillonite are shown in Figure 10.
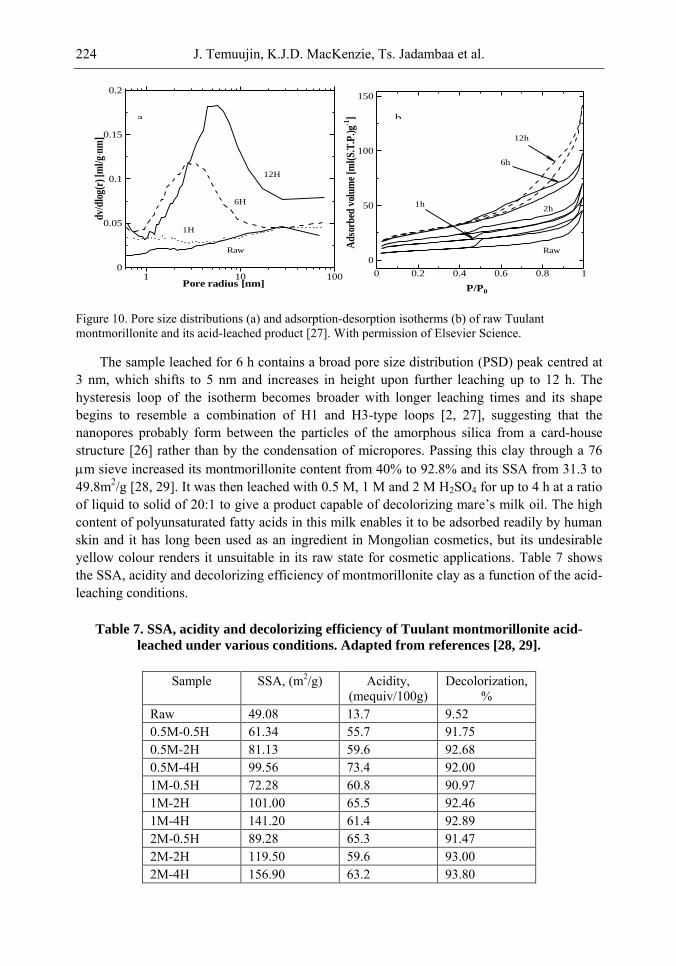
J. Temuujin, K.J.D. MacKenzie, Ts. Jadambaa et al. 224
Figure 10. Pore size distributions (a) and adsorption-desorption isotherms (b) of raw Tuulant montmorillonite and its acid-leached product [27]. With permission of Elsevier Science.
The sample leached for 6 h contains a broad pore size distribution (PSD) peak centred at 3 nm, which shifts to 5 nm and increases in height upon further leaching up to 12 h. The hysteresis loop of the isotherm becomes broader with longer leaching times and its shape begins to resemble a combination of H1 and H3-type loops [2, 27], suggesting that the nanopores probably form between the particles of the amorphous silica from a card-house structure [26] rather than by the condensation of micropores. Passing this clay through a 76 m sieve increased its montmorillonite content from 40% to 92.8% and its SSA from 31.3 to 49.8m2/g [28, 29]. It was then leached with 0.5 M, 1 M and 2 M H2SO4 for up to 4 h at a ratio of liquid to solid of 20:1 to give a product capable of decolorizing mare‘s milk oil. The high content of polyunsaturated fatty acids in this milk enables it to be adsorbed readily by human skin and it has long been used as an ingredient in Mongolian cosmetics, but its undesirable yellow colour renders it unsuitable in its raw state for cosmetic applications. Table 7 shows the SSA, acidity and decolorizing efficiency of montmorillonite clay as a function of the acid-leaching conditions.
Table 7. SSA, acidity and decolorizing efficiency of Tuulant montmorillonite acid-
leached under various conditions. Adapted from references [28, 29].
Sample SSA, (m2/g) Acidity, (mequiv/100g)
Decolorization, %
Raw 49.08 13.7 9.52 0.5M-0.5H 61.34 55.7 91.75 0.5M-2H 81.13 59.6 92.68 0.5M-4H 99.56 73.4 92.00 1M-0.5H 72.28 60.8 90.97 1M-2H 101.00 65.5 92.46 1M-4H 141.20 61.4 92.89 2M-0.5H 89.28 65.3 91.47 2M-2H 119.50 59.6 93.00 2M-4H 156.90 63.2 93.80
P/P0
Ad
sorb
ed v
olu
me
[ml(
S.T
.P.)
g-1]
12h
6h
1h
Raw
2h
0 0.2 0.4 0.6 0.8 1
0
50
100
150
Pore radius [nm]
dv/
dlo
g(r)
[m
l/g
nm
]
.
Raw
1H
6H
12H
1 10 1000
0.05
0.1
0.15
0.2
a b
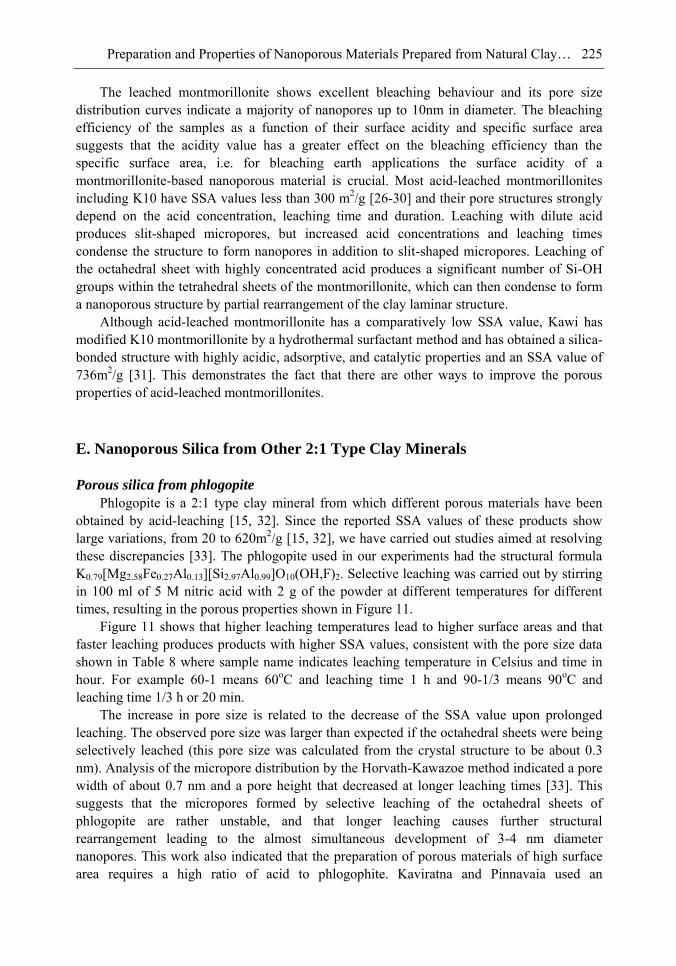
Preparation and Properties of Nanoporous Materials Prepared from Natural Clay… 225
The leached montmorillonite shows excellent bleaching behaviour and its pore size distribution curves indicate a majority of nanopores up to 10nm in diameter. The bleaching efficiency of the samples as a function of their surface acidity and specific surface area suggests that the acidity value has a greater effect on the bleaching efficiency than the specific surface area, i.e. for bleaching earth applications the surface acidity of a montmorillonite-based nanoporous material is crucial. Most acid-leached montmorillonites including K10 have SSA values less than 300 m2/g [26-30] and their pore structures strongly depend on the acid concentration, leaching time and duration. Leaching with dilute acid produces slit-shaped micropores, but increased acid concentrations and leaching times condense the structure to form nanopores in addition to slit-shaped micropores. Leaching of the octahedral sheet with highly concentrated acid produces a significant number of Si-OH groups within the tetrahedral sheets of the montmorillonite, which can then condense to form a nanoporous structure by partial rearrangement of the clay laminar structure.
Although acid-leached montmorillonite has a comparatively low SSA value, Kawi has modified K10 montmorillonite by a hydrothermal surfactant method and has obtained a silica-bonded structure with highly acidic, adsorptive, and catalytic properties and an SSA value of 736m2/g [31]. This demonstrates the fact that there are other ways to improve the porous properties of acid-leached montmorillonites.
E. Nanoporous Silica from Other 2:1 Type Clay Minerals
Porous silica from phlogopite
Phlogopite is a 2:1 type clay mineral from which different porous materials have been obtained by acid-leaching [15, 32]. Since the reported SSA values of these products show large variations, from 20 to 620m2/g [15, 32], we have carried out studies aimed at resolving these discrepancies [33]. The phlogopite used in our experiments had the structural formula K0.79[Mg2.58Fe0.27Al0.13][Si2.97Al0.99]O10(OH,F)2. Selective leaching was carried out by stirring in 100 ml of 5 M nitric acid with 2 g of the powder at different temperatures for different times, resulting in the porous properties shown in Figure 11.
Figure 11 shows that higher leaching temperatures lead to higher surface areas and that faster leaching produces products with higher SSA values, consistent with the pore size data shown in Table 8 where sample name indicates leaching temperature in Celsius and time in hour. For example 60-1 means 60oC and leaching time 1 h and 90-1/3 means 90oC and leaching time 1/3 h or 20 min.
The increase in pore size is related to the decrease of the SSA value upon prolonged leaching. The observed pore size was larger than expected if the octahedral sheets were being selectively leached (this pore size was calculated from the crystal structure to be about 0.3 nm). Analysis of the micropore distribution by the Horvath-Kawazoe method indicated a pore width of about 0.7 nm and a pore height that decreased at longer leaching times [33]. This suggests that the micropores formed by selective leaching of the octahedral sheets of phlogopite are rather unstable, and that longer leaching causes further structural rearrangement leading to the almost simultaneous development of 3-4 nm diameter nanopores. This work also indicated that the preparation of porous materials of high surface area requires a high ratio of acid to phlogophite. Kaviratna and Pinnavaia used an
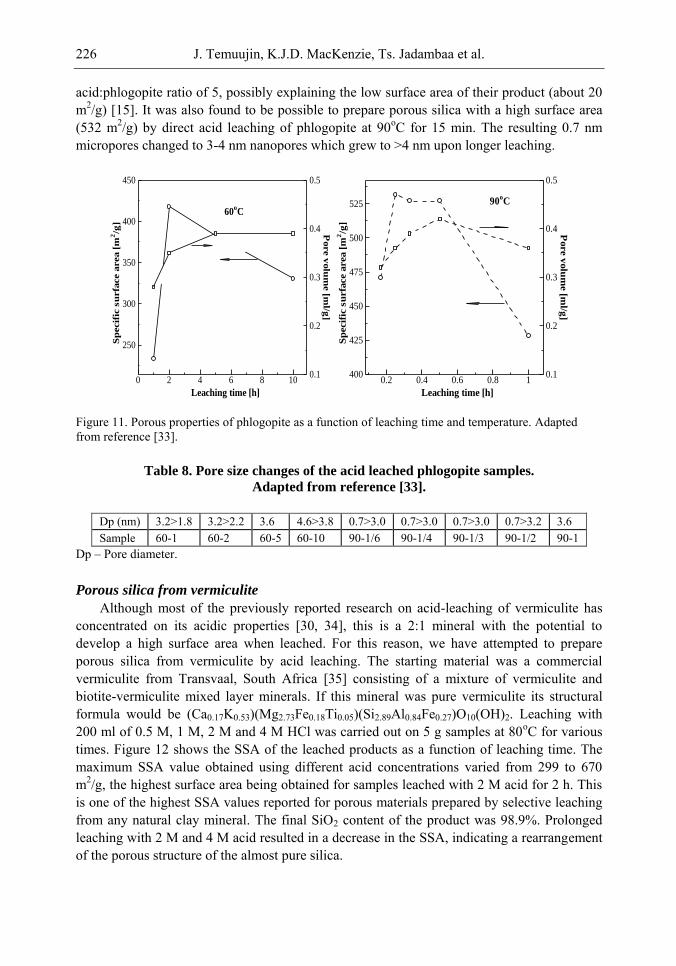
J. Temuujin, K.J.D. MacKenzie, Ts. Jadambaa et al. 226
acid:phlogopite ratio of 5, possibly explaining the low surface area of their product (about 20 m2/g) [15]. It was also found to be possible to prepare porous silica with a high surface area (532 m2/g) by direct acid leaching of phlogopite at 90oC for 15 min. The resulting 0.7 nm micropores changed to 3-4 nm nanopores which grew to >4 nm upon longer leaching.
Figure 11. Porous properties of phlogopite as a function of leaching time and temperature. Adapted from reference [33].
Table 8. Pore size changes of the acid leached phlogopite samples.
Adapted from reference [33].
Dp (nm) 3.2>1.8 3.2>2.2 3.6 4.6>3.8 0.7>3.0 0.7>3.0 0.7>3.0 0.7>3.2 3.6 Sample 60-1 60-2 60-5 60-10 90-1/6 90-1/4 90-1/3 90-1/2 90-1
Dp – Pore diameter.
Porous silica from vermiculite
Although most of the previously reported research on acid-leaching of vermiculite has concentrated on its acidic properties [30, 34], this is a 2:1 mineral with the potential to develop a high surface area when leached. For this reason, we have attempted to prepare porous silica from vermiculite by acid leaching. The starting material was a commercial vermiculite from Transvaal, South Africa [35] consisting of a mixture of vermiculite and biotite-vermiculite mixed layer minerals. If this mineral was pure vermiculite its structural formula would be (Ca0.17K0.53)(Mg2.73Fe0.18Ti0.05)(Si2.89Al0.84Fe0.27)O10(OH)2. Leaching with 200 ml of 0.5 M, 1 M, 2 M and 4 M HCl was carried out on 5 g samples at 80oC for various times. Figure 12 shows the SSA of the leached products as a function of leaching time. The maximum SSA value obtained using different acid concentrations varied from 299 to 670 m2/g, the highest surface area being obtained for samples leached with 2 M acid for 2 h. This is one of the highest SSA values reported for porous materials prepared by selective leaching from any natural clay mineral. The final SiO2 content of the product was 98.9%. Prolonged leaching with 2 M and 4 M acid resulted in a decrease in the SSA, indicating a rearrangement of the porous structure of the almost pure silica.
60oC
Leaching time [h]
Sp
ecif
ic s
urfa
ce a
rea [
m2/g
]
Pore v
olu
me [m
l/g]
0 2 4 6 8 10
250
300
350
400
450
0.1
0.2
0.3
0.4
0.5
90oC
Leaching time [h]
Sp
ecif
ic s
urfa
ce a
rea [
m2/g
]
Pore v
olu
me [m
l/g]
0.2 0.4 0.6 0.8 1400
425
450
475
500
525
0.1
0.2
0.3
0.4
0.5
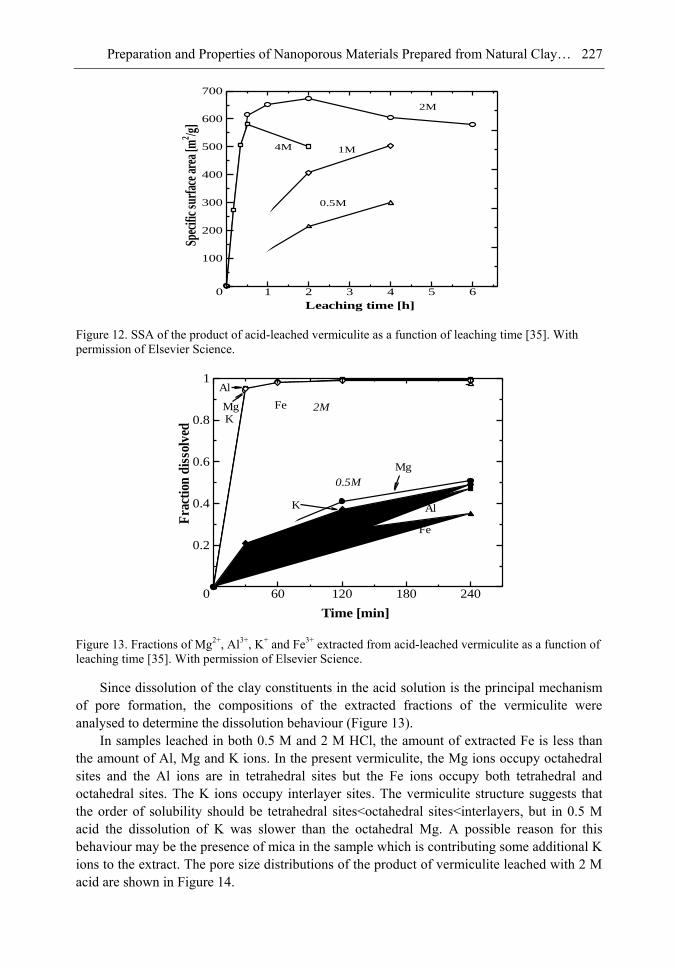
Preparation and Properties of Nanoporous Materials Prepared from Natural Clay… 227
Figure 12. SSA of the product of acid-leached vermiculite as a function of leaching time [35]. With permission of Elsevier Science.
Figure 13. Fractions of Mg2+, Al3+, K+ and Fe3+ extracted from acid-leached vermiculite as a function of leaching time [35]. With permission of Elsevier Science.
Since dissolution of the clay constituents in the acid solution is the principal mechanism of pore formation, the compositions of the extracted fractions of the vermiculite were analysed to determine the dissolution behaviour (Figure 13).
In samples leached in both 0.5 M and 2 M HCl, the amount of extracted Fe is less than the amount of Al, Mg and K ions. In the present vermiculite, the Mg ions occupy octahedral sites and the Al ions are in tetrahedral sites but the Fe ions occupy both tetrahedral and octahedral sites. The K ions occupy interlayer sites. The vermiculite structure suggests that the order of solubility should be tetrahedral sites<octahedral sites<interlayers, but in 0.5 M acid the dissolution of K was slower than the octahedral Mg. A possible reason for this behaviour may be the presence of mica in the sample which is contributing some additional K ions to the extract. The pore size distributions of the product of vermiculite leached with 2 M acid are shown in Figure 14.
Leaching time [h]
Spec
ific
surf
ace
area
[m2 /g
]0.5M
1M4M
2M
0 1 2 3 4 5 6
100
200
300
400
500
600
700
Time [min]
Fra
ctio
n d
isso
lved
0.5M
2M
Mg
Al
Fe
FeMg
Al
K
K
0 60 120 180 240
0.2
0.4
0.6
0.8
1
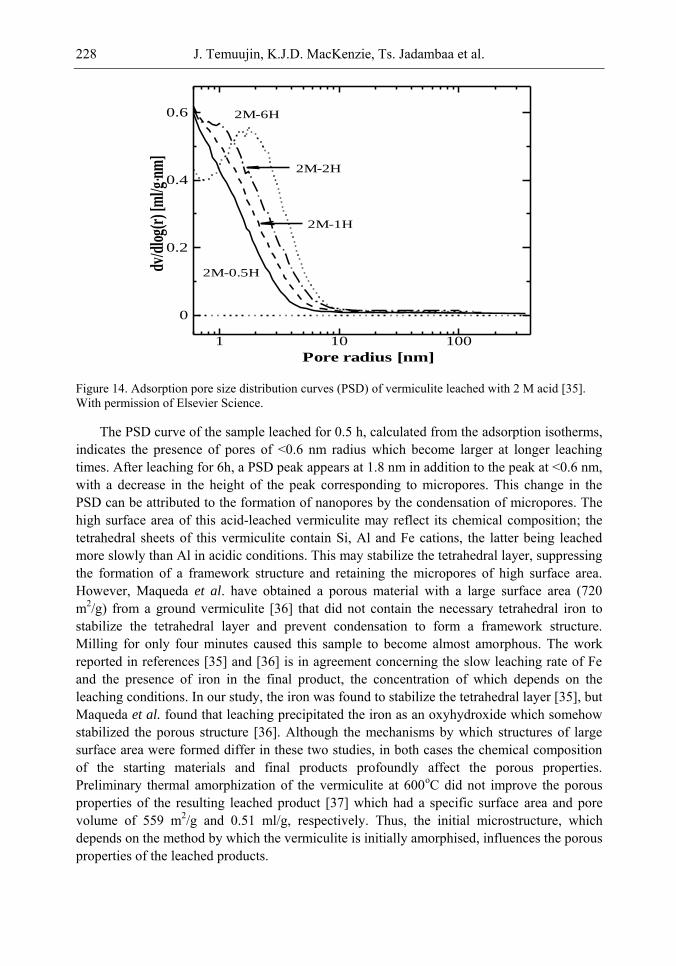
J. Temuujin, K.J.D. MacKenzie, Ts. Jadambaa et al. 228
Figure 14. Adsorption pore size distribution curves (PSD) of vermiculite leached with 2 M acid [35]. With permission of Elsevier Science.
The PSD curve of the sample leached for 0.5 h, calculated from the adsorption isotherms, indicates the presence of pores of <0.6 nm radius which become larger at longer leaching times. After leaching for 6h, a PSD peak appears at 1.8 nm in addition to the peak at <0.6 nm, with a decrease in the height of the peak corresponding to micropores. This change in the PSD can be attributed to the formation of nanopores by the condensation of micropores. The high surface area of this acid-leached vermiculite may reflect its chemical composition; the tetrahedral sheets of this vermiculite contain Si, Al and Fe cations, the latter being leached more slowly than Al in acidic conditions. This may stabilize the tetrahedral layer, suppressing the formation of a framework structure and retaining the micropores of high surface area. However, Maqueda et al. have obtained a porous material with a large surface area (720 m2/g) from a ground vermiculite [36] that did not contain the necessary tetrahedral iron to stabilize the tetrahedral layer and prevent condensation to form a framework structure. Milling for only four minutes caused this sample to become almost amorphous. The work reported in references [35] and [36] is in agreement concerning the slow leaching rate of Fe and the presence of iron in the final product, the concentration of which depends on the leaching conditions. In our study, the iron was found to stabilize the tetrahedral layer [35], but Maqueda et al. found that leaching precipitated the iron as an oxyhydroxide which somehow stabilized the porous structure [36]. Although the mechanisms by which structures of large surface area were formed differ in these two studies, in both cases the chemical composition of the starting materials and final products profoundly affect the porous properties. Preliminary thermal amorphization of the vermiculite at 600oC did not improve the porous properties of the resulting leached product [37] which had a specific surface area and pore volume of 559 m2/g and 0.51 ml/g, respectively. Thus, the initial microstructure, which depends on the method by which the vermiculite is initially amorphised, influences the porous properties of the leached products.
2M-6H
2M-0.5H
2M-1H
2M-2H
Pore radius [nm]
dv/d
log(
r) [m
l/g n
m]
.
1 10 100
0
0.2
0.4
0.6
Preparation and Properties of Nanoporous Materials Prepared from Natural Clay… 229
The surface areas of porous materials prepared from 2:1 layer-lattice clay minerals depend largely on their chemical and structural compositions. The optimum surface areas also depend on the intended application of the materials; porous materials for use as catalysts require a high surface area and high surface acidity whereas the most important factors in matrix materials for applications as sieves, adsorbents and catalyst supports are their pore geometry, surface chemical properties and surface areas.
CONCLUSION
The major conclusions of our studies of the preparation of porous material from various clay minerals are as follows:
1. Thermally amorphized kaolinite has a greater specific surface area than mechanically
amorphized kaolinite 2. The 2:1 layer lattice clay minerals in which elemental substitutions do not occur
(talc, pyrophillite) are very resistant to acid attack, making it necessary to destroy their layer-lattice structure by mechanical activation prior to acid leaching.
3. The 2:1 layer lattice minerals in which elemental substitution is present produce silicas with higher surface areas.
4. Acid leaching of the 2:1 layer-lattice minerals removes the interlayer cations preferentially, followed by the removal of the octahedral cations.
5. The slow dissolution rate of Fe ions present in a clay structure increases the specific surface area, possibly by stabilizing the micropores formed.
6. Acid leaching of 2:1 layer lattice clay minerals forms two types of the pores, namely, slit-shaped pores formed between pairs of apical tetrahedral sheets, and framework-structured nanopores formed by polycondensation of these slit-shaped pores or by polycondensation of the fine clay particles.
7. The leaching behaviour and porous properties of the different 2:1 type clay minerals are controlled mainly by the structural compositions of the clay minerals.
8. Selective leaching of mineral templates is an extremely useful and versatile method for preparing highly functional nanoporous materials.
REFERENCES
[1] Okada, K. & MacKenzie, K. J. D. (2006). Nanoporous materials from mineral band organic templates, in Nanomaterials from research to applications, edited by In: H., Hosono, Y., Mishima, H., Takezoe, K. J. D., MacKenzie, 349-382, Elsevier, San-Diego, (2006)
[2] Sing, K. S. W., Everett, D. H., Haul, R. A. W., Moscou, L., Pietotti, R. P., Rouquerol, J. & Siemieniewska, T. (1985). Reporting physisorption data for gas/solid systems with special reference to the determination of surface area and porosity, Pure & Appl. Chem., 57, 603-619.
J. Temuujin, K.J.D. MacKenzie, Ts. Jadambaa et al. 230
[3] Groen, J. C., Peffer, L. A. A. & Perez-Ramirez, J. (2003). Pore size determination in modified micro- and mesoporous materials. Pitfalls and limitations in gas adsorption data analysis, Micropor. Mesopor. Mater., 60, 1-17.
[4] Brindley, G. W. & Sempels, R. E. (1977). Preparation and properties of some hydroxyl-
aluminium beidellites, 12, 229-237. [5] Mokaya, R., Jones, W., Davies, M. E. & Whittle, M. E. (1994). The mechanism of
chlorophyll adsorption on-acid activated clays, J.Solid State Chem., 111, 157-163. [6] [6] Okada, K., Shimai, A., Takei, T., Hayashi, S., Yasumori, A. & MacKenzie, K. J. D.
(1998). Preparation of microporous silica from metakaolinite by selective leaching method, Microporous Mesoporous Mater., 21, 289-296.
[7] Okada, K., Kawashima, H., Saito, Y., Hayashi, S. & Yasumori, A. (1995). A new preparation method of mesoporous -alumina. J.Mater. Chem., 5, 1241-1245.
[8] Theng, B. K. G., Russell, M., Churchman, G. J. & Parfitt, R. L. (1982). Surface properties of allophone, halloysite and imogolite, Clays and Clay Miner., 30, 143-149.
[9] Saito, Y. (1997). Porous properties and thermal stability of -Alumina. PhD thesis. Tokyo Institute of Technology, Tokyo, Japan
[10] Okada, K., Saito, Y., Hiroki, M., Tomita, T. & Tomura, S. (1997). Water vapor sorption on mesoporous gamma-alumina prepared by the selective leaching method J.Por.Mater., 4, 253-257.
[11] Temuujin, J., Okada, K. & Mackenzie, K. J. D. (2002). Preparation and properties of potassium aluminosilicate prepared from the waste solution of selectively leached calcined kaolinite, Appl.Clay Sci., 21, 125-131.
[12] Okada, K., Temuujin, J., Kameshima, Y. & MacKenzie, K. J. D. (2003). Simultaneous uptake of ammonium and phosphate ions by composites of -alumina/potassium aluminosilicate gel, Mater.Res.Bull., 38, 749-756.
[13] Temuujin, J. & Okada, K. (2002). Porous properties of -alumina/potassium aluminosilicate gel composites prepared by selective leaching and precipitation method. J.Porous Mater., 9, 155-159.
[14] Tomita, T. (1997). Adsorption of various substances by porous g-alumina prepared by selective leaching method. Bachelor thesis, Tokyo Institute of Technology, Tokyo, Japan
[15] Kaviratha, H. & Pinnavaia, T. J. (1994). Acid hydrolysis of octahedral Mg2+ sites in 2:1 layered silicates: an assessment of edge attack and gallery access mechanism, Clays Clay
Miner., 42, 717-723. [16] Mendelovici, E. (1997). Comparative study of the effects of thermal and mechanical
treatments on the structures of clay minerals, J.Thermal Anal., 49, 1385-1392. [17] MacKenzie, K. J. D., Okada, K. & Temuujin, J. (2004). Nanoporous inorganic materials
from mineral templates, Current Applied Physics, 4, 167-170. [18] Temuujin, J., Burmaa, G., Amgalan, J., Okada, K., Jadambaa, Ts. & MacKenzie, K. J. D.
(2001). Preparation of porous silica from mechanically activated kaolinite, J.Porous
Mater., 8, 233-238. [19] Temuujin, J., Okada, K., MacKenzie, K. J. D. & Jadambaa, Ts. (2001). Characterization
of porous silica prepared from mechanically amorphized kaolinite by selective leaching, Powder Technology, 121, 259-262.
[20] Okada, K., Temuujin, J., Kameshima, Y. & MacKenzie, K. J. D. (2003). Selective acid leaching of talc, Clay Science, 12, 159-165.
Preparation and Properties of Nanoporous Materials Prepared from Natural Clay… 231
[21] Temuujin, J., Okada, K., Jadambaa, T. S., MacKenzie, K. J. D. & Amarsanaa, J. (2002). Effect of grinding on the preparation of porous material from talc by selective leaching, J.Mater.Sci.Lett., 21, 1607-1609.
[22] Yang, H., Du, C., Hu, Y., Jin, S., Yang, W., Tang, A. & Avvakumov, E. G. (2006). Preparation of porous material from talc by mechanochemical treatment and subsequent leaching, Appl.Clay Sci., 31, 290-297.
[23] Temuujin, J. unpublished results [24] Temuujin, J., Okada, K., Jadambaa, T. S., MacKenzie, K. J. D. & Amarsanaa, J. (2003).
Effect of grinding on the leaching behaviour of prophillite, J.Europ.Ceram.Soc., 23, 1277-1282.
[25] Madejova, J., Bujdak, J., Janek, M. & Komadel, P. (1998). Comparative FT-IR study of structural modifications during acid treatment of dioctahedral smectites and hectorite, Spectrochim. Acta A, 54, 1397-1406.
[26] Shinoda, T., Onaka, M. & Izumi, Y. (1995). Proposed models of mesopore structures in sulphuric acid-treated montmorillonite and K10, Chemistry Letters, 495-496.
[27] Temuujin, J., Jadambaa, T. S., Burmaa, G. Erdenechimeg, S. H., Amarsanaa, J. & MacKenzie, D. (2004). Characterisation of acid activated montmorillonite clay from Tuulant (Mongolia), Ceram.Inter., 30, 151-155.
[28] Temuujin, J., Senna, M., Jadambaa, T. S., Burmaa, D., Erdenechimeg, S. & MacKenzie, K. J. D. (2006). Characterization and bleaching properties of acid-leached montmorillonite, J.Chem. Technol. Biotechnol., 81, 688-693.
[29] [29] Temuujin, J., Senna, M., Jadambaa, T. S., Burmaa, D., Erdenechimeg, S. H., Amarsanaa, J. & Burmaa, G. (2006). Characterization of nanoporous materials prepared from montmorillonite clay and its application to the decolorization of mare‘s milk oil, J.Porous Mater., 13, 49-53.
[30] Ravichandran, J. & Sivasankar, B. (1997). Properties and catalytic activity of acid-modified montmorillonite and vermiculite, Clays Clay Miner., 45, 854-858.
[31] Kawi, S. (1993). A high-surface-area silica-clay composite material, Mater. Lett, 38, 351-355.
[32] Harkonen, M. A. & Keiski, R. L. (1984). Porosity and surface area of acid-leached phlogopite: The effect of leaching conditions and thermal treatment, Colloids and
Surfaces, 11, 323-339. [33] Okada, K., Nakazawa, N., Kameshima, Y., Yasumori, A., Temuujin, J., MacKenzie, K. J.
D. & Smith, M. E. (2002). Preparation and porous properties of materials prepared by selective leaching of plogopite, Clays Clay Miner., 50, 624-632.
[34] Suquet, H., Chevalier, S., Marcilly, C. & Barthomeuf, D. (1991). Preparation of porous materials by chemical activation of the Llano vermiculite, Clay Miner., 26, 49-60.
[35] Temuujin, J., Okada, K. & Mackenzie, K. J. D. (2003). Preparation of porous silica from vermiculite by selective leaching, Applied Clay science, 22, 187-195.
[36] Maqueda, C., Romero, A. S., Morillo, E., Perez-Rodriguez, J. L., Lerf, A. & Wagner, F. E. (2008). The behaviour of Fe in ground and acid-treated vermiculite from Santa Olala, Spain, Clays and Clay Miner., 56, 380-388.
[37] Temuujin, J., Minjigmaa, A., Jadambaa, T. S., Tsend-Ayush, S. & MacKenzie, K. J. D. (2008). Porous properties of silica prepared by selective acid leaching of heat-treated vermiculite, Chem. for Sustainable Dev., 16, 223-227.

In: Nanoporous Materials Types, Properties and Uses ISBN: 978-1-61668-182-1 Editor: Samuel B. Jenkins, pp. 233-242 © 2010 Nova Science Publishers, Inc.
Chapter 7
MAGNETIC NANOPOROUS MATERIALS
S. Giri*
Department of Solid State Physics, Indian Association for the Cultivation of Science, Jadavpur, Kolkata, West Bengal, India
ABSTRACT
Currently, nanoporous materials have been recognised as promising candidates for the multifunctional applications such as catalysis, ion-exchange, gas storage, low density magnetic storage, etc. Because of the diverse range of metal organic (inorganic) networks the structural, chemical, and physical properties of nanoporous materials are fascinating from fundamental interest as well as technological applications. The use of transition metal ions within the nanoporous structure opens up the possibility of various applications with improved electrical, optical, and magnetic properties. Among them, the search for the improved magnetic properties is challenging ascribed to their potential applications in developing low density magnetic storage materials, magnetic sensors, and intelligent or multifunctional materials. The magnetic properties of the metal organic (inorganic) networks are strongly influenced by the structures of the materials where magnetic properties have been tuned by designing varieties of porous structures composed of different transition metals. In this article the magnetism of nanoporous materials is reviewed based on recent experimental results.
1. INTRODUCTION
Porous materials constructed from the network of ‗‗inorganic‘‘ layers or chains through
the organic ligands are generally referred to as organic–inorganic hybrid porous structures [1-5]. When organic-inorganic structures are attached with different metals such as Galium [6,7], Tin [8], Iron [9-11], Cobalt [12,13], Vanadium [14], Indium [15], Boron [16], Manganese [17], molybdenum [18,19], these are typically defined as metal-organic-inorganic hybrid
* Corresponding author: E-mail:[email protected]
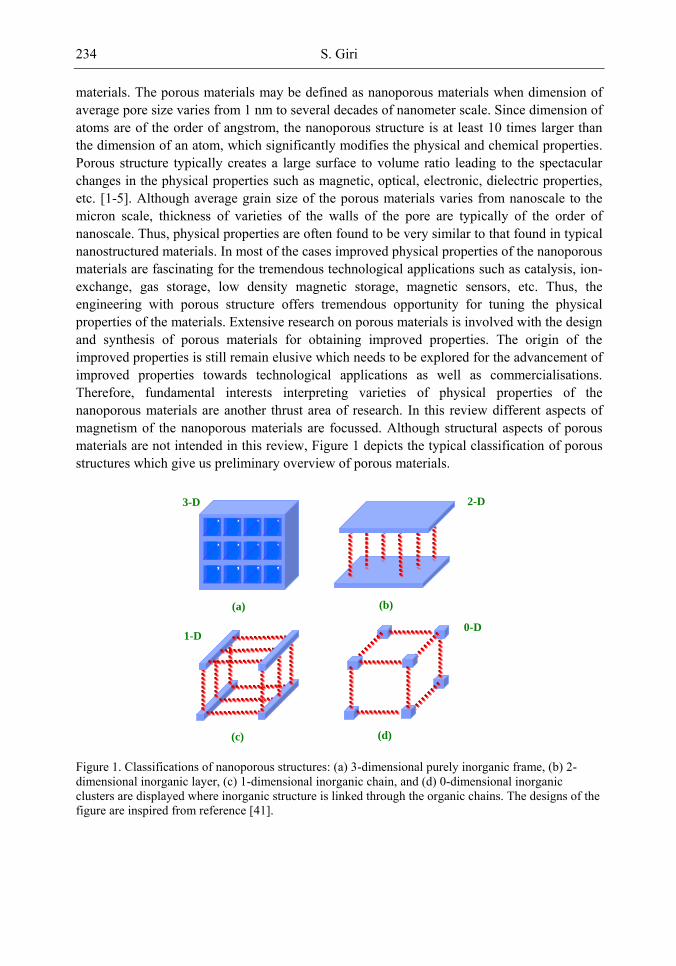
S. Giri 234
materials. The porous materials may be defined as nanoporous materials when dimension of average pore size varies from 1 nm to several decades of nanometer scale. Since dimension of atoms are of the order of angstrom, the nanoporous structure is at least 10 times larger than the dimension of an atom, which significantly modifies the physical and chemical properties. Porous structure typically creates a large surface to volume ratio leading to the spectacular changes in the physical properties such as magnetic, optical, electronic, dielectric properties, etc. [1-5]. Although average grain size of the porous materials varies from nanoscale to the micron scale, thickness of varieties of the walls of the pore are typically of the order of nanoscale. Thus, physical properties are often found to be very similar to that found in typical nanostructured materials. In most of the cases improved physical properties of the nanoporous materials are fascinating for the tremendous technological applications such as catalysis, ion-exchange, gas storage, low density magnetic storage, magnetic sensors, etc. Thus, the engineering with porous structure offers tremendous opportunity for tuning the physical properties of the materials. Extensive research on porous materials is involved with the design and synthesis of porous materials for obtaining improved properties. The origin of the improved properties is still remain elusive which needs to be explored for the advancement of improved properties towards technological applications as well as commercialisations. Therefore, fundamental interests interpreting varieties of physical properties of the nanoporous materials are another thrust area of research. In this review different aspects of magnetism of the nanoporous materials are focussed. Although structural aspects of porous materials are not intended in this review, Figure 1 depicts the typical classification of porous structures which give us preliminary overview of porous materials.
Figure 1. Classifications of nanoporous structures: (a) 3-dimensional purely inorganic frame, (b) 2-dimensional inorganic layer, (c) 1-dimensional inorganic chain, and (d) 0-dimensional inorganic clusters are displayed where inorganic structure is linked through the organic chains. The designs of the figure are inspired from reference [41].
0-D
2-D
(a) (b)
(d) (c)
1-D
3-D
Magnetic Nanoporous Materials 235
2. MAGNETIC PROPERTIES OF POROUS STRUCTURE
Magnetism is one of the oldest subjects, which is still fascinating with lots of emerging quantum aspects such as superconductivity [20-24], multiferroicity [25-29], molecular magnetism [30-32], nanomagnetism [33-36], low-dimensional magnetism [37-40], etc. Dimensionality of the crystal structure is one of the crucial factors for varieties of quantum effects in magnetism. Thus, engineering of structural aspects such as size, geometry, chemical functionality, and various coordinating modes of the linkers provide excellent means of controlling and modulating magnetic properties of the materials. Synthesis of materials with porous structure also leads to the different structures which gives rise to the varieties of magnetic properties. The considerable enhancement of surface to volume ratio is another important aspect of the porous structure where delicate interplay between surface and core part of the magnetism leads to the fascinating magnetic properties of the materials. The understanding of the crystalline structure is the basic building block for primary discussions and interpretations of magnetism for any kind of magnetic materials. According to the reported results two kinds of porous structures have been realized with well crystalline structure and amorphous structure. Magnetism of nanoporous materials having well crystalline structure has been investigated extensively and reviewed in few literatures [41-44]. Ferromagnetic [45-63], antiferrmagnetic [62-83], ferrimagnetic [80-83], metamagnetic [83-85], frustrated magnetism having triangular lattice [87-88], fcc lattice with frustrated tetrahedral [89] structure have been reported in various literatures. Depending on the synthesis conditions as well as thin wall of the porous structure the crystalline structure does not form which results in the amorphous structure [90-92]. The porous material having amorphous structure is another category of porous magnet which exhibits varieties of glassy magnetic behaviors [93-96]. Magnetism of the second category of materials is still not well characterized because of the limited experimental results. Whether the porous materials having amorphous structure can be categorized to the family of typical amorphous magnet is still an open issue. The basic difference between amorphous materials and porous materials with amorphous structure is that porous materials have additionally huge surface to volume ratio than the typical amorphous materials, from structural point of view. Apart from the fundamental interest the porous magnet is fascinating for the technological applications such as low density magnetic materials, magnetic sensors, electronic switching, etc. which are one of the major challenges in this topic. In this review the magnetism of the nonporous materials is discussed in two parts: 1) magnetism of nanoporous materials with crystalline structure and 2) magnetism of nanoporous materials with amorphous structure.
2.1.1. Magnetism of nanoporous materials with crystalline structure
Current investigation on the nanoporous materials having crystalline structure displays varieties of magnetic properties which are mainly based on either ferromagnetism or antiferromagnetism [98]. Since metal atoms in these nanoporous materials are connected through nonmagnetic atoms or group of atoms, the magnetic interactions are mediated only through superexchange interactions. In the early 1990s, Goodenough described that systems like Fe–F–Fe or Fe–O–Fe show anti- or ferromagnetic superexchange interactions depending on the angle between the three centers [99]. For example, d5
–d5 superexchange was predicted to be antiferromagnetic for angles close to 1800. On the other hand, interactions are
S. Giri 236
ferromagnetic if angle is close to 900. Examples of magnetic porous materials with interesting ferromagnetic and antiferromagnetic ground states are discussed in the next subsections.
A. Ferromagnetic Materials
Extensively reported results exhibit that examples of antiferromagnetic ordering is adequately larger than the examples of ferromagnetic ordering at low temperature among nanoporous materials. In this section examples of ferromagnetic ordering in few interesting porous materials are reviewed. In early 1993, the vanadium phosphate based materials [(VO)3(OH)2(H2O)2-(PO4)2]·C3N2H12 [45] and K4[V10O10(H2O)2(OH)4(PO4)7]·CNH5·4H2O [46] has been reported with weak ferromagnetic character having ordering temperature at 5.2 K. The weak ferromagnetism below ~ 25 K was reported in few cobalt based magnet, Cs2Co3(HPO4)(PO4)2·H2O [47], and [H3N(CH2)3NH3]0.5[Co(PO4)]·0.5H2O and H3N(CH2)4NH3]0.5[Co(PO4)] [48]. Cobalt phosphates, NaCo3(OH)(PO4)2·1/4H2O and Na(NH4)Co2(PO4)2·H2O also exhibited weak ferromagnetism below 10 K [49]. Weak ferromagnetism in these compounds resulted from the ordering of the moments generated by the pair-wise canted antiferromagnetic interactions between neighboring Co(II) sites along the connected Co–O–Co lattices. One of the well-known examples is Prussian blue series that was able to absorb small molecules such as N2 or methanol after dehydration and found to order ferromagnetically at a critical temperature of 5.5 K [50-53]. A second example was reported by Beauvais and Long [54]. 3-D framework has been constructed from infinite Ni–O–Ni type linkages (bridging H2O and glutarate ligands) in Ni20(C5H6O4)20(H2O)8]·40H2O. Presence of very large intersecting 20-membered ring tunnels that were filled with H2O molecules, behaved like a ferromagnet below 4 K [55]. 3-D structure made up of corrugated Cu–O–Cu and Cu–O–C–O–Cu layers linked through bpe molecules in [Cu4(C3H2O4)4(bpe)3]·6H2O exhibited overall ferromagnetic behavior where 1-D channels filled with H2O were present [56-58]. 3-D frameworks built up from the linkage of carboxylato-bridged Co(II) chains via BTC ligands in K[M3(BTC)3]·5H2O (M = Fe, Co) MIL-45 showed ferromagnetic behavior below 10 K involved with the Co phase while for the mixed-metal Co–Fe phase it also showed ferromagnetism below 20 K. The structure in the above case showed 1-D channels filled with K+ cations and H2O molecules [59]. 3D hybrid compounds having both cobalt and nickel, [Ni3(H2O)4(trans-CTC)2·5H2O] composed of cis-cyclohexane-1,3,5-tricarboxylic acid (H3CTC) exhibited dominant antiferromagnetic interaction until 190 K and ferromagnetic long range ordering at low temperature [60]. A cobalt 1,4-cyclohexane dicarboxylate, [Co5(OH)8(CHDC)·4H2O] had a ferromagnetic ordering temperature at 60 K that was the highest among observed in this class of compounds [61].
B. Antiferromagnetic Materials
Interestingly, reversible conversion between ferromagnetic and antiferromagnetic states is noticed in few reports depending on the presence or absence of water molecule in the compound. Reversible dehydration/rehydration of [CoII
3(OH)2(C4O4)2]·3H2O was found to lead to a reversible interconversion from antiferromagnetic to ferromagnetic ordering at low temperature [62]. The host lattice, which consists of 1D [CoII
3(m3-OH)2]4+ ribbons linked by squarate anions to form a porous 3D network, found to undergo only minimal changes (2% in bond distances and angles) with dehydration, suggesting that significant magnetic exchange
Magnetic Nanoporous Materials 237
coupling might occur through the hydrogen-bonded cavity water molecules in the hydrated phase. Solvatomagnetic effects have recently been reported in this family by Ohkoshi, Hashimoto and co-workers, who showed that the peach-colored, ferromagnetically coupled defect phase in CoII
1.5[CrIII(CN)6]·7.5(H2O) converted to a antiferromagnetically coupled blue colored phase with formula, CoII
1.5[CrIII(CN)6]·2.5(H2O)·2.0(EtOH) on exposure to ethanol. This effect was attributed to a change from six- to (average) four-coordination at the CoII centre [63].
Among nanoporous magnetic materials a large numbers of antiferromagnetic materials have been reviewed nicely by different groups [41-44]. Some of the interesting results are discussed in this section. [Co2(pm)(H2O)4]n·2nH2O exhibited one-dimensional channels and antiferromagnetic interactions with large Curie-Weiss temperature, ~ 220.8 K [64]. Kobayashi and Kurmoo‘s group have recently reported a 3-D nanoporous magnet, [Mn3(HCOO)6]·MeOH·H2O having a diamond framework comprising of bridging ditopic format ligands [65]. A family of complexes formed by cobalt(II) building blocks linked through nicotinate ligands with antiferromagnetic couplings showed robust open-framework structures up to 295 0C [66]. The isonicotinate yielded a robust Cu(II) complex, [Cu(II) (C6H4O2N)2·2H2O]n exhibited a very weak antiferromagnetic interactions (θ ~ 0.93 K) [67]. Previous magnetic measurements on non-porous iron phosphates showed a large diversity of interactions in terms ferromagnetic linkage via Fe–O–P–O–Fe. For instance, weak superexchange interactions between 4.2 and 3.9 K were reported in the KBaFe2(PO4)3 sample [68] while stronger interactions have been observed in NaFeP2O7 [69], Na3Fe2(PO4)3 [70] and orthorhombic FePO4 [71] with Néel temperatures (TN) of 29, 47 and 15 K respectively. In contrast, the octahedral iron centers forming the chains in [Fe(OH)(PO4)]·0.5C2N2H10 were found to be connected to each adjacent iron center through two oxygen atoms in a Fe–O2–Fe–
O2 fashion (one oxygen corresponds to a phosphate group and the other to a hydroxide group) and one phosphate group [72]. Ethylenediphosphonate, MII
2 (H2O)2(O3P(CH2)2PO3) (M = Co and Ni) also revealed antiferromagmetic ordering at TN ≈ 7 K for Co and 13 K for Ni [73]. Terephthalate, Fe2O[O2C–CH3]2[1,4-BDC]·2CH3OH showed an antiferromagnetic ordering at 5 K [74]. Terephthalate, V(OH)[1,4-BDC]·x(1,4-H2BDC) showed quite high value of TN at 95 K [75]. Strong antiferromagnetic interactions (Curie-Weiss temperature, θ = 214.8 K) with a transition temperature below 40 K were also observed in [Fe3F6(HPO4)2(PO4)]·C8N4H26·3H2O whereas [Fe5F4(H2PO4)(HPO4)3(PO4)3]·C4N3H6·C4N3H5 showed strong antiferromagnetic interactions (θ = 218.5 K) without signature of long-range magnetic ordering [76].
C. Ferrimagnetic and Metamagnetic Materials
The uncompensated antiferromagnetic couplings may arise from the particular stoichoimetries and topologies which lead to a spin-canting phenomena that are sensitive to the structural characteristics. Spin-canting associated with the antiferromagnetic interaction is one of the typical features of ferromagnetic materials. For example, the compound, [Co(im)2]0.5py is an antiferromagnet with TN ~ 13.1 K while the compound, [Co5(im)10·0.4MB]5 seems to be a hidden canted antiferromagnet with a magnetic ordering temperature at 10.6 K [77]. Terephthalate, VIV
2O2F2[O2C–C6H4–CO2] exhibited canted antiferromagnetic behavior below 20 K [78]. 2,5-pyridinedicarboxylate, [Co3(NC5H3(CO2)2)(OH)2(H2O)2] also showed canted antiferromagnetic behavior below 30 K
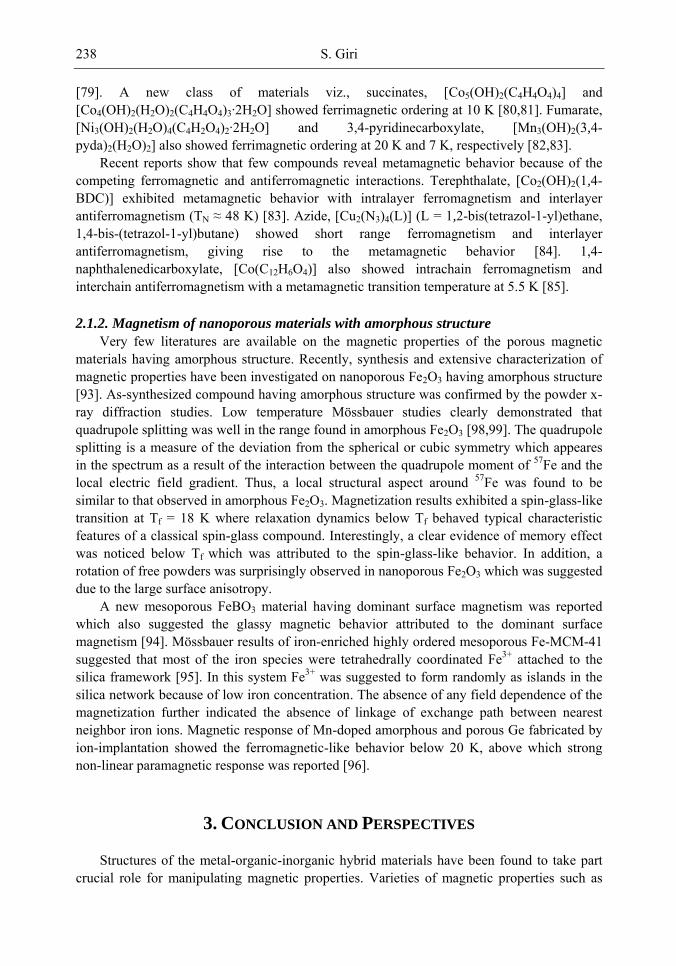
S. Giri 238
[79]. A new class of materials viz., succinates, [Co5(OH)2(C4H4O4)4] and [Co4(OH)2(H2O)2(C4H4O4)3·2H2O] showed ferrimagnetic ordering at 10 K [80,81]. Fumarate, [Ni3(OH)2(H2O)4(C4H2O4)2·2H2O] and 3,4-pyridinecarboxylate, [Mn3(OH)2(3,4-pyda)2(H2O)2] also showed ferrimagnetic ordering at 20 K and 7 K, respectively [82,83].
Recent reports show that few compounds reveal metamagnetic behavior because of the competing ferromagnetic and antiferromagnetic interactions. Terephthalate, [Co2(OH)2(1,4-BDC)] exhibited metamagnetic behavior with intralayer ferromagnetism and interlayer antiferromagnetism (TN ≈ 48 K) [83]. Azide, [Cu2(N3)4(L)] (L = 1,2-bis(tetrazol-1-yl)ethane, 1,4-bis-(tetrazol-1-yl)butane) showed short range ferromagnetism and interlayer antiferromagnetism, giving rise to the metamagnetic behavior [84]. 1,4-naphthalenedicarboxylate, [Co(C12H6O4)] also showed intrachain ferromagnetism and interchain antiferromagnetism with a metamagnetic transition temperature at 5.5 K [85].
2.1.2. Magnetism of nanoporous materials with amorphous structure
Very few literatures are available on the magnetic properties of the porous magnetic materials having amorphous structure. Recently, synthesis and extensive characterization of magnetic properties have been investigated on nanoporous Fe2O3 having amorphous structure [93]. As-synthesized compound having amorphous structure was confirmed by the powder x-ray diffraction studies. Low temperature Mössbauer studies clearly demonstrated that quadrupole splitting was well in the range found in amorphous Fe2O3 [98,99]. The quadrupole splitting is a measure of the deviation from the spherical or cubic symmetry which appeares in the spectrum as a result of the interaction between the quadrupole moment of 57Fe and the local electric field gradient. Thus, a local structural aspect around 57Fe was found to be similar to that observed in amorphous Fe2O3. Magnetization results exhibited a spin-glass-like transition at Tf = 18 K where relaxation dynamics below Tf behaved typical characteristic features of a classical spin-glass compound. Interestingly, a clear evidence of memory effect was noticed below Tf which was attributed to the spin-glass-like behavior. In addition, a rotation of free powders was surprisingly observed in nanoporous Fe2O3 which was suggested due to the large surface anisotropy.
A new mesoporous FeBO3 material having dominant surface magnetism was reported which also suggested the glassy magnetic behavior attributed to the dominant surface magnetism [94]. Mössbauer results of iron-enriched highly ordered mesoporous Fe-MCM-41 suggested that most of the iron species were tetrahedrally coordinated Fe3+ attached to the silica framework [95]. In this system Fe3+ was suggested to form randomly as islands in the silica network because of low iron concentration. The absence of any field dependence of the magnetization further indicated the absence of linkage of exchange path between nearest neighbor iron ions. Magnetic response of Mn-doped amorphous and porous Ge fabricated by ion-implantation showed the ferromagnetic-like behavior below 20 K, above which strong non-linear paramagnetic response was reported [96].
3. CONCLUSION AND PERSPECTIVES
Structures of the metal-organic-inorganic hybrid materials have been found to take part crucial role for manipulating magnetic properties. Varieties of magnetic properties such as
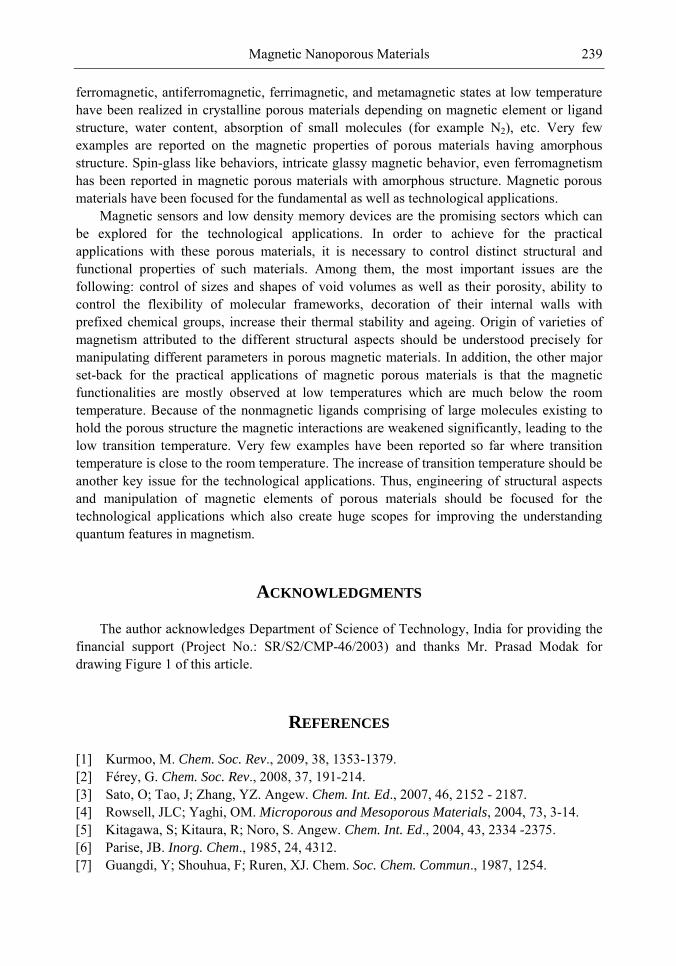
Magnetic Nanoporous Materials 239
ferromagnetic, antiferromagnetic, ferrimagnetic, and metamagnetic states at low temperature have been realized in crystalline porous materials depending on magnetic element or ligand structure, water content, absorption of small molecules (for example N2), etc. Very few examples are reported on the magnetic properties of porous materials having amorphous structure. Spin-glass like behaviors, intricate glassy magnetic behavior, even ferromagnetism has been reported in magnetic porous materials with amorphous structure. Magnetic porous materials have been focused for the fundamental as well as technological applications.
Magnetic sensors and low density memory devices are the promising sectors which can be explored for the technological applications. In order to achieve for the practical applications with these porous materials, it is necessary to control distinct structural and functional properties of such materials. Among them, the most important issues are the following: control of sizes and shapes of void volumes as well as their porosity, ability to control the flexibility of molecular frameworks, decoration of their internal walls with prefixed chemical groups, increase their thermal stability and ageing. Origin of varieties of magnetism attributed to the different structural aspects should be understood precisely for manipulating different parameters in porous magnetic materials. In addition, the other major set-back for the practical applications of magnetic porous materials is that the magnetic functionalities are mostly observed at low temperatures which are much below the room temperature. Because of the nonmagnetic ligands comprising of large molecules existing to hold the porous structure the magnetic interactions are weakened significantly, leading to the low transition temperature. Very few examples have been reported so far where transition temperature is close to the room temperature. The increase of transition temperature should be another key issue for the technological applications. Thus, engineering of structural aspects and manipulation of magnetic elements of porous materials should be focused for the technological applications which also create huge scopes for improving the understanding quantum features in magnetism.
ACKNOWLEDGMENTS
The author acknowledges Department of Science of Technology, India for providing the financial support (Project No.: SR/S2/CMP-46/2003) and thanks Mr. Prasad Modak for drawing Figure 1 of this article.
REFERENCES
[1] Kurmoo, M. Chem. Soc. Rev., 2009, 38, 1353-1379. [2] Férey, G. Chem. Soc. Rev., 2008, 37, 191-214. [3] Sato, O; Tao, J; Zhang, YZ. Angew. Chem. Int. Ed., 2007, 46, 2152 - 2187. [4] Rowsell, JLC; Yaghi, OM. Microporous and Mesoporous Materials, 2004, 73, 3-14. [5] Kitagawa, S; Kitaura, R; Noro, S. Angew. Chem. Int. Ed., 2004, 43, 2334 -2375. [6] Parise, JB. Inorg. Chem., 1985, 24, 4312. [7] Guangdi, Y; Shouhua, F; Ruren, XJ. Chem. Soc. Chem. Commun., 1987, 1254.
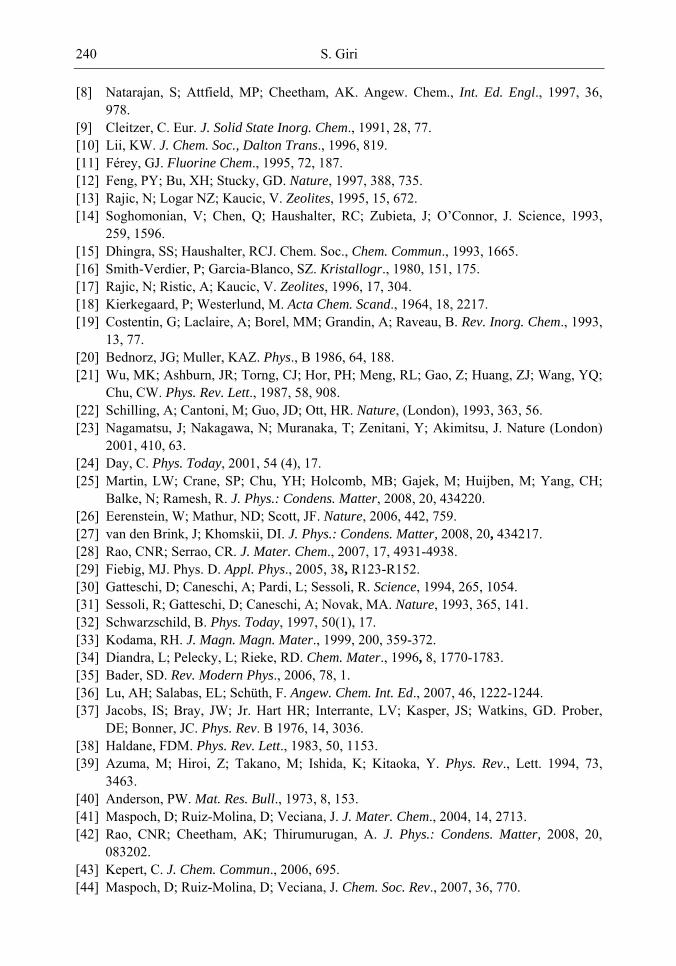
S. Giri 240
[8] Natarajan, S; Attfield, MP; Cheetham, AK. Angew. Chem., Int. Ed. Engl., 1997, 36, 978.
[9] Cleitzer, C. Eur. J. Solid State Inorg. Chem., 1991, 28, 77. [10] Lii, KW. J. Chem. Soc., Dalton Trans., 1996, 819. [11] Férey, GJ. Fluorine Chem., 1995, 72, 187. [12] Feng, PY; Bu, XH; Stucky, GD. Nature, 1997, 388, 735. [13] Rajic, N; Logar NZ; Kaucic, V. Zeolites, 1995, 15, 672. [14] Soghomonian, V; Chen, Q; Haushalter, RC; Zubieta, J; O‘Connor, J. Science, 1993,
259, 1596. [15] Dhingra, SS; Haushalter, RCJ. Chem. Soc., Chem. Commun., 1993, 1665. [16] Smith-Verdier, P; Garcia-Blanco, SZ. Kristallogr., 1980, 151, 175. [17] Rajic, N; Ristic, A; Kaucic, V. Zeolites, 1996, 17, 304. [18] Kierkegaard, P; Westerlund, M. Acta Chem. Scand., 1964, 18, 2217. [19] Costentin, G; Laclaire, A; Borel, MM; Grandin, A; Raveau, B. Rev. Inorg. Chem., 1993,
13, 77. [20] Bednorz, JG; Muller, KAZ. Phys., B 1986, 64, 188. [21] Wu, MK; Ashburn, JR; Torng, CJ; Hor, PH; Meng, RL; Gao, Z; Huang, ZJ; Wang, YQ;
Chu, CW. Phys. Rev. Lett., 1987, 58, 908. [22] Schilling, A; Cantoni, M; Guo, JD; Ott, HR. Nature, (London), 1993, 363, 56. [23] Nagamatsu, J; Nakagawa, N; Muranaka, T; Zenitani, Y; Akimitsu, J. Nature (London)
2001, 410, 63. [24] Day, C. Phys. Today, 2001, 54 (4), 17. [25] Martin, LW; Crane, SP; Chu, YH; Holcomb, MB; Gajek, M; Huijben, M; Yang, CH;
Balke, N; Ramesh, R. J. Phys.: Condens. Matter, 2008, 20, 434220. [26] Eerenstein, W; Mathur, ND; Scott, JF. Nature, 2006, 442, 759. [27] van den Brink, J; Khomskii, DI. J. Phys.: Condens. Matter, 2008, 20, 434217. [28] Rao, CNR; Serrao, CR. J. Mater. Chem., 2007, 17, 4931-4938. [29] Fiebig, MJ. Phys. D. Appl. Phys., 2005, 38, R123-R152. [30] Gatteschi, D; Caneschi, A; Pardi, L; Sessoli, R. Science, 1994, 265, 1054. [31] Sessoli, R; Gatteschi, D; Caneschi, A; Novak, MA. Nature, 1993, 365, 141. [32] Schwarzschild, B. Phys. Today, 1997, 50(1), 17. [33] Kodama, RH. J. Magn. Magn. Mater., 1999, 200, 359-372. [34] Diandra, L; Pelecky, L; Rieke, RD. Chem. Mater., 1996, 8, 1770-1783. [35] Bader, SD. Rev. Modern Phys., 2006, 78, 1. [36] Lu, AH; Salabas, EL; Schüth, F. Angew. Chem. Int. Ed., 2007, 46, 1222-1244. [37] Jacobs, IS; Bray, JW; Jr. Hart HR; Interrante, LV; Kasper, JS; Watkins, GD. Prober,
DE; Bonner, JC. Phys. Rev. B 1976, 14, 3036. [38] Haldane, FDM. Phys. Rev. Lett., 1983, 50, 1153. [39] Azuma, M; Hiroi, Z; Takano, M; Ishida, K; Kitaoka, Y. Phys. Rev., Lett. 1994, 73,
3463. [40] Anderson, PW. Mat. Res. Bull., 1973, 8, 153. [41] Maspoch, D; Ruiz-Molina, D; Veciana, J. J. Mater. Chem., 2004, 14, 2713. [42] Rao, CNR; Cheetham, AK; Thirumurugan, A. J. Phys.: Condens. Matter, 2008, 20,
083202. [43] Kepert, C. J. Chem. Commun., 2006, 695. [44] Maspoch, D; Ruiz-Molina, D; Veciana, J. Chem. Soc. Rev., 2007, 36, 770.
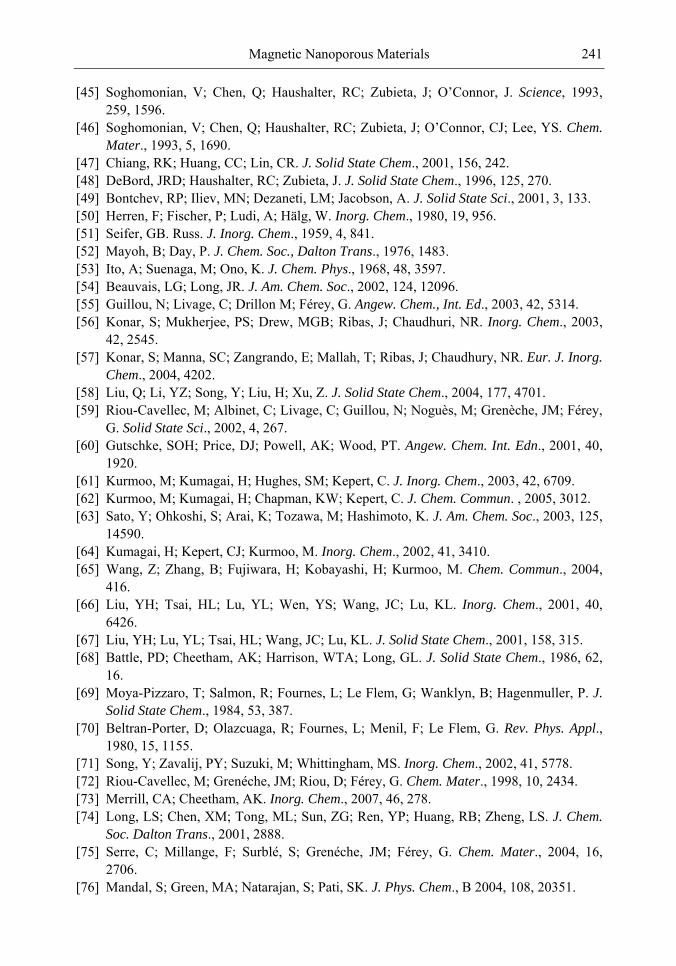
Magnetic Nanoporous Materials 241
[45] Soghomonian, V; Chen, Q; Haushalter, RC; Zubieta, J; O‘Connor, J. Science, 1993, 259, 1596.
[46] Soghomonian, V; Chen, Q; Haushalter, RC; Zubieta, J; O‘Connor, CJ; Lee, YS. Chem.
Mater., 1993, 5, 1690. [47] Chiang, RK; Huang, CC; Lin, CR. J. Solid State Chem., 2001, 156, 242. [48] DeBord, JRD; Haushalter, RC; Zubieta, J. J. Solid State Chem., 1996, 125, 270. [49] Bontchev, RP; Iliev, MN; Dezaneti, LM; Jacobson, A. J. Solid State Sci., 2001, 3, 133. [50] Herren, F; Fischer, P; Ludi, A; Hälg, W. Inorg. Chem., 1980, 19, 956. [51] Seifer, GB. Russ. J. Inorg. Chem., 1959, 4, 841. [52] Mayoh, B; Day, P. J. Chem. Soc., Dalton Trans., 1976, 1483. [53] Ito, A; Suenaga, M; Ono, K. J. Chem. Phys., 1968, 48, 3597. [54] Beauvais, LG; Long, JR. J. Am. Chem. Soc., 2002, 124, 12096. [55] Guillou, N; Livage, C; Drillon M; Férey, G. Angew. Chem., Int. Ed., 2003, 42, 5314. [56] Konar, S; Mukherjee, PS; Drew, MGB; Ribas, J; Chaudhuri, NR. Inorg. Chem., 2003,
42, 2545. [57] Konar, S; Manna, SC; Zangrando, E; Mallah, T; Ribas, J; Chaudhury, NR. Eur. J. Inorg.
Chem., 2004, 4202. [58] Liu, Q; Li, YZ; Song, Y; Liu, H; Xu, Z. J. Solid State Chem., 2004, 177, 4701. [59] Riou-Cavellec, M; Albinet, C; Livage, C; Guillou, N; Noguès, M; Grenèche, JM; Férey,
G. Solid State Sci., 2002, 4, 267. [60] Gutschke, SOH; Price, DJ; Powell, AK; Wood, PT. Angew. Chem. Int. Edn., 2001, 40,
1920. [61] Kurmoo, M; Kumagai, H; Hughes, SM; Kepert, C. J. Inorg. Chem., 2003, 42, 6709. [62] Kurmoo, M; Kumagai, H; Chapman, KW; Kepert, C. J. Chem. Commun. , 2005, 3012. [63] Sato, Y; Ohkoshi, S; Arai, K; Tozawa, M; Hashimoto, K. J. Am. Chem. Soc., 2003, 125,
14590. [64] Kumagai, H; Kepert, CJ; Kurmoo, M. Inorg. Chem., 2002, 41, 3410. [65] Wang, Z; Zhang, B; Fujiwara, H; Kobayashi, H; Kurmoo, M. Chem. Commun., 2004,
416. [66] Liu, YH; Tsai, HL; Lu, YL; Wen, YS; Wang, JC; Lu, KL. Inorg. Chem., 2001, 40,
6426. [67] Liu, YH; Lu, YL; Tsai, HL; Wang, JC; Lu, KL. J. Solid State Chem., 2001, 158, 315. [68] Battle, PD; Cheetham, AK; Harrison, WTA; Long, GL. J. Solid State Chem., 1986, 62,
16. [69] Moya-Pizzaro, T; Salmon, R; Fournes, L; Le Flem, G; Wanklyn, B; Hagenmuller, P. J.
Solid State Chem., 1984, 53, 387. [70] Beltran-Porter, D; Olazcuaga, R; Fournes, L; Menil, F; Le Flem, G. Rev. Phys. Appl.,
1980, 15, 1155. [71] Song, Y; Zavalij, PY; Suzuki, M; Whittingham, MS. Inorg. Chem., 2002, 41, 5778. [72] Riou-Cavellec, M; Grenéche, JM; Riou, D; Férey, G. Chem. Mater., 1998, 10, 2434. [73] Merrill, CA; Cheetham, AK. Inorg. Chem., 2007, 46, 278. [74] Long, LS; Chen, XM; Tong, ML; Sun, ZG; Ren, YP; Huang, RB; Zheng, LS. J. Chem.
Soc. Dalton Trans., 2001, 2888. [75] Serre, C; Millange, F; Surblé, S; Grenéche, JM; Férey, G. Chem. Mater., 2004, 16,
2706. [76] Mandal, S; Green, MA; Natarajan, S; Pati, SK. J. Phys. Chem., B 2004, 108, 20351.
S. Giri 242
[77] Tian, YQ; Cai, CX; Ren, XM; Duan, CY; Xu, Y; Gao, S; You, XZ. Chem. Eur. J., 2003, 9, 5673.
[78] Barthelet, K; Adil, K; Millange, F; Serre, C; Riou, D; Férey, G. J. Mater. Chem., 2003, 13, 2208.
[79] Humphrey, SM; Wood, PT. J. Am. Chem. Soc., 2004, 126, 13236. [80] Livage, C; Egger, C; Noguès, M; Férey, G. J. Mater. Chem., 1998, 8, 2743. [81] Livage, C; Egger, C; Férey, G. Chem. Mater., 1999, 11, 1546. [82] Tong, ML; Wang, J; Hu, S. J. Solid State Chem., 2005, 178, 1518. [83] Huang, ZL; Drillon, M; Masciocchi, N; Sironi, A; Zhao, JT; Rabu, P; Panissod, P.
Chem. Mater., 2000, 12, 2805. [84] Liu, PP; Cheng, AL; Liu, N; Sun, WW; Gao, EQ. Chem. Mater., 2007, 19, 2724. [85] Maji, TK; Kaneko, W; Ohba, M; Kitagawa, S. Chem. Commun., 2005, 4613. [86] Anderson, P. W Phys. Rev., 1956, 102, 1008. [87] Ramirez, AP; Hayashi, A; Cava, RJ; Siddharthan, R; Shastry, BS. Nature (London)
1999, 399, 333. [88] Hur, N; Park, S; Sharma, PA; Ahn, JS; Guha, S; Cheong, SW. Nature (London) 2004,
429, 392. [89] Giri, S; Nakamura, H; Kohara, T. Phys. Rev., B 2005, 72, 132404. [90] Kresge, CT; Leonowicz, ME; Roth, WJ; Vartuli, JC; Beck, JS. Nature, 1992, 359, 710. [91] Holland, BT; Blanford, CF; Do, T; Andreas, S. Chem. Mater., 1999, 11 (3), 795-805. [92] Beck, JS; Vart Uli, JC; Roth, WJ; Leonowicz, ME; Kresge, CT; Schmitt, KD; Chu,
CTW; Olson, DH; Sheppard, EW; McCullen, SB., Higgins, JB; Schlenkert, JL. J. Am.
Chem. Sot., 1992, 114, 10834-10843. [93] Thakur, M; Majumdar, S; Giri, S; Bhaumik, A; Nandi, M; Nakamura, H; Kobayashi, H;
Kohara, T. J. Phys.: Condens. Matter, 2008, 20, 295228. [94] Das, SK; Nandi, M; Giri, S; Bhaumik, A. Microporous and Mesoporous Materials,
2009, 117, 362-367. [95] Samanta, S; Giri, S; Sastry, PU; Mal, NK; Manna, A; Bhaumik, A. Ind. Eng. Chem.
Res., 2003, 42, 3012-3018. [96] Passacantando, M; Ottaviano, L; Grossi, V; Verna, A; D‘Orazio, F; Lucari, F;
Impellizzeri, G; Priolo, F. Nuclear Instruments and Methods in Physics Research B, 2007, 257, 365-368.
[97] Goodenough, JB. Magnetism and the Chemical Bond; Interscience: New York, 1963, 180.
[98] Murad, E; Schwertmann, U. Am. Mineral., 1980, 65, 1044. [99] van Diepen, AM; Th Popma, JA. Solid State Commun., 1978, 27, 121.
In: Nanoporous Materials Types, Properties and Uses ISBN: 978-1-61668-182-1 Editor: Samuel B. Jenkins, pp. 243-259 © 2010 Nova Science Publishers, Inc.
Chapter 8
SURFACE AND MECHANICAL CHARACTERISTICS OF
MESOPOROUS ANODIC ALUMINUM OXIDES
Tong Hong Wang1, Te-Hua Fang
2* and Shao-Hui Kang
2
1 Stress-Thermal Laboratory, Advanced Semiconductor Engineering Inc, Kaohsiung 811, Taiwan
2 Department of Mechanical Engineering,National Kaohsiung University of Applied Sciences, Kaohsiung 817, Taiwan
ABSTRACT
Surface and mechanical properties of porous anodic aluminum oxides (AAO) were achieved by means of scanning electron microscope (SEM), atomic force microscope (AFM), indentation tests and finite elements method (FEM) simulations. A two-step anodized mesoporous anodic aluminum oxide was successfully fabricated vertically and hollowly. Both microindentation and nanoindentation were carried out. The results showed that the nanoporous AAO was hydrophobic with a contact angle of 105° while the nanoporous-filled AAO is in a relatively good wettability. Localized pop-in can be found during nanoindentation due to the collapse of the beneath cylindrical structures. Over a certain load, microindentation may induce radial cracks from the indented edge to outward of the AAO. The underside of the indented AAO sample was milled to figure out the structural changes. The effects of the nanoporous filling on the Young's modulus and the hardness are investigated and discussed. A three-dimensional finite element model was also successfully developed to understand the nanoindentation-induced mechanism. A maximum von Mises stress of 1.058 GPa occurred beneath the indenter.
Keywords: Indentation; Atomic force microscope; Anodic aluminum oxide (AAO); Anodization; Mesoporous.
* Corresponding author: Email:[email protected]; Tel:+886-7-3814526-5336 ; Fax:+886-7- 3831373
Tong Hong Wang,Te-Hua Fang and Shao-Hui Kang 244
1. INTRODUCTION
Utilizing electrochemical deposition, aluminum can be anodized in an acid solution to synthesize anodic aluminum oxides (AAOs), which enable the fabrication of a regularly ordered nanoporous structure [1]. This is useful not only for its filter function [2] and as a template for one-dimensional nanomaterials [3, 4], but also excellent for unique electrical, optical and magnetic characteristics [5, 6]. This material can be applied in the field of catalysis, chemical/biosensors, templates for self-assembly, filters, nanofluidic transistors and humidity sensors [7-9].
The nanopores with size scales from 5 nm to 10 m are strongly dependent on the voltage used for anodization. There are many membranes capable of achieving this nanoarchitecture. However, with regard to ease of fabrication with a wide variety of pore size, chemically and thermally stable and inert, nanoporous alumina (Al2O3) is the most appropriate candidate [10]. It has been shown that the modulus and hardness of nanoporous alumina varies with the pore size [11], and thus the pore size must be reduced if the strength of the material is a concern. However, this limits the use of relatively broad size pores, indicating that application breadth is restricted. Additionally, the pores have complicated geometries, and it is difficult to compare the actual wetting behavior with simple theoretical predictions.
Although the applications of AAO rely on its porous structure, processing, assemblage, thermal expansion/shrinkage and exercising inevitably apply stress on it. Therefore, understanding the mechanical behavior is important to ensuring reliability and the usable range. Among the measurement techniques, indentation is considered to be the most reliable tool to characterize the mechanical response because it provides direct and conveniently obtainable information.
In this paper, we report on an enhanced nanoporous anodic aluminum oxide (AAO) filled with Polydimethylsiloxane (PDMS), and compare the mechanical behavior of the nanoporous and nanoporous-filled AAO using experimental nanoindentation by Berkovich indenter. The surface, morphology and structure of the AAO samples were examined with a scanning electron microscope (SEM), transmission electron microscope (TEM) and atomic force microscope (AFM). Furthermore, three-dimensional finite element analyses (FEA) were conduced to explore the indentation response and mechanical properties of the AAO materials.
2. EXPERIMENTAL DETAILS
Four important factors of the anodization process affect the appearance of AAO: anodic voltage and duration, electrolytic composition and temperature. These factors dominate the growth rate of pores, the pitch between pores and their ordering. The density and diameter of the nanopores can be readily controlled by varying of anodization voltage with a specific electrolyte: phosphoric acid (H3PO4), sulfuric acid (H2SO4) or oxalic acid (H2C2O4), [12-14]. Nanoporous AAO was prepared electrochemically using a two-step anodization technique to achieve oxide films with a regularly ordered porous structure. The first anodization was carried out until the residual Al film thickness approached to desired level, the oxides were
Surface and Mechanical Characteristics of Mesoporous Anodic Aluminum Oxides 245
then stripped away and subsequently the second anodization was performed until the remaining Al was completely anodized. A Ti sheet was used as a cathode for the anodization of the Al samples under a constant voltage. The first anodization was performed using a 0.4 M oxalic acid solution at 20°C and 50 V for 4 hours, and then the oxides were removed by immersing the samples in a mixture of 2 wt.% chromic acid and 6 wt.% phosphoric acid at a temperature of 60°C. The desired thickness of the AAO films was obtained by subsequent second anodization. After the second anodization, the AAO could be widened by increasing the anodization time and the concentration of the acid solution.
For the pore widening process, the solution used is 0.1 M phosphoric acid solution at a temperature of 30°C for about 1 hour. The resulting thickness of the AAO was about 50 m. The cylindrical open pores penetrate the entire thickness of the samples. The hole-diameter of each pore is approximately 100 nm and the pitch between one neighboring pores is 250 nm. The porosity of the samples was about 60 %. The filled AAO sample was fabricated by filling the recessed areas of the AAO via capillary forces. The PDMS was formed by curing Sylgard 184 siloxane prepolymer in a plastic Petri dish, pouring it into the AAO samples and then subsequently curing it at a temperature of 80°C for 2 hours.
Microstructure and surface properties of the AAO samples were measured by using a scanning electron microscope (SEM, Hitachi S-3000N). The SEM was operated between 10 and 15 kV on samples containing an ultra thin layer of Pt coating. A nanoindentation device (Hysitron Triboscope) was used to measure the nanomechanical properties in the experiment. Three peak loads: 1, 3 and 5 mN were used for both nanoporous and nanoporous-filled AAO. In order to understand how the interfacial properties affect the introduction of water molecules on the AAO, the sessile drop method and the optical contact angle were used to estimate the wetting properties of a localized region on a solid surface. De-ionized (DI) water droplets with a total volume of 5 L were made for the subsequent contact measurement.
Both micrometer- and nanometer-scale indentation systems, equip Berkovich and Vickers indenters, respectively, were used in this study. These indenters are commonly used following the ISO 12577 standard, and their hardness can be estimated with,
)(
max
hA
PH
real
(1)
where Pmax is the maximum indentation load and Areal the real contact area. Depending on the specific geometries of the Vickers and Berkovich indenters, their hardness can be further formulated and simplified as 1.854P/d2 and 0.041P/h2, respectively, where d is the average indent length of the diagonal left by the indenter and h the indent depth. To further characterize the mechanical enhancements, we examined the hardness and Young‘s modulus of the AAO.
The Young‘s modulus, E, of the test material can be obtained with the following equation [15],
12
*
2 ]11
)[1(
i
i
EEE
(2)
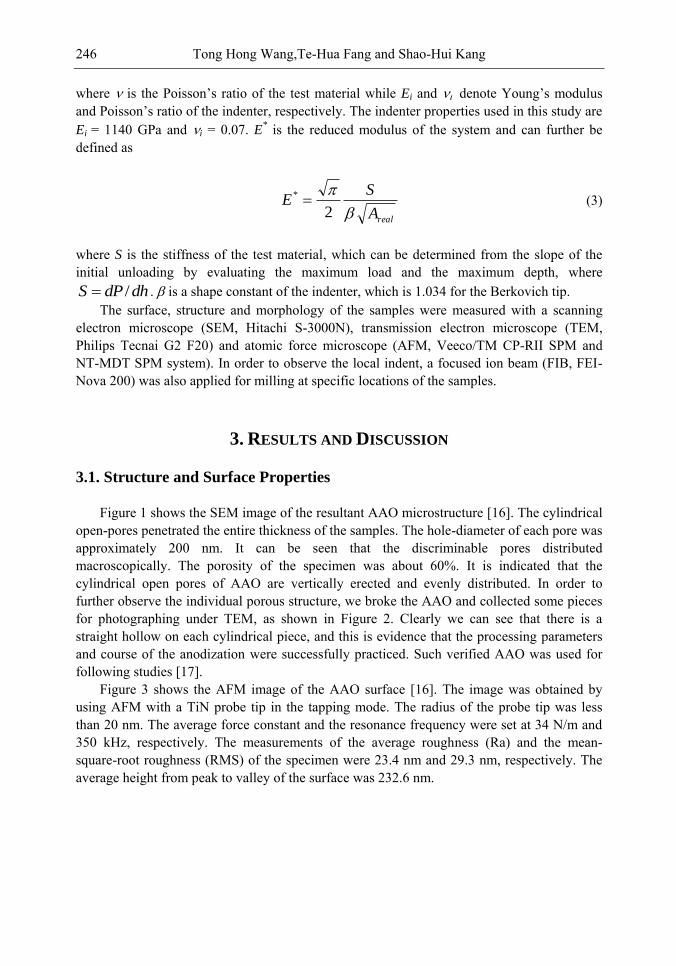
Tong Hong Wang,Te-Hua Fang and Shao-Hui Kang 246
where is the Poisson‘s ratio of the test material while Ei and denote Young‘s modulus and Poisson‘s ratio of the indenter, respectively. The indenter properties used in this study are Ei = 1140 GPa and i = 0.07. E
* is the reduced modulus of the system and can further be defined as
realA
SE
2
* (3)
where S is the stiffness of the test material, which can be determined from the slope of the initial unloading by evaluating the maximum load and the maximum depth, where
dhdPS / . is a shape constant of the indenter, which is 1.034 for the Berkovich tip. The surface, structure and morphology of the samples were measured with a scanning
electron microscope (SEM, Hitachi S-3000N), transmission electron microscope (TEM, Philips Tecnai G2 F20) and atomic force microscope (AFM, Veeco/TM CP-RII SPM and NT-MDT SPM system). In order to observe the local indent, a focused ion beam (FIB, FEI-Nova 200) was also applied for milling at specific locations of the samples.
3. RESULTS AND DISCUSSION
3.1. Structure and Surface Properties
Figure 1 shows the SEM image of the resultant AAO microstructure [16]. The cylindrical open-pores penetrated the entire thickness of the samples. The hole-diameter of each pore was approximately 200 nm. It can be seen that the discriminable pores distributed macroscopically. The porosity of the specimen was about 60%. It is indicated that the cylindrical open pores of AAO are vertically erected and evenly distributed. In order to further observe the individual porous structure, we broke the AAO and collected some pieces for photographing under TEM, as shown in Figure 2. Clearly we can see that there is a straight hollow on each cylindrical piece, and this is evidence that the processing parameters and course of the anodization were successfully practiced. Such verified AAO was used for following studies [17].
Figure 3 shows the AFM image of the AAO surface [16]. The image was obtained by using AFM with a TiN probe tip in the tapping mode. The radius of the probe tip was less than 20 nm. The average force constant and the resonance frequency were set at 34 N/m and 350 kHz, respectively. The measurements of the average roughness (Ra) and the mean-square-root roughness (RMS) of the specimen were 23.4 nm and 29.3 nm, respectively. The average height from peak to valley of the surface was 232.6 nm.
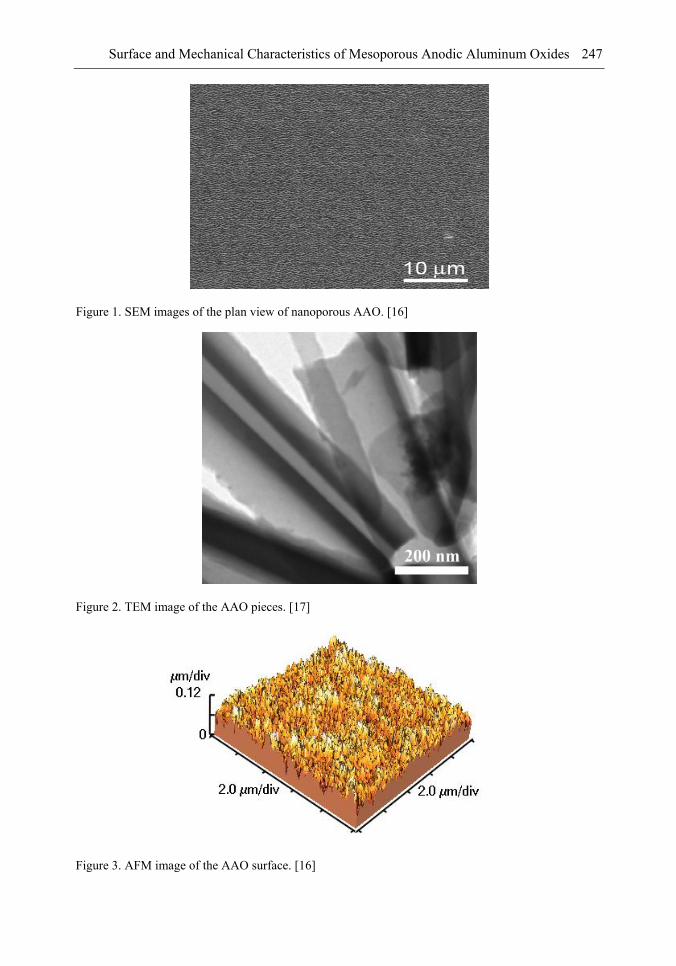
Surface and Mechanical Characteristics of Mesoporous Anodic Aluminum Oxides 247
Figure 1. SEM images of the plan view of nanoporous AAO. [16]
Figure 2. TEM image of the AAO pieces. [17]
Figure 3. AFM image of the AAO surface. [16]
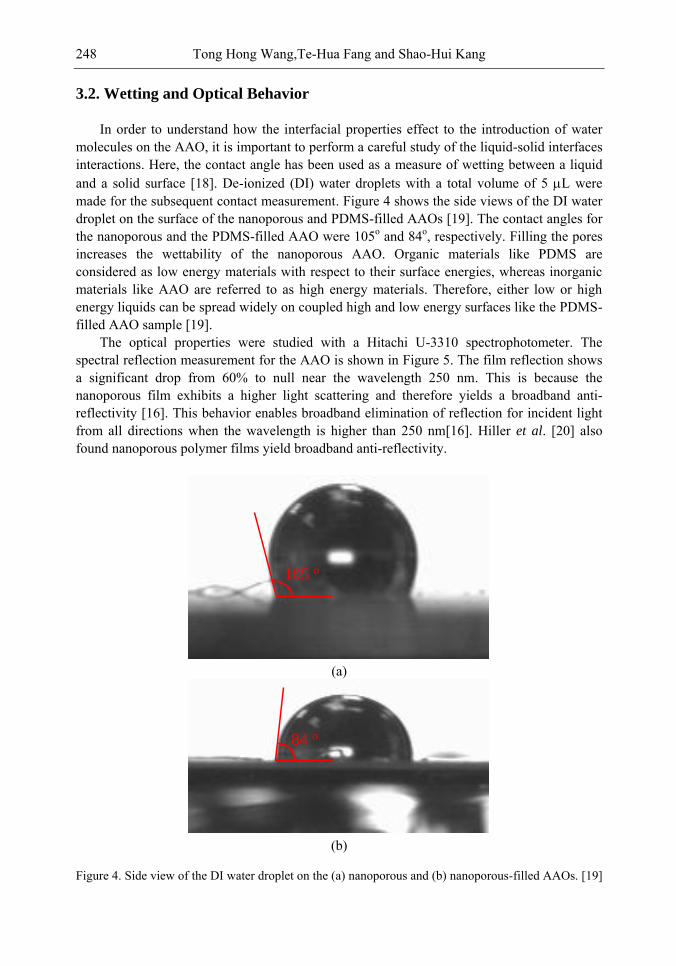
Tong Hong Wang,Te-Hua Fang and Shao-Hui Kang 248
3.2. Wetting and Optical Behavior
In order to understand how the interfacial properties effect to the introduction of water molecules on the AAO, it is important to perform a careful study of the liquid-solid interfaces interactions. Here, the contact angle has been used as a measure of wetting between a liquid and a solid surface [18]. De-ionized (DI) water droplets with a total volume of 5 L were made for the subsequent contact measurement. Figure 4 shows the side views of the DI water droplet on the surface of the nanoporous and PDMS-filled AAOs [19]. The contact angles for the nanoporous and the PDMS-filled AAO were 105o and 84o, respectively. Filling the pores increases the wettability of the nanoporous AAO. Organic materials like PDMS are considered as low energy materials with respect to their surface energies, whereas inorganic materials like AAO are referred to as high energy materials. Therefore, either low or high energy liquids can be spread widely on coupled high and low energy surfaces like the PDMS-filled AAO sample [19].
The optical properties were studied with a Hitachi U-3310 spectrophotometer. The spectral reflection measurement for the AAO is shown in Figure 5. The film reflection shows a significant drop from 60% to null near the wavelength 250 nm. This is because the nanoporous film exhibits a higher light scattering and therefore yields a broadband anti-reflectivity [16]. This behavior enables broadband elimination of reflection for incident light from all directions when the wavelength is higher than 250 nm[16]. Hiller et al. [20] also found nanoporous polymer films yield broadband anti-reflectivity.
105 o
(a)
84 o
(b)
Figure 4. Side view of the DI water droplet on the (a) nanoporous and (b) nanoporous-filled AAOs. [19]
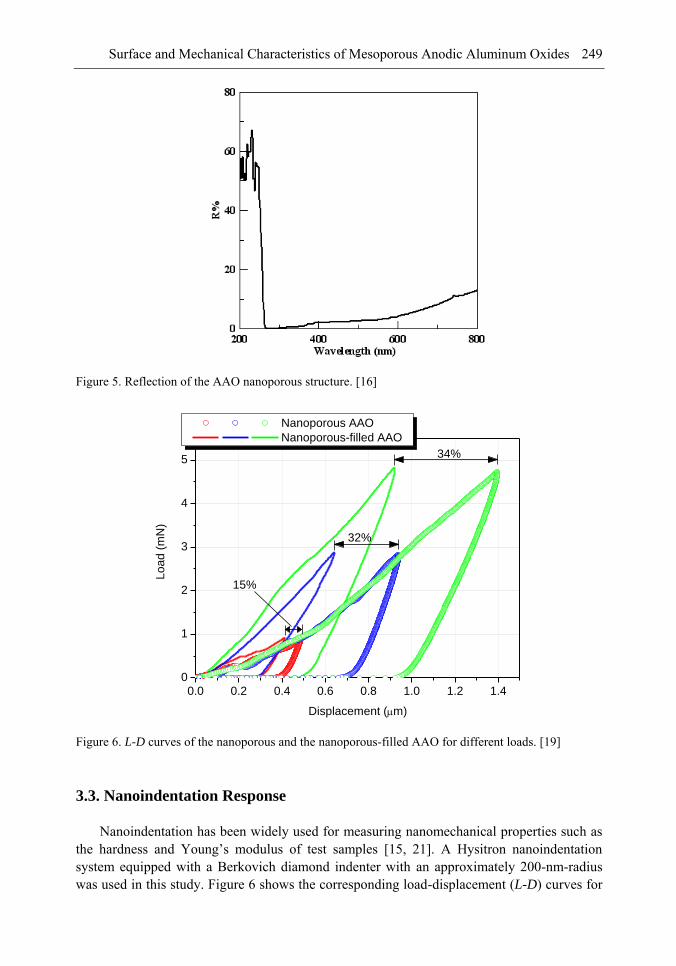
Surface and Mechanical Characteristics of Mesoporous Anodic Aluminum Oxides 249
Figure 5. Reflection of the AAO nanoporous structure. [16]
0.0 0.2 0.4 0.6 0.8 1.0 1.2 1.4
0
1
2
3
4
5
Nanoporous AAO
Nanoporous-filled AAO
Lo
ad
(m
N)
Displacement (m)
34%
32%
15%
Figure 6. L-D curves of the nanoporous and the nanoporous-filled AAO for different loads. [19]
3.3. Nanoindentation Response
Nanoindentation has been widely used for measuring nanomechanical properties such as the hardness and Young‘s modulus of test samples [15, 21]. A Hysitron nanoindentation system equipped with a Berkovich diamond indenter with an approximately 200-nm-radius was used in this study. Figure 6 shows the corresponding load-displacement (L-D) curves for
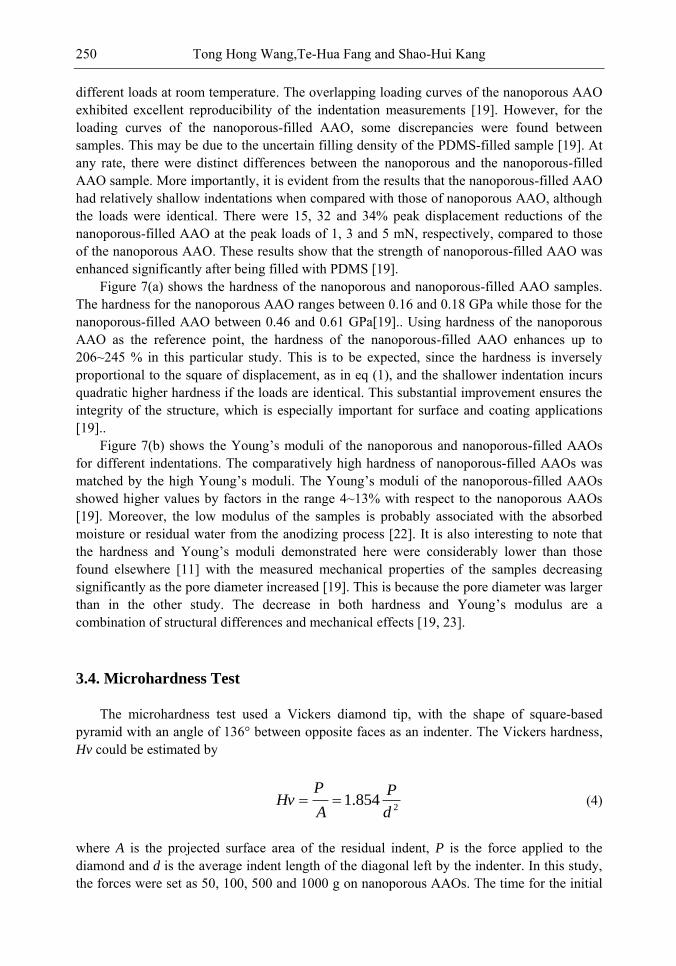
Tong Hong Wang,Te-Hua Fang and Shao-Hui Kang 250
different loads at room temperature. The overlapping loading curves of the nanoporous AAO exhibited excellent reproducibility of the indentation measurements [19]. However, for the loading curves of the nanoporous-filled AAO, some discrepancies were found between samples. This may be due to the uncertain filling density of the PDMS-filled sample [19]. At any rate, there were distinct differences between the nanoporous and the nanoporous-filled AAO sample. More importantly, it is evident from the results that the nanoporous-filled AAO had relatively shallow indentations when compared with those of nanoporous AAO, although the loads were identical. There were 15, 32 and 34% peak displacement reductions of the nanoporous-filled AAO at the peak loads of 1, 3 and 5 mN, respectively, compared to those of the nanoporous AAO. These results show that the strength of nanoporous-filled AAO was enhanced significantly after being filled with PDMS [19].
Figure 7(a) shows the hardness of the nanoporous and nanoporous-filled AAO samples. The hardness for the nanoporous AAO ranges between 0.16 and 0.18 GPa while those for the nanoporous-filled AAO between 0.46 and 0.61 GPa[19].. Using hardness of the nanoporous AAO as the reference point, the hardness of the nanoporous-filled AAO enhances up to 206~245 % in this particular study. This is to be expected, since the hardness is inversely proportional to the square of displacement, as in eq (1), and the shallower indentation incurs quadratic higher hardness if the loads are identical. This substantial improvement ensures the integrity of the structure, which is especially important for surface and coating applications [19]..
Figure 7(b) shows the Young‘s moduli of the nanoporous and nanoporous-filled AAOs for different indentations. The comparatively high hardness of nanoporous-filled AAOs was matched by the high Young‘s moduli. The Young‘s moduli of the nanoporous-filled AAOs showed higher values by factors in the range 4~13% with respect to the nanoporous AAOs [19]. Moreover, the low modulus of the samples is probably associated with the absorbed moisture or residual water from the anodizing process [22]. It is also interesting to note that the hardness and Young‘s moduli demonstrated here were considerably lower than those found elsewhere [11] with the measured mechanical properties of the samples decreasing significantly as the pore diameter increased [19]. This is because the pore diameter was larger than in the other study. The decrease in both hardness and Young‘s modulus are a combination of structural differences and mechanical effects [19, 23].
3.4. Microhardness Test
The microhardness test used a Vickers diamond tip, with the shape of square-based pyramid with an angle of 136° between opposite faces as an indenter. The Vickers hardness, Hv could be estimated by
2
854.1d
P
A
PHv (4)
where A is the projected surface area of the residual indent, P is the force applied to the diamond and d is the average indent length of the diagonal left by the indenter. In this study, the forces were set as 50, 100, 500 and 1000 g on nanoporous AAOs. The time for the initial
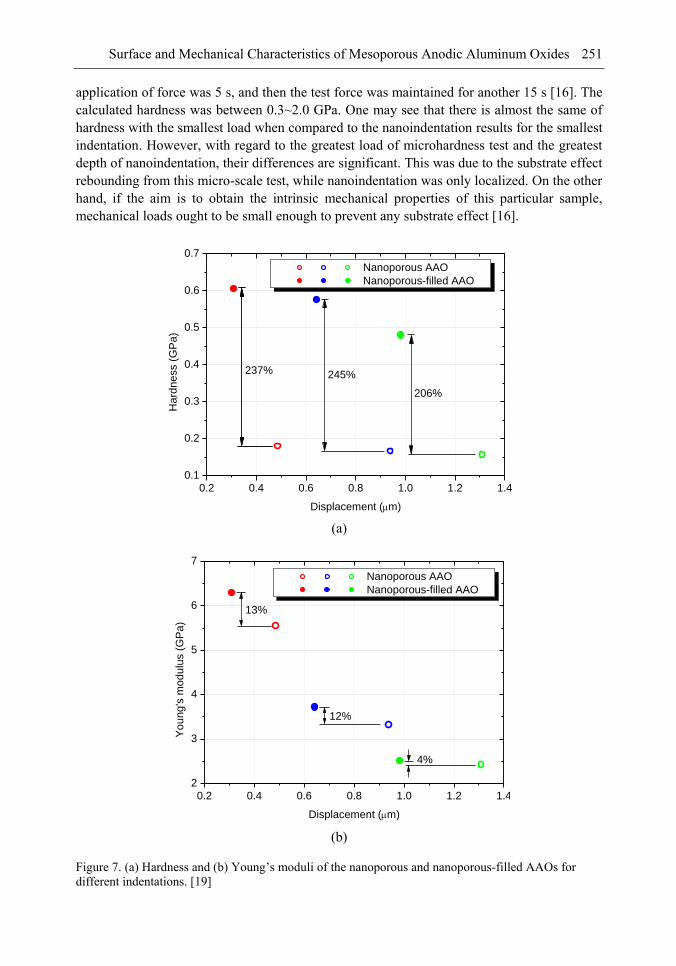
Surface and Mechanical Characteristics of Mesoporous Anodic Aluminum Oxides 251
application of force was 5 s, and then the test force was maintained for another 15 s [16]. The calculated hardness was between 0.3~2.0 GPa. One may see that there is almost the same of hardness with the smallest load when compared to the nanoindentation results for the smallest indentation. However, with regard to the greatest load of microhardness test and the greatest depth of nanoindentation, their differences are significant. This was due to the substrate effect rebounding from this micro-scale test, while nanoindentation was only localized. On the other hand, if the aim is to obtain the intrinsic mechanical properties of this particular sample, mechanical loads ought to be small enough to prevent any substrate effect [16].
0.2 0.4 0.6 0.8 1.0 1.2 1.4
0.1
0.2
0.3
0.4
0.5
0.6
0.7
206%
245%
Nanoporous AAO
Nanoporous-filled AAO
Ha
rdn
ess (
GP
a)
Displacement (m)
237%
(a)
0.2 0.4 0.6 0.8 1.0 1.2 1.4
2
3
4
5
6
7
Nanoporous AAO
Nanoporous-filled AAO
Yo
un
g's
mo
du
lus (
GP
a)
Displacement (m)
13%
12%
4%
(b)
Figure 7. (a) Hardness and (b) Young‘s moduli of the nanoporous and nanoporous-filled AAOs for different indentations. [19]
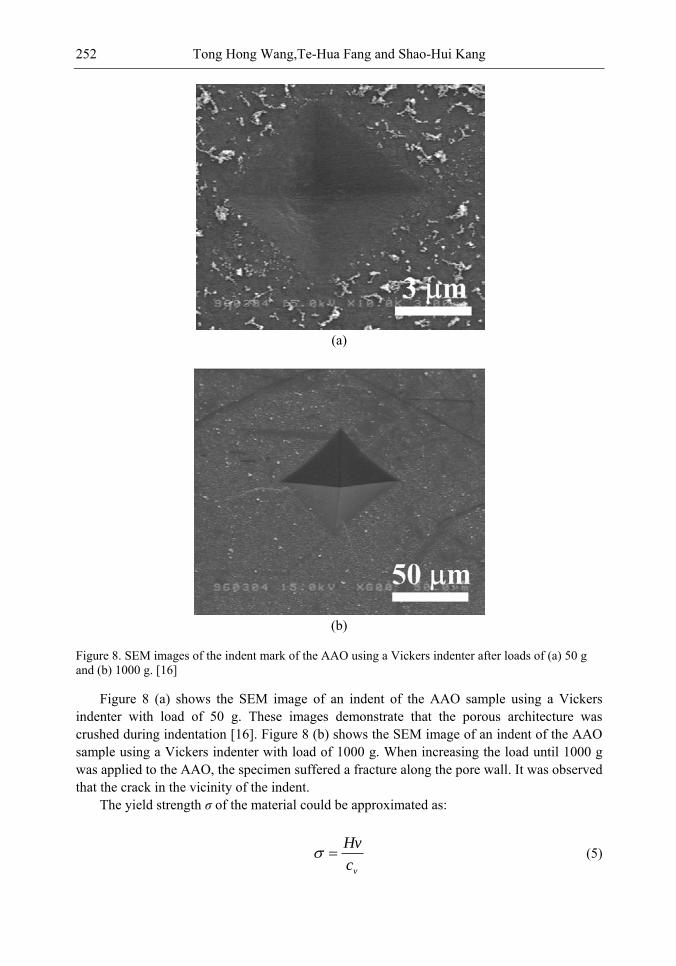
Tong Hong Wang,Te-Hua Fang and Shao-Hui Kang 252
(a)
(b)
Figure 8. SEM images of the indent mark of the AAO using a Vickers indenter after loads of (a) 50 g and (b) 1000 g. [16]
Figure 8 (a) shows the SEM image of an indent of the AAO sample using a Vickers indenter with load of 50 g. These images demonstrate that the porous architecture was crushed during indentation [16]. Figure 8 (b) shows the SEM image of an indent of the AAO sample using a Vickers indenter with load of 1000 g. When increasing the load until 1000 g was applied to the AAO, the specimen suffered a fracture along the pore wall. It was observed that the crack in the vicinity of the indent.
The yield strength σ of the material could be approximated as:
vc
Hv (5)
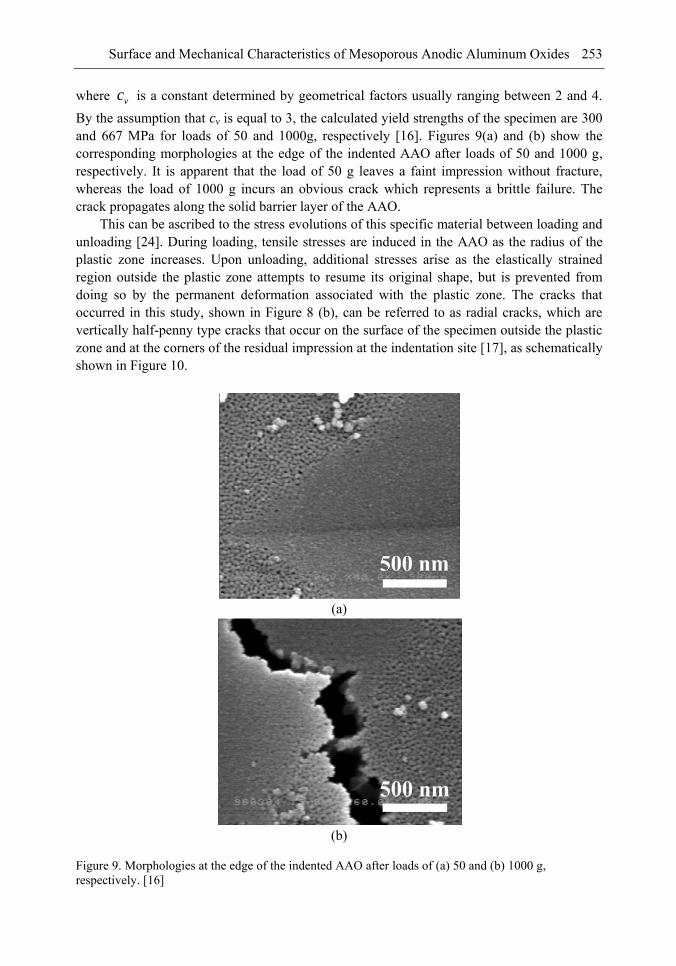
Surface and Mechanical Characteristics of Mesoporous Anodic Aluminum Oxides 253
where vc is a constant determined by geometrical factors usually ranging between 2 and 4. By the assumption that cv is equal to 3, the calculated yield strengths of the specimen are 300 and 667 MPa for loads of 50 and 1000g, respectively [16]. Figures 9(a) and (b) show the corresponding morphologies at the edge of the indented AAO after loads of 50 and 1000 g, respectively. It is apparent that the load of 50 g leaves a faint impression without fracture, whereas the load of 1000 g incurs an obvious crack which represents a brittle failure. The crack propagates along the solid barrier layer of the AAO.
This can be ascribed to the stress evolutions of this specific material between loading and unloading [24]. During loading, tensile stresses are induced in the AAO as the radius of the plastic zone increases. Upon unloading, additional stresses arise as the elastically strained region outside the plastic zone attempts to resume its original shape, but is prevented from doing so by the permanent deformation associated with the plastic zone. The cracks that occurred in this study, shown in Figure 8 (b), can be referred to as radial cracks, which are vertically half-penny type cracks that occur on the surface of the specimen outside the plastic zone and at the corners of the residual impression at the indentation site [17], as schematically shown in Figure 10.
(a)
(b)
Figure 9. Morphologies at the edge of the indented AAO after loads of (a) 50 and (b) 1000 g, respectively. [16]
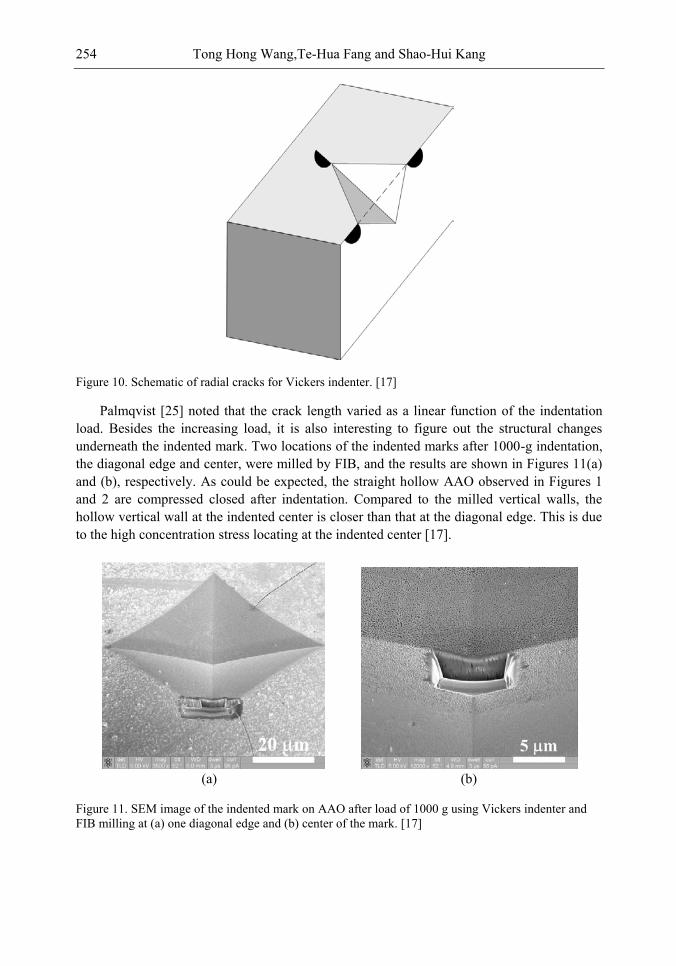
Tong Hong Wang,Te-Hua Fang and Shao-Hui Kang 254
Figure 10. Schematic of radial cracks for Vickers indenter. [17]
Palmqvist [25] noted that the crack length varied as a linear function of the indentation load. Besides the increasing load, it is also interesting to figure out the structural changes underneath the indented mark. Two locations of the indented marks after 1000-g indentation, the diagonal edge and center, were milled by FIB, and the results are shown in Figures 11(a) and (b), respectively. As could be expected, the straight hollow AAO observed in Figures 1 and 2 are compressed closed after indentation. Compared to the milled vertical walls, the hollow vertical wall at the indented center is closer than that at the diagonal edge. This is due to the high concentration stress locating at the indented center [17].
(a) (b)
Figure 11. SEM image of the indented mark on AAO after load of 1000 g using Vickers indenter and FIB milling at (a) one diagonal edge and (b) center of the mark. [17]
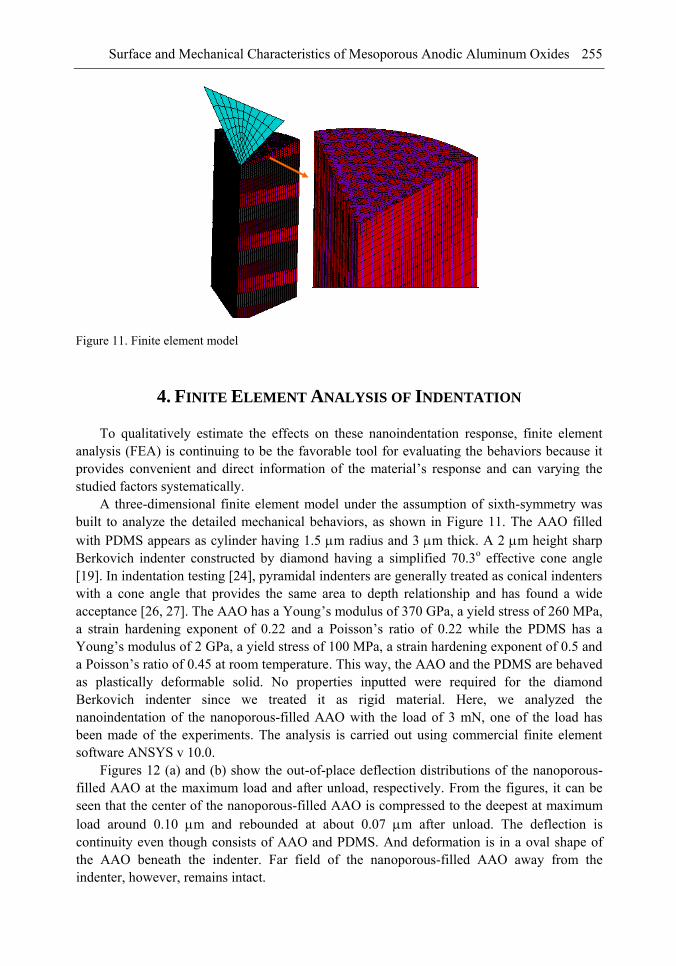
Surface and Mechanical Characteristics of Mesoporous Anodic Aluminum Oxides 255
Figure 11. Finite element model
4. FINITE ELEMENT ANALYSIS OF INDENTATION
To qualitatively estimate the effects on these nanoindentation response, finite element analysis (FEA) is continuing to be the favorable tool for evaluating the behaviors because it provides convenient and direct information of the material‘s response and can varying the studied factors systematically.
A three-dimensional finite element model under the assumption of sixth-symmetry was built to analyze the detailed mechanical behaviors, as shown in Figure 11. The AAO filled with PDMS appears as cylinder having 1.5 m radius and 3 m thick. A 2 m height sharp Berkovich indenter constructed by diamond having a simplified 70.3o effective cone angle [19]. In indentation testing [24], pyramidal indenters are generally treated as conical indenters with a cone angle that provides the same area to depth relationship and has found a wide acceptance [26, 27]. The AAO has a Young‘s modulus of 370 GPa, a yield stress of 260 MPa, a strain hardening exponent of 0.22 and a Poisson‘s ratio of 0.22 while the PDMS has a Young‘s modulus of 2 GPa, a yield stress of 100 MPa, a strain hardening exponent of 0.5 and a Poisson‘s ratio of 0.45 at room temperature. This way, the AAO and the PDMS are behaved as plastically deformable solid. No properties inputted were required for the diamond Berkovich indenter since we treated it as rigid material. Here, we analyzed the nanoindentation of the nanoporous-filled AAO with the load of 3 mN, one of the load has been made of the experiments. The analysis is carried out using commercial finite element software ANSYS v 10.0.
Figures 12 (a) and (b) show the out-of-place deflection distributions of the nanoporous-filled AAO at the maximum load and after unload, respectively. From the figures, it can be seen that the center of the nanoporous-filled AAO is compressed to the deepest at maximum load around 0.10 m and rebounded at about 0.07 m after unload. The deflection is continuity even though consists of AAO and PDMS. And deformation is in a oval shape of the AAO beneath the indenter. Far field of the nanoporous-filled AAO away from the indenter, however, remains intact.
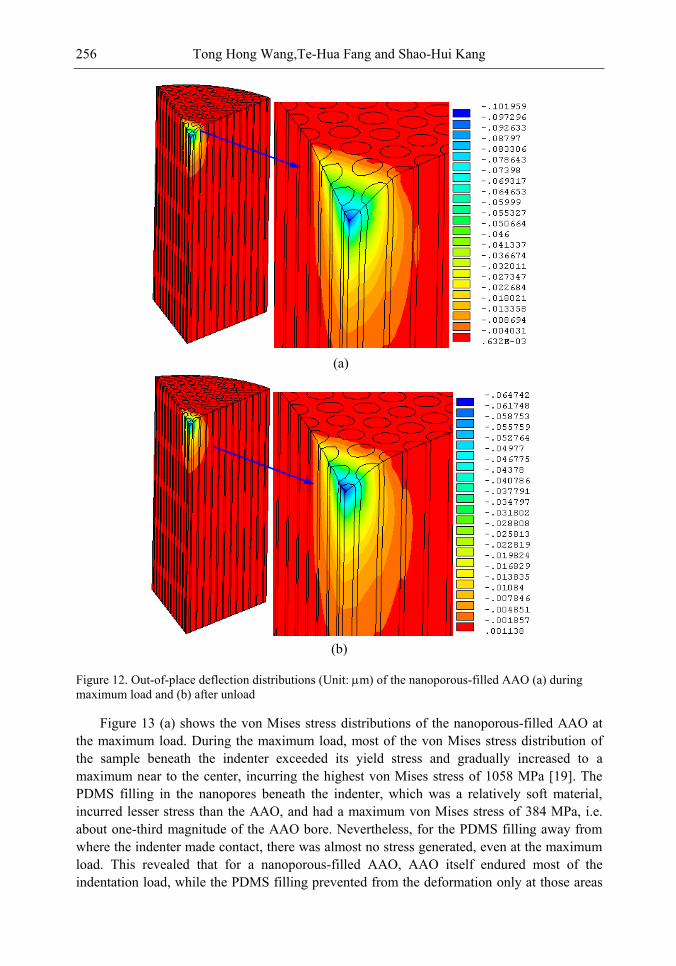
Tong Hong Wang,Te-Hua Fang and Shao-Hui Kang 256
(a)
(b)
Figure 12. Out-of-place deflection distributions (Unit: m) of the nanoporous-filled AAO (a) during maximum load and (b) after unload
Figure 13 (a) shows the von Mises stress distributions of the nanoporous-filled AAO at the maximum load. During the maximum load, most of the von Mises stress distribution of the sample beneath the indenter exceeded its yield stress and gradually increased to a maximum near to the center, incurring the highest von Mises stress of 1058 MPa [19]. The PDMS filling in the nanopores beneath the indenter, which was a relatively soft material, incurred lesser stress than the AAO, and had a maximum von Mises stress of 384 MPa, i.e. about one-third magnitude of the AAO bore. Nevertheless, for the PDMS filling away from where the indenter made contact, there was almost no stress generated, even at the maximum load. This revealed that for a nanoporous-filled AAO, AAO itself endured most of the indentation load, while the PDMS filling prevented from the deformation only at those areas
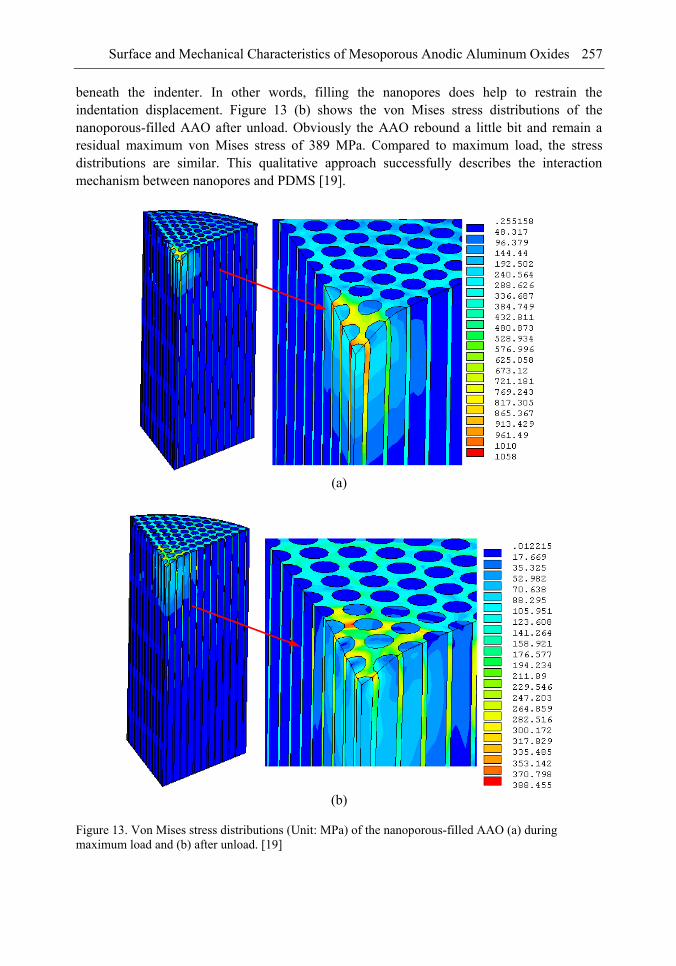
Surface and Mechanical Characteristics of Mesoporous Anodic Aluminum Oxides 257
beneath the indenter. In other words, filling the nanopores does help to restrain the indentation displacement. Figure 13 (b) shows the von Mises stress distributions of the nanoporous-filled AAO after unload. Obviously the AAO rebound a little bit and remain a residual maximum von Mises stress of 389 MPa. Compared to maximum load, the stress distributions are similar. This qualitative approach successfully describes the interaction mechanism between nanopores and PDMS [19].
(a)
(b)
Figure 13. Von Mises stress distributions (Unit: MPa) of the nanoporous-filled AAO (a) during maximum load and (b) after unload. [19]
(b)
Tong Hong Wang,Te-Hua Fang and Shao-Hui Kang 258
5. CONCLUSION
In this chapter, we have demonstrated the mechanical and wetting behaviors of nanoporous and nanoporous-filled AAOs. The hardness and Young modulus of the nanoporous-filled AAO are obviously and slightly enhanced when compared to the standard nanoporous AAO. The wetting behavior is also exhibited as relatively hydrophilic by filling the AAO structures with PDMS. Finite element analysis on nanoporous-filled AAO reveals that AAO itself endures most of the indentation load, while filling the PDMS prevents from the deformation only at those areas beneath the indenter which do help to suppress the indentation displacement.
REFERENCES
[1] Masuda, H., Hagsegwa, F. (1997). J. Electrochem. Soc., 144, L127. [2] Itoh, N., Tomura, N., Tsuji, T., Hongo, M. (1998). Microporous Mesoporous Mater., 20,
333. [3] Seo, B. I., Shaislamov, U. A., Kim, S. W., Kim, H. K., Hong, S. K. & Yang, B. (2007).
Physica, E 37 279. [4] Wu, Y., Xiang, J., Yang, C., Lu, W. & Lieber, C. M. (2004). Nature, 430, 61. [5] Choi, W. B., Cheong, B. H., Kim, J. J., Chu, J. & Bae, E. (2003). Adv. Funct. Mater. 13,
80. [6] Cui, Y. & Lieber, C. M. (2001). Science, 291, 851. [7] Benfield, R. E., Grandjean, D., Kroll, M., Pugin, R., Sawitowski, T., Schmid, G. (2001).
J. Phys. Chem. B., 105, 1961 [8] Yang, H. & Rahman, S. (2003). Nano lett., 3, 439. [9] Varghese, O. K., Gong, D., Paulose, M., Ong, K. G., Grimes, C. A. & Dickey, E. C.
(2002). J. Mater. Res., 17, 1162. [10] Popat, K. C., Mor, G., Grimes, C. A. & Desai, T. A. (2004). Langmuir, 20, 8035. [11] Ko, S., Lee, D., Jee, S., Park, H., Lee, K. & Hwang, W. (2006). Thin Solid Films, 515,
1932. [12] Li, A. P., Muller, F., Birner, A., Nielsch, K. & Gosele, U. (1998). J. Appl. Phys., 84,
6023. [13] EI-Sayed, H., Singh, S., Greiner, M. T. & Kruse, P. (2006). Nano Lett., 6, 2995. [14] Zhang, F., Liu, X. H., Pan, C. F. & Zhu, J. (2007). Nanotechnology, 18, 345302. [15] Fang, T. H., Chang, W. J. (2006). Appl. Surf. Sci., 252, 6243. [16] Fang, T. H., Wang, T. H., Liu, C. H. & Kang, S. H. (2007). Nanoscale Research Letters,
2, 410. [17] Fang, T. H., Wang, T. H., Kang, S.H. & Chuang, C. H. (2009). Current Applied Physics,
9, 880. [18] Redon, R., Vazquez-Olmos, A., Mata-Zamora, M. E., Ordonez-Medrano, A., Rivera-
Torres, F. & Saniger, J. M. (2006). Rev. Adv. Mater. Sci., 11, 79. [19] Fang, T. H., Wang, T. H. & Kang, S. H. (2009). Journal of Materials Science, 44, 1588. [20] Hiller, J., Mendelsohn, J. D. & Rubner, M. F. (2002). Nature Materials, 1, 59. [21] Fang, T. H. & Chang, W. J. (2003). Microelectron. Eng., 65, 231.

Surface and Mechanical Characteristics of Mesoporous Anodic Aluminum Oxides 259
[22] Grosskreutz, J. C. (1969). J. Electrochm. Soc., 116, 1232. [23] Wang, T. H., Fang, T. H. & Lin, Y. C. (2007). Mater. Sci. Eng., A 447, 244. [24] Fischer-Cripps, A. C. (2002). Nanoindentation, Springer, New York,. [25] Palmqvist, S. (1957). Jernkontorets Ann., 141, 303. [26] Barber, J. R. & Bilings, D. A. (1990). Int. J. Mech. Sci., 32, 991-997. [27] Bilodeau, G. G. (1992). J. Appl. Mech., 59, 519-523.

In: Nanoporous Materials Types, Properties and Uses ISBN: 978-1-61668-182-1 Editor: Samuel B. Jenkins, pp. 261-272 © 2010 Nova Science Publishers, Inc.
Chapter 9
QUASI MONOCRYSTALLINE POROUS SILICON
(QMPS) – A POTENTIAL MATERIAL FOR
OPTOELECTRONIC AND PHOTOVOLTAIC
APPLICATIONS
Mahua Chakraborty (Banerjee)1, Sukumar Basu
2
and Hiranmay Saha2
1Techno India, Salt Lake, Kolkata, India, 700091 2IC Design & Fabrication Centre, Department of Electronics &Telecommunication
Engineering, Jadavpur University, Kolkata, India, 700032
ABSTRACT
Research on Porous Silicon (PS) is being pursued since their discovery for use in optoelectronics, solar cells and sensors. Silicon containing nano size (10-15 nm) pores produced by electrochemical anodization has the well-known potential advantage of enhanced light trapping inside the material. Also its low reflectance loss makes it suitable for optoelectronic and photovoltaic applications. However, the lack of stability due to ageing effect because of slow native oxidation could not make PS a promising material so far. To overcome this instability problem, recently an idea of Quasi Monocrystalline Porous Silicon (QMPS), a modified form of PS was conceived. When low porosity (~ 20-30%) porous silicon is thermally annealed in the temperature range, 1050-1100C and in pure H2 ambient, the nanopores get transformed both in shape and size, resulting in QMPS. During annealing, the open pore channels on the surface of PS layer become closed and pore-free smooth surface is formed as monocrystalline silicon, with nano-size voids embedded inside the body that might help in the enhanced optical absorption. The presence of nano voids and favorable electrical properties as that of silicon makes QMPS suitable as active layer for low-cost solar cells. Researchers have also used this material as passive seed layer for epitaxial growth for solar cell fabrications. A few researchers have investigated the structural, optical and electrical properties but fabrication of solar cells using QMPS as an active layer is yet to be achieved. However, the primary theoretical modeling has indicated that about 15 – 16% efficiency solar cells are possible
Mahua Chakraborty (Banerjee), Sukumar Basu and Hiranmay Saha 262
to be targeted. Modeling on optical absorption and carrier concentration of QMPS layers have also been done in detail. Further studies can be performed on the effect of variation of the size of nanopores during formation either by thermal annealing or by laser and thermal annealing on the properties of QMPS. Study of QMPS/p+ Si interface in detail may also be very interesting in order to get a quantitative idea of defect density, nature of trapping states etc. There is an ample scope of studies with QMPS since the material is still in the initial stage of investigation and it can bring forth a sensational advancement in the important areas of optoelectronics and solar cells in terms of high efficiency, low cost and relatively easy device fabrications.
INTRODUCTION
Porous silicon (PS) consists of a network of nanometer-sized silicon regions surrounded by the void space called pores. The PS films were first obtained by Uhlir [1] and Turner [2] while studying the electro polishing of Si in dilute HF solutions. Since Canham [3-5] demonstrated the efficient visible photoluminescence (PL) from porous silicon, the scientific and technological interests have been focused on the possibility of developing a wide range of PS based devices including optoelectronics [6-8], solar cells [9-19] and sensors [20-30]. In order to obtain the nano size (10-15 nm) pores in silicon an electrochemical anodization method is usually employed. The well-known potential advantage of the enhanced light trapping and the low reflectance loss of PS make it suitable for the optoelectronic and the photovoltaic applications. However, the surface instability because of the slow native oxidation, leading to an ageing effect [31] has become a major issue in the way of PS becoming a potential material. The high defect density of PS due to its nanostructure is the principal contributing factor to this effect. To overcome this instability problem, recently an idea of a modified form of PS called Quasi Monocrystalline Porous Silicon (QMPS) [32-34] or Quasi Monocrystalline Silicon (QMS) [35, 36] was conceived. QMPS (or QMS) is basically a thin (~5-10 m) crystalline silicon layer with the underlying nano voids, more or less uniformly distributed. In fact, QMPS is formed after the re-crystallization of low porosity porous silicon by the high temperature thermal annealing in a vacuum or in the reducing atmosphere. Enhanced optical absorption due to the presence of the nano voids and the favorable electrical properties as that of silicon makes QMPS a suitable active layer for the low-cost solar cells. Researchers have also used this material as a passive seed for the epitaxial growth for the solar cell fabrications [37-40] instead of using it as an active device layer.
The term QMS (Quasi Monocrystalline Silicon) was first introduced by Rinke et. al. [35, 36] after finding the voids in the annealed low porous region of monocrystalline silicon. However, D. Mazumder et. al. [32] tried some variety of QMS process and they termed this as QMPS (Quasi Monocrystalline Porous Silicon).
Fabrication of QMPS (or QMS)
Double porosity porous silicon is utilized in the process of QMPS (or QMS) formation for transferring it onto a foreign low-cost substrate; however, the low porosity single layer
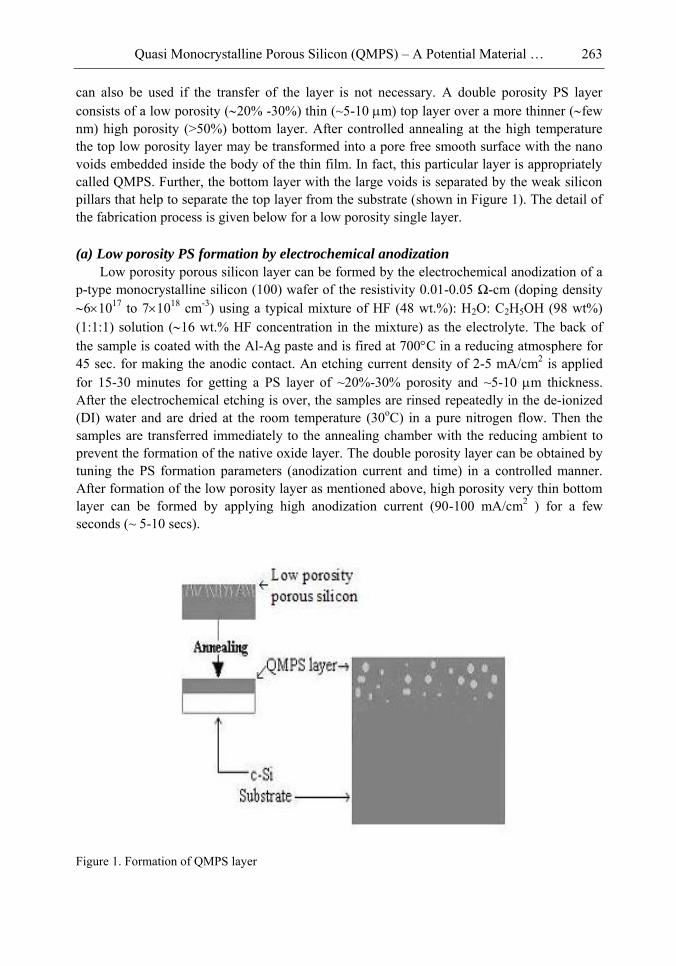
Quasi Monocrystalline Porous Silicon (QMPS) – A Potential Material … 263
can also be used if the transfer of the layer is not necessary. A double porosity PS layer consists of a low porosity (20% -30%) thin (~5-10 m) top layer over a more thinner (few nm) high porosity (>50%) bottom layer. After controlled annealing at the high temperature the top low porosity layer may be transformed into a pore free smooth surface with the nano voids embedded inside the body of the thin film. In fact, this particular layer is appropriately called QMPS. Further, the bottom layer with the large voids is separated by the weak silicon pillars that help to separate the top layer from the substrate (shown in Figure 1). The detail of the fabrication process is given below for a low porosity single layer.
(a) Low porosity PS formation by electrochemical anodization
Low porosity porous silicon layer can be formed by the electrochemical anodization of a p-type monocrystalline silicon (100) wafer of the resistivity 0.01-0.05 Ω-cm (doping density 61017 to 71018 cm-3) using a typical mixture of HF (48 wt.%): H2O: C2H5OH (98 wt%) (1:1:1) solution (16 wt.% HF concentration in the mixture) as the electrolyte. The back of the sample is coated with the Al-Ag paste and is fired at 700C in a reducing atmosphere for 45 sec. for making the anodic contact. An etching current density of 2-5 mA/cm2 is applied
for 15-30 minutes for getting a PS layer of ~20%-30% porosity and ~5-10 m thickness. After the electrochemical etching is over, the samples are rinsed repeatedly in the de-ionized (DI) water and are dried at the room temperature (30oC) in a pure nitrogen flow. Then the samples are transferred immediately to the annealing chamber with the reducing ambient to prevent the formation of the native oxide layer. The double porosity layer can be obtained by tuning the PS formation parameters (anodization current and time) in a controlled manner. After formation of the low porosity layer as mentioned above, high porosity very thin bottom layer can be formed by applying high anodization current (90-100 mA/cm2 ) for a few seconds (~ 5-10 secs).
Figure 1. Formation of QMPS layer
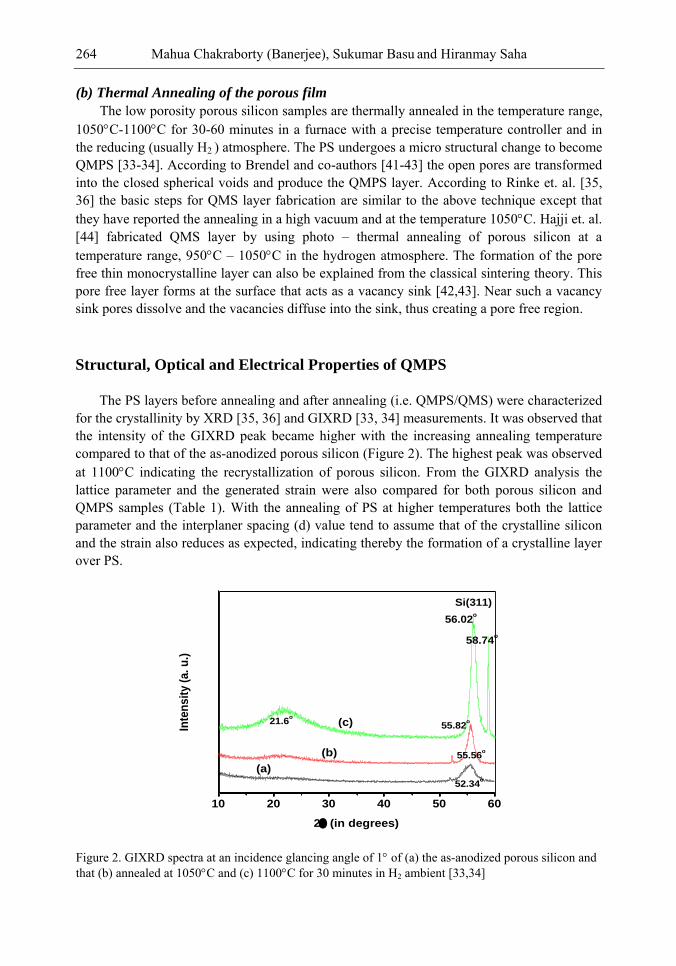
Mahua Chakraborty (Banerjee), Sukumar Basu and Hiranmay Saha 264
(b) Thermal Annealing of the porous film
The low porosity porous silicon samples are thermally annealed in the temperature range, 1050C-1100C for 30-60 minutes in a furnace with a precise temperature controller and in the reducing (usually H2 ) atmosphere. The PS undergoes a micro structural change to become QMPS [33-34]. According to Brendel and co-authors [41-43] the open pores are transformed into the closed spherical voids and produce the QMPS layer. According to Rinke et. al. [35, 36] the basic steps for QMS layer fabrication are similar to the above technique except that they have reported the annealing in a high vacuum and at the temperature 1050C. Hajji et. al. [44] fabricated QMS layer by using photo – thermal annealing of porous silicon at a temperature range, 950C – 1050C in the hydrogen atmosphere. The formation of the pore free thin monocrystalline layer can also be explained from the classical sintering theory. This pore free layer forms at the surface that acts as a vacancy sink [42,43]. Near such a vacancy sink pores dissolve and the vacancies diffuse into the sink, thus creating a pore free region.
Structural, Optical and Electrical Properties of QMPS
The PS layers before annealing and after annealing (i.e. QMPS/QMS) were characterized for the crystallinity by XRD [35, 36] and GIXRD [33, 34] measurements. It was observed that the intensity of the GIXRD peak became higher with the increasing annealing temperature compared to that of the as-anodized porous silicon (Figure 2). The highest peak was observed at 1100C indicating the recrystallization of porous silicon. From the GIXRD analysis the lattice parameter and the generated strain were also compared for both porous silicon and QMPS samples (Table 1). With the annealing of PS at higher temperatures both the lattice parameter and the interplaner spacing (d) value tend to assume that of the crystalline silicon and the strain also reduces as expected, indicating thereby the formation of a crystalline layer over PS.
10 20 30 40 50 60
(c)
(b)
(a)
21.6o
52.34o
Si(311)
58.74o
56.02o
55.82o
Inte
nsit
y (
a.
u.)
55.56o
2 (in degrees)
Figure 2. GIXRD spectra at an incidence glancing angle of 1 of (a) the as-anodized porous silicon and that (b) annealed at 1050C and (c) 1100C for 30 minutes in H2 ambient [33,34]
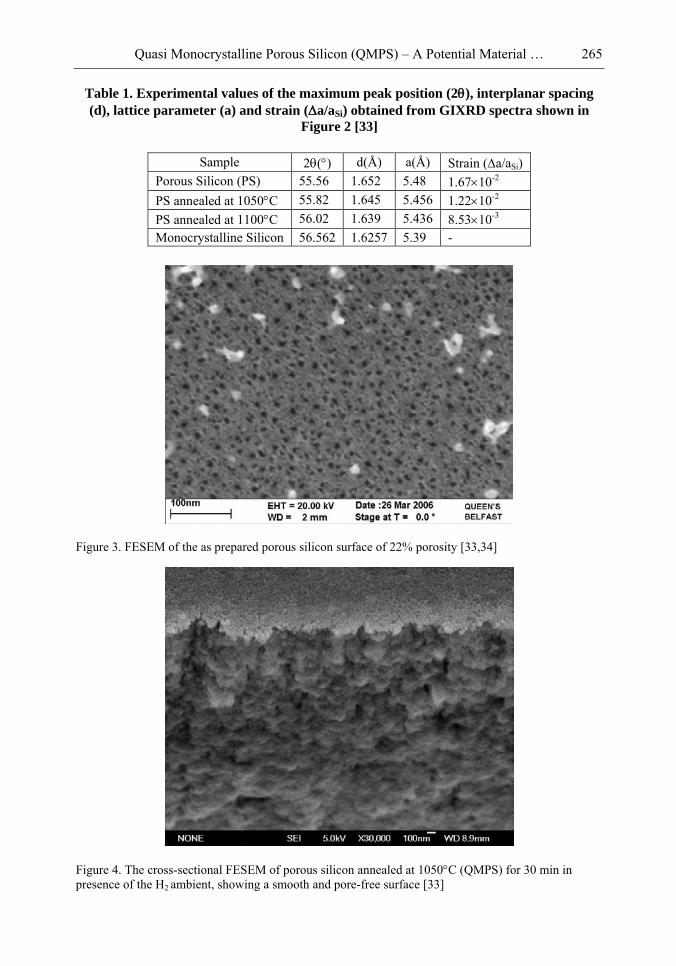
Quasi Monocrystalline Porous Silicon (QMPS) – A Potential Material … 265
Table 1. Experimental values of the maximum peak position (2), interplanar spacing
(d), lattice parameter (a) and strain (a/aSi) obtained from GIXRD spectra shown in
Figure 2 [33]
Sample 2() d(Å) a(Å) Strain (a/aSi) Porous Silicon (PS) 55.56 1.652 5.48 1.6710-2
PS annealed at 1050C 55.82 1.645 5.456 1.2210-2 PS annealed at 1100C 56.02 1.639 5.436 8.5310-3 Monocrystalline Silicon 56.562 1.6257 5.39 -
Figure 3. FESEM of the as prepared porous silicon surface of 22% porosity [33,34]
Figure 4. The cross-sectional FESEM of porous silicon annealed at 1050C (QMPS) for 30 min in presence of the H2 ambient, showing a smooth and pore-free surface [33]
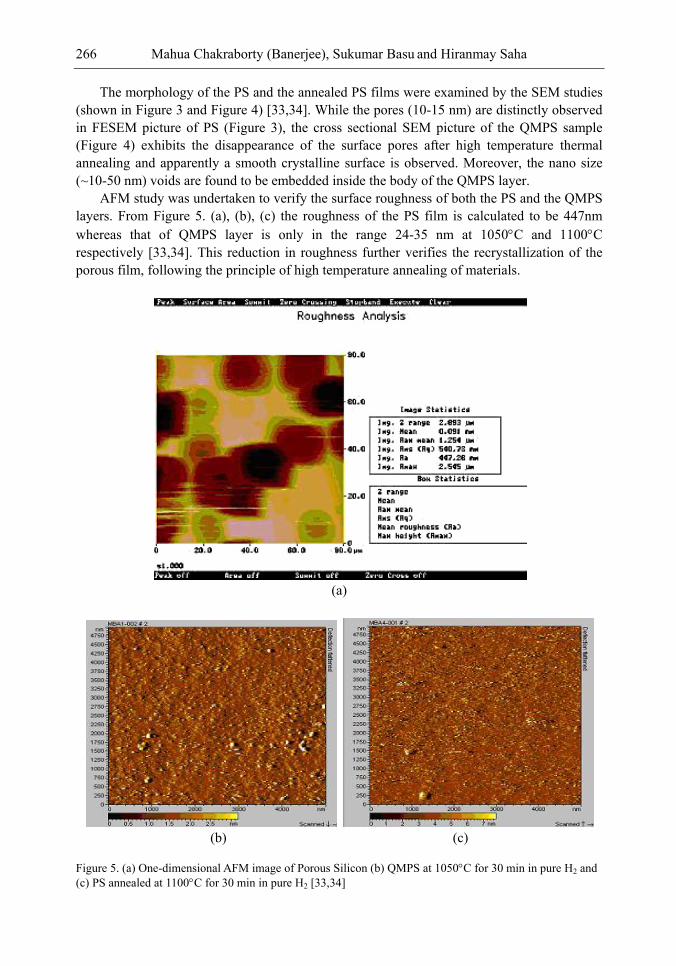
Mahua Chakraborty (Banerjee), Sukumar Basu and Hiranmay Saha 266
The morphology of the PS and the annealed PS films were examined by the SEM studies (shown in Figure 3 and Figure 4) [33,34]. While the pores (10-15 nm) are distinctly observed in FESEM picture of PS (Figure 3), the cross sectional SEM picture of the QMPS sample (Figure 4) exhibits the disappearance of the surface pores after high temperature thermal annealing and apparently a smooth crystalline surface is observed. Moreover, the nano size (~10-50 nm) voids are found to be embedded inside the body of the QMPS layer.
AFM study was undertaken to verify the surface roughness of both the PS and the QMPS layers. From Figure 5. (a), (b), (c) the roughness of the PS film is calculated to be 447nm whereas that of QMPS layer is only in the range 24-35 nm at 1050C and 1100C respectively [33,34]. This reduction in roughness further verifies the recrystallization of the porous film, following the principle of high temperature annealing of materials.
(a)
(b) (c)
Figure 5. (a) One-dimensional AFM image of Porous Silicon (b) QMPS at 1050C for 30 min in pure H2 and (c) PS annealed at 1100C for 30 min in pure H2 [33,34]
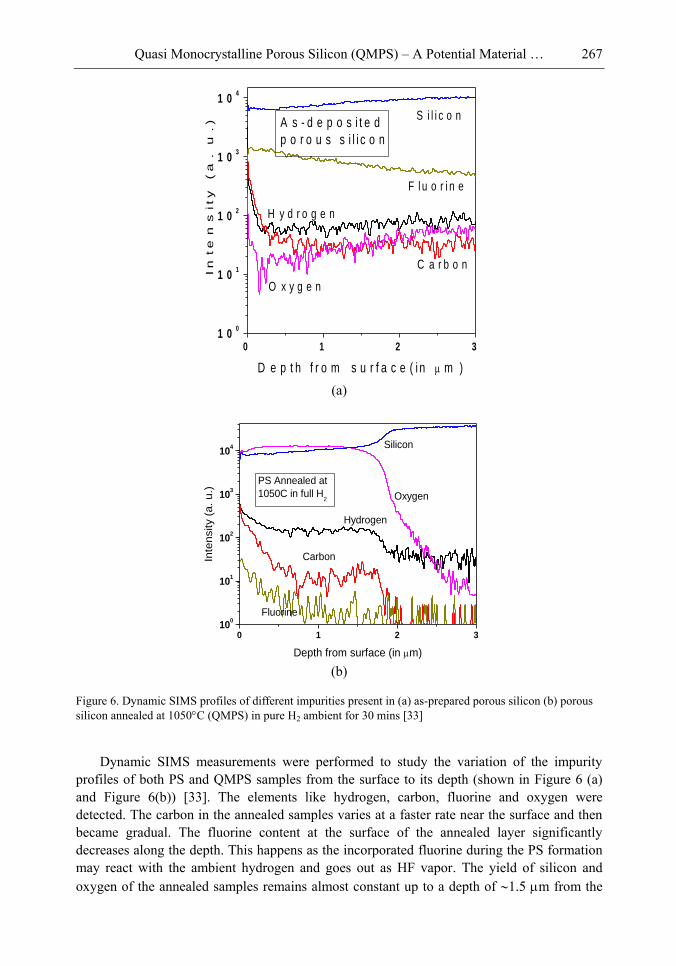
Quasi Monocrystalline Porous Silicon (QMPS) – A Potential Material … 267
0 1 2 31 0
0
1 01
1 02
1 03
1 04
S i l i c o n
F l u o r i n e
O x y g e n
C a r b o n
H y d r o g e n
A s - d e p o s i t e d
p o r o u s s i l i c o n
In
te
ns
ity
(
a. u
.)
D e p t h f r o m s u r f a c e ( i n m ) (a)
0 1 2 310
0
101
102
103
104 Silicon
Oxygen
Fluorine
Carbon
Hydrogen
PS Annealed at
1050C in full H2
Inte
nsity (
a.
u.)
Depth from surface (in m) (b)
Figure 6. Dynamic SIMS profiles of different impurities present in (a) as-prepared porous silicon (b) porous silicon annealed at 1050C (QMPS) in pure H2 ambient for 30 mins [33]
Dynamic SIMS measurements were performed to study the variation of the impurity
profiles of both PS and QMPS samples from the surface to its depth (shown in Figure 6 (a) and Figure 6(b)) [33]. The elements like hydrogen, carbon, fluorine and oxygen were detected. The carbon in the annealed samples varies at a faster rate near the surface and then became gradual. The fluorine content at the surface of the annealed layer significantly decreases along the depth. This happens as the incorporated fluorine during the PS formation may react with the ambient hydrogen and goes out as HF vapor. The yield of silicon and oxygen of the annealed samples remains almost constant up to a depth of 1.5 m from the
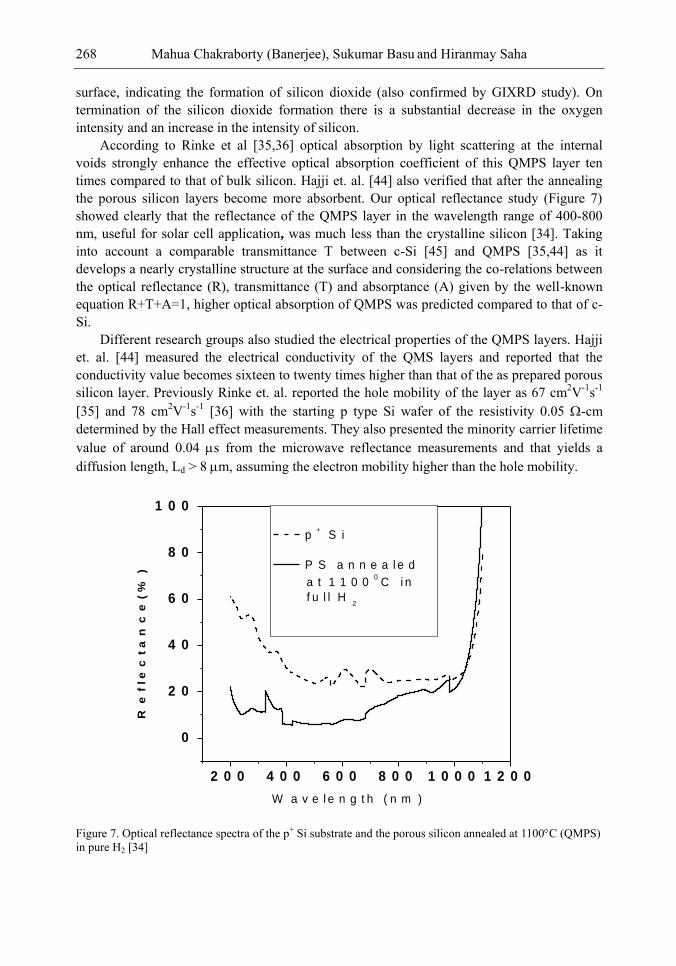
Mahua Chakraborty (Banerjee), Sukumar Basu and Hiranmay Saha 268
surface, indicating the formation of silicon dioxide (also confirmed by GIXRD study). On termination of the silicon dioxide formation there is a substantial decrease in the oxygen intensity and an increase in the intensity of silicon.
According to Rinke et al [35,36] optical absorption by light scattering at the internal voids strongly enhance the effective optical absorption coefficient of this QMPS layer ten times compared to that of bulk silicon. Hajji et. al. [44] also verified that after the annealing the porous silicon layers become more absorbent. Our optical reflectance study (Figure 7) showed clearly that the reflectance of the QMPS layer in the wavelength range of 400-800 nm, useful for solar cell application, was much less than the crystalline silicon [34]. Taking into account a comparable transmittance T between c-Si [45] and QMPS [35,44] as it develops a nearly crystalline structure at the surface and considering the co-relations between the optical reflectance (R), transmittance (T) and absorptance (A) given by the well-known equation R+T+A=1, higher optical absorption of QMPS was predicted compared to that of c-Si.
Different research groups also studied the electrical properties of the QMPS layers. Hajji et. al. [44] measured the electrical conductivity of the QMS layers and reported that the conductivity value becomes sixteen to twenty times higher than that of the as prepared porous silicon layer. Previously Rinke et. al. reported the hole mobility of the layer as 67 cm2V-1s-1 [35] and 78 cm2V-1s-1 [36] with the starting p type Si wafer of the resistivity 0.05 -cm determined by the Hall effect measurements. They also presented the minority carrier lifetime value of around 0.04 s from the microwave reflectance measurements and that yields a diffusion length, Ld > 8 m, assuming the electron mobility higher than the hole mobility.
2 0 0 4 0 0 6 0 0 8 0 0 1 0 0 0 1 2 0 0
0
2 0
4 0
6 0
8 0
1 0 0
p+
S i
P S a n n e a l e d
a t 1 1 0 00
C i n
f u l l H2
Re
fle
ct
an
ce
(%
)
W a v e l e n g t h ( n m )
Figure 7. Optical reflectance spectra of the p+ Si substrate and the porous silicon annealed at 1100C (QMPS) in pure H2 [34]
Quasi Monocrystalline Porous Silicon (QMPS) – A Potential Material … 269
From our experiments [46] the resistivity obtained was in the range of 5-20 ohm-cm using Al as the ohmic contact to QMPS. Au contact to QMPS, however, was shown to be rectifying contrary to the recent report [44] of Au as the ohmic contact to QMPS. From the Hall-effect measurements the average values of the carrier concentration and hole mobility for p-type QMPS layers obtained were ~ 1016/cm3 and 75cm2/Vs respectively.
Rinke et. al. [35] further demonstrated a potential of the QMS film for the high efficiency solar cell applications economically by using a small amount of silicon and the simple steps of processing. The transfer of 30 numbers of sintered porous layers on the glass substrates from a single wafer of 500 m thickness was reported. A short circuit current density of 11.1 mA/cm2 was obtained in case of a 4 m thick sintered porous silicon layer before lifting off the layer from the starting p+ wafer [47]. But the cell efficiency was not reported.
Theoretical Modeling
Brendel et. al. has proposed a model based on Mie scattering for explaining their experimental optical absorption results with Quasi Monocrystalline Silicon (QMS) layer having a distribution of nanovoids [48]. But it appears to be inadequate for the modeling of light absorptance as a function of depth of light passage through QMPS layer. Therefore we have developed a detailed modeling on optical absorption of QMPS layer using the concepts of light diffraction by nanocrystallites and scattering of light by the voids [49]. It was demonstrated that the significant enhancement of effective optical absorption in QMPS layer could be achieved by optimizing the dimensions and distributions of the nano voids embedded inside the layer.
For using QMPS as an active solar cell material the enhanced optical absorption is not enough, relatively higher carrier density (~ 1016 – 1017 /cm3) of the material is also a prerequisite. A simple model of carrier density of QMPS based on the existence of void-silicon interface states was developed [50]. The average carrier density as a function of doping concentration of the starting material, void radius, porosity and void-silicon interface state density of the layer was computed using this model. The effect of band gap enhancement due to quantum confinement of the carriers in the nano crystalline phase as well as the effect of dopant spacing was also incorporated in this model. The simulated values of the carrier density of QMPS layers are slightly higher than the experimental values. This apparent discrepancy may be explained from the consideration of passivation of interface states at the void-silicon interface in the simulation study.
Finally, simulation on solar cell parameters considering QMPS as active material was performed through modeling on transport parameters such as the minority carrier mobility and lifetime in the layer [51]. Dependence of the cell parameters of solar cells fabricated directly on QMPS layer formed by annealing at different annealing temperatures and with different initial porosity values were also studied. The effects of the series and the shunt resistance on the cell performance were further investigated. The important role of the minority carrier density at the interface state at void-silicon interface on the cell parameters was also presented [51]. According to the simulation, ~15 – 16% efficiency solar cells with Voc ~ 500mV are achievable. An analytical model has been also developed that simulates the
Mahua Chakraborty (Banerjee), Sukumar Basu and Hiranmay Saha 270
cell parameters of a QMPS (as active layer) solar cell considering the effects of the interface states located at the void-silicon interface of the layer [52].
Thus, both from the experimental characterizations and theoretical modeling and simulation, QMPS has been proved to be a potential solar cell material for using as an active layer. However, further studies on the preparation of the improved quality QMPS for higher efficiency solar cells are very much essential.
CONCLUSION
High temperature annealing of low porosity porous silicon in vacuum or in pure hydrogen atmosphere yields QMS/QMPS layers for the production of inexpensive and efficient devices in the area of optoelectronics and solar cells. In particular, it can be used as a potential active layer in silicon solar cells for the enhanced solar energy absorption in the visible range of the solar spectrum. Further the presence of the nano voids and the favorable electrical properties as that of the monocrystalline silicon makes QMPS more promising for the terrestrial photovoltaic applications. The theoretical modeling & the simulation on the optical and the electrical properties of QMPS layer strongly supports the experimental investigations. Though, the fabrication of the solar cells using QMPS as an active layer is yet to be practically achieved, the primary theoretical modeling has indicated that about 15 – 16% efficiency solar cells with Voc ~ 500mV are possible to be targeted. Therefore, QMPS has a substantial commercial implication for the development of the high efficiency photovoltaic modules based on the well-established silicon technology. The experimental research & development, so far pursued, also indicate the importance of the material.
FURTHER STUDY
Since QMPS as a material is still in the initial stage of investigation, there is an ample scope of studies with it and it can bring forth a sensational advancement in the important areas of optoelectronics and solar cells in terms of high efficiency, low cost and relatively easy device fabrications. The study of the p-n junction formation and subsequent analysis of the solar cell parameters is essential to realize the concept of solar cells with QMPS as an active layer. Further studies can be performed on the effect of the variation of the size of nanopores during the formation either by the thermal annealing or by the laser and the laser- thermal annealing on the properties of QMPS material and the solar cells fabricated. The detail study of the QMPS/p+ Si interface may also be very interesting to get a quantitative idea of the parameters like the defect density and the nature of the trapping states etc. that influence the solar properties directly and/or indirectly.
REFERENCES
Uhlir, A. JR. The Bell System Technical Journal, 1956, 35, 333-347.
Quasi Monocrystalline Porous Silicon (QMPS) – A Potential Material … 271
Turner, DS. J. Electrochem. Soc., 1958, 105(1), 402-408. Canham, LT. Appl. Phys. Lett., 1990, 57, 1046-1048. Canham, LT; Houlton, MR; Leong, WY; Pickering, C; Keen, JMJ. Appl. Phys., 1991,70, 422-
431. Cullis, AG; Canham, LT. Nature, 1991,353, 335-338. Cullis, AG; Canham, LT; Calcott, PD. J. J. Appl. Phys., 1997, 82, 909-965. Parkhutik, V. Solid-State Electronics, 1999, 43, 1121-1141. Bisi, O; Ossicini, S; Pavesi, L. Surface Science Reports, 2000, 38, 1-126. Wei, GP; Zhen, YM; Huang, ZJ; Li, Y; Feng, JW; Mo, YW. Solar Energy Materials, and
Solar Cells 1994, 35, 319-324. Menna, P; Francia, GD; Ferrara, VL. Solar Energy Materials and Solar Cells, 1995, 37, 13-
24. Semikina, TV; Shmyryeva, AN. Renewable Energy, 1998, 15, 479-482. Bilyalov, R; Stalmans, L; Beaucarne, G; Loo, R; Caymax, M; Poortmans, J; Nijs, J. Solar
Energy Materials and Solar Cells, 2001, 65, 477-485. Swiatek, Z; Towska, EB; Maziarz, W; Krok, F. Materials Science and Engineering B,
2003,101, 291-296. Solanki, CS; Bilyalov, RR; Poortmans, J; Nijs, J; Mertens, R. Solar Energy Materials and
Solar Cells, 2004, 83, 101-113. Brendel, R. Solar Energy, 2004, 77, 969-982. Tobail, O; Yan, Z; Reuter, M; Werner, JH. Thin Solid Films, 2008, 516, 6959-6962. Depauw, V; Richard, O; Bender, H; Gordon, I; Beaucarne, G; Poortmans, J; Mertens, R;
Celis, JP. Thin Solid Films, 2008, 516, 6934-6938. Moon, I; Kim, K; Thamilselvan, M; Kim, Y; Han, K; Kyeong, D; Kwon, T; Vinh Ai, D; Lee,
J; Ju, M; Lee, K; Yi, J. Solar Energy Materials and Solar Cells, 2009, 93, 846-850. Depauw, V; Gordon, I; Beaucarne, G; Poortmans, J; Mertens, R; Celis, JP. Materials Science
and Engineering, B 2009, 159-160, 286-290. Taliercio, T; Dilhan, M; Massone, E; Gué, AM; Fraisse, B; Foucaran, A. Thin Solid Films,
1995, 255, 310-312. Baratto, C; Comini, E; Faglia, G; Sberveglieri, G; Francia, GD; Filippo, FD; Ferrara, VL;
Quercia, L; Lancellotti, L. Sensors and Actuators, B 2000, 65, 257-259. Foucaran, A; Sorli, B; Garcia, M; Pascal-Delannoy, F; Giani, A; Boyer, A. Sensors and
Actuators A 2000, 79, 189-193. Pancheri, L; Oton, CJ; Gaburro, Z; Soncini, G; Pavesi, L. Sensors and Actuators B, 2003, 89,
237-239. Francia, GD; Castaldo, A; Massera, E; Nasti, I; Quercia, L; Rea, I. Sensors and Actuators, B
2005, 111-112, 135-139. Salgado, GG; Becerril, TD; Santiesteban, HJ; Andrés, ER. Optical Materials, 2006, 29, 51-
55. Ozdemir, S; Gole JL. Current Opinion in Solid State and Materials Science, 2007, 11, 92-
100. Mizsei, J. Thin Solid Films, 2007, 515, 8310-8315. Gole, JL; Lewis, SE. Nanosilicon; Kumar V; Ed; ISBN-13: 978-0-08-044528-1 ISBN-10: 0-
08-044528-4; Elsevier, 2007, 149-175. Martínez, HM; Rincon, NE; Torres, J; Alfonso, JE. Microelectronics Journal, 2008, 39,
1354-1355.
Mahua Chakraborty (Banerjee), Sukumar Basu and Hiranmay Saha 272
Galstyan, VE; Martirosyan, KS; Aroutiounian, VM; Arakelyan, VM; Arakelyan, AH; Soukiassian, PG. Thin Solid Films, 2008, 517, 239-241.
Toshimichi, I; Akio, H. Journal of Luminescence, 1993, 57, 331-339. Majumdar, D; Chatterjee, S; Dhar, M; Dutta, SK; Saha, H. Solar Energy Materials and Solar
Cells, 2003,77 ,51-64. Banerjee, M; Bontempi, E; Tyagi, AK; Basu, S; Saha, H. Applied Surface Science, 2008, 254,
1837-1841. Banerjee, M; Bontempi, E; Bhattacharya, S; Maji, S; Basu, S; Saha, H. Journal of Materials
Science: Materials in Electronics, 2009, 20, 305-311. Rinke, TJ; Bergmann, RB; Brugemann, R; Werner, JH. Solid State Phenomenna, 1999, 67-
68, 229-234. Rinke, TJ; Bergmann, RB; Werner, JH. Appl. Phys., A 1999, 68, 705-707. Tayanaka, H; Yamauchi, K; Matshushita, T. Proc. of the 2nd World Conference on
Photovoltaic Solar Energy Conversion, Vienna, Austria, 1998, 1272-1277. Brendel, R; Artmann, H; Oelting, S; Frey, W; Werner, JH; Queisser, HJ. Appl. Phys., A 1998,
67, 151-154. Yonehara, T; Sakaguchi, K; Sato, N. Appl. Phys. Letter, 1994, 64, 2108-2110. Solanki, CS; Bilyalov, RR; Poortmans, J; Nijs J. Thin Solid Films, 2002, 403-404, 34-38. Muller, G; Nerding, M; Ott, N; Strunk, HP; Brendel, R. phys. stat., sol (a) 2003, 197, 83-87. Ott, N; Nerding, M; Muller, G; Brendel, R; Strunk, HP. phys. stat. sol (a) 2003, 197, 93-97. Ott, N; Nerding, M; Muller, G; Brendel, R; Strunk, HP. J. Appl. Phys., 2004, 95, 497-503. Hajji, M; Khardani, M; Khedher, N; Rahmouni, H; Bessais, B; Ezzaouia, H; Bouchirha, H.
Thin Solid Films, 2006, 511-512, 235-237. Behren, J. von; Fauchet, PM. Properties of Porous Silicon ed. Canham, LT. INSPEC, IEE,
UK, 1997, 229. Banerjee, M; Basu, S; Saha, H. Semicoductor Science and Technology, 2008, 23, 075014 (5). Bergmann, RB; Rinke, TJ; Oberbeck, L; Dasow, R. Perspectives of Science and Technologies
for Novel Silicon on Insulator Devices ed. Hemment P. L. F; Lysenko V. S; Nazarov A. N., NATO Science Series 3. High Technology, Kluwer Academic Publishers, Dordrecht, 2000; Vol 73, 109.
Seel, H; Brendel, R. Thin Solid Films, 2004, 451-452, 608-611. Banerjee, M; Dutta, SK; Saha, H. Nanotechnology, 2005, 16, 1542-1547. Banerjee, M; Dutta, SK; Saha, H. Nanotechnology, 2006, 17, 163-169. Banerjee, M; Dutta, SK; Gangopadhyay, U; Majumdar, D; Saha, H. Solid State Electronics,
2005, 49,1282-1291. Krichen, M; Zouari, A; Arab, AB. Microelectronics Journal, 2008, 39,1433-1438.
In: Nanoporous Materials Types, Properties and Uses ISBN: 978-1-61668-182-1 Editor: Samuel B. Jenkins, pp. 273-313 © 2010 Nova Science Publishers, Inc.
Chapter 10
LOW-K NANOPOROUS INTERDIELECTRICS:
MATERIALS, THIN FILM FABRICATIONS,
STRUCTURES AND PROPERTIES
Moonhor Ree*, Jinhwan Yoon and Kyuyoung Heo
Department of Chemistry, National Research Laboratory for Polymer Synthesis & Physics, Center for Electro-Photo Behaviors in Advanced Molecular Systems, Division
of Advanced Materials Science, Polymer Research Institute, and BK School of Molecular Science, Pohang University of Science and Technology, Pohang 790-784, Republic of
Korea
ABSTRACT
The use of low dielectric constant (low-k) interdielectrics in multilevel structure integrated circuits (ICs) can lower line-to-line noise in interconnects and alleviate power dissipation issues by reducing the capacitance between the interconnect conductor lines. Because of these merits, low-k interdielectric materials are currently in high demand in the development of advanced ICs. One important approach to obtaining low-k values is the incorporation of nanopores into dielectrics. The development of advanced ICs requires a method for producing low-k dielectric materials with uniform distributions of unconnected, closed, individual pores with dimensions considerably smaller than the circuit feature size. Thus the control of both pore size and pore size distribution is crucial to the development of nanoporous low-k dielectrics. This article reviews recent developments in the imprinting of closed nanopores into spin-on materials to produce low-k nanoporous interdielectrics for the production of advanced ICs. This review further provides an overview of the methodologies and characterization techniques used for investigating low-k nanoporous interdielectrics.
* Corresponding author: E-mail address: [email protected]. Tel: +82-54-279-2120. Fax: +82-54-279-3399.
Moonhor Ree, Jinhwan Yoon and Kyuyoung Heo 274
I. INTRODUCTION
Continuous improvements in device density and performance have been achieved through feature size reduction and the scaling down of device dimensions to the deep submicrometer level. The coupling of the intermetal capacitance effect with line resistivity is now a limiting factor for the ultra-large-scale integration of electric circuits. To reduce this problem, low-k interdielectrics have received significant attention from the microelectronics industry and end users because their use in integrated circuits (ICs) with multilayer structures can lower line-to-line noise in interconnects and alleviate power dissipation issues by reducing the capacitance between the interconnect conductor lines.[1-8] Further, low-k interdielectrics have advantages over low-resistivity metal conductors such as copper and silver, because in addition to providing device speed improvements they also provide lower resistance-capacitance delay.[1-7, 9, 10] Thus there is a strong demand for such materials (k<<2.5) in the microelectronics industry, which is rapidly developing advanced ICs with multilayer structures that have improved functionality and speed in a smaller package and that consume less power.[1-10]
According to the Semiconductor Industry Association‘s International Technology
Roadmap for Semiconductors, materials that deliver an effective k of 2.53.0 are in production today, and that in the near future material systems that deliver an effective k < 1.9 are expected to be available, in particular for 50 nm or less feature size technology based on copper metallization.[10] Apart from having a low k value, interdielectric materials must meet the thermal and mechanical stabilities requirements of the metallization processing of ICs. For example, copper metallization can be achieved by electroplating, electroless plating, plasma vapor deposition or chemical vapor deposition.[2, 9, 11] These processes are conducted at temperatures below 250 C but are usually followed by thermal annealing in the range 400450 C to ensure the production of void-free copper deposits. Thus, low-k nanoporous materials must be able to withstand thermal stress for several hours. Further, interdielectric materials must have low moisture uptake, high purity, good adhesion to silicon substrate, silicon oxide, and metals, good planarization behavior, and appropriate plasma etching behavior. When copper began to be used as an interconnect metal, damascene (metal inlay) metallization was introduced because of copper‘s slow dry etching and gas phase
deposition processability.[2, 6, 7, 9, 11] The ‗dielectric first‘ damascene process is usually
preferred, with trenches then filled with the interconnect metal. In this process, excess metal is removed by chemical mechanical polishing (CMP). The CMP process is conducted with an aqueous slurry containing an abrasive (e.g., alumina particles) and an oxidant and/or complexing agent (e.g., nitric acid or ammonium hydroxide). Therefore, interdielectric materials must be able to withstand harsh CMP processing. Further, diffusion barriers for copper and adhesion promoting layers are necessary.
To achieve these requirements to use for interdielectric materials, much effort has been directed towards the development of low-k porous dielectric thin films for use in the advanced ICs. This article explores recent developments in the imprinting of closed nanopores into spin-on-dielectrics to produce low-k nanoporous interdielectric thin films. We also provide an overview of the analytical techniques used to characterize the pore structures of nanoporous dielectric thin films, and identify the strengths and weaknesses of these techniques. In
Low-K Nanoporous Interdielectrics: Materials, Thin Film Fabrications, Structures… 275
particular, we discuss in detail the advanced grazing incidence X-ray scattering (GIXS) technique, which has recently gained considerable attention.
II. RECENT DEVELOPMENTS IN LOW-K NANOPOROUS DIELECTRICS
For twenty years, significant effort with polymeric system has been applied to the development of low-k interdielectrics for use in the development of advanced ICs For instance, polyimides, heteroaromatic polymers, polyaryl ethers, fluoropolymers, nonpolar hydrocarbon polymers, and polysilsesquioxanes have been used to low dielectric materials thin films, which deposited from the gas phase with chemical deposition, plasma enhanced chemical vapor deposition, and other techniques.[8, 11-42] However, most of these polymers have k > 2.5. Polytetrafluoroethylene (PTFE: Teflon) has a k value of 2.2, which is the lowest k value reported so far for such polymers. However, PTFE cannot be used in the fabrication of ICs because of its very weak mechanical properties, poor interfacial adhesion and poor processability. Overall, these polymers‘ k values are considerably lower than those of today‘s workhorse dielectrics silicon dioxide (k = 3.9–4.3) and silicon nitride (k = 6.0–7.0), but are still much higher than that of air (or vacuum), k = 1.01, which is the lowest value attainable. Hence there has been much interest in incorporating air into dielectric materials as nanopores to produce nanoporous materials with low k values.[1-8] The advanced ICs requires nanoporous materials with a uniform distribution of closed pores that have dimension significantly smaller than a circuit feature size in order to avoid circuit defects.[2-4, 6, 7, 11, 43-45]
In this chapter, we provide an overview of recent developments in the imprinting of closed nanopores into spin-on-dielectrics to produce low-k nanoporous interdielectric thin films.
II.1. Hollow Nanoparticles
Thermally and dimensionally stable hollow nanoparticles have been used to produce low-k dielectric materials.[1] For example, films of poly(p-phenylene biphenyltetracarboximide) (BPDA-PDA PI) containing silica hollow sphere particles have been reported to be useful as low-k polymer dielectric materials.[1] BPDA-PDA PI films containing 27 wt% hollow silica nanoparticles have a refractive index n of 1.7007 at a wavelength of 830 nm, which is less than that of BPDA-PDA PI films (n=1.7421). This was the first report of the successful incorporation of closed air voids into dielectric materials for the production of low-k dielectrics. The hollow nanoparticles used in this study were prepared by the thermal sintering of monolithic silica aerogels; the monolithic aerogels were fabricated via the conventional sol-gel reactions of tetra-alkoxysilane (TAOS) and its derivatives and subsequent drying under supercritical conditions with selected solvent systems (Figure 1).[46-48] These hollow nanoparticles are based on networked silica and are thus very stable thermally and dimensionally up to 500 C; these properties make them suitable for incorporation into dielectric materials as closed nanopores. Because of their high thermal and dimensional stability, this type of hollow nanoparticle can be blended into any polymer dielectric,
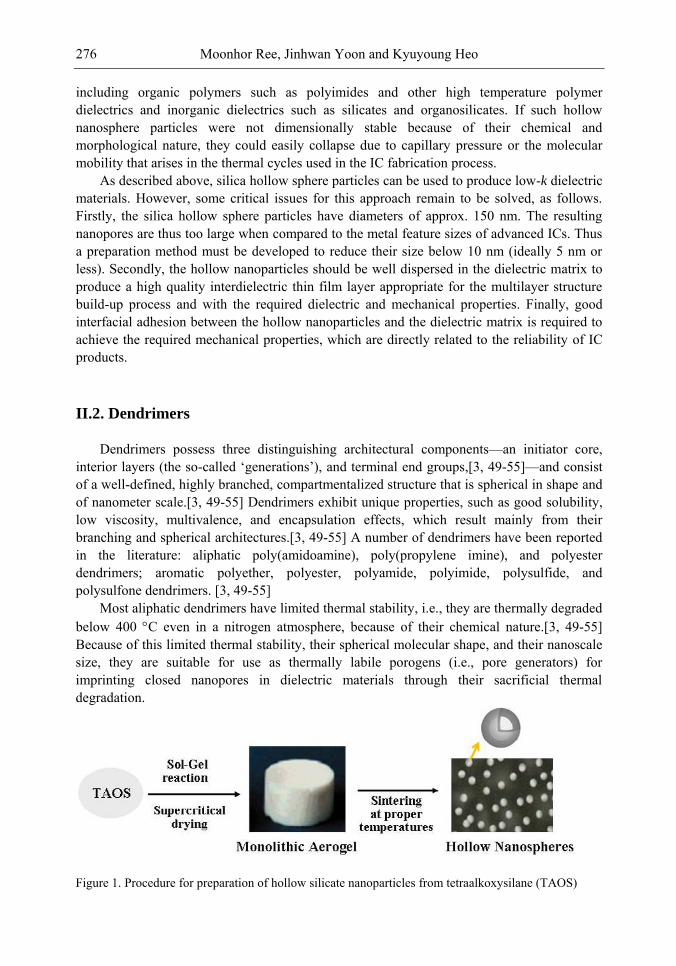
Moonhor Ree, Jinhwan Yoon and Kyuyoung Heo 276
including organic polymers such as polyimides and other high temperature polymer dielectrics and inorganic dielectrics such as silicates and organosilicates. If such hollow nanosphere particles were not dimensionally stable because of their chemical and morphological nature, they could easily collapse due to capillary pressure or the molecular mobility that arises in the thermal cycles used in the IC fabrication process.
As described above, silica hollow sphere particles can be used to produce low-k dielectric materials. However, some critical issues for this approach remain to be solved, as follows. Firstly, the silica hollow sphere particles have diameters of approx. 150 nm. The resulting nanopores are thus too large when compared to the metal feature sizes of advanced ICs. Thus a preparation method must be developed to reduce their size below 10 nm (ideally 5 nm or less). Secondly, the hollow nanoparticles should be well dispersed in the dielectric matrix to produce a high quality interdielectric thin film layer appropriate for the multilayer structure build-up process and with the required dielectric and mechanical properties. Finally, good interfacial adhesion between the hollow nanoparticles and the dielectric matrix is required to achieve the required mechanical properties, which are directly related to the reliability of IC products.
II.2. Dendrimers
Dendrimers possess three distinguishing architectural components—an initiator core, interior layers (the so-called ‗generations‘), and terminal end groups,[3, 49-55]—and consist of a well-defined, highly branched, compartmentalized structure that is spherical in shape and of nanometer scale.[3, 49-55] Dendrimers exhibit unique properties, such as good solubility, low viscosity, multivalence, and encapsulation effects, which result mainly from their branching and spherical architectures.[3, 49-55] A number of dendrimers have been reported in the literature: aliphatic poly(amidoamine), poly(propylene imine), and polyester dendrimers; aromatic polyether, polyester, polyamide, polyimide, polysulfide, and polysulfone dendrimers. [3, 49-55]
Most aliphatic dendrimers have limited thermal stability, i.e., they are thermally degraded below 400 C even in a nitrogen atmosphere, because of their chemical nature.[3, 49-55] Because of this limited thermal stability, their spherical molecular shape, and their nanoscale size, they are suitable for use as thermally labile porogens (i.e., pore generators) for imprinting closed nanopores in dielectric materials through their sacrificial thermal degradation.
Figure 1. Procedure for preparation of hollow silicate nanoparticles from tetraalkoxysilane (TAOS)
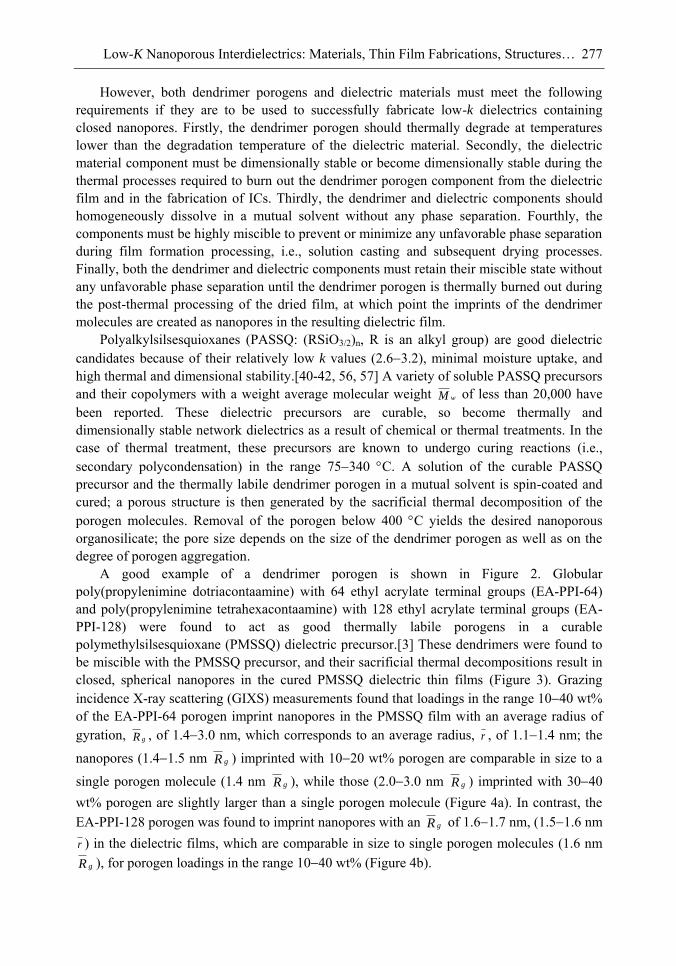
Low-K Nanoporous Interdielectrics: Materials, Thin Film Fabrications, Structures… 277
However, both dendrimer porogens and dielectric materials must meet the following requirements if they are to be used to successfully fabricate low-k dielectrics containing closed nanopores. Firstly, the dendrimer porogen should thermally degrade at temperatures lower than the degradation temperature of the dielectric material. Secondly, the dielectric material component must be dimensionally stable or become dimensionally stable during the thermal processes required to burn out the dendrimer porogen component from the dielectric film and in the fabrication of ICs. Thirdly, the dendrimer and dielectric components should homogeneously dissolve in a mutual solvent without any phase separation. Fourthly, the components must be highly miscible to prevent or minimize any unfavorable phase separation during film formation processing, i.e., solution casting and subsequent drying processes. Finally, both the dendrimer and dielectric components must retain their miscible state without any unfavorable phase separation until the dendrimer porogen is thermally burned out during the post-thermal processing of the dried film, at which point the imprints of the dendrimer molecules are created as nanopores in the resulting dielectric film.
Polyalkylsilsesquioxanes (PASSQ: (RSiO3/2)n, R is an alkyl group) are good dielectric candidates because of their relatively low k values (2.63.2), minimal moisture uptake, and high thermal and dimensional stability.[40-42, 56, 57] A variety of soluble PASSQ precursors and their copolymers with a weight average molecular weight wM of less than 20,000 have been reported. These dielectric precursors are curable, so become thermally and dimensionally stable network dielectrics as a result of chemical or thermal treatments. In the case of thermal treatment, these precursors are known to undergo curing reactions (i.e., secondary polycondensation) in the range 75340 C. A solution of the curable PASSQ precursor and the thermally labile dendrimer porogen in a mutual solvent is spin-coated and cured; a porous structure is then generated by the sacrificial thermal decomposition of the porogen molecules. Removal of the porogen below 400 C yields the desired nanoporous organosilicate; the pore size depends on the size of the dendrimer porogen as well as on the degree of porogen aggregation.
A good example of a dendrimer porogen is shown in Figure 2. Globular poly(propylenimine dotriacontaamine) with 64 ethyl acrylate terminal groups (EA-PPI-64) and poly(propylenimine tetrahexacontaamine) with 128 ethyl acrylate terminal groups (EA-PPI-128) were found to act as good thermally labile porogens in a curable polymethylsilsesquioxane (PMSSQ) dielectric precursor.[3] These dendrimers were found to be miscible with the PMSSQ precursor, and their sacrificial thermal decompositions result in closed, spherical nanopores in the cured PMSSQ dielectric thin films (Figure 3). Grazing incidence X-ray scattering (GIXS) measurements found that loadings in the range 1040 wt% of the EA-PPI-64 porogen imprint nanopores in the PMSSQ film with an average radius of gyration, gR , of 1.43.0 nm, which corresponds to an average radius, r , of 1.11.4 nm; the
nanopores (1.41.5 nm gR ) imprinted with 1020 wt% porogen are comparable in size to a
single porogen molecule (1.4 nm gR ), while those (2.03.0 nm gR ) imprinted with 3040 wt% porogen are slightly larger than a single porogen molecule (Figure 4a). In contrast, the EA-PPI-128 porogen was found to imprint nanopores with an gR of 1.61.7 nm, (1.51.6 nm r ) in the dielectric films, which are comparable in size to single porogen molecules (1.6 nm
gR ), for porogen loadings in the range 1040 wt% (Figure 4b).
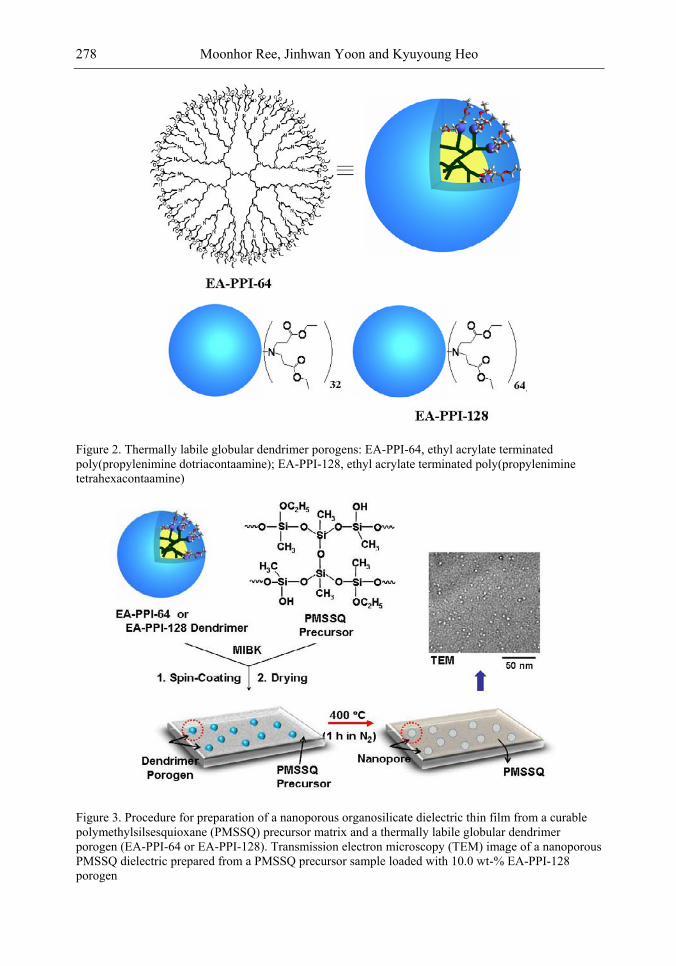
Moonhor Ree, Jinhwan Yoon and Kyuyoung Heo 278
Figure 2. Thermally labile globular dendrimer porogens: EA-PPI-64, ethyl acrylate terminated poly(propylenimine dotriacontaamine); EA-PPI-128, ethyl acrylate terminated poly(propylenimine tetrahexacontaamine)
Figure 3. Procedure for preparation of a nanoporous organosilicate dielectric thin film from a curable polymethylsilsesquioxane (PMSSQ) precursor matrix and a thermally labile globular dendrimer porogen (EA-PPI-64 or EA-PPI-128). Transmission electron microscopy (TEM) image of a nanoporous PMSSQ dielectric prepared from a PMSSQ precursor sample loaded with 10.0 wt-% EA-PPI-128 porogen
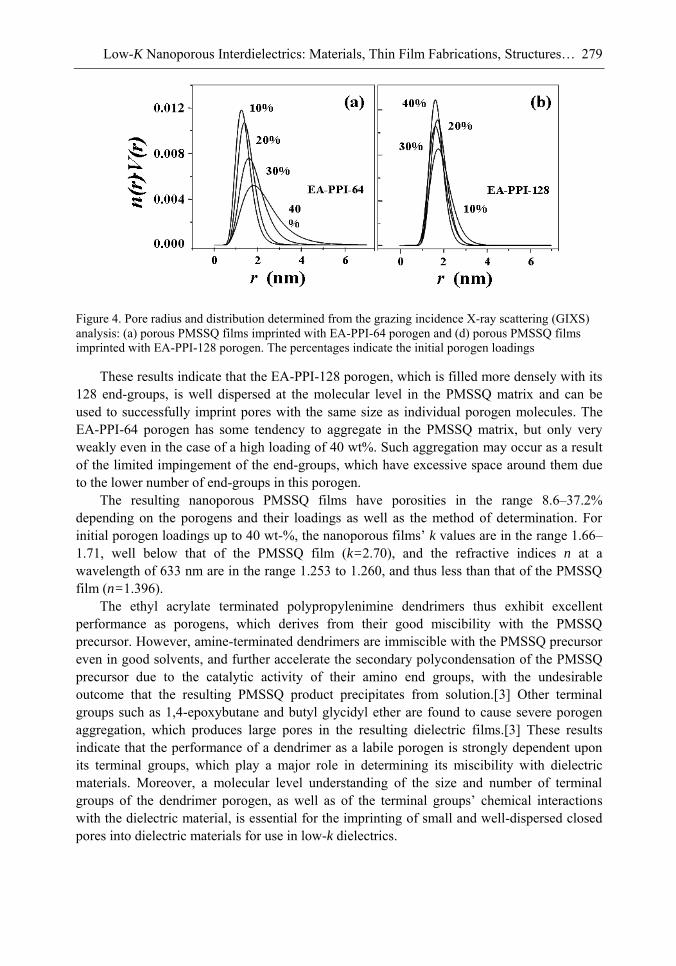
Low-K Nanoporous Interdielectrics: Materials, Thin Film Fabrications, Structures… 279
Figure 4. Pore radius and distribution determined from the grazing incidence X-ray scattering (GIXS) analysis: (a) porous PMSSQ films imprinted with EA-PPI-64 porogen and (d) porous PMSSQ films imprinted with EA-PPI-128 porogen. The percentages indicate the initial porogen loadings
These results indicate that the EA-PPI-128 porogen, which is filled more densely with its 128 end-groups, is well dispersed at the molecular level in the PMSSQ matrix and can be used to successfully imprint pores with the same size as individual porogen molecules. The EA-PPI-64 porogen has some tendency to aggregate in the PMSSQ matrix, but only very weakly even in the case of a high loading of 40 wt%. Such aggregation may occur as a result of the limited impingement of the end-groups, which have excessive space around them due to the lower number of end-groups in this porogen.
The resulting nanoporous PMSSQ films have porosities in the range 8.6–37.2% depending on the porogens and their loadings as well as the method of determination. For initial porogen loadings up to 40 wt-%, the nanoporous films‘ k values are in the range 1.66–
1.71, well below that of the PMSSQ film (k=2.70), and the refractive indices n at a wavelength of 633 nm are in the range 1.253 to 1.260, and thus less than that of the PMSSQ film (n=1.396).
The ethyl acrylate terminated polypropylenimine dendrimers thus exhibit excellent performance as porogens, which derives from their good miscibility with the PMSSQ precursor. However, amine-terminated dendrimers are immiscible with the PMSSQ precursor even in good solvents, and further accelerate the secondary polycondensation of the PMSSQ precursor due to the catalytic activity of their amino end groups, with the undesirable outcome that the resulting PMSSQ product precipitates from solution.[3] Other terminal groups such as 1,4-epoxybutane and butyl glycidyl ether are found to cause severe porogen aggregation, which produces large pores in the resulting dielectric films.[3] These results indicate that the performance of a dendrimer as a labile porogen is strongly dependent upon its terminal groups, which play a major role in determining its miscibility with dielectric materials. Moreover, a molecular level understanding of the size and number of terminal groups of the dendrimer porogen, as well as of the terminal groups‘ chemical interactions with the dielectric material, is essential for the imprinting of small and well-dispersed closed pores into dielectric materials for use in low-k dielectrics.
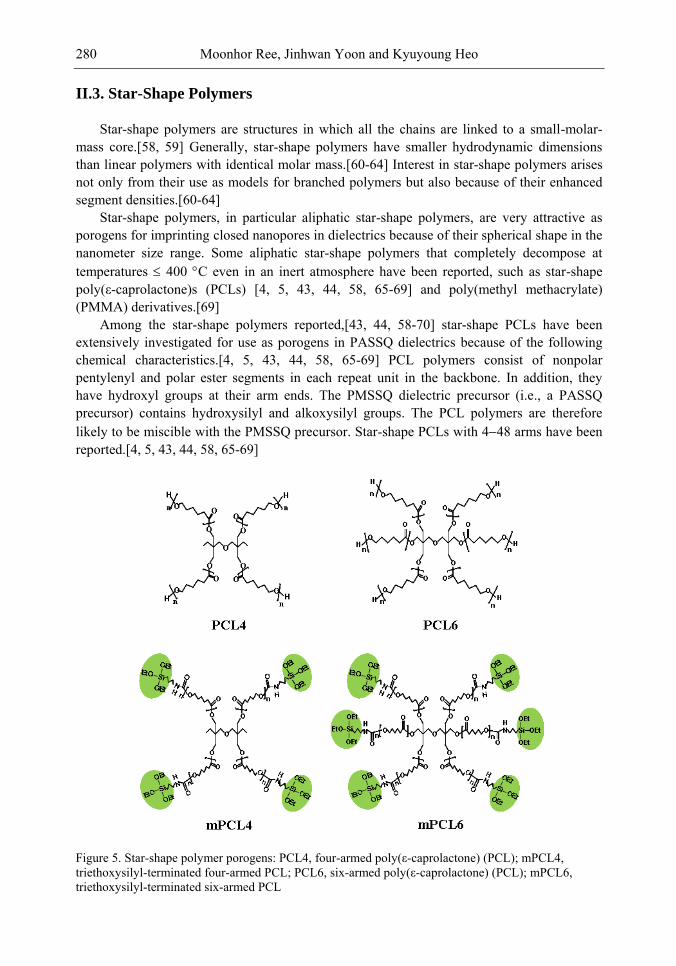
Moonhor Ree, Jinhwan Yoon and Kyuyoung Heo 280
II.3. Star-Shape Polymers
Star-shape polymers are structures in which all the chains are linked to a small-molar-mass core.[58, 59] Generally, star-shape polymers have smaller hydrodynamic dimensions than linear polymers with identical molar mass.[60-64] Interest in star-shape polymers arises not only from their use as models for branched polymers but also because of their enhanced segment densities.[60-64]
Star-shape polymers, in particular aliphatic star-shape polymers, are very attractive as porogens for imprinting closed nanopores in dielectrics because of their spherical shape in the nanometer size range. Some aliphatic star-shape polymers that completely decompose at temperatures 400 C even in an inert atmosphere have been reported, such as star-shape poly(ε-caprolactone)s (PCLs) [4, 5, 43, 44, 58, 65-69] and poly(methyl methacrylate) (PMMA) derivatives.[69]
Among the star-shape polymers reported,[43, 44, 58-70] star-shape PCLs have been extensively investigated for use as porogens in PASSQ dielectrics because of the following chemical characteristics.[4, 5, 43, 44, 58, 65-69] PCL polymers consist of nonpolar pentylenyl and polar ester segments in each repeat unit in the backbone. In addition, they have hydroxyl groups at their arm ends. The PMSSQ dielectric precursor (i.e., a PASSQ precursor) contains hydroxysilyl and alkoxysilyl groups. The PCL polymers are therefore likely to be miscible with the PMSSQ precursor. Star-shape PCLs with 448 arms have been reported.[4, 5, 43, 44, 58, 65-69]
Figure 5. Star-shape polymer porogens: PCL4, four-armed poly(ε-caprolactone) (PCL); mPCL4, triethoxysilyl-terminated four-armed PCL; PCL6, six-armed poly(ε-caprolactone) (PCL); mPCL6, triethoxysilyl-terminated six-armed PCL
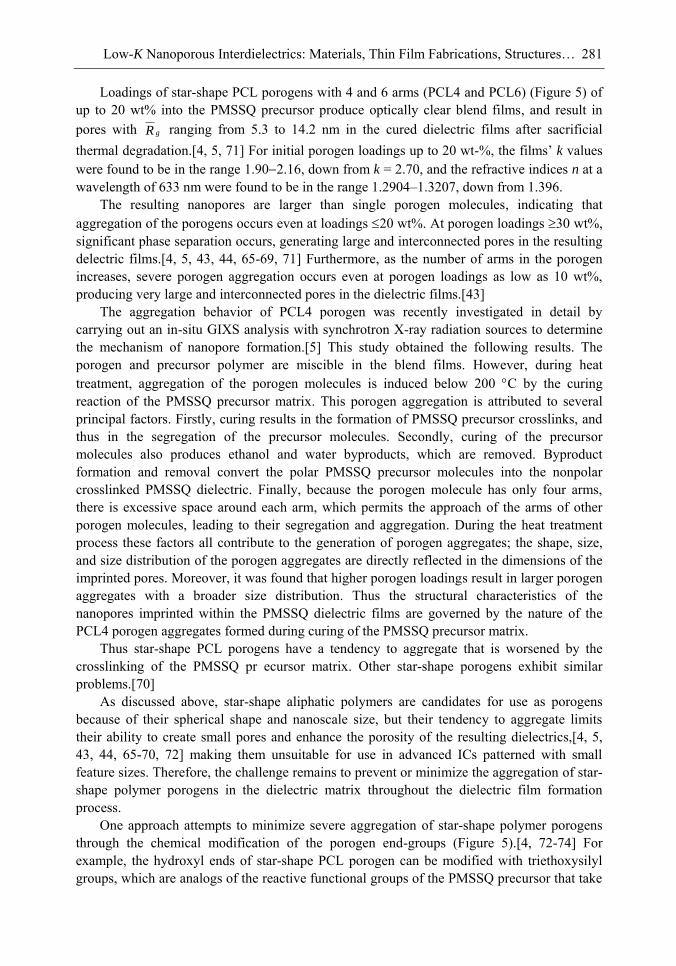
Low-K Nanoporous Interdielectrics: Materials, Thin Film Fabrications, Structures… 281
Loadings of star-shape PCL porogens with 4 and 6 arms (PCL4 and PCL6) (Figure 5) of up to 20 wt% into the PMSSQ precursor produce optically clear blend films, and result in pores with gR ranging from 5.3 to 14.2 nm in the cured dielectric films after sacrificial thermal degradation.[4, 5, 71] For initial porogen loadings up to 20 wt-%, the films‘ k values were found to be in the range 1.902.16, down from k = 2.70, and the refractive indices n at a wavelength of 633 nm were found to be in the range 1.2904–1.3207, down from 1.396.
The resulting nanopores are larger than single porogen molecules, indicating that aggregation of the porogens occurs even at loadings 20 wt%. At porogen loadings 30 wt%, significant phase separation occurs, generating large and interconnected pores in the resulting delectric films.[4, 5, 43, 44, 65-69, 71] Furthermore, as the number of arms in the porogen increases, severe porogen aggregation occurs even at porogen loadings as low as 10 wt%, producing very large and interconnected pores in the dielectric films.[43]
The aggregation behavior of PCL4 porogen was recently investigated in detail by carrying out an in-situ GIXS analysis with synchrotron X-ray radiation sources to determine the mechanism of nanopore formation.[5] This study obtained the following results. The porogen and precursor polymer are miscible in the blend films. However, during heat treatment, aggregation of the porogen molecules is induced below 200 C by the curing reaction of the PMSSQ precursor matrix. This porogen aggregation is attributed to several principal factors. Firstly, curing results in the formation of PMSSQ precursor crosslinks, and thus in the segregation of the precursor molecules. Secondly, curing of the precursor molecules also produces ethanol and water byproducts, which are removed. Byproduct formation and removal convert the polar PMSSQ precursor molecules into the nonpolar crosslinked PMSSQ dielectric. Finally, because the porogen molecule has only four arms, there is excessive space around each arm, which permits the approach of the arms of other porogen molecules, leading to their segregation and aggregation. During the heat treatment process these factors all contribute to the generation of porogen aggregates; the shape, size, and size distribution of the porogen aggregates are directly reflected in the dimensions of the imprinted pores. Moreover, it was found that higher porogen loadings result in larger porogen aggregates with a broader size distribution. Thus the structural characteristics of the nanopores imprinted within the PMSSQ dielectric films are governed by the nature of the PCL4 porogen aggregates formed during curing of the PMSSQ precursor matrix.
Thus star-shape PCL porogens have a tendency to aggregate that is worsened by the crosslinking of the PMSSQ pr ecursor matrix. Other star-shape porogens exhibit similar problems.[70]
As discussed above, star-shape aliphatic polymers are candidates for use as porogens because of their spherical shape and nanoscale size, but their tendency to aggregate limits their ability to create small pores and enhance the porosity of the resulting dielectrics,[4, 5, 43, 44, 65-70, 72] making them unsuitable for use in advanced ICs patterned with small feature sizes. Therefore, the challenge remains to prevent or minimize the aggregation of star-shape polymer porogens in the dielectric matrix throughout the dielectric film formation process.
One approach attempts to minimize severe aggregation of star-shape polymer porogens through the chemical modification of the porogen end-groups (Figure 5).[4, 72-74] For example, the hydroxyl ends of star-shape PCL porogen can be modified with triethoxysilyl groups, which are analogs of the reactive functional groups of the PMSSQ precursor that take
Moonhor Ree, Jinhwan Yoon and Kyuyoung Heo 282
part in curing reactions during thermal treatment. GIXS analysis found that triethoxysilyl-terminated PCL4 (mPCL4) can be used to imprint nanopores with gR of 5.217.1 nm in
PMSSQ dielectric films for 1040 wt% loadings.[72, 73] The nanopores (5.210.0 nm gR ) imprinted with 1020 wt% mPCL4 are comparable in size to those created with 1020 wt% loadings of the corresponding PCL4 porogen; however, the pores (15.117.1 nm gR ) imprinted with 3040 wt% mPCL4 are much smaller than those generated with the same loadings of the corresponding PCL4 porogen. The nanoporous films were found tohave porosities in the range 5.825.6% for 1030 wt% porogen loadings. For initial porogen loadings up to 30 wt-%, the film‘s k value is 1.95, down from k = 2.70, and the refractive index n at a wavelength of 633 nm is 1.2921, down from 1.396.
In the case of triethoxysilyl-terminated PCL6 (mPCL6), the thermal degradation of the porogen was found to imprint nanopores with gR in the range 5.812.5 nm in PMSSQ dielectric films, depending on the porogen loading in the range 1040 wt%; these pores are much smaller than those created with the corresponding PCL6 porogen (Figure 6).[4, 74] The nanoporous films were found to have porosities in the range 7.839.7%, depending on the porogen loading. For initial porogen loadings up to 40 wt-%, the films‘ k value is 1.67, down from k = 2.70.
Overall, the use of triethoxysilyl-terminated PCL porogens significantly reduces the aggregation of the porogen molecules for loadings up to 40 wt% in the PMSSQ dielectric throughout the entire film formation process. These results highlight the potential of triethoxysilyl-modification of end groups as a means of preventing severe aggregation of star-shape polymer porogens with large numbers of arms in the preparation of low-k nanoporous organosilicate dielectrics.
Figure 6. Pore radius and distribution determined from the grazing incidence X-ray scattering (GIXS) analysis: porous PMSSQ films imprinted with PCL6 and mPCL6 porogens. The porous film samples are labelled according to the initial porogen loading in weight per cent: for example, mPCL6-40 correspond to the porous film prepared with 40 wt% mPCL6 porogen
Low-K Nanoporous Interdielectrics: Materials, Thin Film Fabrications, Structures… 283
II.4. Hyperbranched Polymers
Aliphatic hyperbranched polymers are thermally degradable below 400 C. They can be synthesized with a molecular size of a few nanometers or less. Further, they have relatively high numbers of end groups, which can favorably interact with dielectric materials such PASSQ precursors. Because of these molecular characteristics, hyperbranched aliphatic polymers have been considered as another porogen candidate for templating nanopores in PASSQ dielectrics.
Hyperbranched poly(-caprolactone)s (PCLs) are typical of this class of porogen.[43, 68, 69, 75] Hyperbranched PCLs are more soluble and less crystalline than star-shape PCLs. They have been successfully loaded at concentrations up to 30 wt% into PMSSQ precursor films.[44, 75] Scanning electron microscopy (SEM) was used to show that the resulting pores had a size of 20 nm (i.e., a radius of 10 nm).[75] These results indicate that hyperbranched PCL porogens are more miscible with the PMSSQ precursor matrix than star-shape PCL porogens, and generate smaller pores in the cured dielectric films than star-shape PCLs.[44, 75] The nanoporous films prepared with a porogen loading of 30 wt% were found to have a k value of 2.0.
A block copolymer of hyperbranched PCLs, hyperbranched poly(ε-caprolactone-b-methyl methacrylate), has been described, which can be synthesized by either sequential or concurrent polymerization of γ-(ε-caprolactone)-2-bromo-2-dimethyl-propionate with 2-hydroxyethyl methacrylate in the presence of ε-caprolactone and methyl methacrylate.[83, 84] This hyperbranched block copolymer can be loaded at concentrations up to 30 wt% into PMSSQ precursor films. Transmission electron microscopy (TEM) measurements found that the resulting nanopores had an average size of 8 nm (a radius of 4 nm). This pore size is slightly smaller than that of nanopores imprinted with hyperbranched PCLs. The nanoporous dielectric films imprinted with a porogen loading of 30 wt% were found to have a k value of 2.1.
For these hyperbranched PCLs and their block copolymers, the maximum porogen loading is 30 wt%, i.e., there is a limitation on the loading of these hyperbranched polymer porogens into dielectric films and on the minimum achievable size of the imprinted pores.
Trimethylsilylated hyperbranched polymers have also been used as porogens. They are synthesized via the pseudo one pot polycondensation of 2,2-bis-hydroxymethyl propionic acid with a tetrafunctional ethoxylated pentaerythritol core and subsequent end-group modification with chlorotrimethylsilane (Figure 7).[78] These porogens have been successfully loaded at concentrations up to 40 wt% into PMSSQ precursor films. However, the sizes of imprinted pores range from 15 to 60 nm (i.e., a radius of 7.530 nm) depending on the initial porogen loading as well as the number of generations in the hyperbranched polymers. Further, the imprinted pore sizes depend on the degree of trimethylsilylation in the intially loaded porogen; high trimethylsilylation in the porogen significantly reduces the size of the imprinted pores. The porogens with no trimethylsilylation are found to generate very large pores: pores of size >>100 nm are generated depending on the porogen loading.
New hyperbranched polymer porogens based on aliphatic polyethers have recently been prepared and tested as porogens in a copolymer of PMSSQ precursor, poly(methylsilsequioxane-co-1,4-bis(ethylsilsesquioxane)-benzene) (PMSSQ-BESSQB), which exhibits better properties than PMSSQ dielectrics.[79] The new porogens are
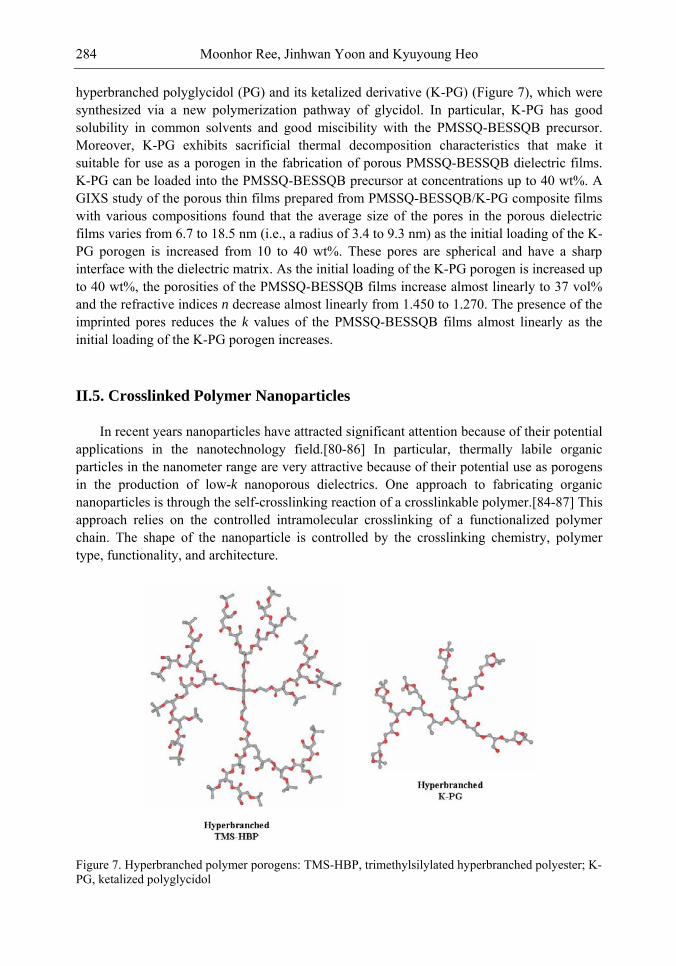
Moonhor Ree, Jinhwan Yoon and Kyuyoung Heo 284
hyperbranched polyglycidol (PG) and its ketalized derivative (K-PG) (Figure 7), which were synthesized via a new polymerization pathway of glycidol. In particular, K-PG has good solubility in common solvents and good miscibility with the PMSSQ-BESSQB precursor. Moreover, K-PG exhibits sacrificial thermal decomposition characteristics that make it suitable for use as a porogen in the fabrication of porous PMSSQ-BESSQB dielectric films. K-PG can be loaded into the PMSSQ-BESSQB precursor at concentrations up to 40 wt%. A GIXS study of the porous thin films prepared from PMSSQ-BESSQB/K-PG composite films with various compositions found that the average size of the pores in the porous dielectric films varies from 6.7 to 18.5 nm (i.e., a radius of 3.4 to 9.3 nm) as the initial loading of the K-PG porogen is increased from 10 to 40 wt%. These pores are spherical and have a sharp interface with the dielectric matrix. As the initial loading of the K-PG porogen is increased up to 40 wt%, the porosities of the PMSSQ-BESSQB films increase almost linearly to 37 vol% and the refractive indices n decrease almost linearly from 1.450 to 1.270. The presence of the imprinted pores reduces the k values of the PMSSQ-BESSQB films almost linearly as the initial loading of the K-PG porogen increases.
II.5. Crosslinked Polymer Nanoparticles
In recent years nanoparticles have attracted significant attention because of their potential applications in the nanotechnology field.[80-86] In particular, thermally labile organic particles in the nanometer range are very attractive because of their potential use as porogens in the production of low-k nanoporous dielectrics. One approach to fabricating organic nanoparticles is through the self-crosslinking reaction of a crosslinkable polymer.[84-87] This approach relies on the controlled intramolecular crosslinking of a functionalized polymer chain. The shape of the nanoparticle is controlled by the crosslinking chemistry, polymer type, functionality, and architecture.
Figure 7. Hyperbranched polymer porogens: TMS-HBP, trimethylsilylated hyperbranched polyester; K-PG, ketalized polyglycidol
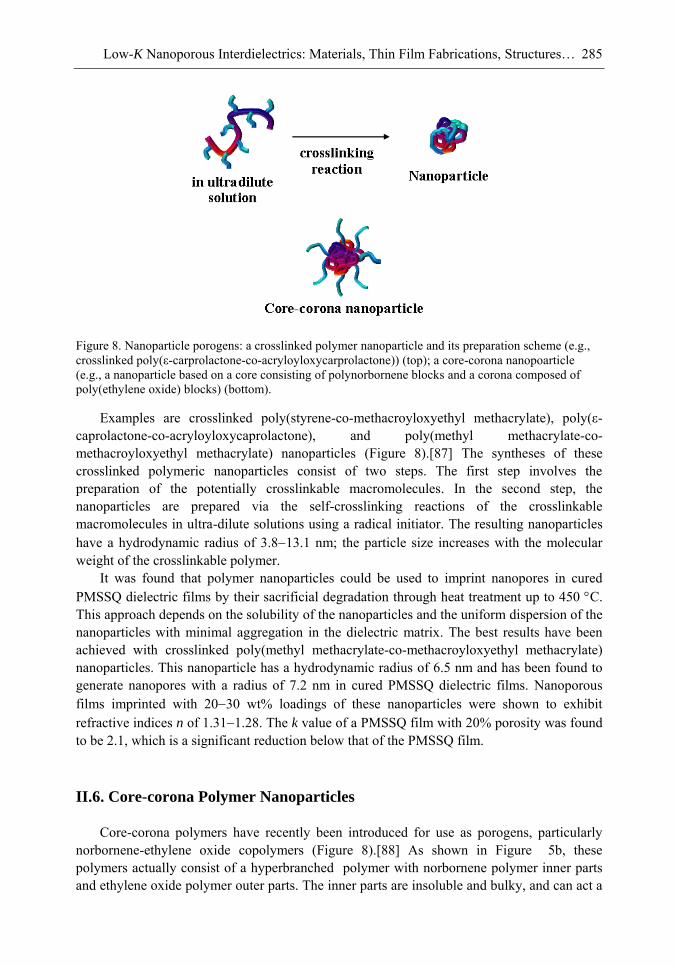
Low-K Nanoporous Interdielectrics: Materials, Thin Film Fabrications, Structures… 285
Figure 8. Nanoparticle porogens: a crosslinked polymer nanoparticle and its preparation scheme (e.g., crosslinked poly(ε-carprolactone-co-acryloyloxycarprolactone)) (top); a core-corona nanopoarticle (e.g., a nanoparticle based on a core consisting of polynorbornene blocks and a corona composed of poly(ethylene oxide) blocks) (bottom).
Examples are crosslinked poly(styrene-co-methacroyloxyethyl methacrylate), poly(ε-caprolactone-co-acryloyloxycaprolactone), and poly(methyl methacrylate-co-methacroyloxyethyl methacrylate) nanoparticles (Figure 8).[87] The syntheses of these crosslinked polymeric nanoparticles consist of two steps. The first step involves the preparation of the potentially crosslinkable macromolecules. In the second step, the nanoparticles are prepared via the self-crosslinking reactions of the crosslinkable macromolecules in ultra-dilute solutions using a radical initiator. The resulting nanoparticles have a hydrodynamic radius of 3.813.1 nm; the particle size increases with the molecular weight of the crosslinkable polymer.
It was found that polymer nanoparticles could be used to imprint nanopores in cured PMSSQ dielectric films by their sacrificial degradation through heat treatment up to 450 C. This approach depends on the solubility of the nanoparticles and the uniform dispersion of the nanoparticles with minimal aggregation in the dielectric matrix. The best results have been achieved with crosslinked poly(methyl methacrylate-co-methacroyloxyethyl methacrylate) nanoparticles. This nanoparticle has a hydrodynamic radius of 6.5 nm and has been found to generate nanopores with a radius of 7.2 nm in cured PMSSQ dielectric films. Nanoporous films imprinted with 2030 wt% loadings of these nanoparticles were shown to exhibit refractive indices n of 1.311.28. The k value of a PMSSQ film with 20% porosity was found to be 2.1, which is a significant reduction below that of the PMSSQ film.
II.6. Core-corona Polymer Nanoparticles
Core-corona polymers have recently been introduced for use as porogens, particularly norbornene-ethylene oxide copolymers (Figure 8).[88] As shown in Figure 5b, these polymers actually consist of a hyperbranched polymer with norbornene polymer inner parts and ethylene oxide polymer outer parts. The inner parts are insoluble and bulky, and can act a
Moonhor Ree, Jinhwan Yoon and Kyuyoung Heo 286
core in solution as well as in a dielectric matrix. The outer parts are polar and soluble, and can act as a corona to favorably interact with the solvent as well as with the dielectric matrix. The outer corona renders the insoluble core compatible with the dielectric matrix and suppresses aggregation and precipitation of the insoluble interior.
Core-corona polymers have been synthesized with diameters of 1020 nm, depending on the sizes and fractions of the core and corona parts. They are dissolved in a solution with the PMSSQ precursor and the resulting solution is spun onto substrates and thermally treated at 450 C to produce porous PMSSQ dielectric films. A TEM study has found that pores are generated with a size of 1020 nm in the dielectric films, depending on the porogens and their initial loadings; the imprinted pores are comparable in size to the core-corona polymer nanoparticles. The k value of the resulting dielectric film has been found to decrease from 2.8 to 1.7 with increases in the porogen loading up to 50 wt%.
Other core-corona molecules is octa(2,4-dinitrophenyl)-silssesquioxane (ODNPSQ), which consists of one cubic Si8O12 core covered by eight dinitrophenyl groups as corona. Due to the lipophilic character of 2,4-dinitrophenyl group, this porogen show good miscibility with polyphenylsilsesquioxane (PPSQ), resulting porous spin-on thin film after sacrificial thermal degradation at 450 oC. With the 40% of porogen loading, porous film show low water absorption of 0.45% and low dielectric cnstant of 1.93.[89]
II.7. Linear Polymers
Various linear aliphatic homo- and co-polymers have been investigated as porogens for producing nanoporous dielectrics: linear homopolymers,[90, 91] random copolymers,[45, 92-95] amphiphilic diblock copolymers,[96, 97] and triblock copolymers.[98-100]
Representative homopolymer porogens are poly(alkylene ether)s (e.g., poly(ethylene oxide) (PEO) and poly(propylene oxide) (PPO)) and polyesters (e.g., poly(-caprolactone) (PCL) and poly(lactic acid) (PLA)).[90, 91] However, these polymers exhibit very limited miscibility with PASSQ precursors, which results in severe phase separation depending on their loading levels, and in large, interconnected pores in cured PASSQ dielectrics.
One example of a random copolymer porogen is poly(methyl methacrylate-co-dimethylaminoethyl methacrylate) (P(MMA-co-DMAEMA)), which was synthesized via the radical copolymerization of methyl methacrylate and N,N-dimethylamino ethyl methacrylate.[43, 92, 94] The tertiary amino group in the DMAEMA component of the copolymer favorably interacts with the functional groups (i.e., hydroxysilyl groups) of the PASSQ precursor via strong hydrogen bonding, and thus its presence results good miscibility with the precursor, but it also catalyzes the polycondensation (i.e., sol-gel reaction) of the precursor even at room temperature, causing phase separation and precipitation of the precursor. Because of this dual functionality, the incorporation of the DMAEMA component is restricted to loadings less than 15 mol%, which produces a copolymer miscible with the PASSQ precursor (e.g., PMSSQ precursor) and ultimately generates small pores in cured dielectrics by sacrificial degradation through thermal treatment at 400450 C. At a porogen loading of 40 wt%, the k value of the resulting porous dielectric film is decreased to 1.95, which is less than that of PMSSQ dielectrics (k=2.70).[92] Small angle X-ray scattering (SAXS) and prism coupling measurements on the resulting porous dielectric films showed
Low-K Nanoporous Interdielectrics: Materials, Thin Film Fabrications, Structures… 287
that for initial porogen loadings in the range 550 wt%, the pore sizes range from 2 to 10 nm, the porosities range from 5 to 50 %, and the refractive indices at 633 nm range from 1.35 to 1.21.[45, 92] However, with increases in the porosity, the pore size increases and the pore size distribution broadens, indicating that the generated pores change from closed-cell structures to interconnected bicontinuous structures, which is attributed to changes in the phase separation of the blends of the porogen and matrix components with changes in the blend composition.[45] The pore size and size distribution are also found to be affected by the numbers of hydroxylsilyl and alkoxysilyl groups in the PMSSQ precursor. Moreover, neutron reflectivity measurements on these porous films found localized higher porosities at the interface between the porous films and their silicon substrates.[94]
Poly(styrene-b-2-vinylpyridine) (PS-b-P2VP) is an example of an amphiphilic diblock copolymer porogen; the P2VP block fraction ranges from 26 to 65 mol%.[97] As for P(MMA-co-DMAEMA), PS-b-P2VP porogens exhibit good miscibility with PMSSQ precursor via hydrogen bonding interactions between the pyridine rings of the P2VP block in the porogen and the hydroxysilyl groups of the precursor, and can be used to produce small pores in cured dielectric films. As the initial loading of the diblock copolymers is increased up to 60 wt%, the refractive indices n of the resulting porous PMSSQ films decrease almost linearly from 1.361 to 1.139. SAXS analysis found that nanopores with an average size of 11.6 nm were generated in PMSSQ films imprinted with 30 wt% porogen loading.
Poly(ethylene oxide-b-propylene oxide-b-ethylene oxide) (PEO-b-PPO-b-PEO) has been tested as an amphiphilic triblock copolymer nanopore template in PMSSQ dielectrics.[98, 100] Positronium annihilation lifetime spectroscopy (PALS) measurements on the resulting porous dielectric films found that closed pores are generated at porogen loadings 20 wt% but that interconnected pores are imprinted for porogen loadings >20 wt%. Small angle neutron scattering (SANS) and PALS observations showed that nanopores with sizes in the range 2.25.2 nm were generated, depending on the initial porogen loading. The k value was reduced to 1.5 and the porosity increased to 53% as the initial porogen loading was increased to 50 wt%.
Poly(styrene-b-3-trimethoxysilylpropyl methacrylate) (PS-b-PMSMA: the numbers of repeat units are 118 for the PS block and 12 for the PMSMA block) was synthesized as a reactive linear block copolymer porogen and then tested in a PMSSQ precursor.[96] For initial porogen loadings up to 50 wt-%, the PMSSQ film‘s k value was found to decrease to 1.84, down from k = 2.70, and the refractive index n at a wavelength of 633 nm was found to decrease to 1.226, down from 1.354. Atomic force microscopy (AFM) and TEM observations found that for 1050 wt% porogen loadings, pores 5.212.7 nm in size were generated in the dielectric films. These pores are smaller than those (5.420.4 nm) imprinted with the same loading of poly(styrene-b-acrylic acid) (PS-b-PAA: the numbers of repeat units are 30 for the PS block and 58 for the PAA block). However, the reduction in pore size achieved by using this reactive block copolymer is not significant.
II.8. Cage Supramolecules
Cyclodextrins (CDs) are cyclic oligosaccharides consisting of at least six glucopyranose units joined together by an α-linkage: α-cyclodextrin (α-CD) (6 glucose units), β-cyclodextrin
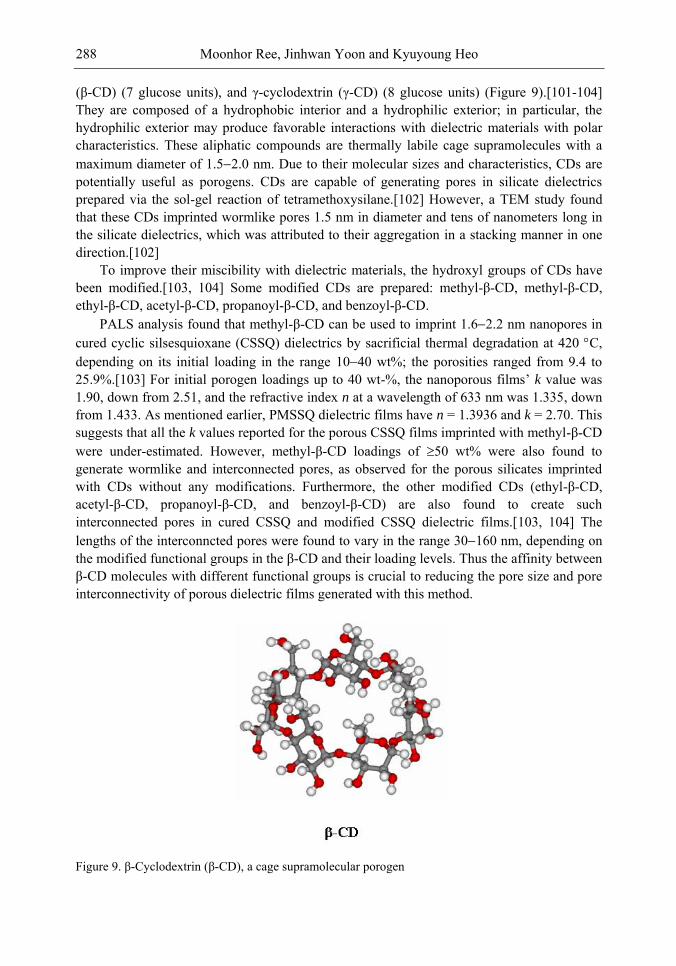
Moonhor Ree, Jinhwan Yoon and Kyuyoung Heo 288
(β-CD) (7 glucose units), and γ-cyclodextrin (γ-CD) (8 glucose units) (Figure 9).[101-104] They are composed of a hydrophobic interior and a hydrophilic exterior; in particular, the hydrophilic exterior may produce favorable interactions with dielectric materials with polar characteristics. These aliphatic compounds are thermally labile cage supramolecules with a maximum diameter of 1.52.0 nm. Due to their molecular sizes and characteristics, CDs are potentially useful as porogens. CDs are capable of generating pores in silicate dielectrics prepared via the sol-gel reaction of tetramethoxysilane.[102] However, a TEM study found that these CDs imprinted wormlike pores 1.5 nm in diameter and tens of nanometers long in the silicate dielectrics, which was attributed to their aggregation in a stacking manner in one direction.[102]
To improve their miscibility with dielectric materials, the hydroxyl groups of CDs have been modified.[103, 104] Some modified CDs are prepared: methyl-β-CD, methyl-β-CD, ethyl-β-CD, acetyl-β-CD, propanoyl-β-CD, and benzoyl-β-CD.
PALS analysis found that methyl-β-CD can be used to imprint 1.62.2 nm nanopores in cured cyclic silsesquioxane (CSSQ) dielectrics by sacrificial thermal degradation at 420 C, depending on its initial loading in the range 1040 wt%; the porosities ranged from 9.4 to 25.9%.[103] For initial porogen loadings up to 40 wt-%, the nanoporous films‘ k value was 1.90, down from 2.51, and the refractive index n at a wavelength of 633 nm was 1.335, down from 1.433. As mentioned earlier, PMSSQ dielectric films have n = 1.3936 and k = 2.70. This suggests that all the k values reported for the porous CSSQ films imprinted with methyl-β-CD were under-estimated. However, methyl-β-CD loadings of 50 wt% were also found to generate wormlike and interconnected pores, as observed for the porous silicates imprinted with CDs without any modifications. Furthermore, the other modified CDs (ethyl-β-CD, acetyl-β-CD, propanoyl-β-CD, and benzoyl-β-CD) are also found to create such interconnected pores in cured CSSQ and modified CSSQ dielectric films.[103, 104] The lengths of the interconncted pores were found to vary in the range 30160 nm, depending on the modified functional groups in the β-CD and their loading levels. Thus the affinity between β-CD molecules with different functional groups is crucial to reducing the pore size and pore interconnectivity of porous dielectric films generated with this method.
Figure 9. β-Cyclodextrin (β-CD), a cage supramolecular porogen
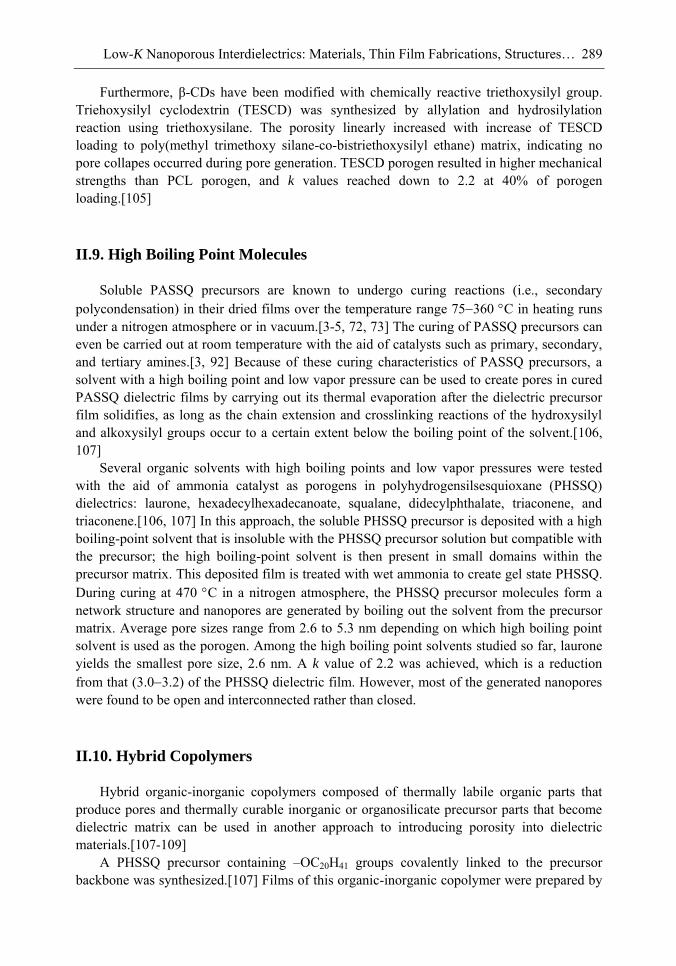
Low-K Nanoporous Interdielectrics: Materials, Thin Film Fabrications, Structures… 289
Furthermore, β-CDs have been modified with chemically reactive triethoxysilyl group. Triehoxysilyl cyclodextrin (TESCD) was synthesized by allylation and hydrosilylation reaction using triethoxysilane. The porosity linearly increased with increase of TESCD loading to poly(methyl trimethoxy silane-co-bistriethoxysilyl ethane) matrix, indicating no pore collapes occurred during pore generation. TESCD porogen resulted in higher mechanical strengths than PCL porogen, and k values reached down to 2.2 at 40% of porogen loading.[105]
II.9. High Boiling Point Molecules
Soluble PASSQ precursors are known to undergo curing reactions (i.e., secondary polycondensation) in their dried films over the temperature range 75360 C in heating runs under a nitrogen atmosphere or in vacuum.[3-5, 72, 73] The curing of PASSQ precursors can even be carried out at room temperature with the aid of catalysts such as primary, secondary, and tertiary amines.[3, 92] Because of these curing characteristics of PASSQ precursors, a solvent with a high boiling point and low vapor pressure can be used to create pores in cured PASSQ dielectric films by carrying out its thermal evaporation after the dielectric precursor film solidifies, as long as the chain extension and crosslinking reactions of the hydroxysilyl and alkoxysilyl groups occur to a certain extent below the boiling point of the solvent.[106, 107]
Several organic solvents with high boiling points and low vapor pressures were tested with the aid of ammonia catalyst as porogens in polyhydrogensilsesquioxane (PHSSQ) dielectrics: laurone, hexadecylhexadecanoate, squalane, didecylphthalate, triaconene, and triaconene.[106, 107] In this approach, the soluble PHSSQ precursor is deposited with a high boiling-point solvent that is insoluble with the PHSSQ precursor solution but compatible with the precursor; the high boiling-point solvent is then present in small domains within the precursor matrix. This deposited film is treated with wet ammonia to create gel state PHSSQ. During curing at 470 C in a nitrogen atmosphere, the PHSSQ precursor molecules form a network structure and nanopores are generated by boiling out the solvent from the precursor matrix. Average pore sizes range from 2.6 to 5.3 nm depending on which high boiling point solvent is used as the porogen. Among the high boiling point solvents studied so far, laurone yields the smallest pore size, 2.6 nm. A k value of 2.2 was achieved, which is a reduction from that (3.03.2) of the PHSSQ dielectric film. However, most of the generated nanopores were found to be open and interconnected rather than closed.
II.10. Hybrid Copolymers
Hybrid organic-inorganic copolymers composed of thermally labile organic parts that produce pores and thermally curable inorganic or organosilicate precursor parts that become dielectric matrix can be used in another approach to introducing porosity into dielectric materials.[107-109]
A PHSSQ precursor containing –OC20H41 groups covalently linked to the precursor backbone was synthesized.[107] Films of this organic-inorganic copolymer were prepared by
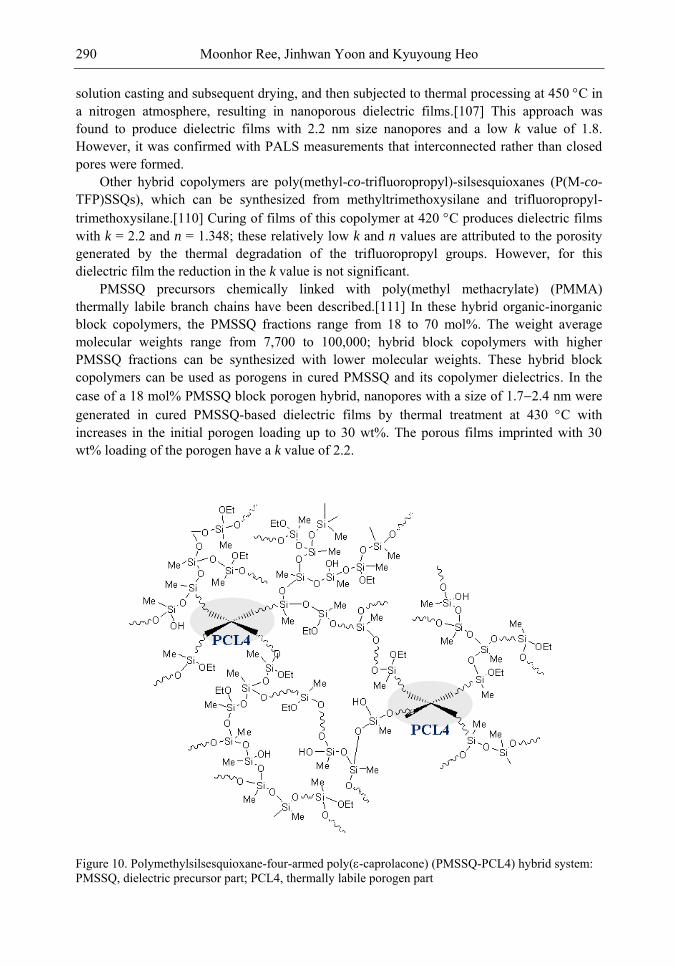
Moonhor Ree, Jinhwan Yoon and Kyuyoung Heo 290
solution casting and subsequent drying, and then subjected to thermal processing at 450 C in a nitrogen atmosphere, resulting in nanoporous dielectric films.[107] This approach was found to produce dielectric films with 2.2 nm size nanopores and a low k value of 1.8. However, it was confirmed with PALS measurements that interconnected rather than closed pores were formed.
Other hybrid copolymers are poly(methyl-co-trifluoropropyl)-silsesquioxanes (P(M-co-TFP)SSQs), which can be synthesized from methyltrimethoxysilane and trifluoropropyl-trimethoxysilane.[110] Curing of films of this copolymer at 420 C produces dielectric films with k = 2.2 and n = 1.348; these relatively low k and n values are attributed to the porosity generated by the thermal degradation of the trifluoropropyl groups. However, for this dielectric film the reduction in the k value is not significant.
PMSSQ precursors chemically linked with poly(methyl methacrylate) (PMMA) thermally labile branch chains have been described.[111] In these hybrid organic-inorganic block copolymers, the PMSSQ fractions range from 18 to 70 mol%. The weight average molecular weights range from 7,700 to 100,000; hybrid block copolymers with higher PMSSQ fractions can be synthesized with lower molecular weights. These hybrid block copolymers can be used as porogens in cured PMSSQ and its copolymer dielectrics. In the case of a 18 mol% PMSSQ block porogen hybrid, nanopores with a size of 1.72.4 nm were generated in cured PMSSQ-based dielectric films by thermal treatment at 430 C with increases in the initial porogen loading up to 30 wt%. The porous films imprinted with 30 wt% loading of the porogen have a k value of 2.2.
Figure 10. Polymethylsilsesquioxane-four-armed poly(-caprolacone) (PMSSQ-PCL4) hybrid system: PMSSQ, dielectric precursor part; PCL4, thermally labile porogen part
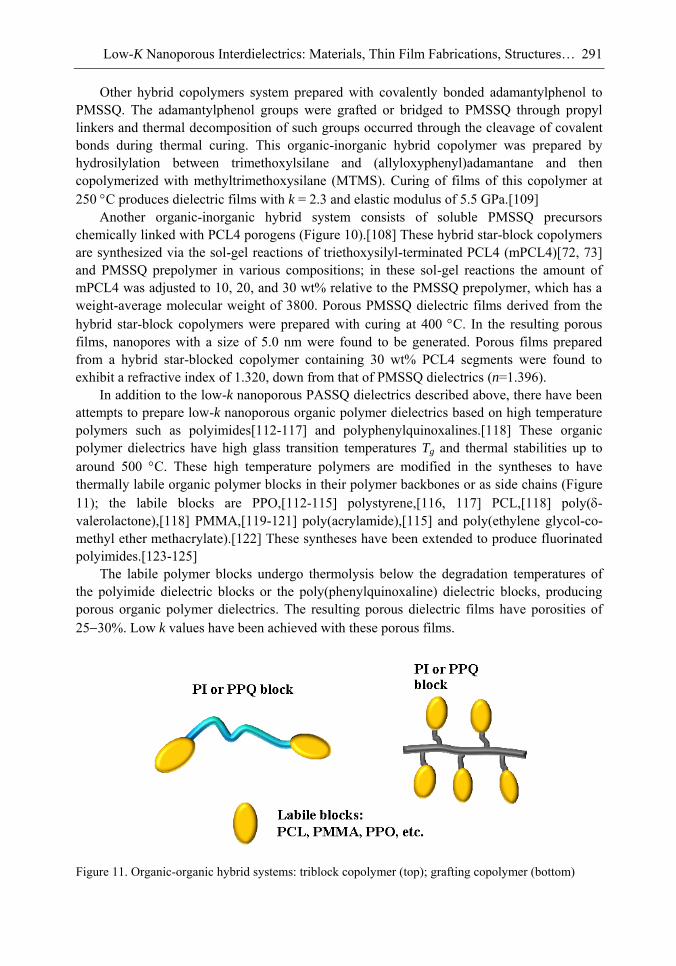
Low-K Nanoporous Interdielectrics: Materials, Thin Film Fabrications, Structures… 291
Other hybrid copolymers system prepared with covalently bonded adamantylphenol to PMSSQ. The adamantylphenol groups were grafted or bridged to PMSSQ through propyl linkers and thermal decomposition of such groups occurred through the cleavage of covalent bonds during thermal curing. This organic-inorganic hybrid copolymer was prepared by hydrosilylation between trimethoxylsilane and (allyloxyphenyl)adamantane and then copolymerized with methyltrimethoxysilane (MTMS). Curing of films of this copolymer at 250 C produces dielectric films with k = 2.3 and elastic modulus of 5.5 GPa.[109]
Another organic-inorganic hybrid system consists of soluble PMSSQ precursors chemically linked with PCL4 porogens (Figure 10).[108] These hybrid star-block copolymers are synthesized via the sol-gel reactions of triethoxysilyl-terminated PCL4 (mPCL4)[72, 73] and PMSSQ prepolymer in various compositions; in these sol-gel reactions the amount of mPCL4 was adjusted to 10, 20, and 30 wt% relative to the PMSSQ prepolymer, which has a weight-average molecular weight of 3800. Porous PMSSQ dielectric films derived from the hybrid star-block copolymers were prepared with curing at 400 C. In the resulting porous films, nanopores with a size of 5.0 nm were found to be generated. Porous films prepared from a hybrid star-blocked copolymer containing 30 wt% PCL4 segments were found to exhibit a refractive index of 1.320, down from that of PMSSQ dielectrics (n=1.396).
In addition to the low-k nanoporous PASSQ dielectrics described above, there have been attempts to prepare low-k nanoporous organic polymer dielectrics based on high temperature polymers such as polyimides[112-117] and polyphenylquinoxalines.[118] These organic polymer dielectrics have high glass transition temperatures Tg and thermal stabilities up to around 500 C. These high temperature polymers are modified in the syntheses to have thermally labile organic polymer blocks in their polymer backbones or as side chains (Figure 11); the labile blocks are PPO,[112-115] polystyrene,[116, 117] PCL,[118] poly(-valerolactone),[118] PMMA,[119-121] poly(acrylamide),[115] and poly(ethylene glycol-co-methyl ether methacrylate).[122] These syntheses have been extended to produce fluorinated polyimides.[123-125]
The labile polymer blocks undergo thermolysis below the degradation temperatures of the polyimide dielectric blocks or the poly(phenylquinoxaline) dielectric blocks, producing porous organic polymer dielectrics. The resulting porous dielectric films have porosities of 2530%. Low k values have been achieved with these porous films.
Figure 11. Organic-organic hybrid systems: triblock copolymer (top); grafting copolymer (bottom)
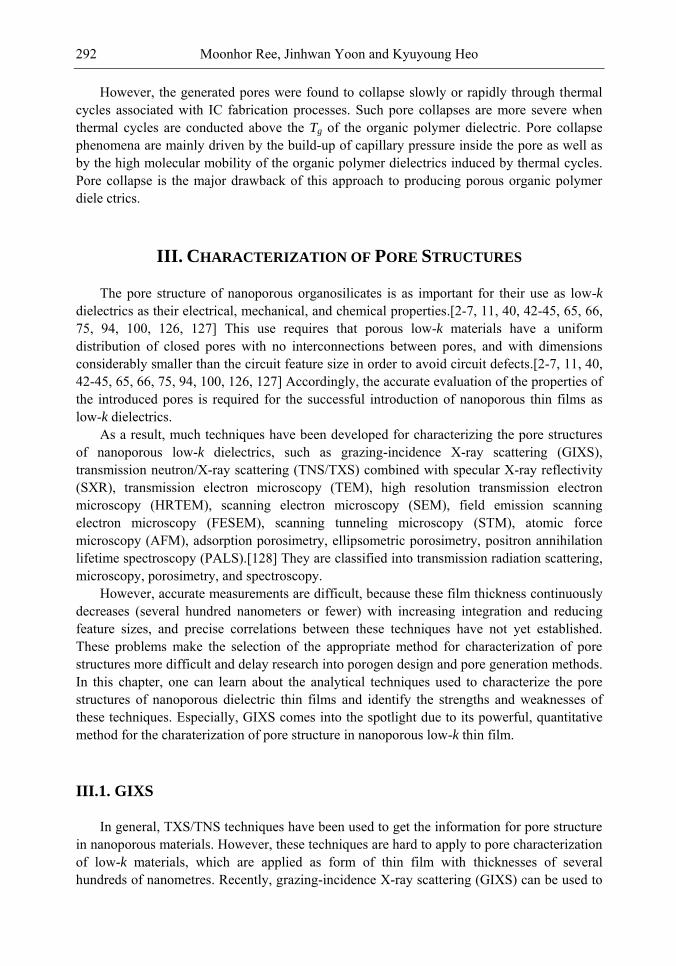
Moonhor Ree, Jinhwan Yoon and Kyuyoung Heo 292
However, the generated pores were found to collapse slowly or rapidly through thermal cycles associated with IC fabrication processes. Such pore collapses are more severe when thermal cycles are conducted above the Tg of the organic polymer dielectric. Pore collapse phenomena are mainly driven by the build-up of capillary pressure inside the pore as well as by the high molecular mobility of the organic polymer dielectrics induced by thermal cycles. Pore collapse is the major drawback of this approach to producing porous organic polymer diele ctrics.
III. CHARACTERIZATION OF PORE STRUCTURES
The pore structure of nanoporous organosilicates is as important for their use as low-k dielectrics as their electrical, mechanical, and chemical properties.[2-7, 11, 40, 42-45, 65, 66, 75, 94, 100, 126, 127] This use requires that porous low-k materials have a uniform distribution of closed pores with no interconnections between pores, and with dimensions considerably smaller than the circuit feature size in order to avoid circuit defects.[2-7, 11, 40, 42-45, 65, 66, 75, 94, 100, 126, 127] Accordingly, the accurate evaluation of the properties of the introduced pores is required for the successful introduction of nanoporous thin films as low-k dielectrics.
As a result, much techniques have been developed for characterizing the pore structures of nanoporous low-k dielectrics, such as grazing-incidence X-ray scattering (GIXS), transmission neutron/X-ray scattering (TNS/TXS) combined with specular X-ray reflectivity (SXR), transmission electron microscopy (TEM), high resolution transmission electron microscopy (HRTEM), scanning electron microscopy (SEM), field emission scanning electron microscopy (FESEM), scanning tunneling microscopy (STM), atomic force microscopy (AFM), adsorption porosimetry, ellipsometric porosimetry, positron annihilation lifetime spectroscopy (PALS).[128] They are classified into transmission radiation scattering, microscopy, porosimetry, and spectroscopy.
However, accurate measurements are difficult, because these film thickness continuously decreases (several hundred nanometers or fewer) with increasing integration and reducing feature sizes, and precise correlations between these techniques have not yet established. These problems make the selection of the appropriate method for characterization of pore structures more difficult and delay research into porogen design and pore generation methods. In this chapter, one can learn about the analytical techniques used to characterize the pore structures of nanoporous dielectric thin films and identify the strengths and weaknesses of these techniques. Especially, GIXS comes into the spotlight due to its powerful, quantitative method for the charaterization of pore structure in nanoporous low-k thin film.
III.1. GIXS
In general, TXS/TNS techniques have been used to get the information for pore structure in nanoporous materials. However, these techniques are hard to apply to pore characterization of low-k materials, which are applied as form of thin film with thicknesses of several hundreds of nanometres. Recently, grazing-incidence X-ray scattering (GIXS) can be used to
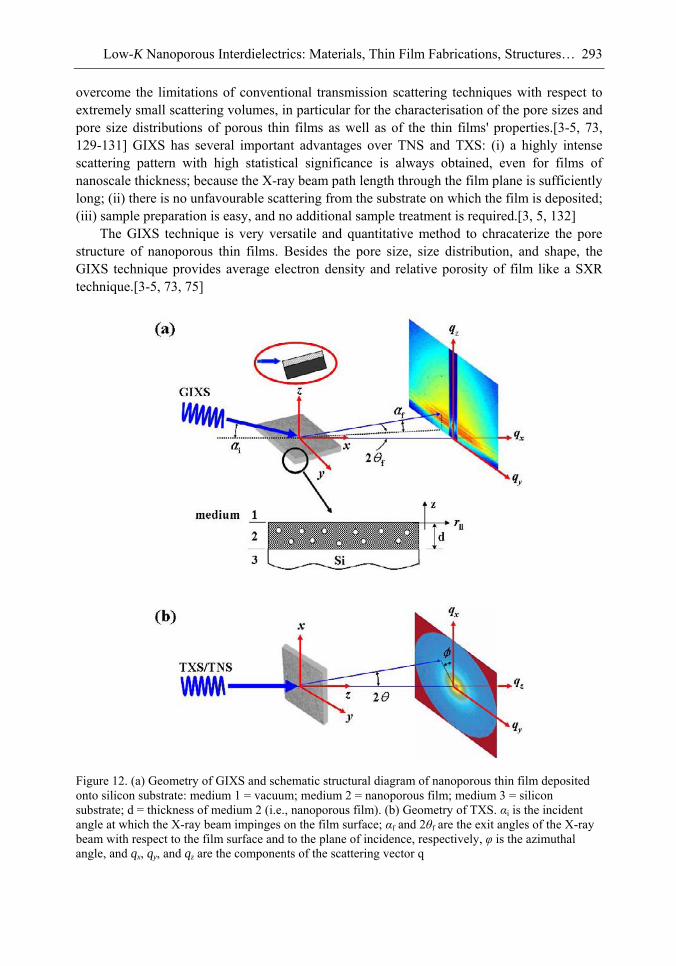
Low-K Nanoporous Interdielectrics: Materials, Thin Film Fabrications, Structures… 293
overcome the limitations of conventional transmission scattering techniques with respect to extremely small scattering volumes, in particular for the characterisation of the pore sizes and pore size distributions of porous thin films as well as of the thin films' properties.[3-5, 73, 129-131] GIXS has several important advantages over TNS and TXS: (i) a highly intense scattering pattern with high statistical significance is always obtained, even for films of nanoscale thickness; because the X-ray beam path length through the film plane is sufficiently long; (ii) there is no unfavourable scattering from the substrate on which the film is deposited; (iii) sample preparation is easy, and no additional sample treatment is required.[3, 5, 132]
The GIXS technique is very versatile and quantitative method to chracaterize the pore structure of nanoporous thin films. Besides the pore size, size distribution, and shape, the GIXS technique provides average electron density and relative porosity of film like a SXR technique.[3-5, 73, 75]
Figure 12. (a) Geometry of GIXS and schematic structural diagram of nanoporous thin film deposited onto silicon substrate: medium 1 = vacuum; medium 2 = nanoporous film; medium 3 = silicon substrate; d = thickness of medium 2 (i.e., nanoporous film). (b) Geometry of TXS. αi is the incident angle at which the X-ray beam impinges on the film surface; αf and 2θf are the exit angles of the X-ray beam with respect to the film surface and to the plane of incidence, respectively, φ is the azimuthal angle, and qx, qy, and qz are the components of the scattering vector q
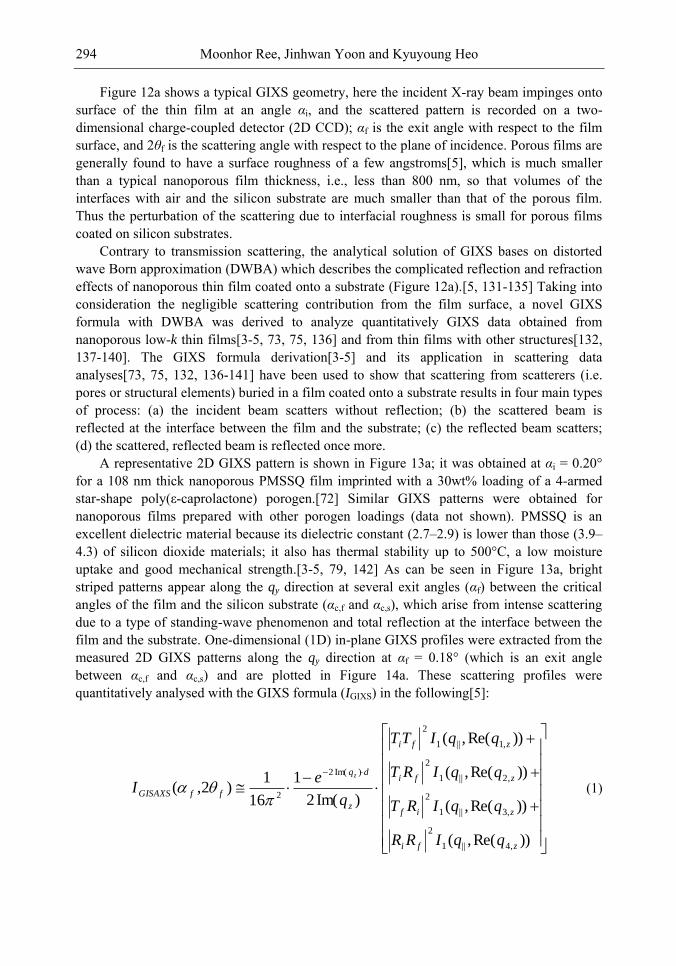
Moonhor Ree, Jinhwan Yoon and Kyuyoung Heo 294
Figure 12a shows a typical GIXS geometry, here the incident X-ray beam impinges onto surface of the thin film at an angle αi, and the scattered pattern is recorded on a two-dimensional charge-coupled detector (2D CCD); αf is the exit angle with respect to the film surface, and 2θf is the scattering angle with respect to the plane of incidence. Porous films are generally found to have a surface roughness of a few angstroms[5], which is much smaller than a typical nanoporous film thickness, i.e., less than 800 nm, so that volumes of the interfaces with air and the silicon substrate are much smaller than that of the porous film. Thus the perturbation of the scattering due to interfacial roughness is small for porous films coated on silicon substrates.
Contrary to transmission scattering, the analytical solution of GIXS bases on distorted wave Born approximation (DWBA) which describes the complicated reflection and refraction effects of nanoporous thin film coated onto a substrate (Figure 12a).[5, 131-135] Taking into consideration the negligible scattering contribution from the film surface, a novel GIXS formula with DWBA was derived to analyze quantitatively GIXS data obtained from nanoporous low-k thin films[3-5, 73, 75, 136] and from thin films with other structures[132, 137-140]. The GIXS formula derivation[3-5] and its application in scattering data analyses[73, 75, 132, 136-141] have been used to show that scattering from scatterers (i.e. pores or structural elements) buried in a film coated onto a substrate results in four main types of process: (a) the incident beam scatters without reflection; (b) the scattered beam is reflected at the interface between the film and the substrate; (c) the reflected beam scatters; (d) the scattered, reflected beam is reflected once more.
A representative 2D GIXS pattern is shown in Figure 13a; it was obtained at αi = 0.20° for a 108 nm thick nanoporous PMSSQ film imprinted with a 30wt% loading of a 4-armed star-shape poly(ε-caprolactone) porogen.[72] Similar GIXS patterns were obtained for nanoporous films prepared with other porogen loadings (data not shown). PMSSQ is an excellent dielectric material because its dielectric constant (2.7–2.9) is lower than those (3.9–
4.3) of silicon dioxide materials; it also has thermal stability up to 500°C, a low moisture uptake and good mechanical strength.[3-5, 79, 142] As can be seen in Figure 13a, bright striped patterns appear along the qy direction at several exit angles (αf) between the critical angles of the film and the silicon substrate (αc,f and αc,s), which arise from intense scattering due to a type of standing-wave phenomenon and total reflection at the interface between the film and the substrate. One-dimensional (1D) in-plane GIXS profiles were extracted from the measured 2D GIXS patterns along the qy direction at αf = 0.18° (which is an exit angle between αc,f and αc,s) and are plotted in Figure 14a. These scattering profiles were quantitatively analysed with the GIXS formula (IGIXS) in the following[5]:
))Re(,(
))Re(,(
))Re(,(
))Re(,(
)Im(2
1
16
1)2,(
,4||1
2
,3||1
2
,2||1
2
,1||1
2
)Im(2
2
zfi
zif
zfi
zfi
z
dq
ffGISAXS
qqIRR
qqIRT
qqIRT
qqITT
q
eI
z
(1)
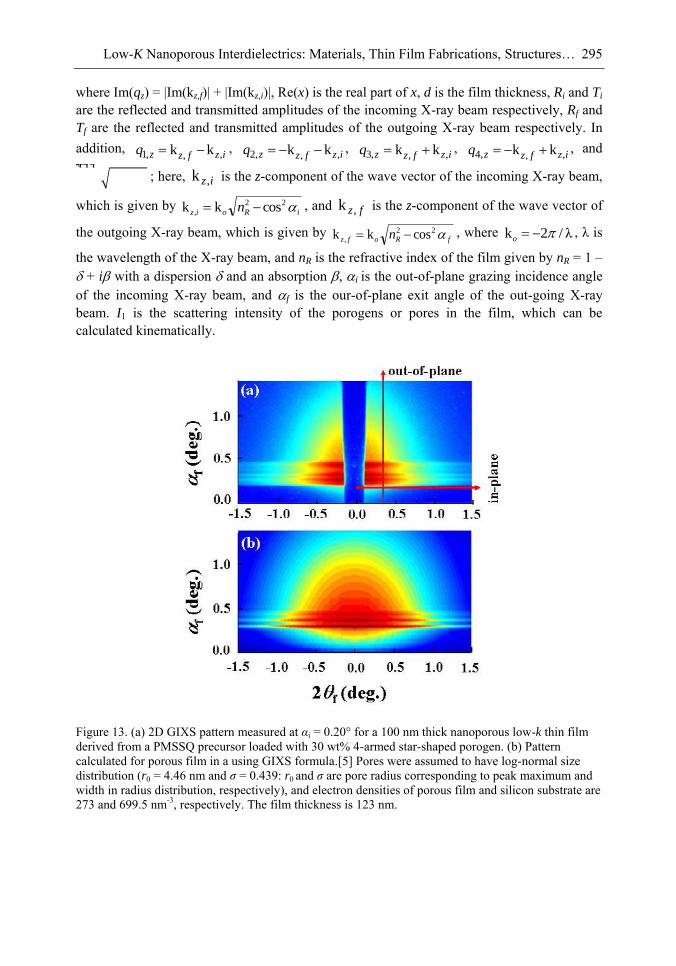
Low-K Nanoporous Interdielectrics: Materials, Thin Film Fabrications, Structures… 295
where Im(qz) = |Im(kz,f)| + |Im(kz,i)|, Re(x) is the real part of x, d is the film thickness, Ri and Ti are the reflected and transmitted amplitudes of the incoming X-ray beam respectively, Rf and Tf are the reflected and transmitted amplitudes of the outgoing X-ray beam respectively. In addition,
izfzzq ,,,1 kk , izfzzq ,,,2 kk ,
izfzzq ,,,3 kk , izfzzq ,,,4 kk , and
22||xyqqq
; here, iz,k is the z-component of the wave vector of the incoming X-ray beam,
which is given by iRoiz n 22
, coskk , and fz,k is the z-component of the wave vector of
the outgoing X-ray beam, which is given by fRofz n 22
, coskk , where k 2 / λo , λ is
the wavelength of the X-ray beam, and nR is the refractive index of the film given by nR = 1 – + i with a dispersion and an absorption , i is the out-of-plane grazing incidence angle of the incoming X-ray beam, and f is the our-of-plane exit angle of the out-going X-ray beam. I1 is the scattering intensity of the porogens or pores in the film, which can be calculated kinematically.
Figure 13. (a) 2D GIXS pattern measured at αi = 0.20° for a 100 nm thick nanoporous low-k thin film derived from a PMSSQ precursor loaded with 30 wt% 4-armed star-shaped porogen. (b) Pattern calculated for porous film in a using GIXS formula.[5] Pores were assumed to have log-normal size distribution (r0 = 4.46 nm and σ = 0.439: r0 and σ are pore radius corresponding to peak maximum and width in radius distribution, respectively), and electron densities of porous film and silicon substrate are 273 and 699.5 nm-3, respectively. The film thickness is 123 nm.
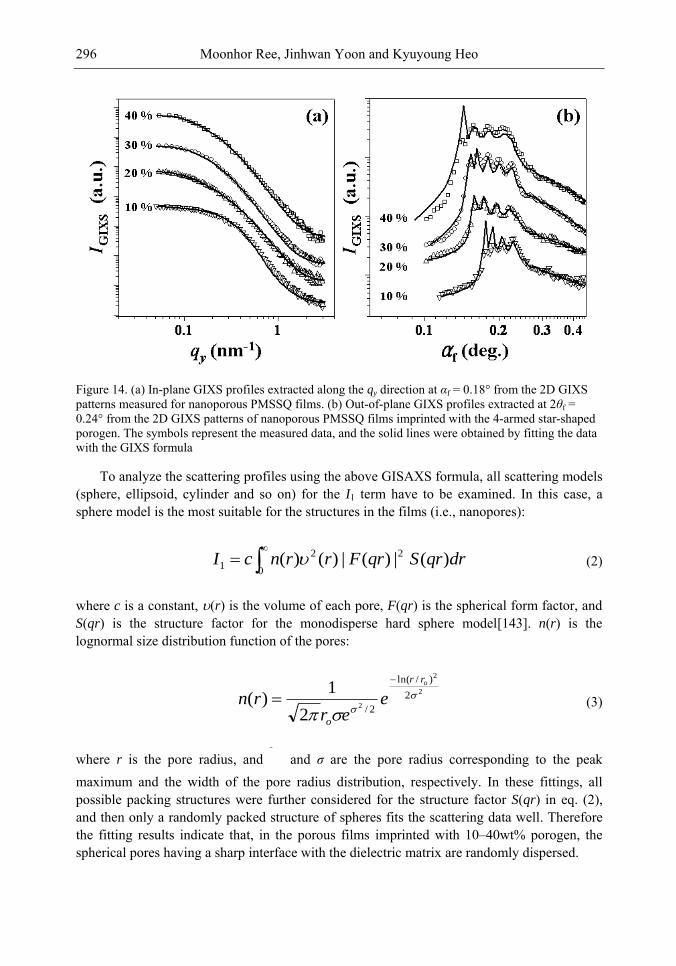
Moonhor Ree, Jinhwan Yoon and Kyuyoung Heo 296
Figure 14. (a) In-plane GIXS profiles extracted along the qy direction at αf = 0.18° from the 2D GIXS patterns measured for nanoporous PMSSQ films. (b) Out-of-plane GIXS profiles extracted at 2θf = 0.24° from the 2D GIXS patterns of nanoporous PMSSQ films imprinted with the 4-armed star-shaped porogen. The symbols represent the measured data, and the solid lines were obtained by fitting the data with the GIXS formula
To analyze the scattering profiles using the above GISAXS formula, all scattering models (sphere, ellipsoid, cylinder and so on) for the I1 term have to be examined. In this case, a sphere model is the most suitable for the structures in the films (i.e., nanopores):
drqrSqrFrrncI )(|)(|)()( 2
0
2
1
(2)
where c is a constant, (r) is the volume of each pore, F(qr) is the spherical form factor, and S(qr) is the structure factor for the monodisperse hard sphere model[143]. n(r) is the lognormal size distribution function of the pores:
2
2
2
2
)/ln(
2/2
1)(
orr
o
eer
rn
(3)
where r is the pore radius, and 0r
and σ are the pore radius corresponding to the peak maximum and the width of the pore radius distribution, respectively. In these fittings, all possible packing structures were further considered for the structure factor S(qr) in eq. (2), and then only a randomly packed structure of spheres fits the scattering data well. Therefore the fitting results indicate that, in the porous films imprinted with 10–40wt% porogen, the spherical pores having a sharp interface with the dielectric matrix are randomly dispersed.
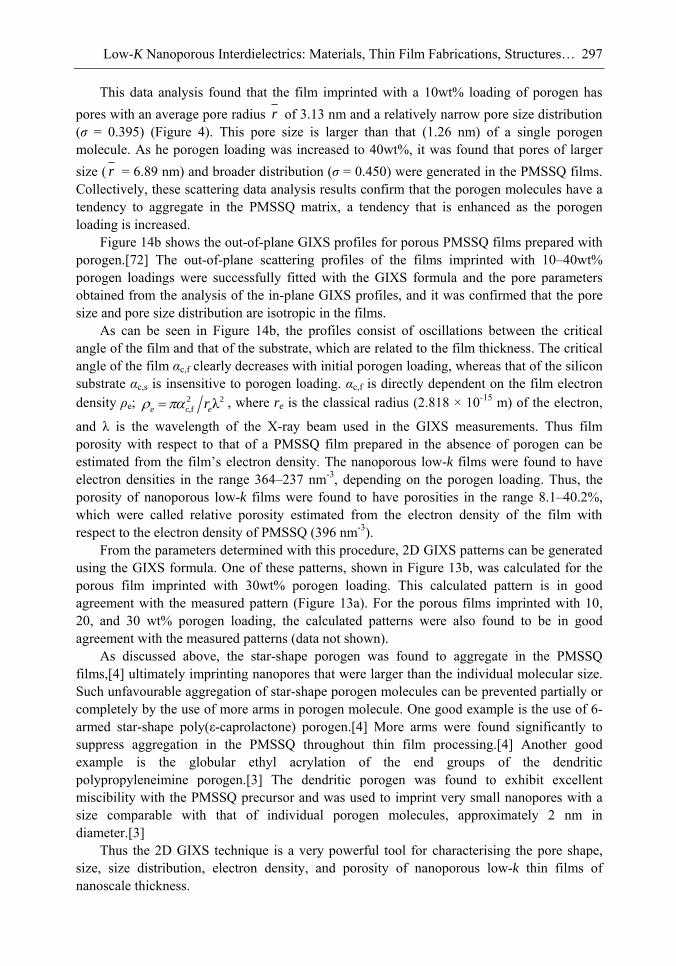
Low-K Nanoporous Interdielectrics: Materials, Thin Film Fabrications, Structures… 297
This data analysis found that the film imprinted with a 10wt% loading of porogen has pores with an average pore radius r of 3.13 nm and a relatively narrow pore size distribution (σ = 0.395) (Figure 4). This pore size is larger than that (1.26 nm) of a single porogen molecule. As he porogen loading was increased to 40wt%, it was found that pores of larger size ( r = 6.89 nm) and broader distribution (σ = 0.450) were generated in the PMSSQ films. Collectively, these scattering data analysis results confirm that the porogen molecules have a tendency to aggregate in the PMSSQ matrix, a tendency that is enhanced as the porogen loading is increased.
Figure 14b shows the out-of-plane GIXS profiles for porous PMSSQ films prepared with porogen.[72] The out-of-plane scattering profiles of the films imprinted with 10–40wt% porogen loadings were successfully fitted with the GIXS formula and the pore parameters obtained from the analysis of the in-plane GIXS profiles, and it was confirmed that the pore size and pore size distribution are isotropic in the films.
As can be seen in Figure 14b, the profiles consist of oscillations between the critical angle of the film and that of the substrate, which are related to the film thickness. The critical angle of the film αc,f clearly decreases with initial porogen loading, whereas that of the silicon substrate αc,s is insensitive to porogen loading. αc,f is directly dependent on the film electron density ρe; 2 2
c,f λe er , where re is the classical radius (2.818 × 10⁻¹⁵ m) of the electron,
and λ is the wavelength of the X-ray beam used in the GIXS measurements. Thus film porosity with respect to that of a PMSSQ film prepared in the absence of porogen can be estimated from the film‘s electron density. The nanoporous low-k films were found to have electron densities in the range 364–237 nm-3, depending on the porogen loading. Thus, the porosity of nanoporous low-k films were found to have porosities in the range 8.1–40.2%, which were called relative porosity estimated from the electron density of the film with respect to the electron density of PMSSQ (396 nm-3).
From the parameters determined with this procedure, 2D GIXS patterns can be generated using the GIXS formula. One of these patterns, shown in Figure 13b, was calculated for the porous film imprinted with 30wt% porogen loading. This calculated pattern is in good agreement with the measured pattern (Figure 13a). For the porous films imprinted with 10, 20, and 30 wt% porogen loading, the calculated patterns were also found to be in good agreement with the measured patterns (data not shown).
As discussed above, the star-shape porogen was found to aggregate in the PMSSQ films,[4] ultimately imprinting nanopores that were larger than the individual molecular size. Such unfavourable aggregation of star-shape porogen molecules can be prevented partially or completely by the use of more arms in porogen molecule. One good example is the use of 6-armed star-shape poly(ε-caprolactone) porogen.[4] More arms were found significantly to suppress aggregation in the PMSSQ throughout thin film processing.[4] Another good example is the globular ethyl acrylation of the end groups of the dendritic polypropyleneimine porogen.[3] The dendritic porogen was found to exhibit excellent miscibility with the PMSSQ precursor and was used to imprint very small nanopores with a size comparable with that of individual porogen molecules, approximately 2 nm in diameter.[3]
Thus the 2D GIXS technique is a very powerful tool for characterising the pore shape, size, size distribution, electron density, and porosity of nanoporous low-k thin films of nanoscale thickness.
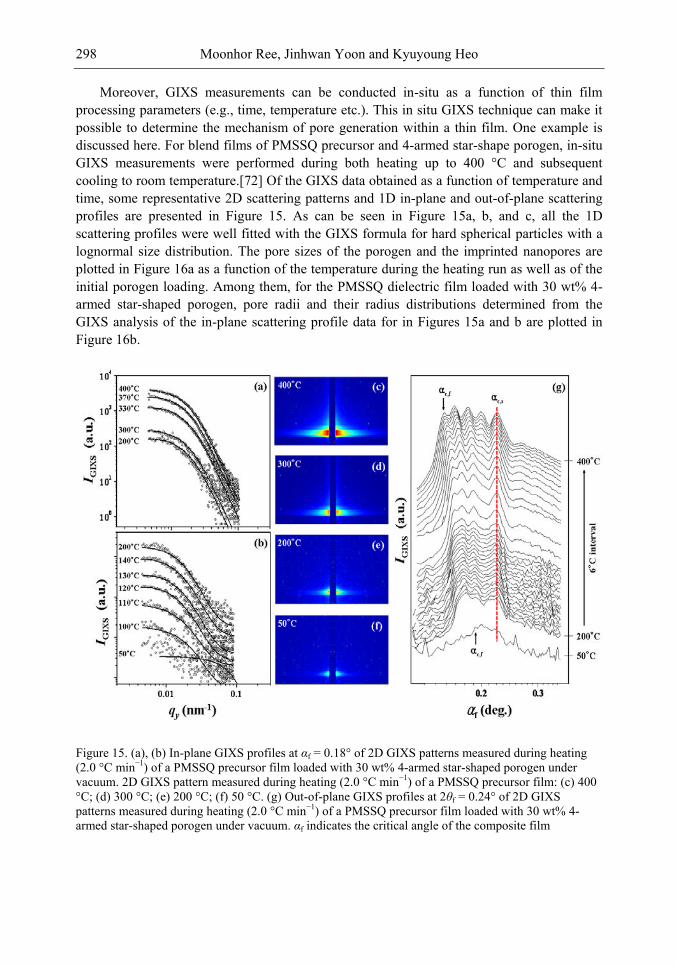
Moonhor Ree, Jinhwan Yoon and Kyuyoung Heo 298
Moreover, GIXS measurements can be conducted in-situ as a function of thin film processing parameters (e.g., time, temperature etc.). This in situ GIXS technique can make it possible to determine the mechanism of pore generation within a thin film. One example is discussed here. For blend films of PMSSQ precursor and 4-armed star-shape porogen, in-situ GIXS measurements were performed during both heating up to 400 °C and subsequent cooling to room temperature.[72] Of the GIXS data obtained as a function of temperature and time, some representative 2D scattering patterns and 1D in-plane and out-of-plane scattering profiles are presented in Figure 15. As can be seen in Figure 15a, b, and c, all the 1D scattering profiles were well fitted with the GIXS formula for hard spherical particles with a lognormal size distribution. The pore sizes of the porogen and the imprinted nanopores are plotted in Figure 16a as a function of the temperature during the heating run as well as of the initial porogen loading. Among them, for the PMSSQ dielectric film loaded with 30 wt% 4-armed star-shaped porogen, pore radii and their radius distributions determined from the GIXS analysis of the in-plane scattering profile data for in Figures 15a and b are plotted in Figure 16b.
Figure 15. (a), (b) In-plane GIXS profiles at αf = 0.18° of 2D GIXS patterns measured during heating (2.0 °C min−1) of a PMSSQ precursor film loaded with 30 wt% 4-armed star-shaped porogen under vacuum. 2D GIXS pattern measured during heating (2.0 °C min−1) of a PMSSQ precursor film: (c) 400 °C; (d) 300 °C; (e) 200 °C; (f) 50 °C. (g) Out-of-plane GIXS profiles at 2θf = 0.24° of 2D GIXS patterns measured during heating (2.0 °C min−1) of a PMSSQ precursor film loaded with 30 wt% 4-armed star-shaped porogen under vacuum. αf indicates the critical angle of the composite film
Low-K Nanoporous Interdielectrics: Materials, Thin Film Fabrications, Structures… 299
Figure 16. (a) Average radii of porogens and pores in the PMSSQ films determined from the GIXS analysis of the in-plane scattering profile data obtained for the films loaded with 10-40 wt% 4-armed star-shaped porogen. (b) Porogen and pore radii and their radius distributions determined from the GIXS analysis of the in-plane scattering profile data for the PMSSQ dielectric film loaded with 30 wt% 4-armed star-shaped porogen in Figures 15a and b
This in situ GIXS study obtained the following results. Heating of the porogen-loaded PMSSQ precursor matrix produces a curing reaction in the precursor matrix component, resulting in the phase separation of the porogen component. On heating, limited aggregations of the porogen, however, took place in only a small temperature range of 100–140 °C as a result of phase separation induced by the competition of the curing and hybridization reactions of the dielectric precursor and porogen (Figure 16); higher porogen loading resulted in relatively large porogen aggregates and a greater size distribution. The developed porogen aggregates underwent thermal firing above 300 °C without further growth and movement, and ultimately left their individual footprints in the film as spherical nanopores.
Figure 15g shows representative out-of-plane scattering profiles, which were extracted from the 2D GISAXS patterns measured during the heating of a PMSSQ precursor composite film with a 30 wt% porogen loading. Here, a variation in the critical angle of the composite film, αc,f, with increasing temperature is clearly evident. The αc,f value of 0.186° (ρe = 401 nm-
3) at 50 °C shows a very slow shift towards the low-angle region as the temperature draws closer to 300 °C. This is due to the removal of the water and ethyl alcohol byproducts, formed in the composite film during the curing of the precursor matrix component. Above 300 °C, the αc,f shows a dramatic shift towards the low-angle region as the temperature is increased, achieving a final value of 0.152° (ρe = 237 nm-3) at 400 °C. This drastic shift in αc,f towards the low-angle region is attributed primarily to the electron density of the film, which is lowered when pores are generated in the film through the thermal degradation of the porogen aggregates, and partly lowered following removal of the water and ethyl alcohol byproducts from the hybrid film. Similar trends in the αc,f variation with temperature were observed in the out-of-plane scattering profiles of the other hybrid films (data not shown).
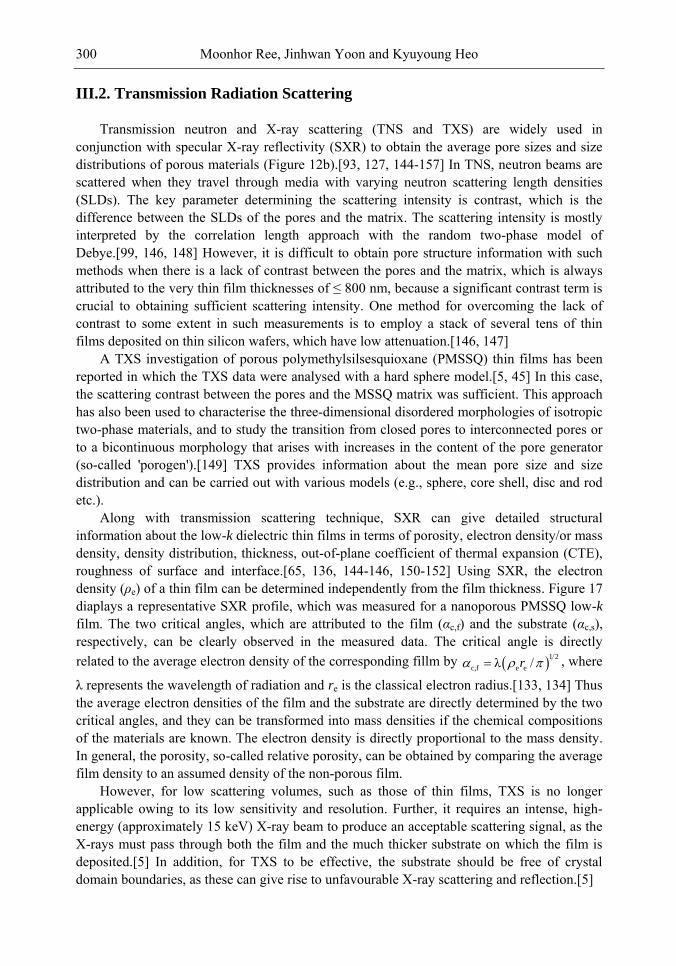
Moonhor Ree, Jinhwan Yoon and Kyuyoung Heo 300
III.2. Transmission Radiation Scattering
Transmission neutron and X-ray scattering (TNS and TXS) are widely used in conjunction with specular X-ray reflectivity (SXR) to obtain the average pore sizes and size distributions of porous materials (Figure 12b).[93, 127, 144-157] In TNS, neutron beams are scattered when they travel through media with varying neutron scattering length densities (SLDs). The key parameter determining the scattering intensity is contrast, which is the difference between the SLDs of the pores and the matrix. The scattering intensity is mostly interpreted by the correlation length approach with the random two-phase model of Debye.[99, 146, 148] However, it is difficult to obtain pore structure information with such methods when there is a lack of contrast between the pores and the matrix, which is always attributed to the very thin film thicknesses of ≤ 800 nm, because a significant contrast term is crucial to obtaining sufficient scattering intensity. One method for overcoming the lack of contrast to some extent in such measurements is to employ a stack of several tens of thin films deposited on thin silicon wafers, which have low attenuation.[146, 147]
A TXS investigation of porous polymethylsilsesquioxane (PMSSQ) thin films has been reported in which the TXS data were analysed with a hard sphere model.[5, 45] In this case, the scattering contrast between the pores and the MSSQ matrix was sufficient. This approach has also been used to characterise the three-dimensional disordered morphologies of isotropic two-phase materials, and to study the transition from closed pores to interconnected pores or to a bicontinuous morphology that arises with increases in the content of the pore generator (so-called 'porogen').[149] TXS provides information about the mean pore size and size distribution and can be carried out with various models (e.g., sphere, core shell, disc and rod etc.).
Along with transmission scattering technique, SXR can give detailed structural information about the low-k dielectric thin films in terms of porosity, electron density/or mass density, density distribution, thickness, out-of-plane coefficient of thermal expansion (CTE), roughness of surface and interface.[65, 136, 144-146, 150-152] Using SXR, the electron density (ρe) of a thin film can be determined independently from the film thickness. Figure 17 diaplays a representative SXR profile, which was measured for a nanoporous PMSSQ low-k film. The two critical angles, which are attributed to the film (αc,f) and the substrate (αc,s), respectively, can be clearly observed in the measured data. The critical angle is directly related to the average electron density of the corresponding fillm by
1 2
c,f e eλ /r , where
λ represents the wavelength of radiation and re is the classical electron radius.[133, 134] Thus the average electron densities of the film and the substrate are directly determined by the two critical angles, and they can be transformed into mass densities if the chemical compositions of the materials are known. The electron density is directly proportional to the mass density. In general, the porosity, so-called relative porosity, can be obtained by comparing the average film density to an assumed density of the non-porous film.
However, for low scattering volumes, such as those of thin films, TXS is no longer applicable owing to its low sensitivity and resolution. Further, it requires an intense, high-energy (approximately 15 keV) X-ray beam to produce an acceptable scattering signal, as the X-rays must pass through both the film and the much thicker substrate on which the film is deposited.[5] In addition, for TXS to be effective, the substrate should be free of crystal domain boundaries, as these can give rise to unfavourable X-ray scattering and reflection.[5]
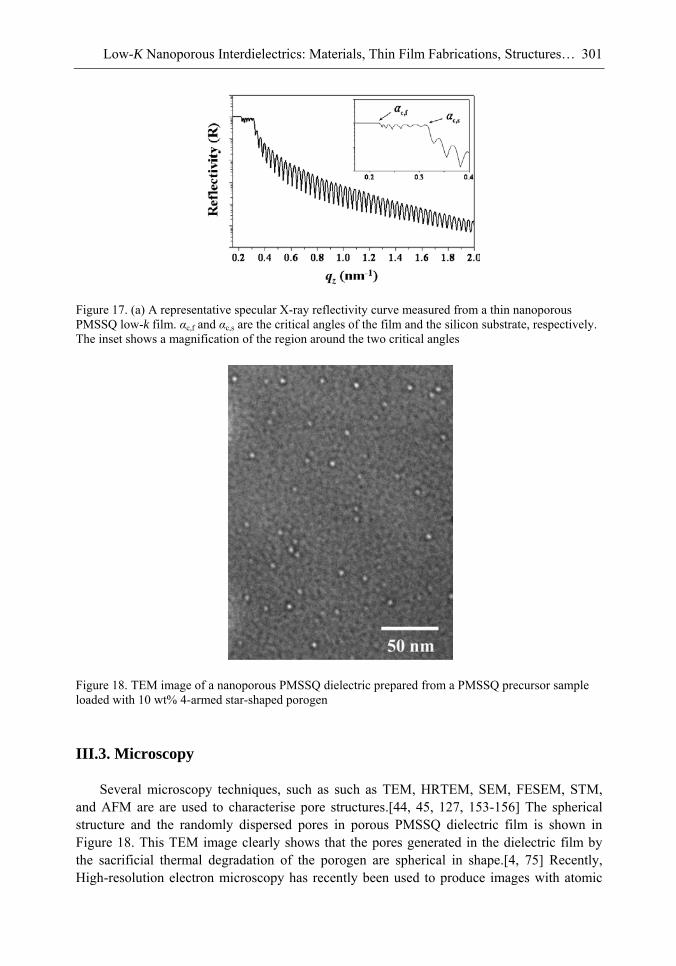
Low-K Nanoporous Interdielectrics: Materials, Thin Film Fabrications, Structures… 301
Figure 17. (a) A representative specular X-ray reflectivity curve measured from a thin nanoporous PMSSQ low-k film. αc,f and αc,s are the critical angles of the film and the silicon substrate, respectively. The inset shows a magnification of the region around the two critical angles
Figure 18. TEM image of a nanoporous PMSSQ dielectric prepared from a PMSSQ precursor sample loaded with 10 wt% 4-armed star-shaped porogen
III.3. Microscopy
Several microscopy techniques, such as such as TEM, HRTEM, SEM, FESEM, STM, and AFM are are used to characterise pore structures.[44, 45, 127, 153-156] The spherical structure and the randomly dispersed pores in porous PMSSQ dielectric film is shown in Figure 18. This TEM image clearly shows that the pores generated in the dielectric film by the sacrificial thermal degradation of the porogen are spherical in shape.[4, 75] Recently, High-resolution electron microscopy has recently been used to produce images with atomic
Moonhor Ree, Jinhwan Yoon and Kyuyoung Heo 302
resolution.[163] These techniques are widely used for the direct characterisation of pore structures because of their powerful visualisation features, which can provide topographical and structural information in plan or cross-sectional views. Further, qualitative analysis is possible with these techniques, even with specimens of limited area. However, they are insensitive and complicated to use in quantitative analysis, because of the overlapping of pores in crosssectional views, and have profound analytic resolution limitations. Moreover, TEM and SEM techniques require intensive and exacting specimen preparation processes, typically under high vacuum conditions and with highly focused ion beams. Nevertheless, they will continue to be widely used in conjunction with other techniques.
III.4. Porosimetry
Adsorption porosimetry has been widely used to determine pore size distribution and porosity; this method determines the adsorption–desorption isotherm of nitrogen vapor for the sample by weighing the sample.[158, 159] However, there are some problems in the adaptation of this technique to the requirements of industry. First, most current research is focused on materialising the nanoporous materials as thin films with thicknesses of several hundreds of nanometres. However, thin films have insufficient mass for adequate measurements with the traditional nitrogen adsorption technique, because it is based on the use of a microbalance, which is only suitable for samples with relatively high mass. Secondly, it is only applicable to open pores, not to closed pores. Thirdly, it is destructive, because the sample must be grind into a powder to be weighed with the microbalance. However, for accurate results to be obtained, the thin film sample must retain the same structural features that it had when it was produced. Finally, adsorption porosimetric measurements are usually performed near the boiling point of nitrogen vapour (~77.4 K). These unfavourable conditions act as crack-driving forces. In an attempt to investigate thin film specimens non-destructively at room temperature, and thus to avoid severe stress conditions, the use of quartz crystal microbalance (QCM)[158, 160]and surface acoustic wave (SAW) methods[161] has been suggested. However, these methods cannot be used for sensing the adsorption of vapor onto a silicon wafer or other substrate, because QCM and SAW require that the sample be deposited directly onto the sensor.
To overcome the significant drawbacks of gas adsorption porosimetry, ellipsometric porosimetry, which opens up a new genre of adsorption porosimetry, has been introduced.[162, 163] This technique is similar to gas adsorption porosimetry in that the sample is exposed to an adsorptive gas or probe liquid (e.g., toluene, heptane etc.). The change in the refractive index of the sample is then employed for the determination of the mass of the adsorptive that is condensed and/or adsorbed into pores, instead of the direct weighing used in adsorption porosimetry. The full porosity, open pore volume and pore interconnectivity can be calculated from the changes in the refractive index and the thickness of the film.[164, 165] It is also possible, with this method, to characterise a film's surface roughness (which includes open pores at the surface)[166] The reliability of pore size distribution analysis with ellipsometric porosimetry using various organic adsorptives has been demonstrated by Baklanov et al.[162] Although the use of ellipsometric porosimetry can provide impressive physical and structural details, this technique can only be used for open
Low-K Nanoporous Interdielectrics: Materials, Thin Film Fabrications, Structures… 303
pores, as is the case for nitrogen porosimetry. Further, this approach assumes that the refractive index of liquid condensed and/or adsorbed in nanoscale pores is identical to that of the bulk liquid. This assumption is only reasonable when the pore size approaches that of a few adsorptive molecules. Lastly, this technique cannot take into account the swelling of the thin film by the probe liquid, which results in an overestimate of the gas uptake and thus of the pore size.
III.5. Spectroscopy
Positron annihilation lifetime spectroscopy (PALS) is applicable to the determination of free volume at the atomic or molecular level and is based on the annihilation lifetime of positronium (Ps, positron-electron bound state) through collisions with the electrons of the pores' inner surfaces (Figure 19).[167-169] Unlike adsorption techniques, this method can be used for both closed pores and open pores. Gidley et al. have sucessfully demonstrated that pore structure (pore size, size distribtuion, and interconnectivity) of both isolated pores and highly interconnected open pores, in the latter case, thin capping layer such as Al on film surface is necessary to Keep Ps escaping into vacuum (on the right side of Figure 19).[170-173] Moreover, the PALS can be applied a multilevel thin film which the film is capped with a diffusion barrier (e.g., Ta, TaN or TiN) or sacrificial layer such as silicon oxide layer prepared from tetraethoxysilane (TEOS).[163] These features resolve the major problems of porosimetry methods. Further, the possibility of analysis of capped systems enables the use of this method on practical multilevel integrated circuits with various layers such as an etch stop layer, a capping layer and a copper conductor with a barrier/metal seed layer.[177]
The most powerful feature of PALS is its sensitivity to much smaller pores (down to a few angstroms) than those detectable with TEM, TNS and TXS (down to a few nanometres). Recently, the complete depth-dependent pore structure of a nanoporous thin film was characterised using depth-profiled PALS.[182-185] This technique is suitable to monitor any variations in the depth-dependent pore structure in the fabrication of a nanoporous low-k thin film.[175, 178] To calculate the pore size distribution from the lifetime spectra, a calibration curve is required that connects the Ps lifetime with the pore size.[135]
The PALS method does have some limitations.[171, 174-176] First, if the pores in the film system under investigation are open and highly interconnected, the highly mobile Ps diffuses out of the film and escapes into the vacuum, resulting in a lifetime the same as that in a vacuum (about 142 ns), and then information about pore size cannot be obtained. This problem with open, interconnected pores can be solved by a capping layer being deposited onto the thin film layer to prevent the Ps escaping from the film layer into the vacuum. Secondly, in some materials (e.g., polyimides), Ps formation is suppressed because of an abundance of free radicals that scavenge electrons during the Ps formation process. Thirdly, the Ps formed within the thin film must be able to diffuse into the pores; otherwise PALS probes only molecular voids (i.e., molecular-free volumes) in the bulk film part rather than the pores of interest in the nanoporous film. Finally, commercial positron beams are not readily available.
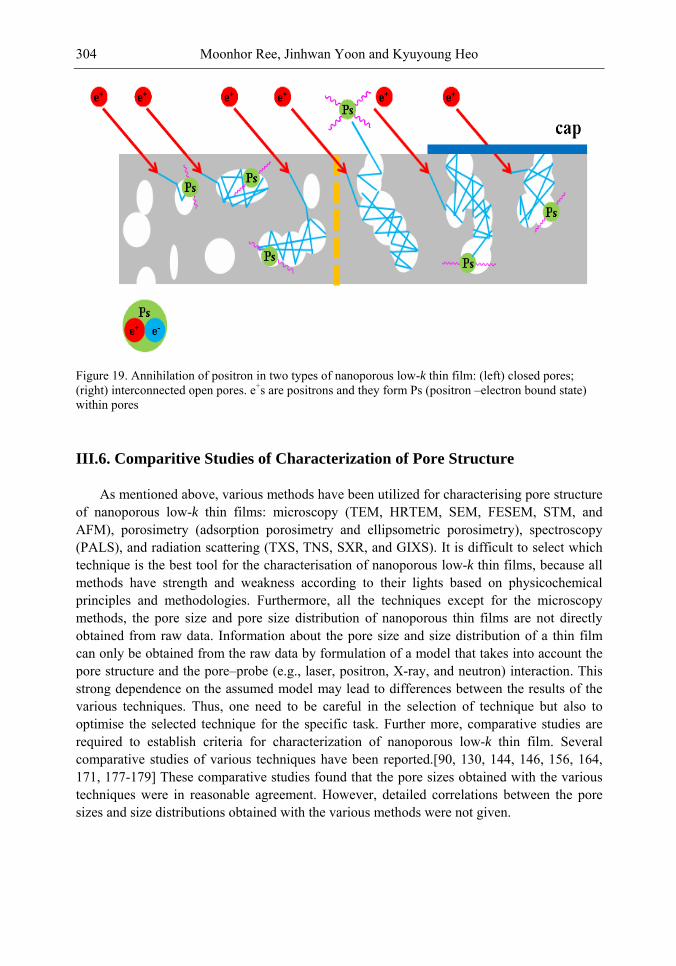
Moonhor Ree, Jinhwan Yoon and Kyuyoung Heo 304
Figure 19. Annihilation of positron in two types of nanoporous low-k thin film: (left) closed pores; (right) interconnected open pores. e+s are positrons and they form Ps (positron –electron bound state) within pores
III.6. Comparitive Studies of Characterization of Pore Structure
As mentioned above, various methods have been utilized for characterising pore structure of nanoporous low-k thin films: microscopy (TEM, HRTEM, SEM, FESEM, STM, and AFM), porosimetry (adsorption porosimetry and ellipsometric porosimetry), spectroscopy (PALS), and radiation scattering (TXS, TNS, SXR, and GIXS). It is difficult to select which technique is the best tool for the characterisation of nanoporous low-k thin films, because all methods have strength and weakness according to their lights based on physicochemical principles and methodologies. Furthermore, all the techniques except for the microscopy methods, the pore size and pore size distribution of nanoporous thin films are not directly obtained from raw data. Information about the pore size and size distribution of a thin film can only be obtained from the raw data by formulation of a model that takes into account the pore structure and the pore–probe (e.g., laser, positron, X-ray, and neutron) interaction. This strong dependence on the assumed model may lead to differences between the results of the various techniques. Thus, one need to be careful in the selection of technique but also to optimise the selected technique for the specific task. Further more, comparative studies are required to establish criteria for characterization of nanoporous low-k thin film. Several comparative studies of various techniques have been reported.[90, 130, 144, 146, 156, 164, 171, 177-179] These comparative studies found that the pore sizes obtained with the various techniques were in reasonable agreement. However, detailed correlations between the pore sizes and size distributions obtained with the various methods were not given.
Low-K Nanoporous Interdielectrics: Materials, Thin Film Fabrications, Structures… 305
IV. CONCLUSIONS
As reviewed above, there are two principal methods for producing low-k spin-on dielectric materials containing closed nanopores, which are the most promising interdielectric layers for the production of advanced ICs by the semiconductor industry.
The first approach is to prepare thermally and dimensionally stable hollow closed nanoparticles with a low k value and disperse them uniformly throughout the dielectric film volume, producing nanoporous low-k thin films. In this case, avoiding or minimizing the aggregation of hollow nanoparticles within the dielectric film is preferred but not absolutely required because the hollow particles are thermally and dimensionally stable, and thus stand alone individually. Moreover, due to their high thermal and dimensional stability, there are a wide variety of dielectric matrices that can be used with these hollow nanoparticles, including curable and noncurable dielectrics and precursors as well as inorganic and organic dielectrics. However, the fabrication of hollow nanoparticles of the desired size and miscibility with dielectric matrices remains a significant challenge.
The second approach is based on the addition to the dielectric precursor of nanoscale porogens with tailored thermal stabilities. The stability of these porogens must be such that they are not affected by the coating and drying steps in the dielectric film formation process; they are removed by sacrificial thermal degradation during the final heat treatment of the dielectric films at temperatures typically in the range 300–400 °C. Their volume distribution in the film is the template for the formation of residual closed nanopores in the dielectric film. The porous fraction of the film is in principle directly related to the fraction of porogen with respect to the total solids in the dielectric precursor solution, and the size of the sacrificial porogens is directly related to the final pore size. However, there are some practical requirements if these relationships between the sacrificial porogens, imprinted pores and porosity are to be maintained. Firstly, the sacrificial porogen should be compatible with the dielectric matrix material in order to avoid porogen aggregation. Secondly, the sacrificial porogens should be uniformly distributed throughout the film volume in order to avoid the coalescence or interconnection of the pores. There are two ways in which the sacrificial porogens can be introduced into the dielectric precursor solution. One method is the dispersion of porogens in the solution. The second is chemically linking the sacrificial porogens to the network polymers as block components of the backbone or through grafting. This second method enables control of the volume distribution of the porogens in the dielectric film. Finally, the porogen template approach requires that the dielectric matrix film has a higher degree of cross-linking so that it is dimensionally stable when the pores are created. The porous structure is therefore less affected by any further processes associated with the resulting nanoporous dielectric film; this is why silicate and organosilicate precursors (e.g., PASSQ precursors) and their cured dielectrics are appropriate for the porogen template approach to producing low-k nanoporous dielectrics. Otherwise the pores in the dielectric film may collapse during post-processing of the film, including thermal cycles, which arises because of high capillary pressure and the molecular mobility of the film induced by thermal processing; this is why non-curable organic polymers (e.g., polyimides and polyphenylquinoxalines) are not appropriate for the porogen template approach. In addition, closed nanoporosity can be obtained, within certain boundary conditions related to the nature and total load of the porogen.
Moonhor Ree, Jinhwan Yoon and Kyuyoung Heo 306
The closed pores in a porous low-k dielectric layer film must be 5–10 times smaller than the smallest device feature; the minimum metal feature size is nowadays approaching 50 nm and may reach 25 nm in the near future.
Nanoporous materials for low-k application need control of pore size and size uniformity to nanometer scale. Because the mechanical stability of nanoporous materials for integration to multilavel semiconductor are close related to the pore structures. Therefore, the pore structures of nanoporous materials are very important for their use as low-k dielectrics as their electrical, mechanical, and chemical properties, and the accurate evaluation of the properties of the introduced pores is required for the successful introduction of nanoporous thin films as low-k dielectrics. However, the pore size and film thickness of interlayer dielectrics (ILDs) continue to be reduced in the pursuit of increased integration and reduced feature sizes. Thus the characterization of pore structure becomes more and more difficult. For this reason, various advanced techniques for the characterisation of pore structures have recently been developed: GIXS, TNS/TXS combined SXR, various kinds of microscopy, adsorption porosimetry, ellipsometric porosimetry, and PALS. In this book, usefulness of these techniques in the precise, and quantitative characterization of the pore shapes, size and size distribution of nanoporous low-k thin film were mentioned. Characterization of structures with dimensions approaching those of atoms is required. However, no all-encompassing technique is currently available. Thus a synergistic approach, i.e., the application in combination of various analytical techniques to obtain results superior to those obtained with each individual technique, is necessary.
In conclusion, considering the Semiconductor Industry Association‘s International
Technology Roadmap for Semiconductors, significant challenges remain in the fabrication and production of high performance low-k dielectric materials consisting of closed nanopores of 4 nm or less that meet the requirements of the production of advanced ICs in the microelectronics industry. Moreover, suitable characterization technique for precise and quantitative evaluation of pore structures is necessary to advance the development of nanoporous low-k materials with porogen and pore generation method points of view.
REFERENCES
[1] Ree, M; Goh, WH; Kim, Y. Polymer Bulletin, 1995, 35, (1-2), 215-222. [2] Miller, RD. Science, 1999, 286, (5439), 421-423. [3] Lee, B; Park, YH; Hwang, YT; Weontae, OH; Yoon, J; Ree, M. Nat. Mater., 2005, 4,
(2), 147-151. [4] Lee, B; Oh, W; Hwang, Y; Park, YH; Yoon, J; Jin, KS; Heo, K; Kim, J; Kim, KW; Ree,
M. Adv. Mater., 2005, 17, (6), 696-701. [5] Lee, B; Yoon, J; Oh, W; Hwang, Y; Heo, K; Jin, KS; Kim, J; Kim, KW; Ree, M.
Macromolecules, 2005, 38, (8), 3395-3405. [6] Morgen, M; Ryan, ET; Zhao, JH; Hu, C; Cho, T; Ho, PS. Annu. Rev. Mater. Sci., 2000,
30, 645-680. [7] Maex, K; Baklanov, MR; Shamiryan, D; Iacopi, F; Brongersma, SH; Yanovitskaya, ZS.
J. Appl. Phys., 2003, 93, (11), 8793-8841. [8] Ree, M; Yoon, J; Heo, K. J. Mater. Chem, 2006, 16, 685-697.
Low-K Nanoporous Interdielectrics: Materials, Thin Film Fabrications, Structures… 307
[9] Czornyj, G; Chen, KJ; Prada-Silva, G; Arnold, A; Souleotis, HA; Kim, S; Ree, M; Volksen, W; Dawson, D; DiPietro, R. Proc. Elect. Comp. Tech. (IEEE), 1992, 42, 682-692.
[10] International Technology Roadmap for Semiconductors 1999. [11] Maier, G. Prog. Polym. Sci., 2001, 26, (1), 3-65. [12] Ree, M; Shin, TJ; Lee, SW. Korea Polymer Journal, 2001, 9, (1), 1-19. [13] Kim, Y; Goh, WH; Chang, T; Ha, CS; Ree, M. Adv. Eng. Mater., 2004, 6, (1), 39-43. [14] Shin, TJ; Ree, M. Langmuir, 2005, 21, (13), 6081-6085. [15] Yu, J; Ree, M; Shin, TJ; Park, YH; Cai, W; Zhou, D; Lee, KW. Macrom. Chem. Phys.,
2000, 201, (5), 491-499. [16] Kim, SI; Shin, TJ; Ree, M; Lee, H; Chang, T; Lee, C; Woo, TH; Rhee, SB. Polymer,
2000, 41, (14), 5173-5184. [17] Yu, J; Ree, M; Shin, TJ; Wang, X; Cai, W; Zhou, D; Lee, KW. J. Polym. Sci. Part B -
Polym. Phys., 1999, 37, (19), 2806-2814. [18] Pyo, SM; Kim, SI; Shin, TJ; Park, YH; Ree, M. J. Polym. Sci. Part A - Polymer. Chem.,
1999, 37, (2-7), 937-957. [19] Kim, Y; Kang, E; Kwon, YS; Cho, WJ; Cho, C; Chang, M; Ree, M; Chang, T; Ha, CS.
Synthetic Metals, 1997, 85, (1-3), 1399-1400. [20] Kim, Y; Lee, WK; Cho, WJ; Ha, CS; Ree, M; Chang, T. Polymer International, 1997,
43, (2), 129-136. [21] Ree, M; Kim, K; Woo, SH; Chang, H. J. Appl. Phys., 1997, 81, (2), 698-708. [22] Kim, Y; Ree, M; Chang, T; Ha, CS; Nunes, TL; Lin, JS. J. Polym. Sci. Part B - Polym.
Phys., 1995, 33, 2075-2082. [23] Ree, M; Goh, WH; Park, JW; Lee, MH; Rhee, SB. Polymer Bulletin, 1995, 35, (1-2),
129-136. [24] Kim, Y; Ree, M; Chang, T; Ha, CS. Polymer Bulletin, 1995, 34, (2), 175-182. [25] Ree, M; Han, H; Gryte, CC. J. Polym. Sci. Part B - Polym. Phys., 1995, 33, 505-516. [26] Ree, M; Nunes, TL; Chen, K. J. Polym. Sci. Part B - Polym. Phys., 1995, 33, 453-465. [27] Ree, M; Han, H; Gryte, CC. High Perform. Polym., 1994, 6, 325-325. [28] Ree, M; Nunes, TL; Lin, JS. Polymer, 1994, 35, (6), 1148-1156. [29] Ree, M; Chu, CW; Goldberg, MJ. J. Appl. Phys., 1994, 75, (3), 1410-1419. [30] Ree, M; Swanson, S; Volksen, W. Polymer, 1993, 34, (7), 1423-1430. [31] Ree, M; Chen, KJR; Czornyj, G. Polym. Eng. Sci., 1992, 32, 924-924. [32] Ree, M; Chen, KJ; Kirby, DP; Katzenellenbogen, N; Grischkowsky, D. J. Appl. Phys.,
1992, 72, (5), 2014-2021. [33] Rojstaczer, S; Ree, M; Yoon, DY; Volksen, W. J. Polym. Sci. Part B - Polym. Phys.,
1992, 30, (2), 133-143. [34] Robertson, WM; Arjavalingam, G; Hougham, G; Kopesav, GV; Edelstein, D; Ree, MH;
Chapple-Sokol, JD. Electron. Lett., 1992, 28, (1), 62-63. [35] Ree, M; Nunes, TL; Czornyj, G; Volksen, W. Polymer, 1992, 33, (6), 1228-1236. [36] Ree, M; Yoon, DY; Volksen, W. J. Polym. Sci. Part B - Polym. Phys., 1991, 29, (10),
1203-1213. [37] Moylan, CR; Best, ME; Ree, M. J. Polym. Sci. Part B - Polym. Phys., 1991, 29, (1), 87-
92. [38] Ree, M; Shin, TJ; Park, YH; Lee, H; Chang, T. Korea Polymer Journal, 1999, 7, (6),
370-376.
Moonhor Ree, Jinhwan Yoon and Kyuyoung Heo 308
[39] Goh, WH; Kim, K; Kim, SI; Shin, TJ; Ree, M. Korea Polymer Journal, 1998, 6, (3), 241-248.
[40] Azooz, MA; Hwang, YT; Ree, M. Egypt. J. Chem., 2003, 46, 741-756. [41] Shin, TJ; Ree, M. Macrom. Chem. Phys., 2002, 203, (5-6), 791-800. [42] Oh, W; Ree, M. Langmuir, 2004, 20, (16), 6932-6939. [43] Nguyen, CV; Carter, KR; Hawker, CJ; Hedrick, JL; Jaffe, RL; Miller, RD; Remenar, JF;
Rhee, HW; Rice, PM; Toney, MF; Trollsas, MF; Yoon, DY. Chem. Mater., 1999, 11, 3080-3085.
[44] Hedrick, JL; Miller, RD; Hawker, CJ; Carter, KR; Volksen, W; Yoon, DY; Trollsas, M. Adv. Mater., 1998, 10, (13), 1049-1053.
[45] Huang, E; Toney, MF; Volksen, W; Mecerreyes, D; Brock, P; Kim, HC; Hawker, CJ; Hedrick, JL; Lee, VY; Magbitang, T; Miller, RD; Lurio, LB. Appl. Phys. Lett., 2002, 81, (12), 2232-2234.
[46] Mukherjee, SP; Suryanarayana, D; Strope, DH. J. Non-Cryst. Solids, 1992, 147-48, 783-791.
[47] Muktherjee, SP; Cordars, JF; Debsikdar, JC. Adv. Ceram. Mater., 1988, 3, (5), 463. [48] Chandrashekhar, GV; Shafer, MW. Mater. Res. Soc. Symp. Proc., 1986, 72, 309-315. [49] Fischer, M; Vogtle, F. Angew. Chem. - Int. Ed., 1999, 38, (7), 884-905. [50] Narayanan, VV; Newkome, GR. Top. Curr. Chem., 1998, 197, 19-77. [51] Zimmerman, SC; Wendland, MS; Rakow, NA; Zharov, I; Suslick, KS. Nature, 2002,
418, (6896), 399-403. [52] Tomalia, DA; Baker, H; Dewald, J; Hall, M; Kallos, G; Martin, S; Roeck, J; Ryder, J;
Smith, P. Polymer Journal, 1984, 17, (1), 117-132. [53] De Brabander-van Den Berg, EMM; Meijer, EW. Angew. Chem. - Int. Ed., 1993, 32,
(9), 1308-1311. [54] Jikei, M; Kakimoto, MA. J. Polym. Sci. Part A - Polym. Chem., 2004, 42, (6), 1293-
1309. [55] Kim, YH. J, Polym. Sci. Part A - Polym.Chem., 1998, 36, (11), 1685-1698. [56] Oh, W; Shin, TJ; Ree, M; Jin, MY; Char, K. Mole. Cryst. Liq. Crys. Sci. Tech. Sec. A:
Mole. Cryst. Liq.Cryst., 2001, 371, 397-402. [57] Baney, RH; Itoh, M; Sakakibara, A; Suzuki, T. Chem. Rev., 1995, 95, (5), 1409-1430. [58] Shin, YC; Choi, KY; Jin, MY; Hong, SK; Cho, D; Chang, T; Ree, M. Korea Polymer
Journal, 2001, 9, (2), 100-106. [59] Hirao, A; Hayashi, M; Loykulnant, S; Sugiyama, K; Ryu, SW; Haraguchi, N; Matsuo,
A; Higashihara, T. Prog. Polym. Sci., 2005, 30, (2), 111-182. [60] Daoud, M; Cotton, JP. Journal de physique Paris, 1982, 43, (3), 531-538. [61] Ishizu, K; Ono, T; Uchida, S. Macro. Chem. Phys., 1997, 198, (10), 3255-3265. [62] Hsu, HP; Nadler, W; Grassberger, P. Macromolecules, 2004, 37, (12), 4658-4663. [63] Zimm, BH; Stockmayer, WH. J. Chem. Phys., 1949, 17, (12), 1301-1314. [64] Witten, TA; Pincus, PA; Cates, ME. Europhys. Lett., 1986, 2, (2), 137-140. [65] Bolze, J; Ree, M; Youn, HS; Chu, SH; Char, K. Langmuir, 2001, 17, (21), 6683-6691. [66] Oh, W; Hwang, Y; Park, YH; Ree, M; Chu, SH; Char, K; Lee, JK; Kim, SY. Polymer
2003, 44, (8), 2519-2527. [67] Trollsas, M; Hedrick, JL; Mecerreyes, D; Dubois, P; Jerome, R; Ihre, H; Hult, A.
Macromolecules, 1997, 30, (26), 8508-8511.
Low-K Nanoporous Interdielectrics: Materials, Thin Film Fabrications, Structures… 309
[68] Trollsas, M; Hedrick, JL; Mecerreyes, D; Dubois, P; Jerome, R; Ihre, H; Hult, A. Macromolecules, 1998, 31, (9), 2756-2763.
[69] Trollsas, M; Hedrick, JL. J. Am. Chem. Soc., 1998, 120, (19), 4644-4651. [70] Heise, A; Nguyen, C; Malek, R; Hedrick, JL; Frank, CW; Miller, RD. Macromolecules,
2000, 33, (7), 2346-2354. [71] Jin, KS; Heo, K; Oh, W; Yoon, J; Lee, B; Hwang, Y; Kim, JS; Park, YH; Chang, T;
Ree, M. J. Appl. Crystallogr., 2007, 40, S631-S636. [72] Yoon, J; Heo, K; Oh, W; Jin, KS; Jin, S; Kim, J; Kim, K.-W; Chang, T; Ree, M.
Nanotechnology, 2006, 17, 3490-3498. [73] Lee, B; Oh, W; Yoon, J; Hwang, Y; Kim, J; Landes, BG; Quintana, JP; Ree, M.
Macromolecules, 2005, 38, (22), 8991-8995. [74] Heo, K; Jin, KS; Yoon, J; Jin, S; Oh, W; Ree, M. J. Phys. Chem. B, 2006, 110, 15887-
15895. [75] Nguyen, C; Hawker, CJ; Miller, RD; Huang, E; Hedrick, JL; Gauderon, R; Hilborn, JG.
Macromolecules, 2000, 33, (11), 4281-4284. [76] Mecerreyes, D; Huang, E; Magbitang, T; Volksen, W; Hawker, CJ; Lee, VY; Miller,
RD; Hedrick, JL. High Perform. Polym., 2001, 13, (2), s11-s19. [77] Mecerreyes, D; Atthoff, B; Boduch, KA; Trollsas, M; Hedrick, JL. Macromolecules,
1999, 32, (16), 5181-5182. [78] Plummer, CJG; Garamszegi, L; Nguyen, TQ; Rodlert, M; Manson, JAE. J. Mater. Sci.,
2002, 37, (22), 4819-4829. [79] Kim, JS; Kim, HC; Lee, B; Ree, M. Polymer, 2005, 46, (18), 7394-7402. [80] Bergbreiter, DE. Angew. Chem. - Int. Ed., 1999, 38, (19), 2870-2872. [81] Monteiro, MJ; Bussels, R; Wilkinson, TS. J. Polym. Sci. Part A - Polym. Chem., 2001,
39, (16), 2813-2820. [82] Park, MK; Xia, C; Advincula, RC; Schultz, P; Caruso, F. Langmuir, 2001, 17, (24),
7670-7674. [83] Demers, LM; Park, SJ; Andrew Taton, T; Li, Z; Mirkin, CA. Angew. Chem. - Int. Ed.,
2001, 40, (16), 3071-3073. [84] Thurmond Ii, KB; Kowalewski, T; Wooley, KL. J. Am. Chem. Soc., 1997, 119, (28),
6656-6665. [85] Zhang, Q; Remsen, EE; Wooley, KL. J. Am. Chem. Soc., 2000, 122, (15), 3642-3651. [86] Harth, E; Van Horn, B; Lee, VY; Germack, DS; Gonzales, CP; Miller, RD; Hawker, CJ.
J. Am. Chem. Soc., 2002, 124, (29), 8653-8660. [87] Mecerreyes, D; Lee, V; Hawker, CJ; Hedrick, JL; Wursch, A; Volksen, W; Magbitang,
T; Huang, E; Miller, RD. Adv. Mater., 2001, 13, (3), 204-208. [88] Connor, EF; Sundberg, LK; Kim, HC; Cornelissen, JJ; Magbitang, T; Rice, PM; Lee,
VY; Hawker, CJ; Volksen, W; Hedrick, JL; Miller, RD. Angew. Chem. - Int. Ed., 2003, 42, (32), 3785-3788.
[89] Hong-ji, C; Meng, F. Macromolecules, 2007, 40, 2079-2085. [90] Hwang, YT; Yoon, J; Oh, W; Lee, B; Ree, M. unpublished results. [91] Carter, KR; Dawson, DJ; Dipietro, RA; Hawker, CJ; Hedrick, JL; Miller, RD; Yoon,
DY. US Pat. 5895263, 1999. [92] Huang, QR; Volksen, W; Huang, E; Toney, M; Frank, CW; Miller, RD. Chem. Mater.,
2002, 14, (9), 3676-3685.
Moonhor Ree, Jinhwan Yoon and Kyuyoung Heo 310
[93] Kim, HC; Wilds, JB; Kreller, CR; Volksen, W; Brock, PJ; Lee, VY; Magbitang, T; Hedrick, JL; Hawker, CJ; Miller, RD. Adv. Mater., 2002, 14, (22), 1637-1639.
[94] Kim, HC; Volksen, W; Miller, RD; Huang, E; Yang, G; Briber, RM; Shin, K; Satija, SK. Chem. Mater., 2003, 15, (3), 609-611.
[95] Huang, QR; Kim, HC; Huang, E; Mecerreyes, D; Hedrick, JL; Volksen, W; Frank, CW; Miller, RD. Macromolecules, 2003, 36, (20), 7661-7671.
[96] Chang, Y; Chen, CYI; Chen, WC. J. Polym. Sci. Part B - Polym. Phys., 2004, 42, (24), 4466-4477.
[97] Yang, CC; Wu, PT; Chen, WC; Chen, HL. Polymer, 2004, 45, (16), 5691-5702. [98] Yang, S; Mirau, PA; Pai, CS; Naiamasu, O; Reichmanis, E; Lin, EK; Lee, HJ; Gidley,
DW; Sun, J. Chem. Mater., 2001, 13, (9), 2762-2764. [99] Xu, J; Moxom, J; Yang, S; Suzuki, R; Ohdaira, T. Chem. Phys. Lett., 2002, 364, (3-4),
309-313. [100] Yang, S; Mirau, PA; Pai, CS; Nalamasu, O; Reichmanis, E; Pai, JC; Obeng, YS;
Seputro, J; Lin, EK; Lee, HJ; Sun, J; Gidley, DW. Chem. Mater., 2002, 14, (1), 369-374. [101] Polarz, S; Smarsly, B; Bronstein, L; Antonietti, M. Angew. Chem., 2001, 113, (23),
4549-4553. [102] Yim, JH; Lyu, YY; Jeong, HD; Song, SA; Hwang, IS; Hyeon-Lee, J; Mah, SK;
Chang, S; Park, JG; Hu, YF; Sun, JN; Gidley, DW. Adv. Func. Mater., 2003, 13, (5), 382-386.
[103] Yim, JH; Seon, JB; Jeong, HD; Pu, LS; Baklanov, MR; Gidley, DW. Adv. Func.
Mater., 2004, 14, (3), 277-282. [104] Yim, JH; Baklanov, MR; Gidley, DW; Peng, H; Jeong, HD; Pu, LS. J. Phys. Chem.
B, 2004, 108, (26), 8953-8959. [105] Shin, JJ; Park, SJ; Min, SK; Rhee, HW; Moon, B; Yoon, DY. Mole. Cryst. Liq.
Cryst., 2006, 445, 167-175. [106] Chung, K; Moyer, ES; Spaulding, M. US Pat. 6231989, 2001. [107] Zhong, B; Spaulding, M; Albaugh, J; Moyer, E. Polym. Mater. Sci. Eng., 2002, 87,
440-441. [108] Oh, W. Ph. D. Thesis, Pohang University of Science and Technology, Rep. Korea,
2003. [109] Cha, BJ; Kim, S; Char, K; Lee, JK; Yoon, DY; Rhee, HW. Chem. Mater., 2006, 18,
378-385. [110] Hyeon-Lee, J; Kim, WC; Min, SK; Ree, HW; Yoon, DY. Macro. Mater. Eng., 2003,
288, (5), 455-461. [111] Ro, HW; Kim, KJ; Theato, P; Gidley, DW; Yoon, DY. Macromolecules, 2005, 38,
(3), 1031-1034. [112] Plummer, CJG; Hilborn, JG; Hedrick, JL. Polymer, 1995, 36, (12), 2485-2489. [113] Cha, HJ; Hedrick, J; DiPietro, RA; Blume, T; Beyers, R; Yoon, DY. Appl. Phys.
Lett., 1996, 68, (14), 1930-1932. [114] Carter, KR; Di Pietro, R; Sanchez, MI; Russell, TP; Lakshmanan, P; McGrath, JE.
Chem. Mater., 1997, 9, 115-118. [115] Do, JS; Zhu, B; Han, SH; Nah, C; Lee, MH. Polymer International, 2004, 53, (8),
1040-1046. [116] Charlier, Y; Hedrick, JL; Russell, TP; Jonas, A; Volksen, W. Polymer, 1995, 36, (5),
987-1002.
Low-K Nanoporous Interdielectrics: Materials, Thin Film Fabrications, Structures… 311
[117] Hedrick, JL; Hawker, CJ; DiPietro, R; Jerome, R; Charlier, Y. Polymer, 1995, 36, (25), 4855-4866.
[118] Hedrick, JL; Carter, K; Richter, R; Miller, RD; Russell, TP; Flores, V; Mecerreyes, D; Dubois, P; Jerome, R. Chem. Mater., 1998, 10, (1), 39-49.
[119] Hedrick, J; Labadie, J; Russell, T; Hofer, D; Wakharker, V. Polymer, 1993, 34, (22), 4717-4726.
[120] Fu, GD; Zong, BY; Kang, ET; Neoh, KG; Lin, CC; Liaw, DJ. Indus. Eng. Chem.
Res., 2004, 43, (21), 6723-6730. [121] Fu, GD; Wang, WC; Li, S; Kang, ET; Neoh, KG; Tseng, WT; Liaw, DJ. J. Mater.
Chem, 2003, 13, (9), 2150-2156. [122] Chen, Y; Wang, W; Yu, W; Yuan, Z; Kang, ET; Neoh, KG; Krauter, B; Greiner, A.
Adv. Func. Mater., 2004, 14, (5), 471-478. [123] Carter, KR; DiPietro, RA; Sanchez, MI; Swanson, SA. Chem. Mater., 2001, 13, (1),
213-221. [124] Chen, YW; Wang, WC; Yu, WH; Kang, ET; Neoh, KG; Vora, MH; Ong, CK; Chen,
LF. J. Mater. Chem., 2004, 14, (9), 1406-1412. [125] Wang, WC; Vora, RH; Kang, ET; Neoh, KG; Ong, CK; Chen, LF. Adv. Mater.,
2004, 16, (1), 54-57. [126] Oh, W; Shin, TJ; Ree, M; Jin, MY; Char, K. Macromol. Chem. Phys., 2002, 203, (5-
6), 801-811. [127] Rajagopalan, T; Lahlouh, B; Lubguban, JA; Biswas, N; Gangopadhyay, S; Sun, J;
Huang, DH; Simon, SL; Mallikarjunan, A; Kim, HC; Volksen, W; Toney, MF; Huang, E; Rice, PM; Delenia, E; Miller, RD. Appl. Phys. Lett., 2003, 82, (24), 4328-4330.
[128] Heo, K; Yoon, J; Jin KS; Jin, S; Ree, M. IEE Proc. Bionanotech., 2006, 153, 121-128.
[129] Hsu, CH; Jeng, US; Lee, HY; Huang, CM; Liang, KS; Windover, D; Lu, TM; Jin, C. Thin Solid Films, 2005, 472, 323– 327.
[130] Jousseaume, V; Rolland, G; Babonneau, D; Simon, JP. Appl. Surf. Sci., 2007, 254, 473–479.
[131] Omote, K; Ito, Y; Kawamura, S. Appl. Phys. Lett., 2003, 82, 544-546. [132] Lee, B; Park, I; Yoon, J; Park, S; Kim, J; Kim, KW; Chang, T; Ree, M.
Macromolecules, 2005, 38, (10), 4311-4323. [133] Tolan, M. X-Ray Scattering from Soft-Matter Thin Films. Springer: New York,
1998. [134] Holy, V; Pietsch, U; Baumbach, T. High-Resolution X-ray Scattering from Thin
Films and Multilayers., Springer: New York, 1999. [135] Lazzari, R. J. Appl. Crystallogr., 2002, 35, (4), 406-421. [136] Heo, K; Park, SG; Yoon, J; Jin, KS; Jin, S; Rhee, SW; Ree, M. J. Phys. Chem. C,
2007, 111, 10848-10854. [137] Heo, K; Yoon, J; Jin, S; Kim, J; Kim, KW; Shin, TJ; Chung, B; Chang, T; Ree, M. J.
Appl. Crystallogr., 2008, 41, 281-291. [138] Jin, S; Yoon, J; Heo, K; Park, HW; Shin, TJ; Chang, T; Ree, M. J. Appl.
Crystallogr., 2007, 40, 950-958. [139] Yoon, J; Choi, SC; Jin, S; Jin, KS; Heo, K; Ree, M. J. Appl. Crystallogr., 2007, 40,
s669-s674.
Moonhor Ree, Jinhwan Yoon and Kyuyoung Heo 312
[140] Yoon, J; Yang, SY; Heo, K; Lee, B; Joo, W; Kim, JK; Ree, M. J. Appl. Crystallogr.,
2007, 40, 305-312. [141] Harmer, MA; Farneth, WE; Sun, Q. J. Am. Chem. Soc., 1996, 118, (33), 7708-7715. [142] Kim, S; Toivola, Y; Cook, RF; Char, K; Chu, SH; Lee, JK; Yoon, DY; Rhee, HW. J.
Electrochem. Soc., 2004, 151, (3), F37-F44. [143] Pedersen, JS. J. Appl. Crystallogr., 1994, 27, 595-608. [144] Lin, EK; Lee, HJ; Lynn, GW; Wu, WL; O'Neill, ML. Appl. Phys. Lett., 2002, 81, (4),
607-609. [145] Lee, HJ; Lin, EK; Bauer, BJ; Wu, Wl; Hwang, BK; Gray, WD. Appl. Phys. Lett.,
2003, 82, 1084-1086. [146] Lee, HJ; Lin, EK; Wang, H; Wu, WL; Chen, W; Moyer, ES. Chem. Mater., 2002, 14,
(4), 1845-1852. [147] Hedden, RC; Lee, HJ; Soles, CL; Bauer, BJ. Langmuir, 2004, 20, (16), 6658-6667. [148] Wu, WL; Wallace, WE; Lin, EK; Lynn, GW; Glinka, CJ; Ryan, ET; Ho, HM. J.
Appl. Phys., 2000, 87, (3), 1193-1200. [149] Chamard, V; Bastie, P; Le Bolloch, D; Dolino, G; Elkaim, E; Ferrero, C; Lauriat, JP;
Rieutord, F; Thiaudiere, D. Phys. Rev. B - Condens. Matt. Mater. Phys., 2001, 64, (24), 2454161-2454164.
[150] Hedden, RC; Waldfried, C; Lee, HJ; Escorcia, O. J. Electrochem. Soc., 2004, 151, (8), F178-F181.
[151] Lee, TJ; Byun, G-S; Jin KS; Heo, K; Kim G; Kim, SY; Cho, I; Ree, M. Appl.
Crystallogr., 2007, 40, s620-s625. [152] Oh, W; Hwang, Y; Shin TJ; Lee, B; Kim, J-S; Yoon. J; Brennan, S; Mehta, A; Ree,
M. J. Appl. Crystallogr., 2007, 40, s626-s630. [153] Hatton, BD; Landskron, K; Whitnall, W; Perovic, DD; Ozin, GA. Adv. Funct.
Mater., 2005, 15, (5), 823-829. [154] Mori, H; Lanzendorfer, MG; Muller, AHE. Macromolecules, 2004, 37, 5228-5238. [155] Toivola, Y; Kim, S; Cook, RF; Char, K; Lee, JK; Yoon, DY; Rhee, HW; Kim, SY;
Jin, MY. J. Electrochem. Soc., 2004, 151, (3), F45-F53. [156] Silverstein, MS; Shach-Caplan, M; Bauer, BJ; Hedden, RC; Lee, HJ; Landes, BG.
Macromolecules, 2005, 38, 4301-4310. [157] Li, G; Zhou, H; Honma, I. Nat. Mater, 2004, 3, 65-72. [158] Gregg, SJ; Sing, KSW. Adsorption, Surface Area and Porosity. Academic Press:
London, New York, 1982. [159] Baklanov, MR; Dultsev, FN; Repinsky, SM. Poverkhnost, 1988, 11, 145-146. [160] Baklanov, MR; Vasilyeva, LL; Gavrilova, TA; Dultsev, FN; Mogilnikov, KP;
Nenasheva, LA. Thin Solid Films, 1989, 171, (1), 43-52. [161] Ramsay, JDF. MRS Bulletin, 1999, 24, (3), 36-40. [162] Baklanov, MR; Mogilnikov, KP; Polovinkin, VG; Dultsev, FN. J. Vac. Sci. Technol.,
B 2000, 18, (3), 1385-1391. [163] Dultsev, FN; Baklanov, MR. Electrochem. Solid-State Lett., 1999, 2, (2-4), 192-194. [164] Baklanov, MR; Mogilnikov, KP. Microelectronic Engineering, 2002, 64, (1-4), 335-
349. [165] Othman, MT; Lubguban, JA; Lubguban, AA; Gangopadhyay, S; Miller, RD;
Volksen, W; Kim, HC. J. Appl. Phys., 2006, 99, 083503-1-7.
Low-K Nanoporous Interdielectrics: Materials, Thin Film Fabrications, Structures… 313
[166] Shamiryan, D; Baklanov, MR; Maex, K. J. Vac. Sci. Technol. B, 2003, 21, (1), 220-226.
[167] Petkov, MP; Weber, MH; Lynn, KG; Rodbell, KP; Cohen, SA. Appl. Phys. Lett.,
1999, 74, 2146-2148. [168] Gidley, DW; Frieze, WE; Dull, TL; Sun, J; Yee, AF; Nguyen, CV; Yoon, DY. Appl.
Phys. Lett., 2000, 76, 1282-1284. [169] Petkov, MP; Weber, MH; Lynn, KG; Rodbell, KP. Appl. Phys. Lett., 2000, 77, 2470-
2472. [170] Sun, JN; Hu, YF; Frieze, WE; Gidley, DW. Radiat. Phys. Chem., 2003, 68, 345-349. [171] Dull, TL; Frieze, WE; Gidley, DW; Sun, JN; Yee, AF. J. Phys. Chem. B, 2001, 105,
(20), 4657-4662. [172] Sun, JN; Hu, Y; Frieze, WE; Chen, W; Gidley, DW. J. Electrochem. Soc., 2003, 150,
(5). [173] Sun, JN; Gidley, DW; Dull, TL; Frieze, WE; Yee, AF; Ryan, ET; Lin, S; Wetzel, J.
J. Appl. Phys., 2001, 89, (9), 5138-5144. [174] Gidley, DW; Frieze, WE; Dull, TL; Yee, AF; Ryan, ET; Ho, HM. Phys. Rev. B -
Condens. Matt. Mater. Phys., 1999, 60, (8), R5157-R5160. [175] Sun, JN; Gidley, DW; Hu, Y; Frieze, WE; Ryan, ET. Appl. Phys. Lett., 2002, 81, (8),
1447-1449. [176] Peng, HG; Frieze, WE; Vallery, RS; Gidley, DW; Moore, DL; Carter, RJ. Appl.
Phys. Lett., 2005, 86, (12), 1-3. [177] Tian, D; Blacher, S; Pirard, JP; Jerome, R. Langmuir, 1998, 14, (7), 1905-1910. [178] Grill, A; Patel, V; Rodbell, KP; Huang, E; Baklanov, MR; Mogilnikov, KP; Toney,
M; Kim, HC. J. Appl. Phys., 2003, 94, (5), 3427-3435. [179] Yu, S; Wong, TK. S; Hu, X; Pita, K. J. Electrochem. Soc., 2003, 150, (5), F116-
F121.

In: Nanoporous Materials Types, Properties and Uses ISBN: 978-1-61668-182-1 Editor: Samuel B. Jenkins, pp. 315-354 © 2010 Nova Science Publishers, Inc.
Chapter 11
NOVEL MANUFACTURING AND PROCESSING
TECHNOLOGIES OF NANOPOROUS SILICON
Jia-Chuan Lin and Wei-Chih Tsai Department of Electronics Engineering, St. John‘s University, Taipei 25135,
Taiwan, R.O.C, Institute of Microelectronics, Department of Electrical Engineering, National Cheng Kung University, Tainan 70101, Taiwan, R.O.C.
ABSTRACT
Porous silicon (PS) films consisting of many pores and pillars are widely used to yield efficient visible photoluminescence (PL) and electroluminescence (EL) at room temperature. Such light-emission behaviors are primarily attributed to electron confinement in the nanocrystals that constitute the PS film. Also, the PS film shows a unique electrical property of negative difference conductance (NDC) for the carrier mobility difference in different sizes of pores and pillars.
The techniques of PS formation have been developed by many different methods. Among them, electrochemical anodization is the most commonly used. The anodization is performed in a hydrogen fluoride (HF) solution with an anodic current on the sample. However, it is very difficult to control the manufacturing parameters precisely in the manufacturing processes. Especially in nano-scale, the anisotropic etching or selective etching cannot be easily achieved in the wet-etching method. However, it is well known that nano-scaled PS (NPS) shows light emission more readily in the visible range than macro-PS does. Therefore, precise control of the NPS formation is very important.
In this chapter, the authors introduce three novel manufacturing technologies. In the first method, the Hall-effect is applied in the electrochemical anodization. By Lorentz force, the carriers can be well swept to the allocated areas. In the second method, a forward biased pn-junction is used for bottom-hole assistance. The NPS films with nano-scaled pores and high-aspect-ratio pillars can be formed. In the third method, the authors proposed a simple and mask-free method for the fabrication of patterned PS using a localized electric field. The electric field is applied by patterned electrodes (anode and cathode) which are placed horizontally underneath the sample. No masking-layer or related photo-lithography processes are needed in this method. Strong visible photoluminescence emissions in PS can be obtained by these novel methods.
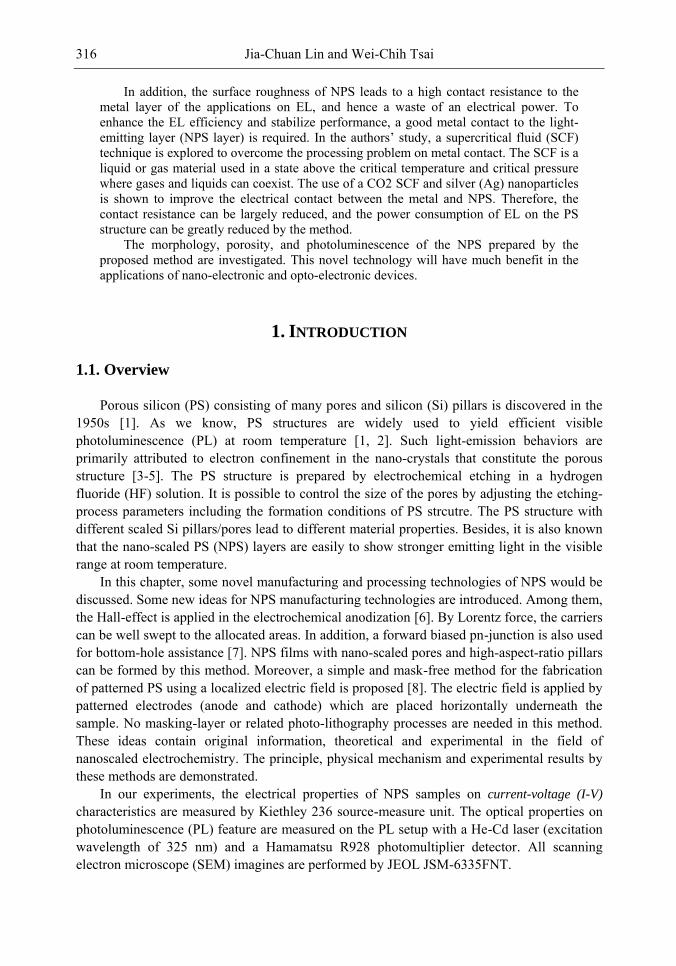
Jia-Chuan Lin and Wei-Chih Tsai 316
In addition, the surface roughness of NPS leads to a high contact resistance to the metal layer of the applications on EL, and hence a waste of an electrical power. To enhance the EL efficiency and stabilize performance, a good metal contact to the light-emitting layer (NPS layer) is required. In the authors‘ study, a supercritical fluid (SCF) technique is explored to overcome the processing problem on metal contact. The SCF is a liquid or gas material used in a state above the critical temperature and critical pressure where gases and liquids can coexist. The use of a CO2 SCF and silver (Ag) nanoparticles is shown to improve the electrical contact between the metal and NPS. Therefore, the contact resistance can be largely reduced, and the power consumption of EL on the PS structure can be greatly reduced by the method.
The morphology, porosity, and photoluminescence of the NPS prepared by the proposed method are investigated. This novel technology will have much benefit in the applications of nano-electronic and opto-electronic devices.
1. INTRODUCTION
1.1. Overview
Porous silicon (PS) consisting of many pores and silicon (Si) pillars is discovered in the 1950s [1]. As we know, PS structures are widely used to yield efficient visible photoluminescence (PL) at room temperature [1, 2]. Such light-emission behaviors are primarily attributed to electron confinement in the nano-crystals that constitute the porous structure [3-5]. The PS structure is prepared by electrochemical etching in a hydrogen fluoride (HF) solution. It is possible to control the size of the pores by adjusting the etching-process parameters including the formation conditions of PS strcutre. The PS structure with different scaled Si pillars/pores lead to different material properties. Besides, it is also known that the nano-scaled PS (NPS) layers are easily to show stronger emitting light in the visible range at room temperature.
In this chapter, some novel manufacturing and processing technologies of NPS would be discussed. Some new ideas for NPS manufacturing technologies are introduced. Among them, the Hall-effect is applied in the electrochemical anodization [6]. By Lorentz force, the carriers can be well swept to the allocated areas. In addition, a forward biased pn-junction is also used for bottom-hole assistance [7]. NPS films with nano-scaled pores and high-aspect-ratio pillars can be formed by this method. Moreover, a simple and mask-free method for the fabrication of patterned PS using a localized electric field is proposed [8]. The electric field is applied by patterned electrodes (anode and cathode) which are placed horizontally underneath the sample. No masking-layer or related photo-lithography processes are needed in this method. These ideas contain original information, theoretical and experimental in the field of nanoscaled electrochemistry. The principle, physical mechanism and experimental results by these methods are demonstrated.
In our experiments, the electrical properties of NPS samples on current-voltage (I-V) characteristics are measured by Kiethley 236 source-measure unit. The optical properties on photoluminescence (PL) feature are measured on the PL setup with a He-Cd laser (excitation wavelength of 325 nm) and a Hamamatsu R928 photomultiplier detector. All scanning electron microscope (SEM) imagines are performed by JEOL JSM-6335FNT.
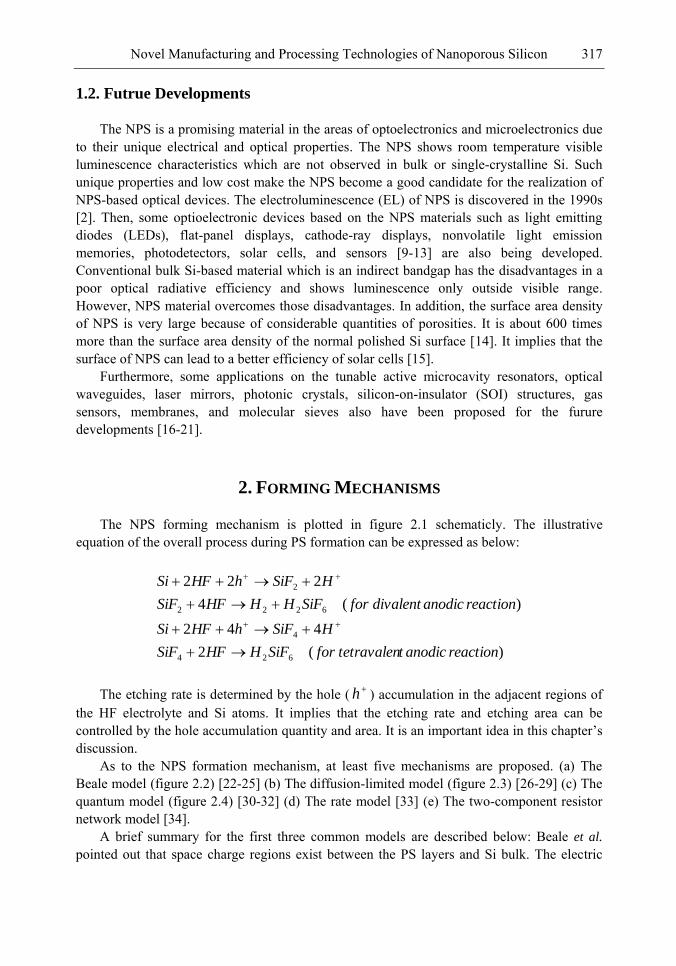
Novel Manufacturing and Processing Technologies of Nanoporous Silicon 317
1.2. Futrue Developments
The NPS is a promising material in the areas of optoelectronics and microelectronics due to their unique electrical and optical properties. The NPS shows room temperature visible luminescence characteristics which are not observed in bulk or single-crystalline Si. Such unique properties and low cost make the NPS become a good candidate for the realization of NPS-based optical devices. The electroluminescence (EL) of NPS is discovered in the 1990s [2]. Then, some optioelectronic devices based on the NPS materials such as light emitting diodes (LEDs), flat-panel displays, cathode-ray displays, nonvolatile light emission memories, photodetectors, solar cells, and sensors [9-13] are also being developed. Conventional bulk Si-based material which is an indirect bandgap has the disadvantages in a poor optical radiative efficiency and shows luminescence only outside visible range. However, NPS material overcomes those disadvantages. In addition, the surface area density of NPS is very large because of considerable quantities of porosities. It is about 600 times more than the surface area density of the normal polished Si surface [14]. It implies that the surface of NPS can lead to a better efficiency of solar cells [15].
Furthermore, some applications on the tunable active microcavity resonators, optical waveguides, laser mirrors, photonic crystals, silicon-on-insulator (SOI) structures, gas sensors, membranes, and molecular sieves also have been proposed for the furure developments [16-21].
2. FORMING MECHANISMS
The NPS forming mechanism is plotted in figure 2.1 schematicly. The illustrative equation of the overall process during PS formation can be expressed as below:
)(2
442
)(4
222
624
4
6222
2
reactionanodicttetravalenforSiFHHFSiF
HSiFhHFSi
reactionanodicdivalentforSiFHHHFSiF
HSiFhHFSi
The etching rate is determined by the hole ( h ) accumulation in the adjacent regions of the HF electrolyte and Si atoms. It implies that the etching rate and etching area can be controlled by the hole accumulation quantity and area. It is an important idea in this chapter‘s discussion.
As to the NPS formation mechanism, at least five mechanisms are proposed. (a) The Beale model (figure 2.2) [22-25] (b) The diffusion-limited model (figure 2.3) [26-29] (c) The quantum model (figure 2.4) [30-32] (d) The rate model [33] (e) The two-component resistor network model [34].
A brief summary for the first three common models are described below: Beale et al. pointed out that space charge regions exist between the PS layers and Si bulk. The electric
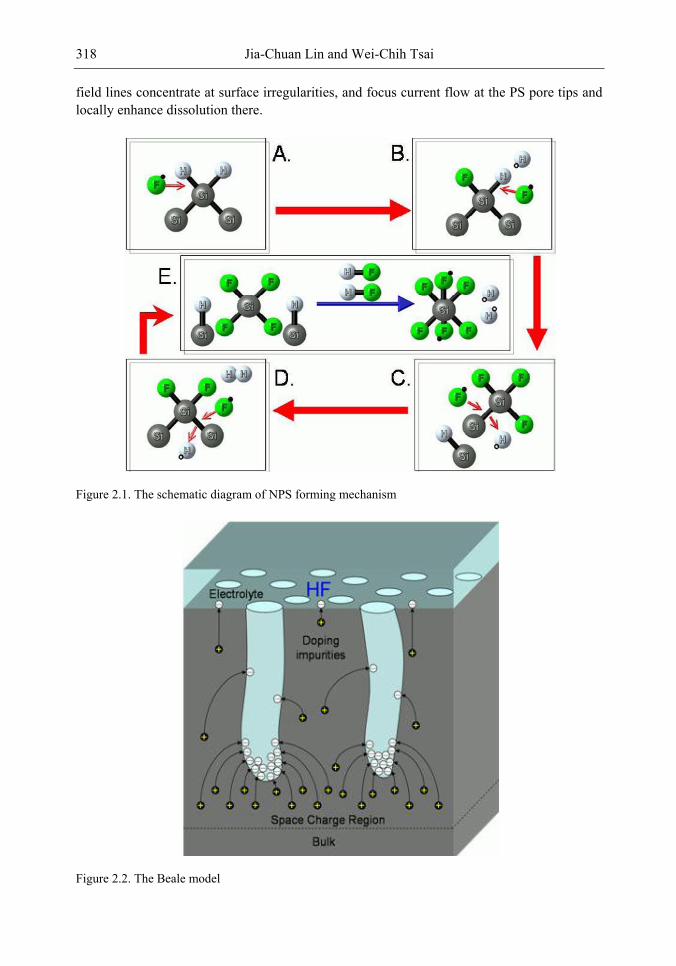
Jia-Chuan Lin and Wei-Chih Tsai 318
field lines concentrate at surface irregularities, and focus current flow at the PS pore tips and locally enhance dissolution there.
Figure 2.1. The schematic diagram of NPS forming mechanism
Figure 2.2. The Beale model
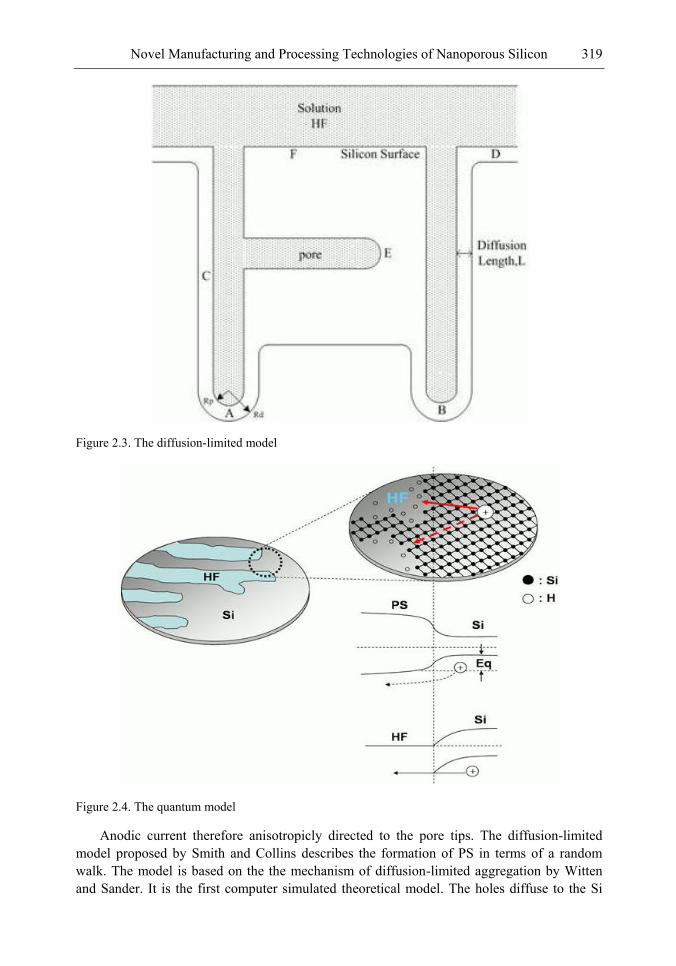
Novel Manufacturing and Processing Technologies of Nanoporous Silicon 319
Figure 2.3. The diffusion-limited model
Figure 2.4. The quantum model
Anodic current therefore anisotropicly directed to the pore tips. The diffusion-limited model proposed by Smith and Collins describes the formation of PS in terms of a random walk. The model is based on the the mechanism of diffusion-limited aggregation by Witten and Sander. It is the first computer simulated theoretical model. The holes diffuse to the Si
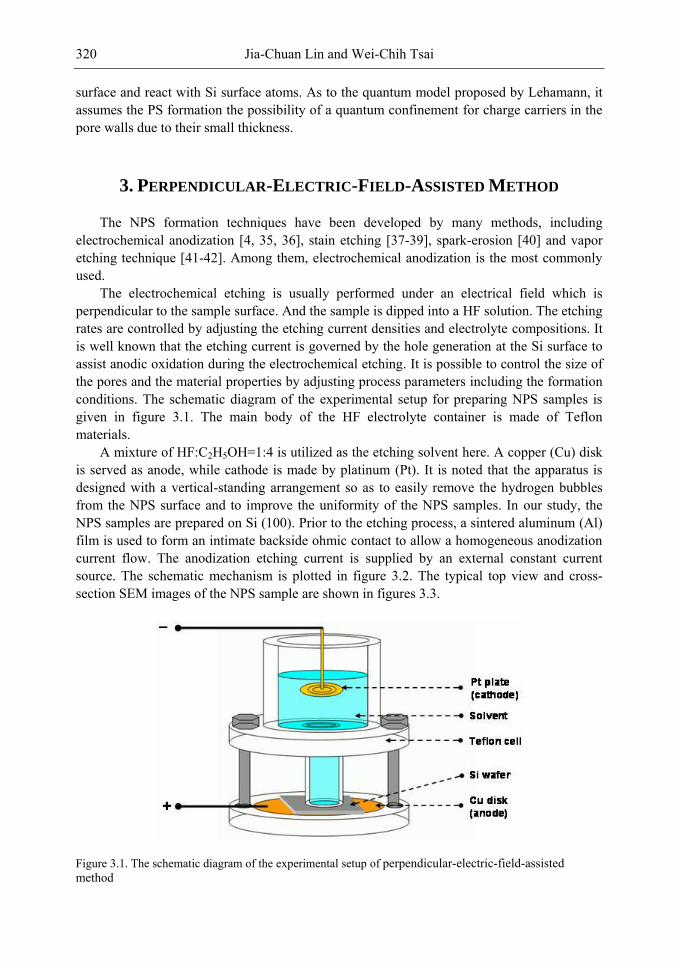
Jia-Chuan Lin and Wei-Chih Tsai 320
surface and react with Si surface atoms. As to the quantum model proposed by Lehamann, it assumes the PS formation the possibility of a quantum confinement for charge carriers in the pore walls due to their small thickness.
3. PERPENDICULAR-ELECTRIC-FIELD-ASSISTED METHOD
The NPS formation techniques have been developed by many methods, including electrochemical anodization [4, 35, 36], stain etching [37-39], spark-erosion [40] and vapor etching technique [41-42]. Among them, electrochemical anodization is the most commonly used.
The electrochemical etching is usually performed under an electrical field which is perpendicular to the sample surface. And the sample is dipped into a HF solution. The etching rates are controlled by adjusting the etching current densities and electrolyte compositions. It is well known that the etching current is governed by the hole generation at the Si surface to assist anodic oxidation during the electrochemical etching. It is possible to control the size of the pores and the material properties by adjusting process parameters including the formation conditions. The schematic diagram of the experimental setup for preparing NPS samples is given in figure 3.1. The main body of the HF electrolyte container is made of Teflon materials.
A mixture of HF:C2H5OH=1:4 is utilized as the etching solvent here. A copper (Cu) disk is served as anode, while cathode is made by platinum (Pt). It is noted that the apparatus is designed with a vertical-standing arrangement so as to easily remove the hydrogen bubbles from the NPS surface and to improve the uniformity of the NPS samples. In our study, the NPS samples are prepared on Si (100). Prior to the etching process, a sintered aluminum (Al) film is used to form an intimate backside ohmic contact to allow a homogeneous anodization current flow. The anodization etching current is supplied by an external constant current source. The schematic mechanism is plotted in figure 3.2. The typical top view and cross-section SEM images of the NPS sample are shown in figures 3.3.
Figure 3.1. The schematic diagram of the experimental setup of perpendicular-electric-field-assisted method
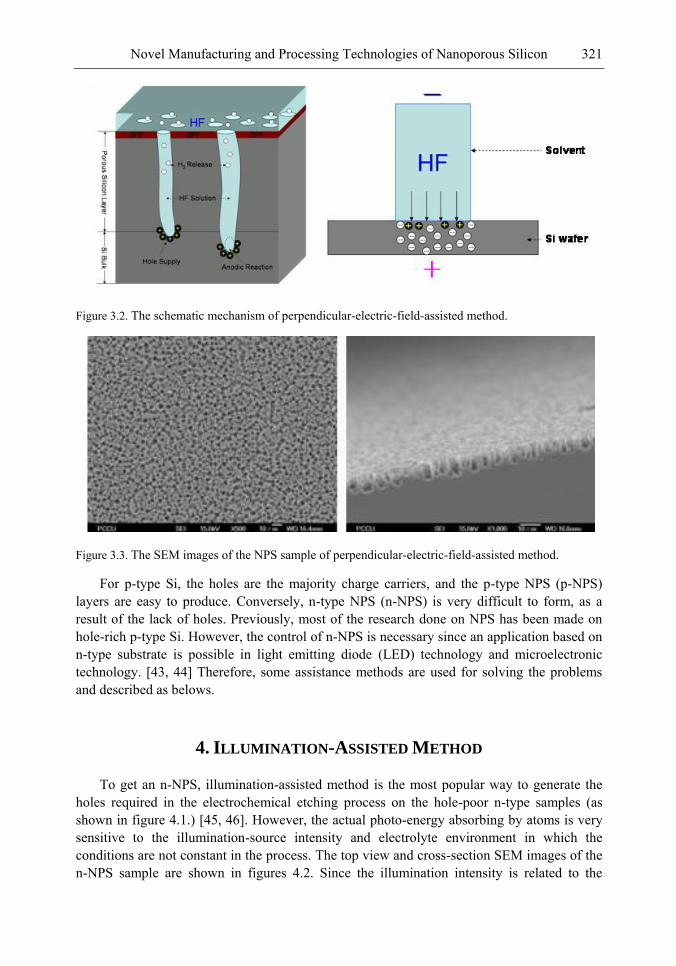
Novel Manufacturing and Processing Technologies of Nanoporous Silicon 321
Figure 3.2. The schematic mechanism of perpendicular-electric-field-assisted method.
Figure 3.3. The SEM images of the NPS sample of perpendicular-electric-field-assisted method.
For p-type Si, the holes are the majority charge carriers, and the p-type NPS (p-NPS) layers are easy to produce. Conversely, n-type NPS (n-NPS) is very difficult to form, as a result of the lack of holes. Previously, most of the research done on NPS has been made on hole-rich p-type Si. However, the control of n-NPS is necessary since an application based on n-type substrate is possible in light emitting diode (LED) technology and microelectronic technology. [43, 44] Therefore, some assistance methods are used for solving the problems and described as belows.
4. ILLUMINATION-ASSISTED METHOD
To get an n-NPS, illumination-assisted method is the most popular way to generate the holes required in the electrochemical etching process on the hole-poor n-type samples (as shown in figure 4.1.) [45, 46]. However, the actual photo-energy absorbing by atoms is very sensitive to the illumination-source intensity and electrolyte environment in which the conditions are not constant in the process. The top view and cross-section SEM images of the n-NPS sample are shown in figures 4.2. Since the illumination intensity is related to the
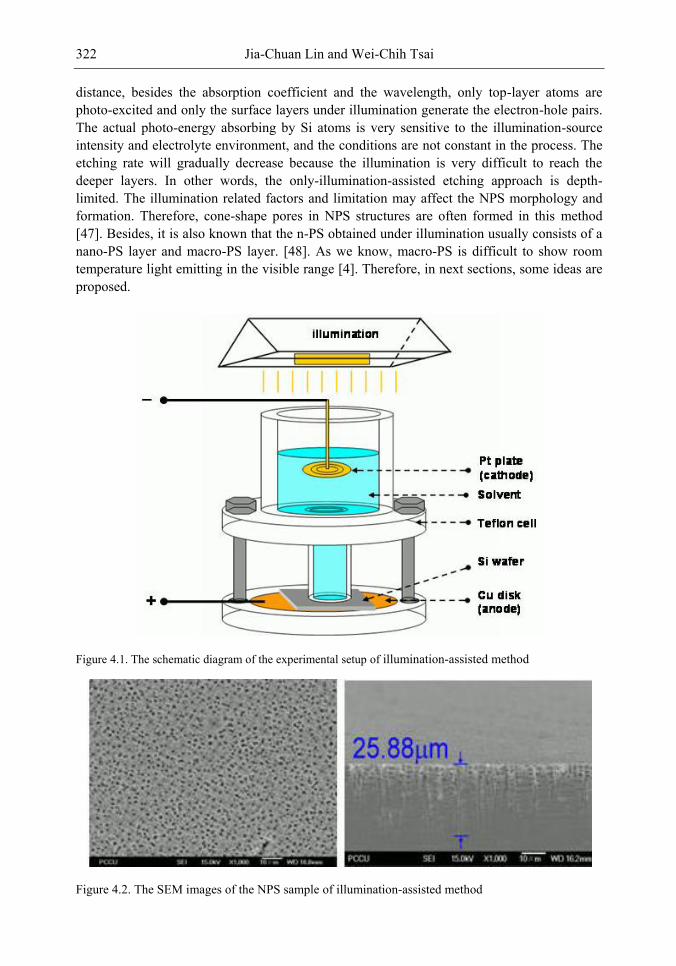
Jia-Chuan Lin and Wei-Chih Tsai 322
distance, besides the absorption coefficient and the wavelength, only top-layer atoms are photo-excited and only the surface layers under illumination generate the electron-hole pairs. The actual photo-energy absorbing by Si atoms is very sensitive to the illumination-source intensity and electrolyte environment, and the conditions are not constant in the process. The etching rate will gradually decrease because the illumination is very difficult to reach the deeper layers. In other words, the only-illumination-assisted etching approach is depth-limited. The illumination related factors and limitation may affect the NPS morphology and formation. Therefore, cone-shape pores in NPS structures are often formed in this method [47]. Besides, it is also known that the n-PS obtained under illumination usually consists of a nano-PS layer and macro-PS layer. [48]. As we know, macro-PS is difficult to show room temperature light emitting in the visible range [4]. Therefore, in next sections, some ideas are proposed.
Figure 4.1. The schematic diagram of the experimental setup of illumination-assisted method
Figure 4.2. The SEM images of the NPS sample of illumination-assisted method
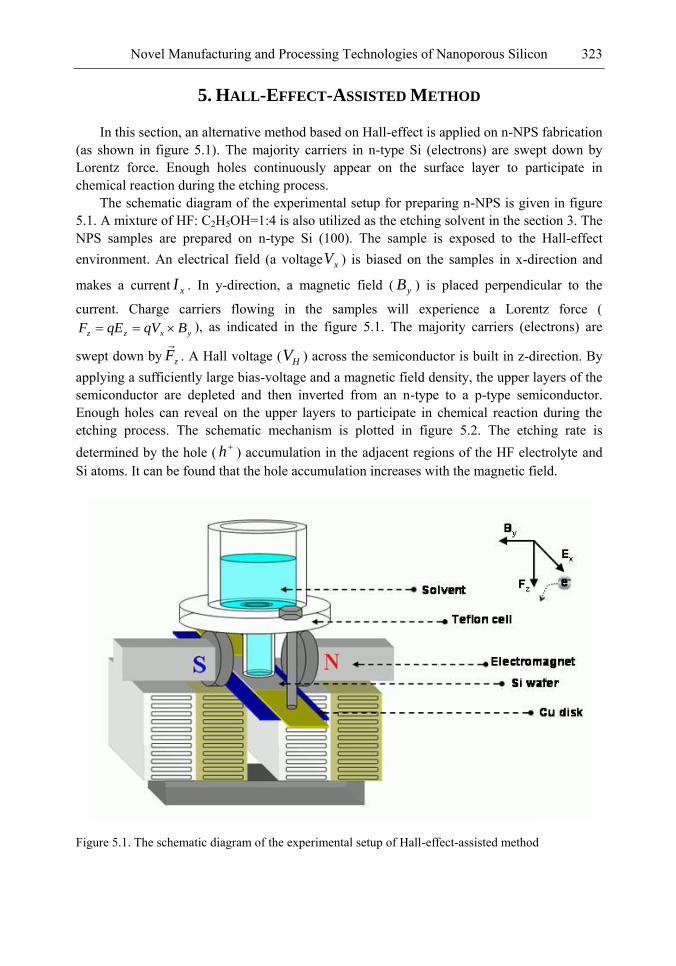
Novel Manufacturing and Processing Technologies of Nanoporous Silicon 323
5. HALL-EFFECT-ASSISTED METHOD
In this section, an alternative method based on Hall-effect is applied on n-NPS fabrication (as shown in figure 5.1). The majority carriers in n-type Si (electrons) are swept down by Lorentz force. Enough holes continuously appear on the surface layer to participate in chemical reaction during the etching process.
The schematic diagram of the experimental setup for preparing n-NPS is given in figure 5.1. A mixture of HF: C2H5OH=1:4 is also utilized as the etching solvent in the section 3. The NPS samples are prepared on n-type Si (100). The sample is exposed to the Hall-effect environment. An electrical field (a voltage xV ) is biased on the samples in x-direction and
makes a current xI . In y-direction, a magnetic field ( yB ) is placed perpendicular to the
current. Charge carriers flowing in the samples will experience a Lorentz force (yxzz BqVqEF ), as indicated in the figure 5.1. The majority carriers (electrons) are
swept down by zF
. A Hall voltage ( HV ) across the semiconductor is built in z-direction. By applying a sufficiently large bias-voltage and a magnetic field density, the upper layers of the semiconductor are depleted and then inverted from an n-type to a p-type semiconductor. Enough holes can reveal on the upper layers to participate in chemical reaction during the etching process. The schematic mechanism is plotted in figure 5.2. The etching rate is determined by the hole ( h ) accumulation in the adjacent regions of the HF electrolyte and Si atoms. It can be found that the hole accumulation increases with the magnetic field.
Figure 5.1. The schematic diagram of the experimental setup of Hall-effect-assisted method
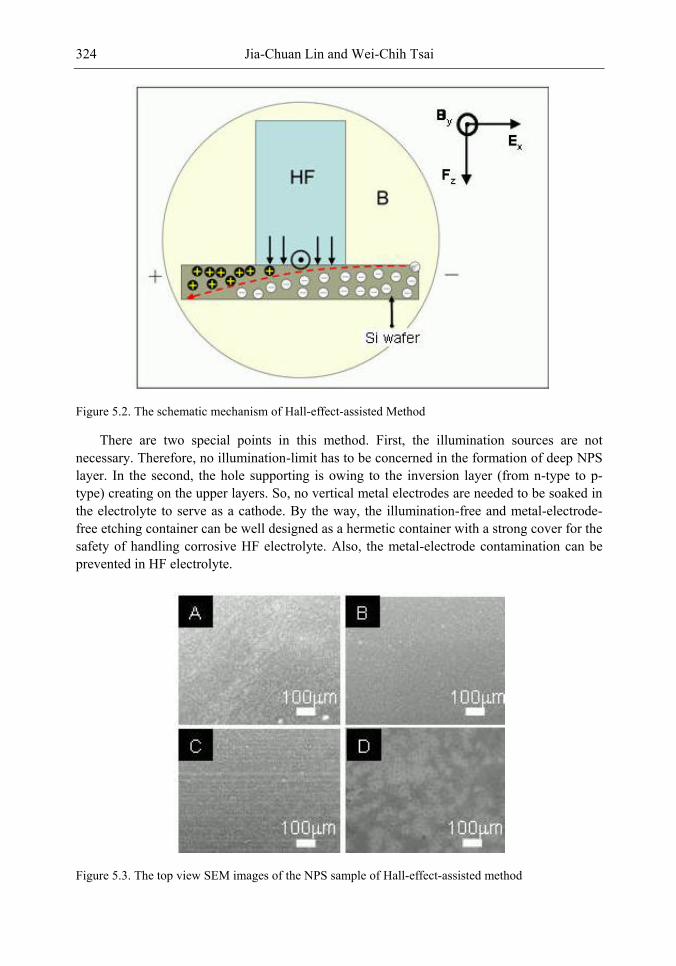
Jia-Chuan Lin and Wei-Chih Tsai 324
Figure 5.2. The schematic mechanism of Hall-effect-assisted Method
There are two special points in this method. First, the illumination sources are not necessary. Therefore, no illumination-limit has to be concerned in the formation of deep NPS layer. In the second, the hole supporting is owing to the inversion layer (from n-type to p-type) creating on the upper layers. So, no vertical metal electrodes are needed to be soaked in the electrolyte to serve as a cathode. By the way, the illumination-free and metal-electrode-free etching container can be well designed as a hermetic container with a strong cover for the safety of handling corrosive HF electrolyte. Also, the metal-electrode contamination can be prevented in HF electrolyte.
Figure 5.3. The top view SEM images of the NPS sample of Hall-effect-assisted method
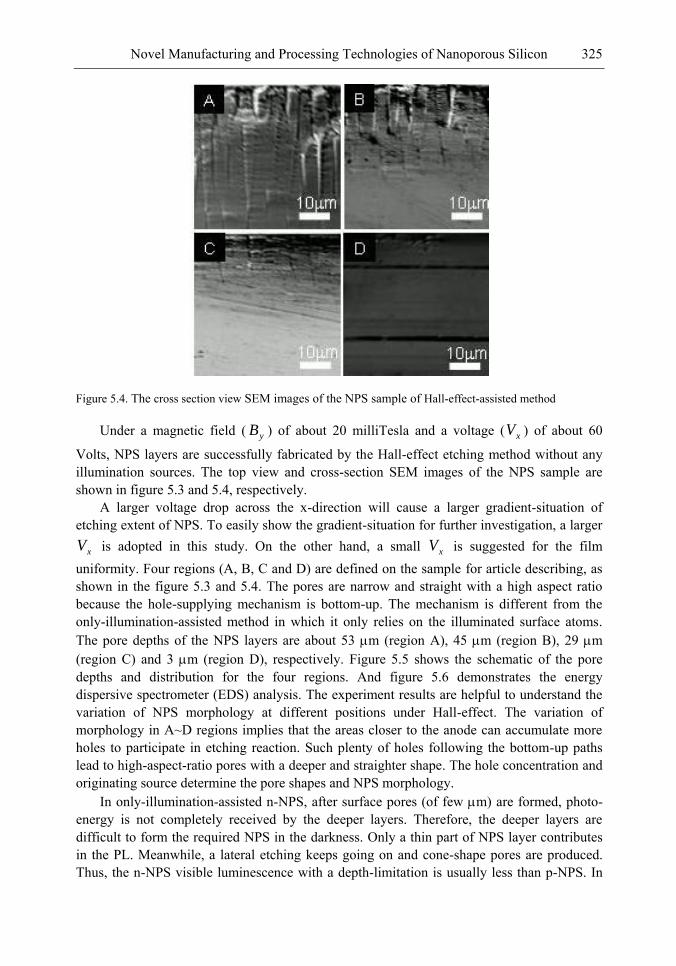
Novel Manufacturing and Processing Technologies of Nanoporous Silicon 325
Figure 5.4. The cross section view SEM images of the NPS sample of Hall-effect-assisted method
Under a magnetic field ( yB ) of about 20 milliTesla and a voltage ( xV ) of about 60
Volts, NPS layers are successfully fabricated by the Hall-effect etching method without any illumination sources. The top view and cross-section SEM images of the NPS sample are shown in figure 5.3 and 5.4, respectively.
A larger voltage drop across the x-direction will cause a larger gradient-situation of etching extent of NPS. To easily show the gradient-situation for further investigation, a larger
xV is adopted in this study. On the other hand, a small xV is suggested for the film uniformity. Four regions (A, B, C and D) are defined on the sample for article describing, as shown in the figure 5.3 and 5.4. The pores are narrow and straight with a high aspect ratio because the hole-supplying mechanism is bottom-up. The mechanism is different from the only-illumination-assisted method in which it only relies on the illuminated surface atoms. The pore depths of the NPS layers are about 53 m (region A), 45 m (region B), 29 m (region C) and 3 m (region D), respectively. Figure 5.5 shows the schematic of the pore depths and distribution for the four regions. And figure 5.6 demonstrates the energy dispersive spectrometer (EDS) analysis. The experiment results are helpful to understand the variation of NPS morphology at different positions under Hall-effect. The variation of morphology in A~D regions implies that the areas closer to the anode can accumulate more holes to participate in etching reaction. Such plenty of holes following the bottom-up paths lead to high-aspect-ratio pores with a deeper and straighter shape. The hole concentration and originating source determine the pore shapes and NPS morphology.
In only-illumination-assisted n-NPS, after surface pores (of few m) are formed, photo-energy is not completely received by the deeper layers. Therefore, the deeper layers are difficult to form the required NPS in the darkness. Only a thin part of NPS layer contributes in the PL. Meanwhile, a lateral etching keeps going on and cone-shape pores are produced. Thus, the n-NPS visible luminescence with a depth-limitation is usually less than p-NPS. In
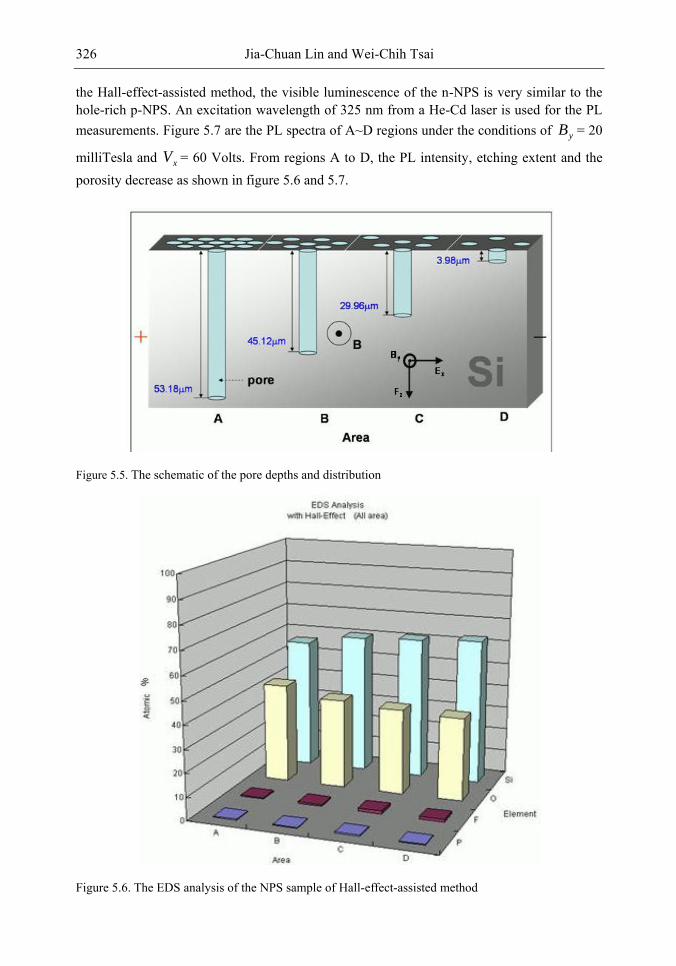
Jia-Chuan Lin and Wei-Chih Tsai 326
the Hall-effect-assisted method, the visible luminescence of the n-NPS is very similar to the hole-rich p-NPS. An excitation wavelength of 325 nm from a He-Cd laser is used for the PL measurements. Figure 5.7 are the PL spectra of A~D regions under the conditions of yB = 20
milliTesla and xV = 60 Volts. From regions A to D, the PL intensity, etching extent and the porosity decrease as shown in figure 5.6 and 5.7.
Figure 5.5. The schematic of the pore depths and distribution
Figure 5.6. The EDS analysis of the NPS sample of Hall-effect-assisted method
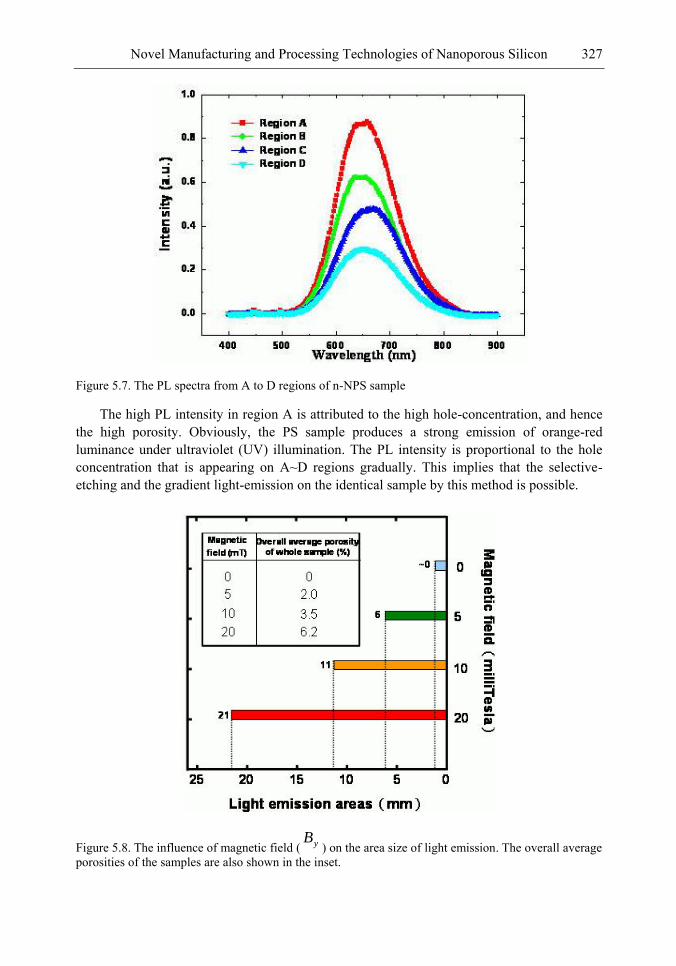
Novel Manufacturing and Processing Technologies of Nanoporous Silicon 327
Figure 5.7. The PL spectra from A to D regions of n-NPS sample
The high PL intensity in region A is attributed to the high hole-concentration, and hence the high porosity. Obviously, the PS sample produces a strong emission of orange-red luminance under ultraviolet (UV) illumination. The PL intensity is proportional to the hole concentration that is appearing on A~D regions gradually. This implies that the selective-etching and the gradient light-emission on the identical sample by this method is possible.
Figure 5.8. The influence of magnetic field ( yB) on the area size of light emission. The overall average
porosities of the samples are also shown in the inset.
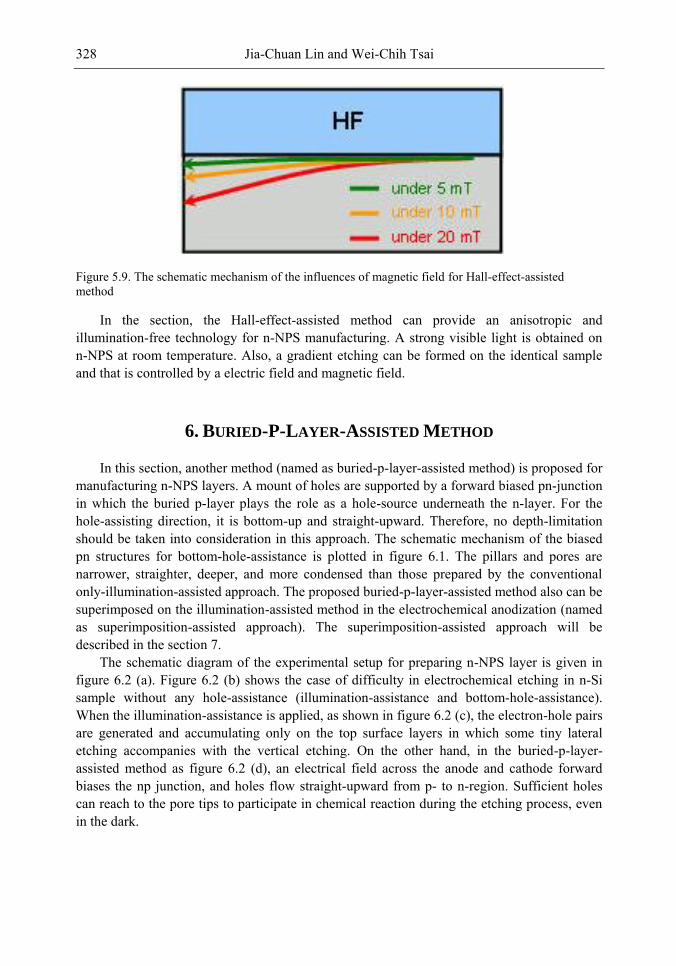
Jia-Chuan Lin and Wei-Chih Tsai 328
Figure 5.9. The schematic mechanism of the influences of magnetic field for Hall-effect-assisted method
In the section, the Hall-effect-assisted method can provide an anisotropic and illumination-free technology for n-NPS manufacturing. A strong visible light is obtained on n-NPS at room temperature. Also, a gradient etching can be formed on the identical sample and that is controlled by a electric field and magnetic field.
6. BURIED-P-LAYER-ASSISTED METHOD
In this section, another method (named as buried-p-layer-assisted method) is proposed for manufacturing n-NPS layers. A mount of holes are supported by a forward biased pn-junction in which the buried p-layer plays the role as a hole-source underneath the n-layer. For the hole-assisting direction, it is bottom-up and straight-upward. Therefore, no depth-limitation should be taken into consideration in this approach. The schematic mechanism of the biased pn structures for bottom-hole-assistance is plotted in figure 6.1. The pillars and pores are narrower, straighter, deeper, and more condensed than those prepared by the conventional only-illumination-assisted approach. The proposed buried-p-layer-assisted method also can be superimposed on the illumination-assisted method in the electrochemical anodization (named as superimposition-assisted approach). The superimposition-assisted approach will be described in the section 7.
The schematic diagram of the experimental setup for preparing n-NPS layer is given in figure 6.2 (a). Figure 6.2 (b) shows the case of difficulty in electrochemical etching in n-Si sample without any hole-assistance (illumination-assistance and bottom-hole-assistance). When the illumination-assistance is applied, as shown in figure 6.2 (c), the electron-hole pairs are generated and accumulating only on the top surface layers in which some tiny lateral etching accompanies with the vertical etching. On the other hand, in the buried-p-layer-assisted method as figure 6.2 (d), an electrical field across the anode and cathode forward biases the np junction, and holes flow straight-upward from p- to n-region. Sufficient holes can reach to the pore tips to participate in chemical reaction during the etching process, even in the dark.
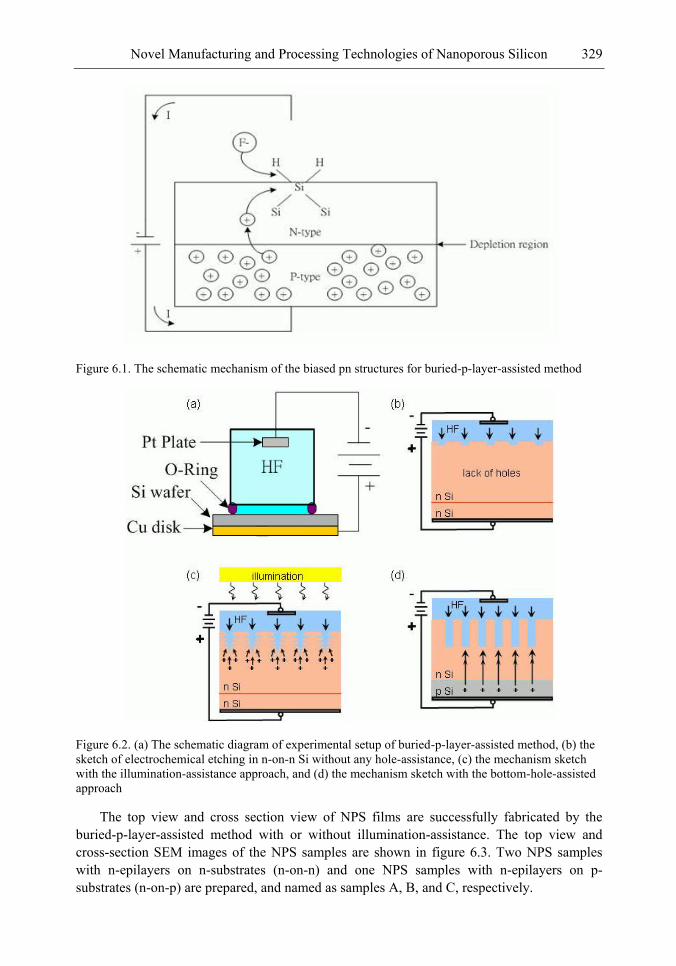
Novel Manufacturing and Processing Technologies of Nanoporous Silicon 329
Figure 6.1. The schematic mechanism of the biased pn structures for buried-p-layer-assisted method
Figure 6.2. (a) The schematic diagram of experimental setup of buried-p-layer-assisted method, (b) the sketch of electrochemical etching in n-on-n Si without any hole-assistance, (c) the mechanism sketch with the illumination-assistance approach, and (d) the mechanism sketch with the bottom-hole-assisted approach
The top view and cross section view of NPS films are successfully fabricated by the buried-p-layer-assisted method with or without illumination-assistance. The top view and cross-section SEM images of the NPS samples are shown in figure 6.3. Two NPS samples with n-epilayers on n-substrates (n-on-n) and one NPS samples with n-epilayers on p-substrates (n-on-p) are prepared, and named as samples A, B, and C, respectively.
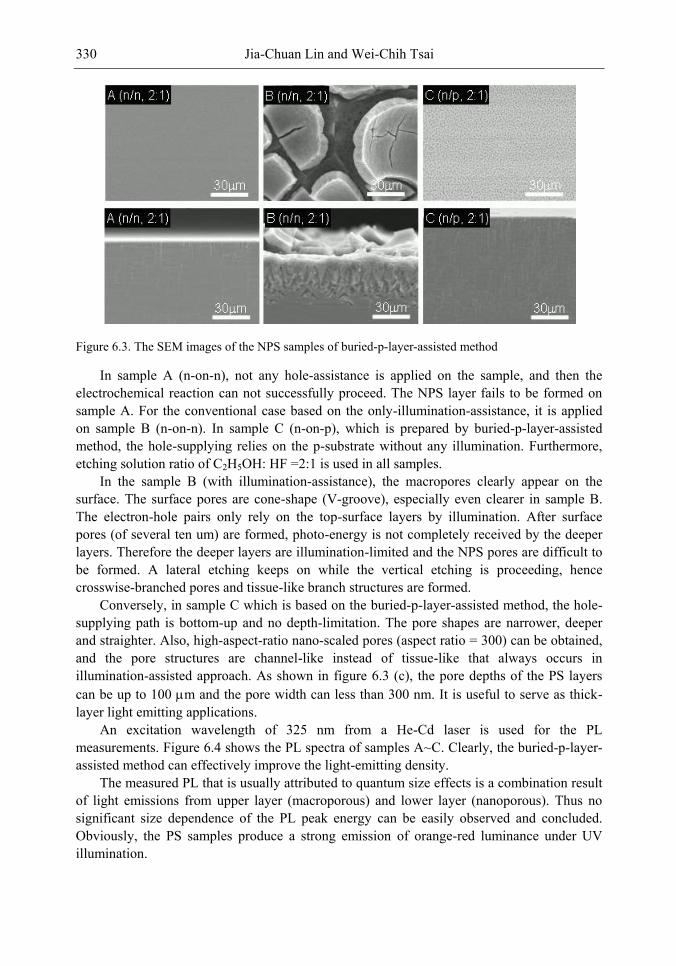
Jia-Chuan Lin and Wei-Chih Tsai 330
Figure 6.3. The SEM images of the NPS samples of buried-p-layer-assisted method
In sample A (n-on-n), not any hole-assistance is applied on the sample, and then the electrochemical reaction can not successfully proceed. The NPS layer fails to be formed on sample A. For the conventional case based on the only-illumination-assistance, it is applied on sample B (n-on-n). In sample C (n-on-p), which is prepared by buried-p-layer-assisted method, the hole-supplying relies on the p-substrate without any illumination. Furthermore, etching solution ratio of C2H5OH: HF =2:1 is used in all samples.
In the sample B (with illumination-assistance), the macropores clearly appear on the surface. The surface pores are cone-shape (V-groove), especially even clearer in sample B. The electron-hole pairs only rely on the top-surface layers by illumination. After surface pores (of several ten um) are formed, photo-energy is not completely received by the deeper layers. Therefore the deeper layers are illumination-limited and the NPS pores are difficult to be formed. A lateral etching keeps on while the vertical etching is proceeding, hence crosswise-branched pores and tissue-like branch structures are formed.
Conversely, in sample C which is based on the buried-p-layer-assisted method, the hole-supplying path is bottom-up and no depth-limitation. The pore shapes are narrower, deeper and straighter. Also, high-aspect-ratio nano-scaled pores (aspect ratio = 300) can be obtained, and the pore structures are channel-like instead of tissue-like that always occurs in illumination-assisted approach. As shown in figure 6.3 (c), the pore depths of the PS layers can be up to 100 m and the pore width can less than 300 nm. It is useful to serve as thick-layer light emitting applications.
An excitation wavelength of 325 nm from a He-Cd laser is used for the PL measurements. Figure 6.4 shows the PL spectra of samples A~C. Clearly, the buried-p-layer-assisted method can effectively improve the light-emitting density.
The measured PL that is usually attributed to quantum size effects is a combination result of light emissions from upper layer (macroporous) and lower layer (nanoporous). Thus no significant size dependence of the PL peak energy can be easily observed and concluded. Obviously, the PS samples produce a strong emission of orange-red luminance under UV illumination.
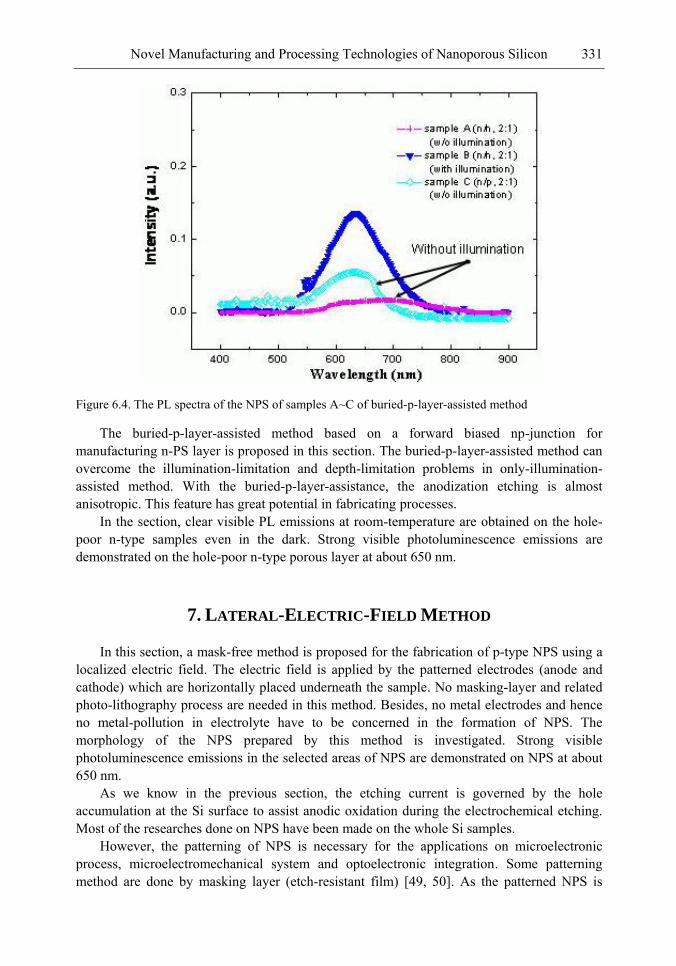
Novel Manufacturing and Processing Technologies of Nanoporous Silicon 331
Figure 6.4. The PL spectra of the NPS of samples A~C of buried-p-layer-assisted method
The buried-p-layer-assisted method based on a forward biased np-junction for manufacturing n-PS layer is proposed in this section. The buried-p-layer-assisted method can overcome the illumination-limitation and depth-limitation problems in only-illumination-assisted method. With the buried-p-layer-assistance, the anodization etching is almost anisotropic. This feature has great potential in fabricating processes.
In the section, clear visible PL emissions at room-temperature are obtained on the hole-poor n-type samples even in the dark. Strong visible photoluminescence emissions are demonstrated on the hole-poor n-type porous layer at about 650 nm.
7. LATERAL-ELECTRIC-FIELD METHOD
In this section, a mask-free method is proposed for the fabrication of p-type NPS using a localized electric field. The electric field is applied by the patterned electrodes (anode and cathode) which are horizontally placed underneath the sample. No masking-layer and related photo-lithography process are needed in this method. Besides, no metal electrodes and hence no metal-pollution in electrolyte have to be concerned in the formation of NPS. The morphology of the NPS prepared by this method is investigated. Strong visible photoluminescence emissions in the selected areas of NPS are demonstrated on NPS at about 650 nm.
As we know in the previous section, the etching current is governed by the hole accumulation at the Si surface to assist anodic oxidation during the electrochemical etching. Most of the researches done on NPS have been made on the whole Si samples.
However, the patterning of NPS is necessary for the applications on microelectronic process, microelectromechanical system and optoelectronic integration. Some patterning method are done by masking layer (etch-resistant film) [49, 50]. As the patterned NPS is
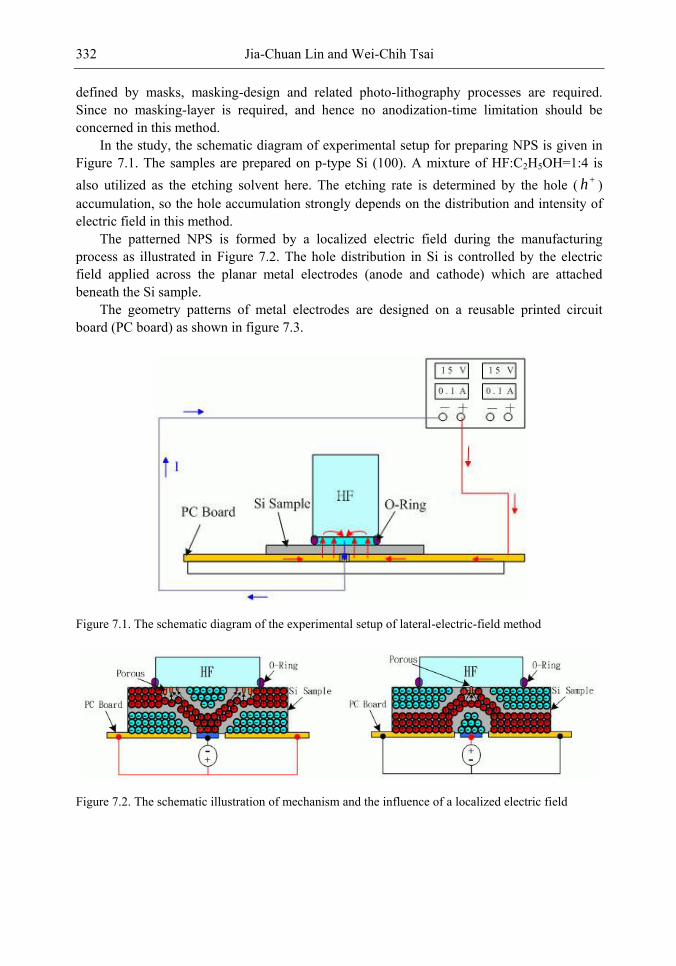
Jia-Chuan Lin and Wei-Chih Tsai 332
defined by masks, masking-design and related photo-lithography processes are required. Since no masking-layer is required, and hence no anodization-time limitation should be concerned in this method.
In the study, the schematic diagram of experimental setup for preparing NPS is given in Figure 7.1. The samples are prepared on p-type Si (100). A mixture of HF:C2H5OH=1:4 is also utilized as the etching solvent here. The etching rate is determined by the hole ( h ) accumulation, so the hole accumulation strongly depends on the distribution and intensity of electric field in this method.
The patterned NPS is formed by a localized electric field during the manufacturing process as illustrated in Figure 7.2. The hole distribution in Si is controlled by the electric field applied across the planar metal electrodes (anode and cathode) which are attached beneath the Si sample.
The geometry patterns of metal electrodes are designed on a reusable printed circuit board (PC board) as shown in figure 7.3.
Figure 7.1. The schematic diagram of the experimental setup of lateral-electric-field method
Figure 7.2. The schematic illustration of mechanism and the influence of a localized electric field
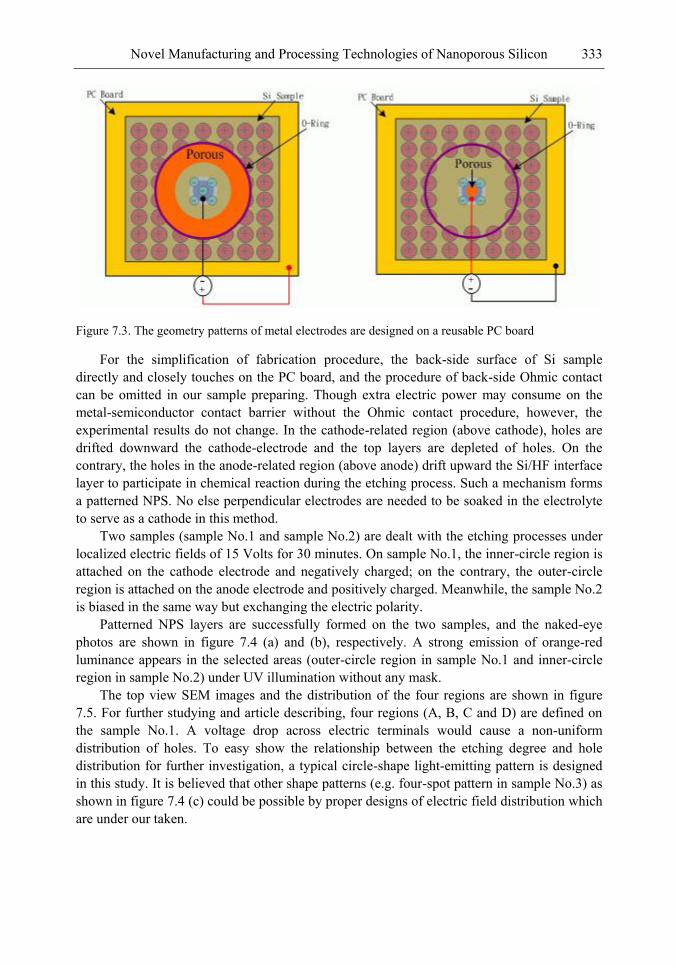
Novel Manufacturing and Processing Technologies of Nanoporous Silicon 333
Figure 7.3. The geometry patterns of metal electrodes are designed on a reusable PC board
For the simplification of fabrication procedure, the back-side surface of Si sample directly and closely touches on the PC board, and the procedure of back-side Ohmic contact can be omitted in our sample preparing. Though extra electric power may consume on the metal-semiconductor contact barrier without the Ohmic contact procedure, however, the experimental results do not change. In the cathode-related region (above cathode), holes are drifted downward the cathode-electrode and the top layers are depleted of holes. On the contrary, the holes in the anode-related region (above anode) drift upward the Si/HF interface layer to participate in chemical reaction during the etching process. Such a mechanism forms a patterned NPS. No else perpendicular electrodes are needed to be soaked in the electrolyte to serve as a cathode in this method.
Two samples (sample No.1 and sample No.2) are dealt with the etching processes under localized electric fields of 15 Volts for 30 minutes. On sample No.1, the inner-circle region is attached on the cathode electrode and negatively charged; on the contrary, the outer-circle region is attached on the anode electrode and positively charged. Meanwhile, the sample No.2 is biased in the same way but exchanging the electric polarity.
Patterned NPS layers are successfully formed on the two samples, and the naked-eye photos are shown in figure 7.4 (a) and (b), respectively. A strong emission of orange-red luminance appears in the selected areas (outer-circle region in sample No.1 and inner-circle region in sample No.2) under UV illumination without any mask.
The top view SEM images and the distribution of the four regions are shown in figure 7.5. For further studying and article describing, four regions (A, B, C and D) are defined on the sample No.1. A voltage drop across electric terminals would cause a non-uniform distribution of holes. To easy show the relationship between the etching degree and hole distribution for further investigation, a typical circle-shape light-emitting pattern is designed in this study. It is believed that other shape patterns (e.g. four-spot pattern in sample No.3) as shown in figure 7.4 (c) could be possible by proper designs of electric field distribution which are under our taken.
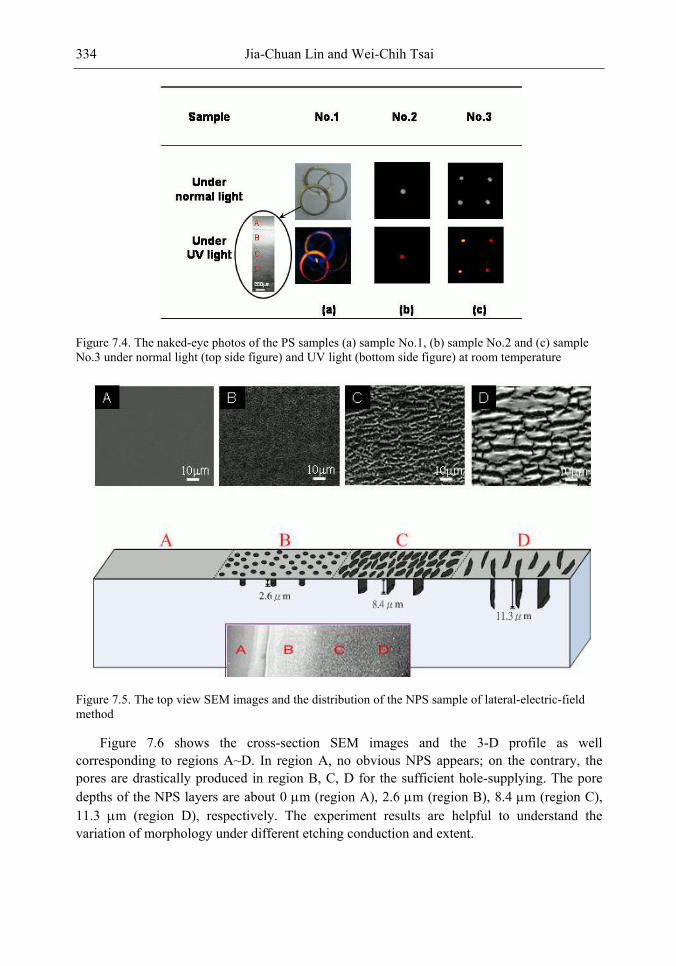
Jia-Chuan Lin and Wei-Chih Tsai 334
Figure 7.4. The naked-eye photos of the PS samples (a) sample No.1, (b) sample No.2 and (c) sample No.3 under normal light (top side figure) and UV light (bottom side figure) at room temperature
Figure 7.5. The top view SEM images and the distribution of the NPS sample of lateral-electric-field method
Figure 7.6 shows the cross-section SEM images and the 3-D profile as well corresponding to regions A~D. In region A, no obvious NPS appears; on the contrary, the pores are drastically produced in region B, C, D for the sufficient hole-supplying. The pore depths of the NPS layers are about 0 m (region A), 2.6 m (region B), 8.4 m (region C), 11.3 m (region D), respectively. The experiment results are helpful to understand the variation of morphology under different etching conduction and extent.
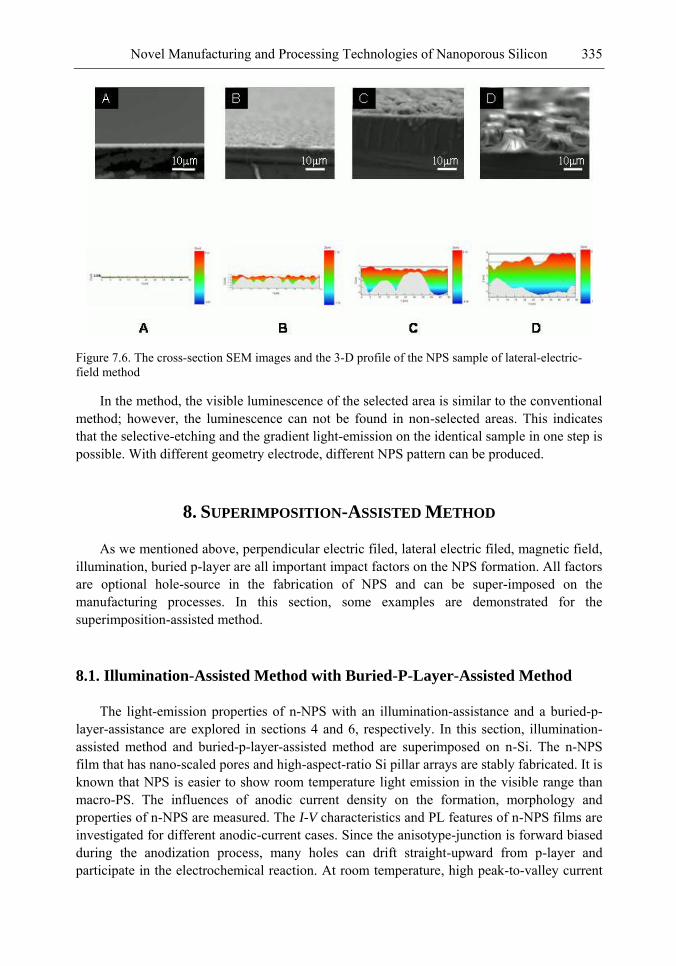
Novel Manufacturing and Processing Technologies of Nanoporous Silicon 335
Figure 7.6. The cross-section SEM images and the 3-D profile of the NPS sample of lateral-electric-field method
In the method, the visible luminescence of the selected area is similar to the conventional method; however, the luminescence can not be found in non-selected areas. This indicates that the selective-etching and the gradient light-emission on the identical sample in one step is possible. With different geometry electrode, different NPS pattern can be produced.
8. SUPERIMPOSITION-ASSISTED METHOD
As we mentioned above, perpendicular electric filed, lateral electric filed, magnetic field, illumination, buried p-layer are all important impact factors on the NPS formation. All factors are optional hole-source in the fabrication of NPS and can be super-imposed on the manufacturing processes. In this section, some examples are demonstrated for the superimposition-assisted method.
8.1. Illumination-Assisted Method with Buried-P-Layer-Assisted Method
The light-emission properties of n-NPS with an illumination-assistance and a buried-p-layer-assistance are explored in sections 4 and 6, respectively. In this section, illumination-assisted method and buried-p-layer-assisted method are superimposed on n-Si. The n-NPS film that has nano-scaled pores and high-aspect-ratio Si pillar arrays are stably fabricated. It is known that NPS is easier to show room temperature light emission in the visible range than macro-PS. The influences of anodic current density on the formation, morphology and properties of n-NPS are measured. The I-V characteristics and PL features of n-NPS films are investigated for different anodic-current cases. Since the anisotype-junction is forward biased during the anodization process, many holes can drift straight-upward from p-layer and participate in the electrochemical reaction. At room temperature, high peak-to-valley current
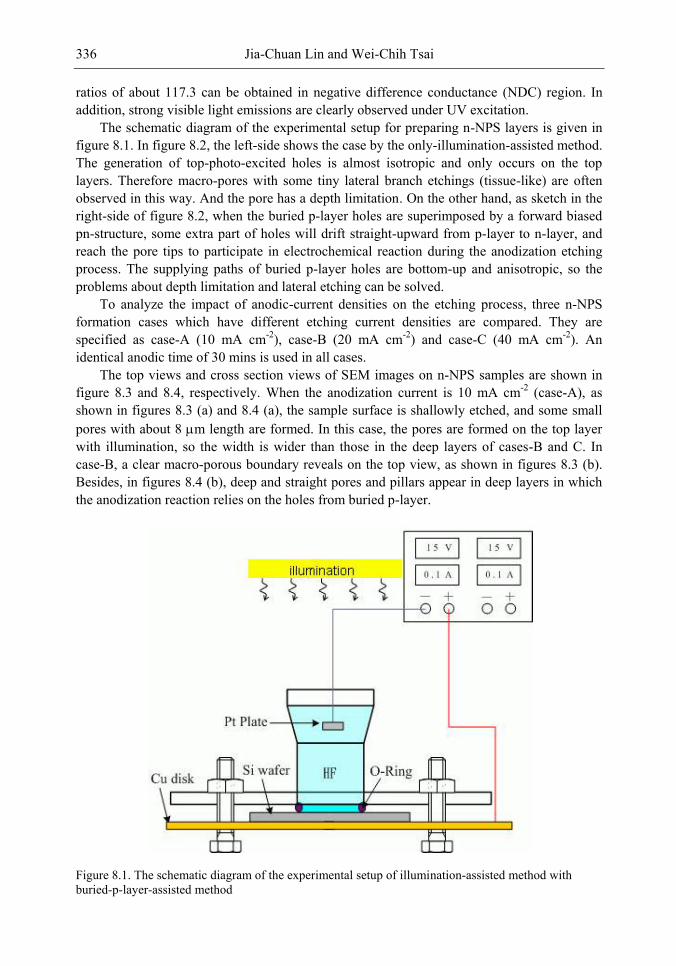
Jia-Chuan Lin and Wei-Chih Tsai 336
ratios of about 117.3 can be obtained in negative difference conductance (NDC) region. In addition, strong visible light emissions are clearly observed under UV excitation.
The schematic diagram of the experimental setup for preparing n-NPS layers is given in figure 8.1. In figure 8.2, the left-side shows the case by the only-illumination-assisted method. The generation of top-photo-excited holes is almost isotropic and only occurs on the top layers. Therefore macro-pores with some tiny lateral branch etchings (tissue-like) are often observed in this way. And the pore has a depth limitation. On the other hand, as sketch in the right-side of figure 8.2, when the buried p-layer holes are superimposed by a forward biased pn-structure, some extra part of holes will drift straight-upward from p-layer to n-layer, and reach the pore tips to participate in electrochemical reaction during the anodization etching process. The supplying paths of buried p-layer holes are bottom-up and anisotropic, so the problems about depth limitation and lateral etching can be solved.
To analyze the impact of anodic-current densities on the etching process, three n-NPS formation cases which have different etching current densities are compared. They are specified as case-A (10 mA cm-2), case-B (20 mA cm-2) and case-C (40 mA cm-2). An identical anodic time of 30 mins is used in all cases.
The top views and cross section views of SEM images on n-NPS samples are shown in figure 8.3 and 8.4, respectively. When the anodization current is 10 mA cm-2 (case-A), as shown in figures 8.3 (a) and 8.4 (a), the sample surface is shallowly etched, and some small pores with about 8 m length are formed. In this case, the pores are formed on the top layer with illumination, so the width is wider than those in the deep layers of cases-B and C. In case-B, a clear macro-porous boundary reveals on the top view, as shown in figures 8.3 (b). Besides, in figures 8.4 (b), deep and straight pores and pillars appear in deep layers in which the anodization reaction relies on the holes from buried p-layer.
Figure 8.1. The schematic diagram of the experimental setup of illumination-assisted method with buried-p-layer-assisted method
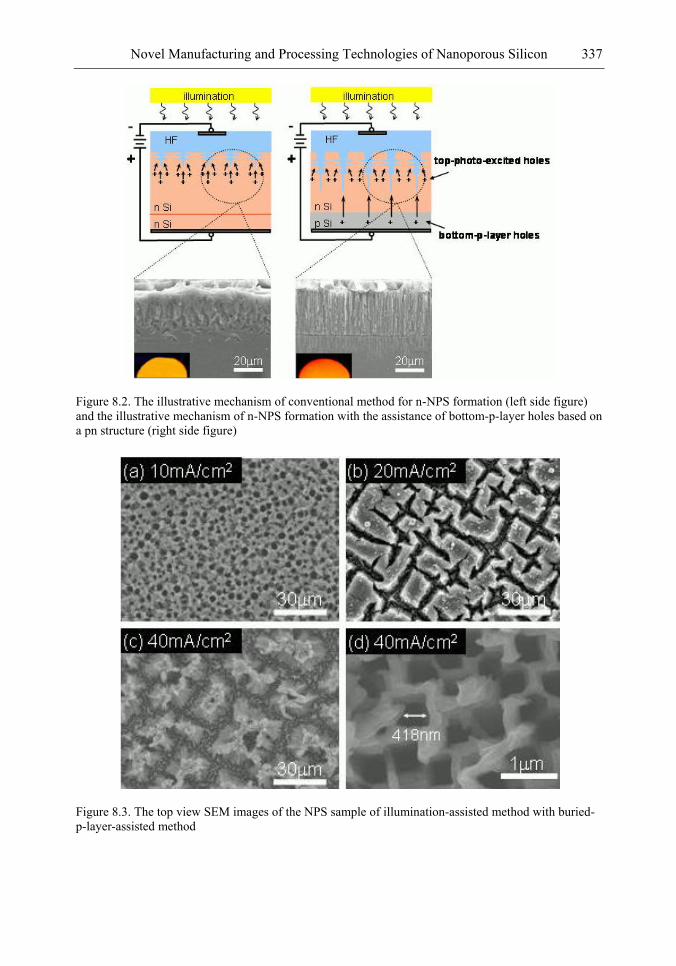
Novel Manufacturing and Processing Technologies of Nanoporous Silicon 337
Figure 8.2. The illustrative mechanism of conventional method for n-NPS formation (left side figure) and the illustrative mechanism of n-NPS formation with the assistance of bottom-p-layer holes based on a pn structure (right side figure)
Figure 8.3. The top view SEM images of the NPS sample of illumination-assisted method with buried-p-layer-assisted method
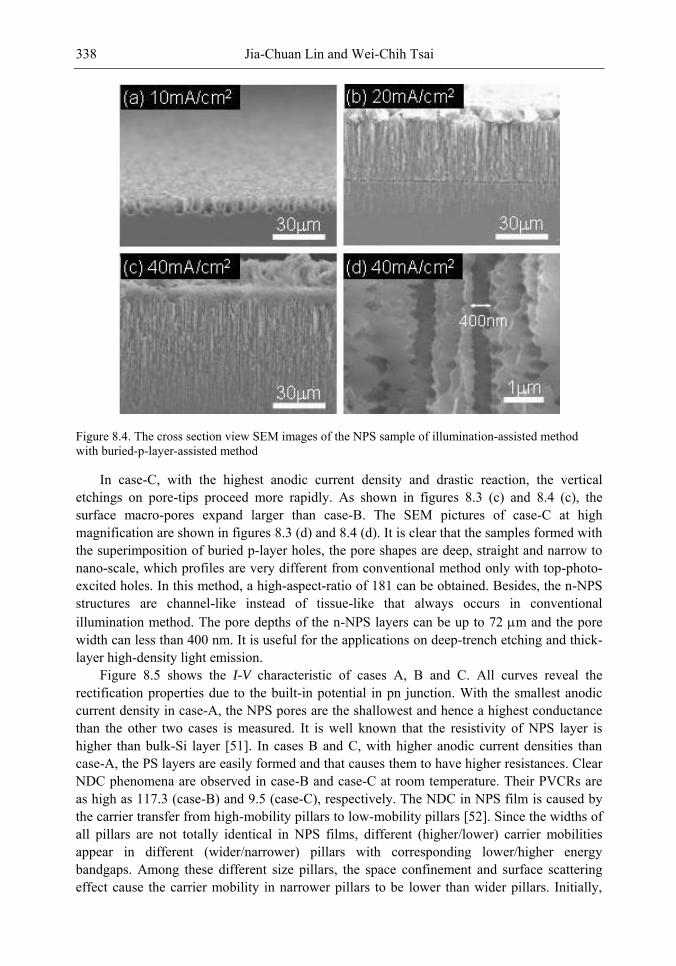
Jia-Chuan Lin and Wei-Chih Tsai 338
Figure 8.4. The cross section view SEM images of the NPS sample of illumination-assisted method with buried-p-layer-assisted method
In case-C, with the highest anodic current density and drastic reaction, the vertical etchings on pore-tips proceed more rapidly. As shown in figures 8.3 (c) and 8.4 (c), the surface macro-pores expand larger than case-B. The SEM pictures of case-C at high magnification are shown in figures 8.3 (d) and 8.4 (d). It is clear that the samples formed with the superimposition of buried p-layer holes, the pore shapes are deep, straight and narrow to nano-scale, which profiles are very different from conventional method only with top-photo-excited holes. In this method, a high-aspect-ratio of 181 can be obtained. Besides, the n-NPS structures are channel-like instead of tissue-like that always occurs in conventional illumination method. The pore depths of the n-NPS layers can be up to 72 m and the pore width can less than 400 nm. It is useful for the applications on deep-trench etching and thick-layer high-density light emission.
Figure 8.5 shows the I-V characteristic of cases A, B and C. All curves reveal the rectification properties due to the built-in potential in pn junction. With the smallest anodic current density in case-A, the NPS pores are the shallowest and hence a highest conductance than the other two cases is measured. It is well known that the resistivity of NPS layer is higher than bulk-Si layer [51]. In cases B and C, with higher anodic current densities than case-A, the PS layers are easily formed and that causes them to have higher resistances. Clear NDC phenomena are observed in case-B and case-C at room temperature. Their PVCRs are as high as 117.3 (case-B) and 9.5 (case-C), respectively. The NDC in NPS film is caused by the carrier transfer from high-mobility pillars to low-mobility pillars [52]. Since the widths of all pillars are not totally identical in NPS films, different (higher/lower) carrier mobilities appear in different (wider/narrower) pillars with corresponding lower/higher energy bandgaps. Among these different size pillars, the space confinement and surface scattering effect cause the carrier mobility in narrower pillars to be lower than wider pillars. Initially,
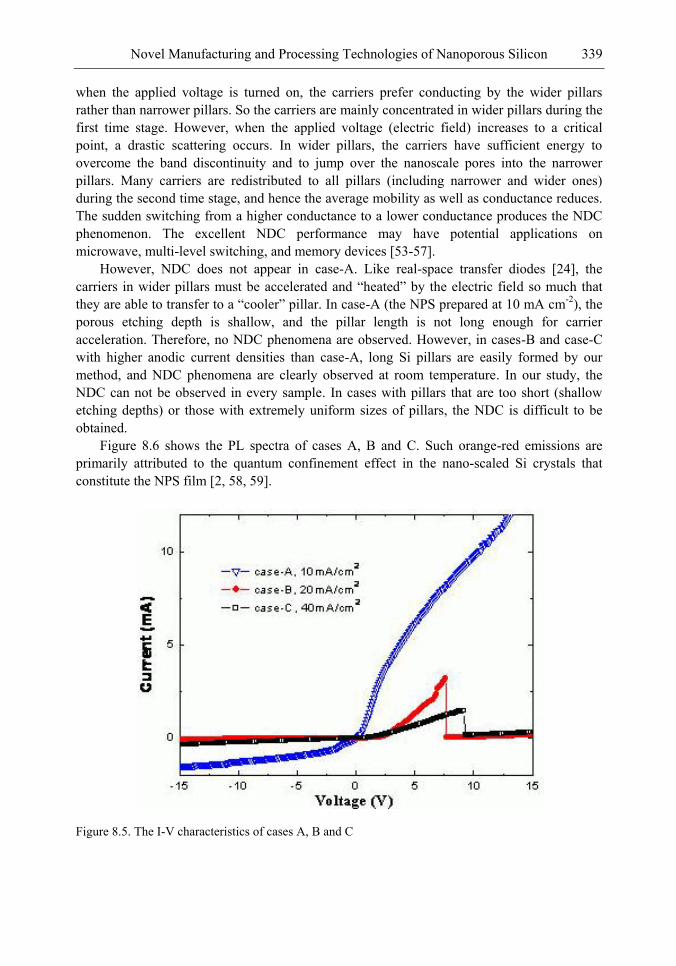
Novel Manufacturing and Processing Technologies of Nanoporous Silicon 339
when the applied voltage is turned on, the carriers prefer conducting by the wider pillars rather than narrower pillars. So the carriers are mainly concentrated in wider pillars during the first time stage. However, when the applied voltage (electric field) increases to a critical point, a drastic scattering occurs. In wider pillars, the carriers have sufficient energy to overcome the band discontinuity and to jump over the nanoscale pores into the narrower pillars. Many carriers are redistributed to all pillars (including narrower and wider ones) during the second time stage, and hence the average mobility as well as conductance reduces. The sudden switching from a higher conductance to a lower conductance produces the NDC phenomenon. The excellent NDC performance may have potential applications on microwave, multi-level switching, and memory devices [53-57].
However, NDC does not appear in case-A. Like real-space transfer diodes [24], the carriers in wider pillars must be accelerated and ―heated‖ by the electric field so much that they are able to transfer to a ―cooler‖ pillar. In case-A (the NPS prepared at 10 mA cm-2), the porous etching depth is shallow, and the pillar length is not long enough for carrier acceleration. Therefore, no NDC phenomena are observed. However, in cases-B and case-C with higher anodic current densities than case-A, long Si pillars are easily formed by our method, and NDC phenomena are clearly observed at room temperature. In our study, the NDC can not be observed in every sample. In cases with pillars that are too short (shallow etching depths) or those with extremely uniform sizes of pillars, the NDC is difficult to be obtained.
Figure 8.6 shows the PL spectra of cases A, B and C. Such orange-red emissions are primarily attributed to the quantum confinement effect in the nano-scaled Si crystals that constitute the NPS film [2, 58, 59].
Figure 8.5. The I-V characteristics of cases A, B and C
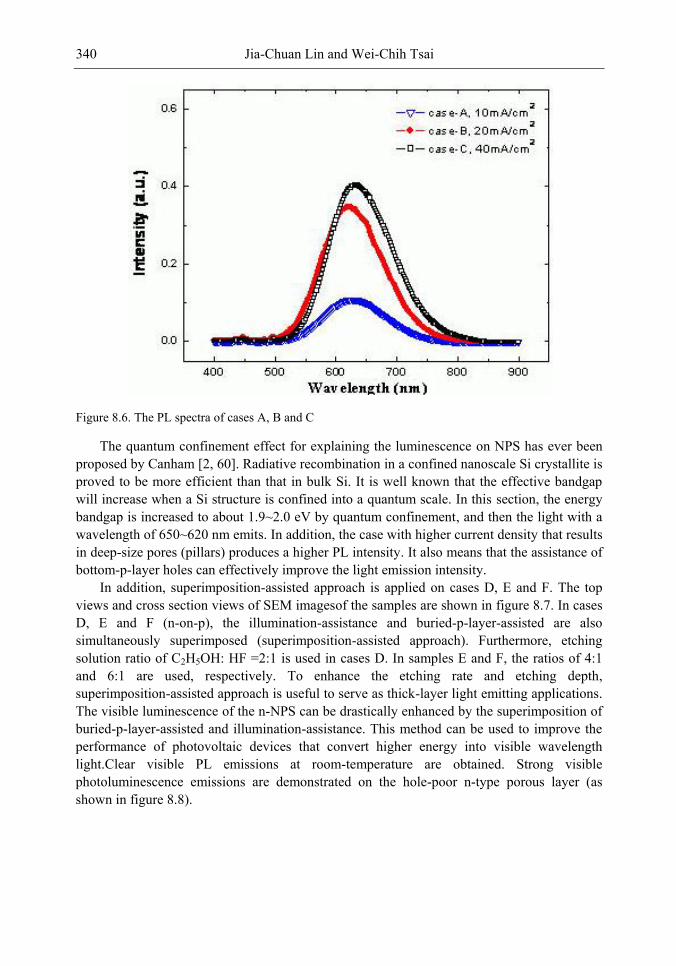
Jia-Chuan Lin and Wei-Chih Tsai 340
Figure 8.6. The PL spectra of cases A, B and C
The quantum confinement effect for explaining the luminescence on NPS has ever been proposed by Canham [2, 60]. Radiative recombination in a confined nanoscale Si crystallite is proved to be more efficient than that in bulk Si. It is well known that the effective bandgap will increase when a Si structure is confined into a quantum scale. In this section, the energy bandgap is increased to about 1.9~2.0 eV by quantum confinement, and then the light with a wavelength of 650~620 nm emits. In addition, the case with higher current density that results in deep-size pores (pillars) produces a higher PL intensity. It also means that the assistance of bottom-p-layer holes can effectively improve the light emission intensity.
In addition, superimposition-assisted approach is applied on cases D, E and F. The top views and cross section views of SEM imagesof the samples are shown in figure 8.7. In cases D, E and F (n-on-p), the illumination-assistance and buried-p-layer-assisted are also simultaneously superimposed (superimposition-assisted approach). Furthermore, etching solution ratio of C2H5OH: HF =2:1 is used in cases D. In samples E and F, the ratios of 4:1 and 6:1 are used, respectively. To enhance the etching rate and etching depth, superimposition-assisted approach is useful to serve as thick-layer light emitting applications. The visible luminescence of the n-NPS can be drastically enhanced by the superimposition of buried-p-layer-assisted and illumination-assistance. This method can be used to improve the performance of photovoltaic devices that convert higher energy into visible wavelength light.Clear visible PL emissions at room-temperature are obtained. Strong visible photoluminescence emissions are demonstrated on the hole-poor n-type porous layer (as shown in figure 8.8).
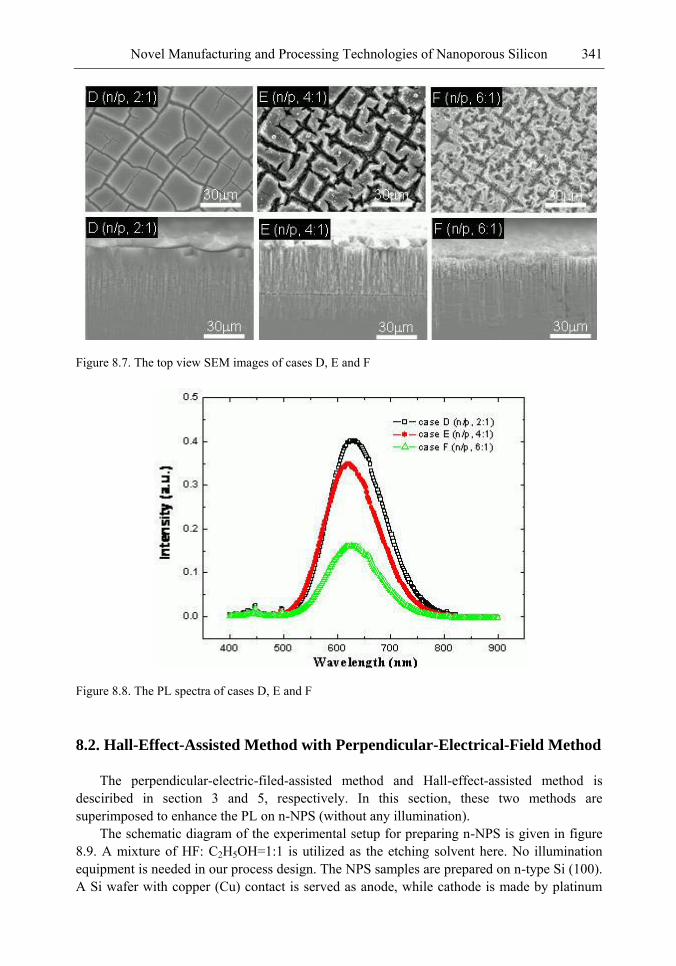
Novel Manufacturing and Processing Technologies of Nanoporous Silicon 341
Figure 8.7. The top view SEM images of cases D, E and F
Figure 8.8. The PL spectra of cases D, E and F
8.2. Hall-Effect-Assisted Method with Perpendicular-Electrical-Field Method
The perpendicular-electric-filed-assisted method and Hall-effect-assisted method is desciribed in section 3 and 5, respectively. In this section, these two methods are superimposed to enhance the PL on n-NPS (without any illumination).
The schematic diagram of the experimental setup for preparing n-NPS is given in figure 8.9. A mixture of HF: C2H5OH=1:1 is utilized as the etching solvent here. No illumination equipment is needed in our process design. The NPS samples are prepared on n-type Si (100). A Si wafer with copper (Cu) contact is served as anode, while cathode is made by platinum
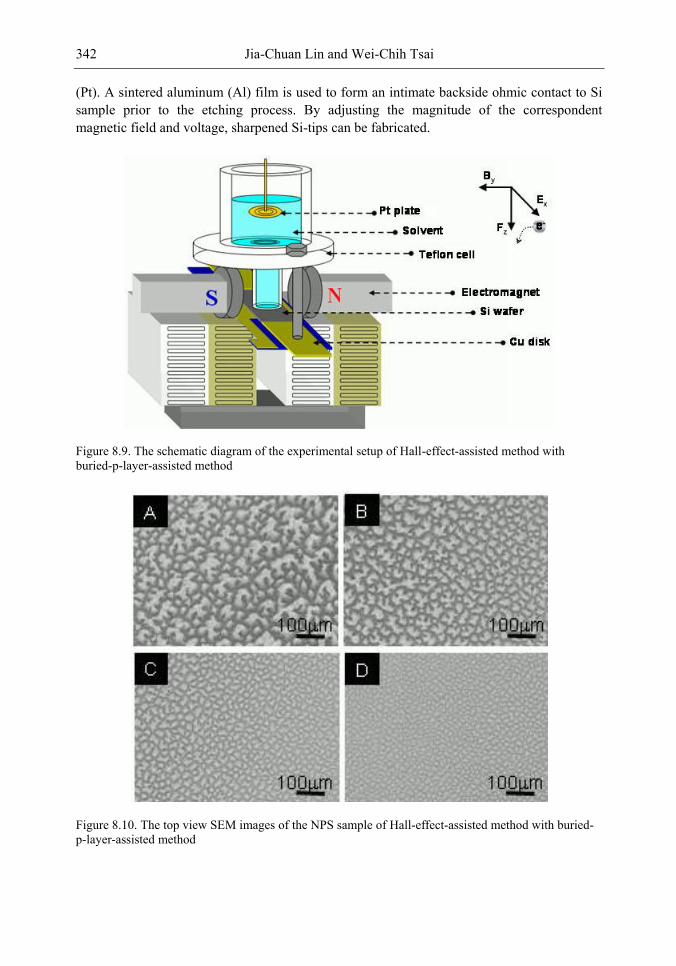
Jia-Chuan Lin and Wei-Chih Tsai 342
(Pt). A sintered aluminum (Al) film is used to form an intimate backside ohmic contact to Si sample prior to the etching process. By adjusting the magnitude of the correspondent magnetic field and voltage, sharpened Si-tips can be fabricated.
Figure 8.9. The schematic diagram of the experimental setup of Hall-effect-assisted method with buried-p-layer-assisted method
Figure 8.10. The top view SEM images of the NPS sample of Hall-effect-assisted method with buried-p-layer-assisted method
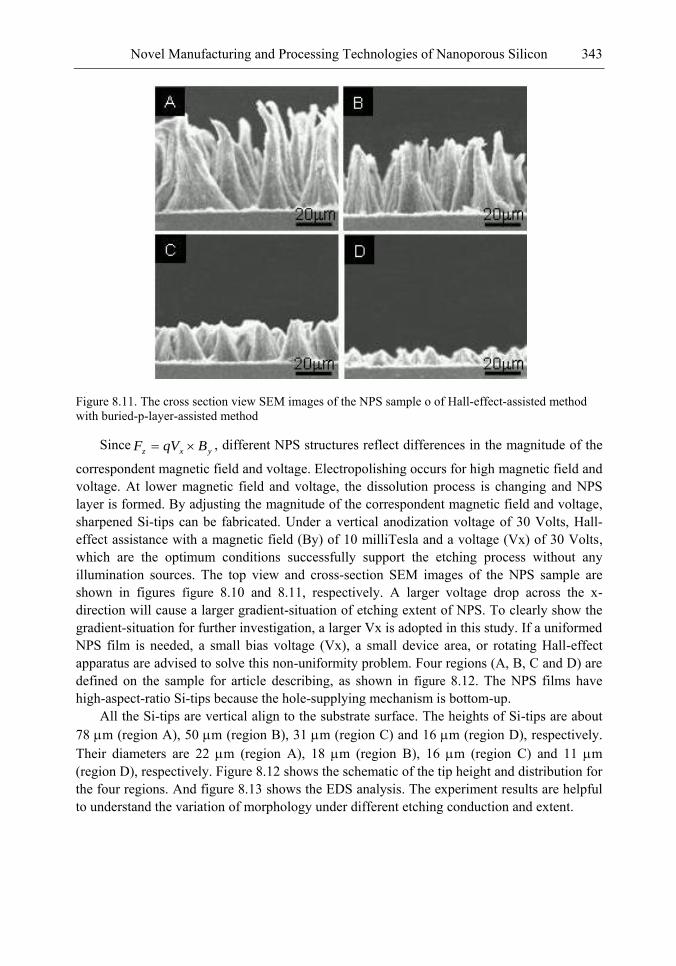
Novel Manufacturing and Processing Technologies of Nanoporous Silicon 343
Figure 8.11. The cross section view SEM images of the NPS sample o of Hall-effect-assisted method with buried-p-layer-assisted method
Sinceyxz BqVF , different NPS structures reflect differences in the magnitude of the
correspondent magnetic field and voltage. Electropolishing occurs for high magnetic field and voltage. At lower magnetic field and voltage, the dissolution process is changing and NPS layer is formed. By adjusting the magnitude of the correspondent magnetic field and voltage, sharpened Si-tips can be fabricated. Under a vertical anodization voltage of 30 Volts, Hall-effect assistance with a magnetic field (By) of 10 milliTesla and a voltage (Vx) of 30 Volts, which are the optimum conditions successfully support the etching process without any illumination sources. The top view and cross-section SEM images of the NPS sample are shown in figures figure 8.10 and 8.11, respectively. A larger voltage drop across the x-direction will cause a larger gradient-situation of etching extent of NPS. To clearly show the gradient-situation for further investigation, a larger Vx is adopted in this study. If a uniformed NPS film is needed, a small bias voltage (Vx), a small device area, or rotating Hall-effect apparatus are advised to solve this non-uniformity problem. Four regions (A, B, C and D) are defined on the sample for article describing, as shown in figure 8.12. The NPS films have high-aspect-ratio Si-tips because the hole-supplying mechanism is bottom-up.
All the Si-tips are vertical align to the substrate surface. The heights of Si-tips are about 78 m (region A), 50 m (region B), 31 m (region C) and 16 m (region D), respectively. Their diameters are 22 m (region A), 18 m (region B), 16 m (region C) and 11 m (region D), respectively. Figure 8.12 shows the schematic of the tip height and distribution for the four regions. And figure 8.13 shows the EDS analysis. The experiment results are helpful to understand the variation of morphology under different etching conduction and extent.
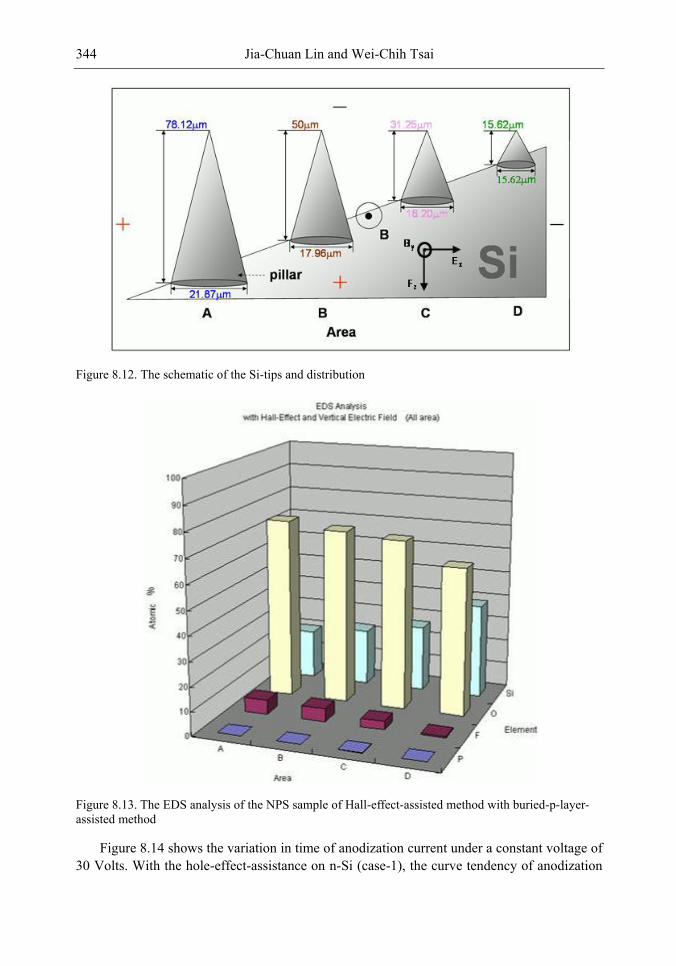
Jia-Chuan Lin and Wei-Chih Tsai 344
Figure 8.12. The schematic of the Si-tips and distribution
Figure 8.13. The EDS analysis of the NPS sample of Hall-effect-assisted method with buried-p-layer-assisted method
Figure 8.14 shows the variation in time of anodization current under a constant voltage of 30 Volts. With the hole-effect-assistance on n-Si (case-1), the curve tendency of anodization
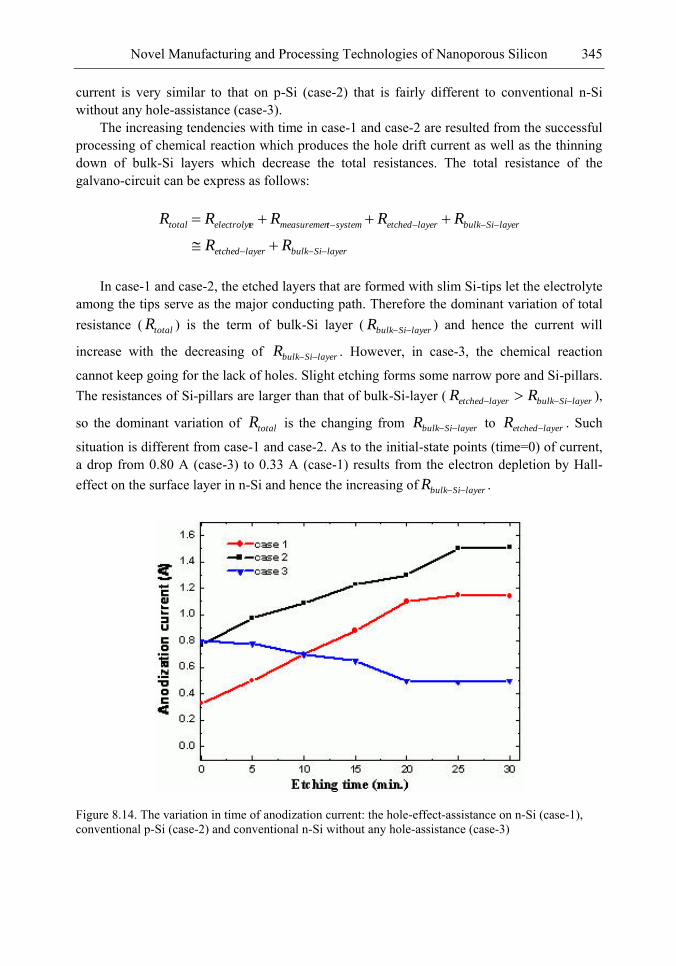
Novel Manufacturing and Processing Technologies of Nanoporous Silicon 345
current is very similar to that on p-Si (case-2) that is fairly different to conventional n-Si without any hole-assistance (case-3).
The increasing tendencies with time in case-1 and case-2 are resulted from the successful processing of chemical reaction which produces the hole drift current as well as the thinning down of bulk-Si layers which decrease the total resistances. The total resistance of the galvano-circuit can be express as follows:
layerSibulklayeretched
layerSibulklayeretchedsystemtmeasuremeneelectrolyttotal
RR
RRRRR
In case-1 and case-2, the etched layers that are formed with slim Si-tips let the electrolyte among the tips serve as the major conducting path. Therefore the dominant variation of total resistance ( totalR ) is the term of bulk-Si layer ( layerSibulkR ) and hence the current will
increase with the decreasing of layerSibulkR . However, in case-3, the chemical reaction
cannot keep going for the lack of holes. Slight etching forms some narrow pore and Si-pillars. The resistances of Si-pillars are larger than that of bulk-Si-layer ( layerSibulklayeretched RR ),
so the dominant variation of totalR is the changing from layerSibulkR to layeretchedR . Such
situation is different from case-1 and case-2. As to the initial-state points (time=0) of current, a drop from 0.80 A (case-3) to 0.33 A (case-1) results from the electron depletion by Hall-effect on the surface layer in n-Si and hence the increasing of layerSibulkR .
Figure 8.14. The variation in time of anodization current: the hole-effect-assistance on n-Si (case-1), conventional p-Si (case-2) and conventional n-Si without any hole-assistance (case-3)
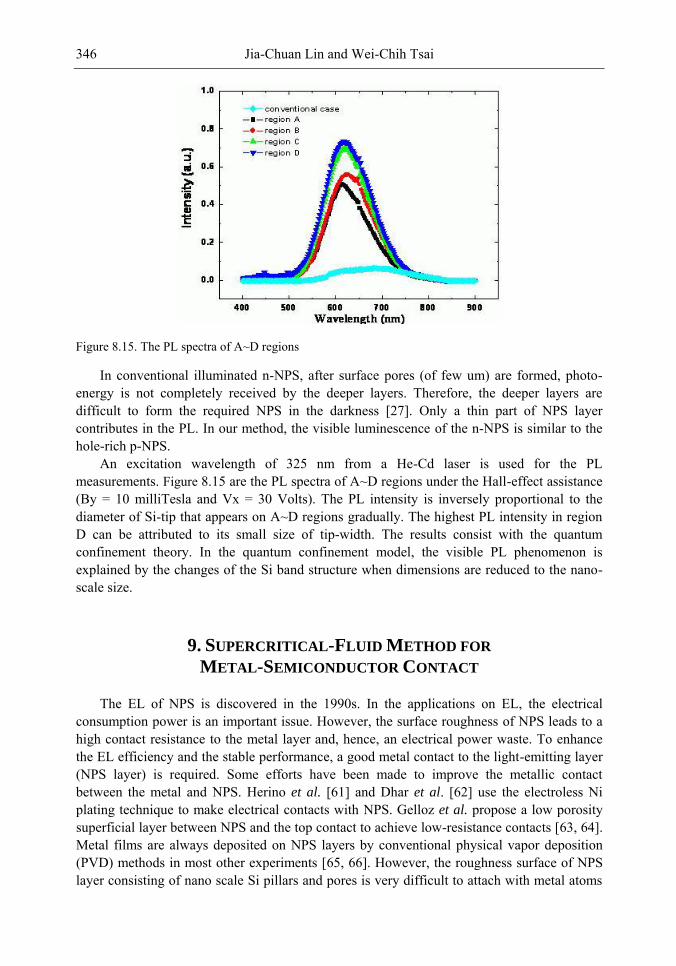
Jia-Chuan Lin and Wei-Chih Tsai 346
Figure 8.15. The PL spectra of A~D regions
In conventional illuminated n-NPS, after surface pores (of few um) are formed, photo-energy is not completely received by the deeper layers. Therefore, the deeper layers are difficult to form the required NPS in the darkness [27]. Only a thin part of NPS layer contributes in the PL. In our method, the visible luminescence of the n-NPS is similar to the hole-rich p-NPS.
An excitation wavelength of 325 nm from a He-Cd laser is used for the PL measurements. Figure 8.15 are the PL spectra of A~D regions under the Hall-effect assistance (By = 10 milliTesla and Vx = 30 Volts). The PL intensity is inversely proportional to the diameter of Si-tip that appears on A~D regions gradually. The highest PL intensity in region D can be attributed to its small size of tip-width. The results consist with the quantum confinement theory. In the quantum confinement model, the visible PL phenomenon is explained by the changes of the Si band structure when dimensions are reduced to the nano-scale size.
9. SUPERCRITICAL-FLUID METHOD FOR
METAL-SEMICONDUCTOR CONTACT
The EL of NPS is discovered in the 1990s. In the applications on EL, the electrical consumption power is an important issue. However, the surface roughness of NPS leads to a high contact resistance to the metal layer and, hence, an electrical power waste. To enhance the EL efficiency and the stable performance, a good metal contact to the light-emitting layer (NPS layer) is required. Some efforts have been made to improve the metallic contact between the metal and NPS. Herino et al. [61] and Dhar et al. [62] use the electroless Ni plating technique to make electrical contacts with NPS. Gelloz et al. propose a low porosity superficial layer between NPS and the top contact to achieve low-resistance contacts [63, 64]. Metal films are always deposited on NPS layers by conventional physical vapor deposition (PVD) methods in most other experiments [65, 66]. However, the roughness surface of NPS layer consisting of nano scale Si pillars and pores is very difficult to attach with metal atoms
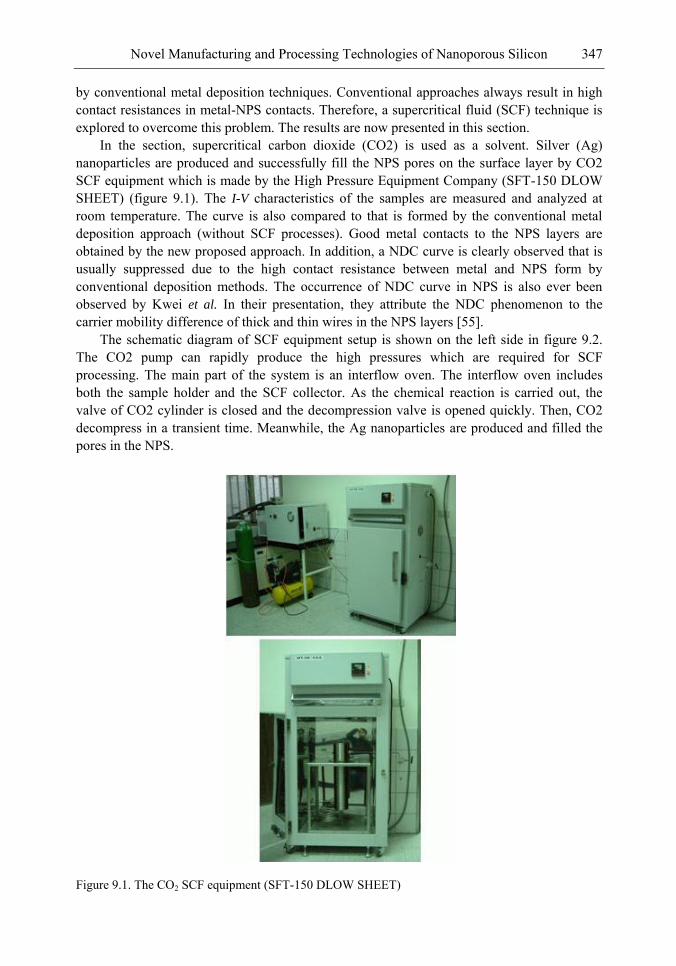
Novel Manufacturing and Processing Technologies of Nanoporous Silicon 347
by conventional metal deposition techniques. Conventional approaches always result in high contact resistances in metal-NPS contacts. Therefore, a supercritical fluid (SCF) technique is explored to overcome this problem. The results are now presented in this section.
In the section, supercritical carbon dioxide (CO2) is used as a solvent. Silver (Ag) nanoparticles are produced and successfully fill the NPS pores on the surface layer by CO2 SCF equipment which is made by the High Pressure Equipment Company (SFT-150 DLOW SHEET) (figure 9.1). The I-V characteristics of the samples are measured and analyzed at room temperature. The curve is also compared to that is formed by the conventional metal deposition approach (without SCF processes). Good metal contacts to the NPS layers are obtained by the new proposed approach. In addition, a NDC curve is clearly observed that is usually suppressed due to the high contact resistance between metal and NPS form by conventional deposition methods. The occurrence of NDC curve in NPS is also ever been observed by Kwei et al. In their presentation, they attribute the NDC phenomenon to the carrier mobility difference of thick and thin wires in the NPS layers [55].
The schematic diagram of SCF equipment setup is shown on the left side in figure 9.2. The CO2 pump can rapidly produce the high pressures which are required for SCF processing. The main part of the system is an interflow oven. The interflow oven includes both the sample holder and the SCF collector. As the chemical reaction is carried out, the valve of CO2 cylinder is closed and the decompression valve is opened quickly. Then, CO2 decompress in a transient time. Meanwhile, the Ag nanoparticles are produced and filled the pores in the NPS.
Figure 9.1. The CO2 SCF equipment (SFT-150 DLOW SHEET)
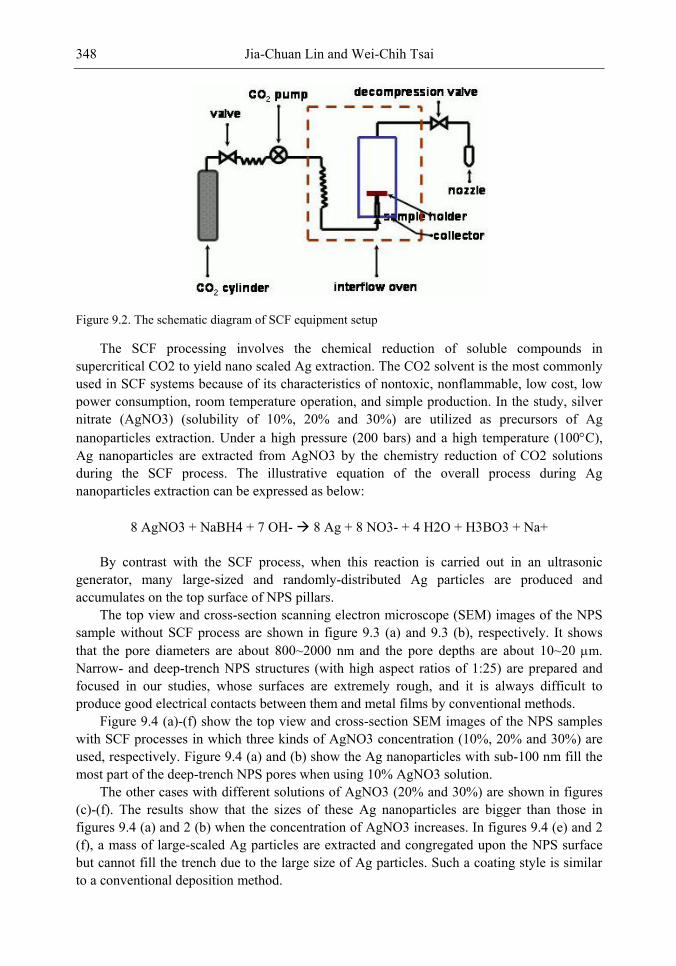
Jia-Chuan Lin and Wei-Chih Tsai 348
Figure 9.2. The schematic diagram of SCF equipment setup
The SCF processing involves the chemical reduction of soluble compounds in supercritical CO2 to yield nano scaled Ag extraction. The CO2 solvent is the most commonly used in SCF systems because of its characteristics of nontoxic, nonflammable, low cost, low power consumption, room temperature operation, and simple production. In the study, silver nitrate (AgNO3) (solubility of 10%, 20% and 30%) are utilized as precursors of Ag nanoparticles extraction. Under a high pressure (200 bars) and a high temperature (100C), Ag nanoparticles are extracted from AgNO3 by the chemistry reduction of CO2 solutions during the SCF process. The illustrative equation of the overall process during Ag nanoparticles extraction can be expressed as below:
8 AgNO3 + NaBH4 + 7 OH- 8 Ag + 8 NO3- + 4 H2O + H3BO3 + Na+
By contrast with the SCF process, when this reaction is carried out in an ultrasonic generator, many large-sized and randomly-distributed Ag particles are produced and accumulates on the top surface of NPS pillars.
The top view and cross-section scanning electron microscope (SEM) images of the NPS sample without SCF process are shown in figure 9.3 (a) and 9.3 (b), respectively. It shows that the pore diameters are about 800~2000 nm and the pore depths are about 10~20 m. Narrow- and deep-trench NPS structures (with high aspect ratios of 1:25) are prepared and focused in our studies, whose surfaces are extremely rough, and it is always difficult to produce good electrical contacts between them and metal films by conventional methods.
Figure 9.4 (a)-(f) show the top view and cross-section SEM images of the NPS samples with SCF processes in which three kinds of AgNO3 concentration (10%, 20% and 30%) are used, respectively. Figure 9.4 (a) and (b) show the Ag nanoparticles with sub-100 nm fill the most part of the deep-trench NPS pores when using 10% AgNO3 solution.
The other cases with different solutions of AgNO3 (20% and 30%) are shown in figures (c)-(f). The results show that the sizes of these Ag nanoparticles are bigger than those in figures 9.4 (a) and 2 (b) when the concentration of AgNO3 increases. In figures 9.4 (e) and 2 (f), a mass of large-scaled Ag particles are extracted and congregated upon the NPS surface but cannot fill the trench due to the large size of Ag particles. Such a coating style is similar to a conventional deposition method.
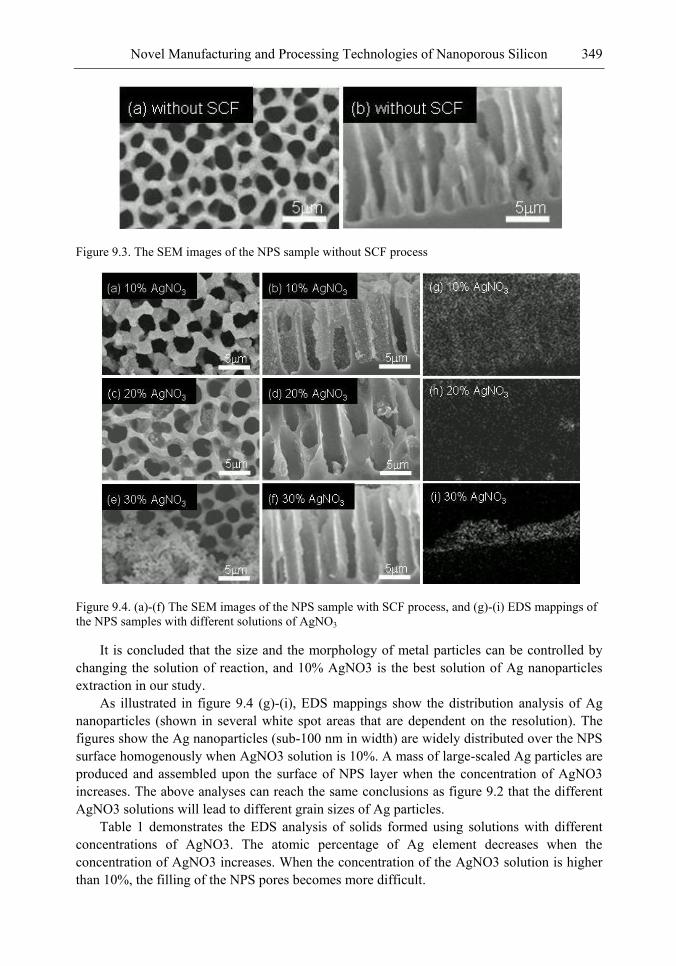
Novel Manufacturing and Processing Technologies of Nanoporous Silicon 349
Figure 9.3. The SEM images of the NPS sample without SCF process
Figure 9.4. (a)-(f) The SEM images of the NPS sample with SCF process, and (g)-(i) EDS mappings of the NPS samples with different solutions of AgNO3
It is concluded that the size and the morphology of metal particles can be controlled by changing the solution of reaction, and 10% AgNO3 is the best solution of Ag nanoparticles extraction in our study.
As illustrated in figure 9.4 (g)-(i), EDS mappings show the distribution analysis of Ag nanoparticles (shown in several white spot areas that are dependent on the resolution). The figures show the Ag nanoparticles (sub-100 nm in width) are widely distributed over the NPS surface homogenously when AgNO3 solution is 10%. A mass of large-scaled Ag particles are produced and assembled upon the surface of NPS layer when the concentration of AgNO3 increases. The above analyses can reach the same conclusions as figure 9.2 that the different AgNO3 solutions will lead to different grain sizes of Ag particles.
Table 1 demonstrates the EDS analysis of solids formed using solutions with different concentrations of AgNO3. The atomic percentage of Ag element decreases when the concentration of AgNO3 increases. When the concentration of the AgNO3 solution is higher than 10%, the filling of the NPS pores becomes more difficult.
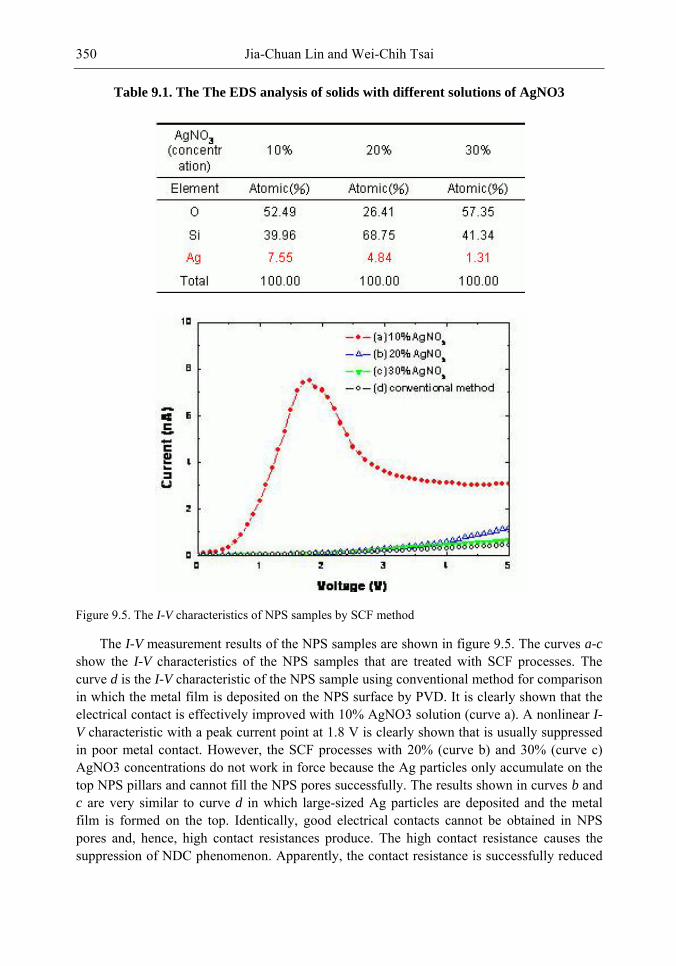
Jia-Chuan Lin and Wei-Chih Tsai 350
Table 9.1. The The EDS analysis of solids with different solutions of AgNO3
Figure 9.5. The I-V characteristics of NPS samples by SCF method
The I-V measurement results of the NPS samples are shown in figure 9.5. The curves a-c show the I-V characteristics of the NPS samples that are treated with SCF processes. The curve d is the I-V characteristic of the NPS sample using conventional method for comparison in which the metal film is deposited on the NPS surface by PVD. It is clearly shown that the electrical contact is effectively improved with 10% AgNO3 solution (curve a). A nonlinear I-V characteristic with a peak current point at 1.8 V is clearly shown that is usually suppressed in poor metal contact. However, the SCF processes with 20% (curve b) and 30% (curve c) AgNO3 concentrations do not work in force because the Ag particles only accumulate on the top NPS pillars and cannot fill the NPS pores successfully. The results shown in curves b and c are very similar to curve d in which large-sized Ag particles are deposited and the metal film is formed on the top. Identically, good electrical contacts cannot be obtained in NPS pores and, hence, high contact resistances produce. The high contact resistance causes the suppression of NDC phenomenon. Apparently, the contact resistance is successfully reduced
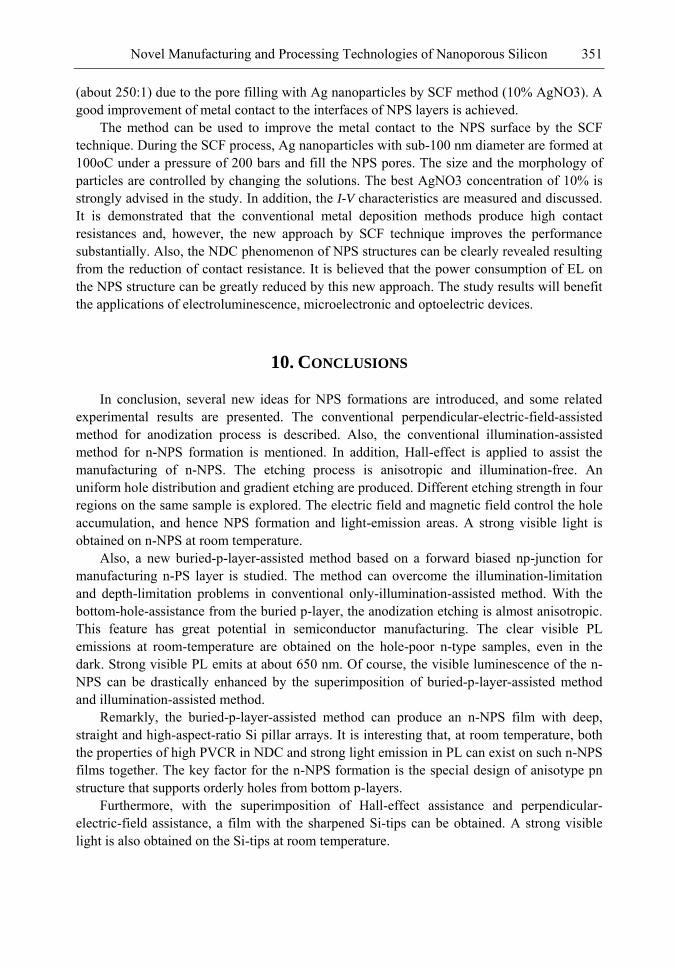
Novel Manufacturing and Processing Technologies of Nanoporous Silicon 351
(about 250:1) due to the pore filling with Ag nanoparticles by SCF method (10% AgNO3). A good improvement of metal contact to the interfaces of NPS layers is achieved.
The method can be used to improve the metal contact to the NPS surface by the SCF technique. During the SCF process, Ag nanoparticles with sub-100 nm diameter are formed at 100oC under a pressure of 200 bars and fill the NPS pores. The size and the morphology of particles are controlled by changing the solutions. The best AgNO3 concentration of 10% is strongly advised in the study. In addition, the I-V characteristics are measured and discussed. It is demonstrated that the conventional metal deposition methods produce high contact resistances and, however, the new approach by SCF technique improves the performance substantially. Also, the NDC phenomenon of NPS structures can be clearly revealed resulting from the reduction of contact resistance. It is believed that the power consumption of EL on the NPS structure can be greatly reduced by this new approach. The study results will benefit the applications of electroluminescence, microelectronic and optoelectric devices.
10. CONCLUSIONS
In conclusion, several new ideas for NPS formations are introduced, and some related experimental results are presented. The conventional perpendicular-electric-field-assisted method for anodization process is described. Also, the conventional illumination-assisted method for n-NPS formation is mentioned. In addition, Hall-effect is applied to assist the manufacturing of n-NPS. The etching process is anisotropic and illumination-free. An uniform hole distribution and gradient etching are produced. Different etching strength in four regions on the same sample is explored. The electric field and magnetic field control the hole accumulation, and hence NPS formation and light-emission areas. A strong visible light is obtained on n-NPS at room temperature.
Also, a new buried-p-layer-assisted method based on a forward biased np-junction for manufacturing n-PS layer is studied. The method can overcome the illumination-limitation and depth-limitation problems in conventional only-illumination-assisted method. With the bottom-hole-assistance from the buried p-layer, the anodization etching is almost anisotropic. This feature has great potential in semiconductor manufacturing. The clear visible PL emissions at room-temperature are obtained on the hole-poor n-type samples, even in the dark. Strong visible PL emits at about 650 nm. Of course, the visible luminescence of the n-NPS can be drastically enhanced by the superimposition of buried-p-layer-assisted method and illumination-assisted method.
Remarkly, the buried-p-layer-assisted method can produce an n-NPS film with deep, straight and high-aspect-ratio Si pillar arrays. It is interesting that, at room temperature, both the properties of high PVCR in NDC and strong light emission in PL can exist on such n-NPS films together. The key factor for the n-NPS formation is the special design of anisotype pn structure that supports orderly holes from bottom p-layers.
Furthermore, with the superimposition of Hall-effect assistance and perpendicular-electric-field assistance, a film with the sharpened Si-tips can be obtained. A strong visible light is also obtained on the Si-tips at room temperature.
Jia-Chuan Lin and Wei-Chih Tsai 352
Alternatively, a new method for the fabrication of p-type patterned NPS only by electric field is proposed. The manufacturing process is anisotropic and illumination-free. No masking-layer and related photo-lithography processes are needed in this method.
On the other hand, the method is put forward to improve the metal contact to the NPS surface by the SCF technique. During the SCF process, Ag nanoparticles are formed at 100oC under a pressure of 200 bars and fill the NPS pores. The size and the morphology of particles are controlled by changing the solutions. In addition, by current-voltage characteristic measurements, it is proved that the SCF method improves the performance substantially. Also, the NDC phenomenon can be clearly revealed resulting from the reduction of contact resistance. It is believed that the power consumption of EL on the NPS structure can be greatly reduced.
In this chapter, these studies on NPS provide alternative methods of fabricating electronic and optoelectronic devices.
REFERENCES
[1] Canham, L. T. (1990). Appl. Phys. Lett., 57, 1046. [2] McCord, P., Yau, S. L. & Bard, A. J. (1992). Science, 257, 68. [3] Bisi, Stefano Ossicini, & Pavesi, L. (2000). Surf. Sci. Rep., 38, 1. [4] Cullis, G., Canham, L. T. & Calcott, P. D. J. (1997). J. Appl. Phys., 82, 909. [5] Fauchet, P. M. (1996). J. Lumin., 70, 294. [6] Lin, J. C., Lee, P. W. & Tsai, W. C. (2006). Appl. Phys. Lett., 89, 121119. [7] Lin, J. C., Chen, W. L. & Tsai, W. C. (2006). Opt. Express, 14, 9764. [8] Lin, J. C., Hou, H. T. & Tsai, W. C. (2007). Microelectron. Eng., 84, 336. [9] Smestad, G. & Ries, H. (1992). Solar Energy Materials Solar Cells, 25, 51. [10] Willeke, G., Nussbaumer, H., Bender, H. & Bucher, E. (1992). Solar Cells, 25, 51. [11] Taliercio, T., Dilhan, M., Massone, E. Gue, A. M., Fraisse, B. & Foucaran, A. (1992).
Thin Solid Films, 255, 310. [12] Yu, L. Z. & Wie, C. R. (1992). Electron. Lett., 28, 911. [13] Watanabe, Y., Arita, Y., Yokoyama, T. & Igarashi, Y. (1975). J. Electrochem. Soc.,
122, 1351. [14] Moon, H. J., Jung, K. H., Hyung, H. P., Joong, J. K., Sang, H. H. & Se, Y. C. (1997).
Thin Solid Films, 309, 490. [15] Art, H. (2004). Alternative Approaches for DMFC Design:Silicon-Based Systems 6th
Annual SMALL FUEL CELLS. [16] Chan, S. & Fauchet, P. M. (1999). Appl. Phys. Lett., 75, 274. [17] Zheng, W. H., Reece, P., Sun, B. Q. & Gal, M. (2004). Appl. Phys. Lett., 84, 3519. [18] Lehmann, V. (1993). J. Electrochem. Soc., 140, 2836. [19] Benjamin, J. D., Keen, J. M., Cullis, A. G., Innes, B. & Chew, N. G. (1986). Appl. Phys.
Lett., 49, 716. [20] Gaburro, Z., Bettotti, P., Saiani, M., Pavesi, L., Pancheri, L., Oton, C. J. & Capuj, N.
(2004). Appl. Phys. Lett., 85, 555. [21] Gaburro, Z., Oton, C. J., Pavesi, L. & Pancheri, L. (2004). Appl. Phys. Lett., 84, 4388.
Novel Manufacturing and Processing Technologies of Nanoporous Silicon 353
[22] Pickering, C., Beale, M. J., Robbins, D. J., Pearson, P. J. & Greef, R. (1984). J. Phys. C:
Solid State Phys., 17, 5535. [23] Beale, M. J., Benjamin, J. D., Uren, M. J., Uren, N. G., Chew, N. G. & Cullis, A. G.
(1985). J. Cryst. Growth, 73, 622. [24] Beale, M. J., Benjamin, J. D., Uren, M. J., Uren, N. G., Chew, N. G. & Cullis, A. G.
(1985). Appl. Phys. Lett., 46, 86. [25] Young, M., Beale, M. I. & Benjamin, J. D. (1985). Appl. Phys. Lett., 46, 1133. [26] Smith, R. L., Chuang, S. F. & Collins, S. D. (1988). J. Electron. Mater., 17, 533. [27] Smith, R. L. & Collins, S. D. (1989). Phys. Rev. A, 39, 5409. [28] Smith, R. L., & Collins, S. D. (1992). Phys. J. Appl.Phys., 71, R1. [29] Witten, T. A. & Sander, L. M. (1983). Phys. Rev. B, 27, 5686. [30] Read, A. J., Needs, R. J., Naish, K. J., Canham, L. T., Calcott, P. D. J. & Qteish, A.
(1992). Phys, Rev. Lett., 69, 1232. [31] Sanders, G. D. & Chang, Y. C. (1992). Phys. Rev. B, 45, 856. [32] Lemann, V. & Gösele, U. (1991). Appl. Phys. Lett., 58, 856. [33] Parkhutik, V. P., Albella, J. M., Martinez-Duart, J. M., Gomez-Rodriguez, J. M., Baro,
A. M. & Shershulsky, V. I. (1993). ibid., 2, 366. [34] Yan, H. & Hu, X. (1993). J. Appl. Phys., 73, 4324. [35] Canham, L. T., Leong, W. Y., Cox, T. I. & Taylor, L. (1992). Appl. Phys. Letts., 61,
2563. [36] Fuchs, H. D., Stutzmann, M., Brandt, M. S., Rosenbauer, M., Weber, J., Breitschwerdt,
A., Deak, P. & Cardona, M. (1993). Phys. Rev. B, 48, 8172. [37] Sarathy, S., Shih, K. H., Jung, C., Tsai, K. H., Li, D. L., Kwong, & Campbell, J. C.
(1992). Appl. Phys. Lett., 60, 1532. [38] Ksendzov, R., Fathauer, W., George, T., Pike, W. T. & Vasquez, R. P. (1993). Appl.
Phys. Lett., 63, 200. [39] Kalem, S. & Rosenbauer, M. (1995). Appl. Phys. Lett., 67, 2551. [40] Saadoun, M., Ezzaouia, H., Bessais, B., Boujmil, M. F. & Bennaceur, R. (1999). Solar
Energy Mater. Solar Cells, 59, 377. [41] Kalem, S. & Yavuzcetin, O. (2000). Opt. Express, 6, 7. [42] Saadoun, M., Mliki, N., Kaabi, H., Daoudi, K., Bessaïs, B., Ezzaouia, H. & Bennaceur,
R. (2002). Thin Solid films, 405, 29. [43] Lalic, N. & Linnros, J. (1996). Thin Solid Films, 276, 155. [44] Richter, P., Steiner, F., Kozlowski, & Lang, W. (1991). IEEE EDL., 12, 691. [45] Eddowes, M. J. (1990). J. Electroanal. Chem., 280, 297. [46] Stumper, & Peter, L. M. (1991). J. Electroanal. Chem., 309, 325. [47] Yaron, A., Bastide, S., Maurice, J. L. & Levy-Clement, C. (1993). J. Lumim., 57, 67. [48] Galun, E., Lagoubi, A., Tenne, R. & Levy-Clement, C. (1993). J. Lumim., 57, 125. [49] Nassiopoulos, G., Grigoropoulos, S., Canham, L., Halimaoui, A., Berbezier, I.,
Gogolides, E. & Papadimitriou, D. (1995). Thin Solid films, 255, 329. [50] Krüger, R., Arens-Fischer, M., Thönissen, H., Münder, M. G., Berger, H., Lüth, S.,
Hilbrich, & Theiss, W. (1996). Thin Solid films, 276, 257. [51] Mao, D., Kim, K. J., Tsuo, Y. S. & Arthur, J. Frank. (1995). J. Phys. Chem., 99, 3643. [52] Lee, K., Chu, C. H., Tseng, Y. C., Shyr, J. M. & Kao, C. H. (2000). IEEE EDL., 21,
587.
Jia-Chuan Lin and Wei-Chih Tsai 354
[53] Sibille, J. F., Palmier, H., Wang, J. C. & Esnault, F. Mollot. (1990). Appl. phys. Lett. 56, 256.
[54] Reklaitis, A., Krotkus, A., Geizutis, & Asche, M. (1999). Semicond. Sci. Techno., 14, 341.
[55] Koester, S. J., Ismail, K., Lee, K. Y. & Chu, J. O. (1997). IEEE EDL., 18, 432. [56] Saitoh, H., Harata, & Hiramoto, T. (2004). Appl. Phys. Lett., 85, 6233. [57] Lee, H. & Jeong, Y. H. (2004). IEEE Trans. Nanotechnol., 3, 377. [58] Saeta, N. & Gallagher, A. C. (1995). J. Appt. Phys., 77, 4639. [59] Sanders, G. D. & Chang, Y. C. (1992). Phys. Rev. B, 45, 9202. [60] Cullis, G. & Canham, L. T. (1991). Nature, 353, 335. [61] Herino, R., Jan, P. & Bomchil, G. (1980). J. Electrochem. Soc., 127, 1339. [62] Dhar, S. & Chakrabarti, S. (1996) Semicond. Sci. Technol., 11, 1231. [63] Gelloza, & Koshida, N. (1998). Appl. Phys. Lett., 73, 2021. [64] Gelloz, B. & Nakagawa, T. (2000). J. Appl. Phys., 88, 4319. [65] Andsager, J., Hillard, J. M., Hetrick, L. H., AbuHassan, M., Plisch, & Nayfeh, M. H.
(1993). J. Appl. Phys., 74, 4783. [66] Lang, W., Steiner, P. & Kozlowski, F. (1993). J. Lumines, 57, 341.
INDEX
A
A Hall, 323 accessibility, 96 acetonitrile, 100 acidity, 131, 159, 213, 223, 224, 225, 229 acrylate, 277, 278, 279 acrylic acid, 287 activated carbon, 212 activation energy, 175, 176, 177 acute infection, 95 adamantane, 291 adaptation, 302 additives, 114 adenosine, 115 adenosine triphosphate, 115 adhesion, 83, 120, 121, 122, 123, 135, 136, 138, 140,
149, 153, 158, 159, 161, 274 adjustment, 79 adsorption isotherms, 220, 228 aerogels, 275 age, 154 ageing, xi, 239, 261, 262 aggregates, 75, 281, 299 aggregation, 277, 279, 281, 282, 285, 286, 288, 297,
305, 319 alcohol, 58, 299 aliphatic compounds, 288 aliphatic polymers, 281, 283 alloys, vii, viii, ix, 1, 45, 46, 98, 133, 191, 192, 195 allylamine, 126, 131, 133 alternative, 323, 352 alternatives, 144 aluminium, 116, 117, 118, 120, 127, 130, 156, 158,
202, 212, 214, 230 aluminum oxide, xi, 157, 159, 243, 244 amines, 79, 110, 111, 148, 289 amino acids, 81, 94, 111
ammonia, 215, 289 ammonium, 92, 106, 215, 216, 230, 274 amplitude, 7, 13, 34 anatase, 138, 192, 193, 194, 199, 200, 204 angiogenesis, 82 angioplasty, 127 anisotropy, 167, 238 annealing, xi, 138, 164, 169, 172, 173, 178, 180,
185, 261, 262, 263, 264, 266, 268, 269, 270, 274 annihilation, 287, 292, 303 anodization, xi, xii, 116, 117, 118, 125, 127, 130,
131, 132, 138, 157, 160, 244, 246, 261, 262, 263, 315, 316, 320, 328, 331, 332, 335, 336, 343, 344, 345, 351
antibiotic, 95, 107, 109, 139, 149, 153 anticancer drug, 98, 101 antiferromagnet, 237 anti-inflammatory drugs, 145 apoptosis, 139 applications, 75, 86, 93, 95, 98, 99, 116, 118, 119,
122, 124, 130, 131, 137, 139, 140, 142, 145, 146, 149, 150, 152, 155, 156, 158, 159, 160, 164, 165, 185, 191, 192, 213, 224, 225, 229, 233, 234, 235, 239, 244, 250, 261, 262, 269, 270, 284, 316, 317, 330, 331, 338, 339, 340, 346, 351
applied research, viii, 45 aqueous solutions, viii, x, 5, 45, 58, 59, 60, 114, 191,
192, 196, 200, 207 arginine, 121 argon, 205 artery, 159 aspect ratio, 325, 330, 348 assessment, 230 assumptions, 52 asymmetry, 205 atomic force, xi, 243, 244, 246, 292 atomic force microscope, xi, 243, 244, 246
Index 356
atoms, vii, ix, 105, 163, 165, 170, 174, 176, 180, 182, 183, 184, 185, 205, 207, 218, 220, 234, 235, 237, 306, 317, 320, 321, 323, 325, 346
ATP, 115 attachment, 17, 48, 68, 98, 122, 131, 133, 139, 141,
161 authors, xii, 42, 57, 101, 107, 109, 113, 120, 124,
221, 264, 315, 316 availability, 123 averaging, 19, 26 avoidance, 145 azimuthal angle, 293
B
background, 166 bacteria, 83, 93, 136, 140, 152 bacterial infection, 140 band gap, 269 barriers, 128, 145, 274 baths, 194 beams, 300, 302, 303 behavior, ix, 22, 46, 61, 84, 92, 106, 108, 111, 160,
164, 170, 179, 184, 185, 197, 200, 207, 236, 237, 238, 239, 244, 248, 258, 274, 281
benzene, 76, 104, 283 bias, 203, 323, 343 binding, 123, 166, 205, 206 binding energy, 166, 205, 206 bioavailability, 74, 94, 145, 152 bioceramic coatings, 133 biocompatibility, ix, 73, 75, 82, 119, 122, 123, 130,
133, 135, 145, 149 biological systems, ix, 73, 75, 120, 131 biomaterials, 82, 86, 119, 133, 145, 150 biomedical applications, 86, 93, 131 biopolymer, 152 biosensors, 244 bleaching, 213, 225, 231 blend films, 281, 298 blends, 79, 287 blocks, 285, 291 blood clot, 82 blood supply, 94, 120, 139 blood vessels, 74, 82, 94, 139 body fluid, 83, 84, 85 bonding, 77, 108, 172, 286, 287 bonds, 106, 114, 166, 171, 172, 174, 185 bone cells, 120, 151, 161 bone form, 120, 139, 153 bone growth, 122, 133 bone marrow, 95, 120, 139 bones, 83, 100 branched polymers, 280
branching, 78, 276 breakdown, ix, 191, 192, 193, 194, 197, 220 breathing, 154 broadband, 248 building blocks, 237 burn, 277 by-products, 218
C
cadmium, 115 calcium, 83, 86, 89, 90, 91, 119, 120, 135, 136, 150,
151, 153 calibration, 303 canals, 119 cancer, ix, 73, 142, 143, 144, 145, 146, 156, 161 cancer cells, 142, 144, 156 candidates, vii, x, 93, 144, 233, 277, 281 capillary, 174, 177, 217, 245, 276, 292, 305 capsule, 83, 129, 130, 149 carbon, 75, 165, 267, 347 carbon dioxide, 347 carbon nanotubes, 75, 165 carboxylic groups, 106, 111 carotid arteries, 128 carrier, xi, xii, 92, 93, 149, 152, 155, 180, 262, 268,
269, 315, 338, 339, 347 casting, 277, 290 catalysis, vii, x, 93, 116, 124, 130, 185, 192, 233,
234, 244 catalyst, 142, 192, 212, 213, 223, 229, 289 catalytic activity, 185, 231, 279 catalytic properties, 225 cation, 59, 215, 222 cell fate, 161 cell killing, 143, 161 cell line, 136 cell metabolism, 82 ceramic, ix, 91, 98, 99, 104, 119, 158, 160, 191, 202,
203, 207, 212 cervical cancer, 116 chain scission, 142 channels, viii, ix, xi, 45, 46, 57, 59, 76, 78, 80, 87,
93, 95, 100, 102, 104, 114, 117, 119, 120, 191, 196, 197, 201, 236, 237, 261
chemical bonds, 184 chemical deposition, 275 chemical interaction, 279 chemical properties, 93, 165, 166, 223, 229, 234,
292, 306 chemical reactions, 165 chemical stability, 129 chemical vapor deposition, 274, 275 chemical vapour deposition, 119
Index 357
chemokines, 82 chemotherapy, 144 chlorophyll, 230 chondrocyte, 135, 161 chromium, 104, 154 classification, 234 clay minerals, x, 211, 212, 213, 214, 216, 219, 229,
230 cleaning, 192 cleavage, 142, 291 cloning, 155 closure, 127 clustering, 134 clusters, 2, 3, 4, 13, 15, 16, 17, 18, 19, 24, 26, 27, 28,
30, 34, 35, 36, 39, 41, 42, 48, 49, 51, 52, 55, 56, 57, 165, 180, 234
CO2, xii, 194, 237, 316, 347, 348 coagulation, 82, 123 coatings, x, 123, 125, 127, 137, 141, 161, 191, 192,
194, 195, 196, 200, 202, 203, 205, 206, 207 cobalt, 236, 237 collagen, 82, 121, 123 collisions, 303 colonization, 140, 149 combination therapy, 74 communication, 135, 145 compatibility, 128 compensation, 5, 28, 30, 36, 38, 39, 41, 42 competition, 299 complement, 82, 122, 123 complexity, 145 compliance, 3, 52 complications, 82, 95, 137, 139, 141 components, ix, x, 67, 81, 167, 170, 171, 185, 191,
192, 193, 205, 211, 215, 216, 276, 277, 287, 293, 305
composites, 46, 93, 151, 192, 214, 216, 230 composition, 75, 83, 87, 89, 90, 91, 117, 119, 131,
192, 193, 194, 196, 200, 204, 207, 214, 216, 217, 219, 220, 221, 222, 223, 228, 244, 287
compounds, ix, 103, 191, 215, 236, 238, 348 compressibility, 6, 7, 33, 52, 67, 169 compression, vii, viii, 1, 3, 4, 5, 7, 8, 9, 11, 12, 29,
39, 40, 41, 42, 45, 47, 66, 94, 139 concordance, 61, 63 condensation, 80, 86, 105, 154, 217, 224, 228 conductance, xii, 315, 336, 338 conduction, 334, 343 conductivity, 66, 165, 202, 268 conductor, xii, 273, 274, 303 conductors, 274 configuration, 83, 105, 106
confinement, xii, 100, 101, 104, 164, 315, 316, 320, 338, 339, 340, 346
congestive heart failure, 94 connective tissue, 120 connectivity, 13, 48, 86, 99, 102, 105 conservation, 18, 19, 34 consumption, xiii, 316, 346, 348, 351, 352 contamination, 125, 194, 324 continuity, 255 conversion, 150, 185, 223, 236 cooling, 298 copolymers, 77, 92, 277, 283, 285, 286, 287, 289,
290, 291 copper, 149, 274, 303, 320, 341 coronary artery disease, 127, 137, 159 correlation, 2, 38, 63, 68, 106, 126, 127, 164, 166,
184, 300 correlations, 53, 59, 65, 68, 292, 304 corrosion, 192 cosmetics, 224 coupling, 131, 237, 274, 286 covalent bond, 105, 291 covering, 111, 197 crack, 252, 253, 254, 302 critical value, 13, 49, 50, 169, 178 crystal architecture, x, 211, 213, 214 crystal structure, 139, 212, 213, 216, 225, 235 crystallinity, 131, 216, 264 crystallites, 204 crystallization, 89, 90, 91, 204, 262 crystals, 86, 89, 150, 167, 180, 183, 185, 202, 316,
317, 339 culture, 122, 134, 135, 136, 138, 158 culture media, 138 curing, 245, 277, 281, 282, 289, 291, 299 curing reactions, 277, 282, 289 current ratio, 336 cycles, 58, 68, 196, 276, 292, 305 cytokines, 82 cytoskeleton, 137 cytostatic drugs, 127 cytotoxicity, 121
D
data analysis, 230, 297 deconvolution, 206 defects, 94, 105, 118, 142, 165, 275, 292 defence, 141 deficiency, 166, 185 definition, 37, 171 deformation, 42, 170, 171, 253, 255, 256, 258 degradation, 102, 139, 277, 285, 286, 291 dehydration, 131, 236
Index 358
dental implants, ix, 73, 133, 139, 145, 192 deposition, 82, 119, 120, 125, 126, 127, 135, 136,
157, 159, 274, 346, 347, 348, 351 deposits, 274 depression, 177 derivatives, 57, 59, 60, 166, 275, 280 desorption, 215, 217, 223, 224, 302 detection, 155, 156 deviation, 238 diabetes, ix, 73, 129, 130, 145 diamonds, 129 dielectric constant, xii, 273, 294 differentiation, 84, 121, 135, 136, 138, 158, 161, 168 diffraction, 150, 155, 166, 199, 204, 238, 269 diffusion process, 89, 113, 183, 185 diffusion time, 183 diffusivity, 68 dimerization, 113 diodes, 317, 339 discharges, 193, 202, 203, 205, 206, 207 discontinuity, 339 dispersion, 285, 295, 305 dispersity, 92 displacement, 5, 33, 170, 171, 173, 249, 250, 257,
258 distribution function, 2, 4, 16, 17, 18, 19, 20, 21, 23,
24, 25, 27, 28, 29, 33, 34, 35, 36, 296 divergence, 4 diversity, 237 doors, 165 dopamine, 155 doping, 263, 269 dosage, 74, 94, 153 dosing, 74 drawing, 239 drug carriers, 93 drug interaction, 153 drug therapy, viii, 73 drying, 81, 275, 277, 290, 305 duration, 7, 34, 216, 223, 225, 244
E
earth, 213, 225 education, 186 elastic deformation, 11 elasticity, 170 electric charge, 195, 196 electric circuits, 274 electric field, xii, 131, 196, 238, 315, 316, 317, 328,
331, 332, 333, 339, 351, 352 electrical conductivity, 268 electrical power, xii, 316, 346 electrical properties, xi, 261, 262, 268, 270, 316
electrochemical deposition, 119, 244 electrochemical impedance, 196 electrochemical reaction, 330, 335, 336 electrochemistry, 146, 156, 316 electrodes, xii, 197, 200, 315, 316, 324, 331, 332,
333 electroluminescence, xii, 315, 317, 351 electrolysis, 197, 200, 202, 204 electrolyte, 117, 118, 131, 132, 193, 194, 244, 263,
317, 320, 321, 323, 324, 331, 333, 345 electromagnetic, 142 electron diffraction, 79 electron microscopy, 89, 278, 283, 292, 301 electrons, 303, 323 electroplating, 274 elongation, 137 embryo, 81 emission, xii, 202, 315, 316, 317, 327, 330, 333, 335,
338, 340, 351 employment, 166 emulsions, 145 encapsulation, 82, 93, 114, 128, 130, 142, 276 endothelial cells, 82, 137 energy parameters, 56 enlargement, 111 entropy, 48, 166, 168, 169 environment, viii, 73, 96, 112, 142, 321, 323 environmental stimuli, 142 enzymes, 74, 104, 158 epidermis, 136, 153 epitaxial growth, xi, 261, 262 equality, 50, 168 equilibrium, viii, 45, 57, 96, 97, 167, 168, 170, 177,
178, 181 equipment, 341, 347, 348 erosion, 320 ester, 280 ethanol, 59, 77, 185, 237, 281 ethers, 275 ethyl alcohol, 299 ethylene, vii, 1, 58, 119, 131, 157, 285, 286, 287,
291 ethylene glycol, vii, 1, 58, 119, 131, 157, 291 ethylene oxide, 285, 286, 287 evaporation, 51, 86, 91, 184 evolution, 16, 17, 54, 86, 192 excitation, 200, 316, 326, 330, 336, 346 exercise, 130 experimental condition, 221 exposure, 144, 237 extracellular matrix, 82, 120, 127, 137 extraction, 75, 77, 105, 348, 349 extravasation, 82
Index 359
F
failure, 133, 139, 145, 253 family, 77, 86, 102, 105, 147, 235, 237 feedback, 74 femur, 94, 100 ferromagnetism, 235, 236, 238, 239 fibers, 80 fibrinogen, 123 fibroblasts, 82 fibrosis, 82, 135 fibrous cap, 122 field emission scanning electron microscopy, 292 film, xii, 315, 320, 325, 331, 335, 338, 339, 342,
343, 350, 351 film formation, 131, 193, 277, 281, 282, 305 film thickness, 126, 244, 292, 294, 295, 297, 300,
306 filters, 212, 244 filtration, 157 financial support, 239 first generation, 131 fixation, 83, 100, 133 flexibility, 131, 239 fluctuations, 48, 49, 74 fluid, xii, 94, 316, 347 fluorescence, 113, 114, 155, 156 fluoride ions, 131 fluorine, 267 fluoropolymers, 275 foams, 104, 154 foils, 117, 144 folate, 116 food, 130 food intake, 130 fractal structure, 61 fragments, 155 free energy, 180, 181, 182, 183, 184 free radicals, 303 free volume, 303 freedom, 166 friction, 48 fulfillment, 48 functionalization, 105, 107, 108, 109, 111, 112, 123,
124, 131, 152, 156
G
gas sensors, 192, 317 gases, xii, 164, 196, 316 gastric ulcer, 94 gastrointestinal tract, 74
gel, 5, 46, 47, 57, 58, 60, 63, 66, 82, 86, 149, 150, 214, 216, 230, 289, 291
gene, 114, 146 gene therapy, 146 generation, 47, 142, 281, 289, 292, 298, 306, 320,
336 genes, 74 genre, 302 glass transition temperature, 291 glasses, 83, 84, 86, 87, 88, 89, 91, 97, 150, 151 glucose, 74, 129, 130, 287 glycerol, 58, 131 glycine, 121 glycol, 59, 133 goals, 74 gold, 156 government, iv grains, 3, 4, 13, 33, 38, 97, 197, 214, 215, 221 graph, 31, 129 graphite, 165, 173 grazing, 275, 279, 282, 292, 295 growth factor, ix, 73, 82, 84, 98, 111, 139, 145 growth hormone, 74 growth rate, 3, 117, 244
H
hafnium, 161 hard tissues, 150 hardness, xi, 116, 192, 243, 244, 245, 249, 250, 251,
258 healing, 82, 133, 137, 155 heat, 11, 47, 53, 54, 56, 57, 58, 66, 67, 68, 192, 231,
281, 285, 305 heat capacity, 66 heat release, 57, 58, 66, 67, 68 heat transfer, 56 heating, 58, 77, 131, 289, 298, 299 height, 78, 192, 224, 225, 228, 246, 255, 343 hemostasis, 82 hepatocytes, 128 heptane, 302 hexane, 100 hip, 133, 139 hip replacement, 133, 139 histology, 135 homogeneity, 15 homopolymers, 286 host, 93, 102, 103, 104, 123, 165, 173, 178, 179,
180, 183, 184, 185, 192, 236 humidity, 212, 244 hybrid, 99, 105, 113, 152, 233, 236, 238, 290, 291,
299 hybridization, 299
Index 360
hydrocarbons, 76, 79, 106 hydrogels, 146 hydrogen, xii, 77, 105, 106, 108, 111, 130, 192, 201,
237, 264, 267, 270, 286, 287, 315, 316, 320 hydrogen bonds, 105, 106, 108, 111 hydrogen fluoride, xii, 315, 316 hydrolysis, 107, 114, 230 hydrophobicity, 83 hydrosilylation, 289, 291 hydrothermal synthesis, 79 hydroxide, 131, 237, 274 hydroxyapatite, 84, 89, 91, 99, 120, 150 hydroxyl groups, 142, 280, 288 hydroxylapatite, 150 hyperbranched polymers, 283 hypercalcemia, 155 hyperplasia, 137, 139, 159 hypertension, 94 hypothesis, 46, 137 hysteresis, viii, 2, 3, 11, 46, 47, 57, 59, 68, 69, 217,
224 hysteresis loop, 4, 11, 46, 69, 224
I
ibuprofen, 80, 93, 94, 100, 101, 102, 103, 104, 105, 107, 110, 124, 154, 155, 159
ideal, 75, 160, 169, 174 illumination, 143, 144, 321, 322, 324, 325, 327, 328,
329, 330, 331, 333, 335, 336, 337, 338, 340, 341, 343, 351, 352
image, 79, 89, 90, 91, 116, 127, 128, 134, 135, 137, 143, 246, 247, 252, 254, 266, 278, 301
immersion, 92, 223 immobilization, 93, 154 immune response, 82, 135 immunoglobulin, 130 immunoglobulins, 128 impact energy, 7, 8, 9, 11, 12, 13 implant failures, 98 implementation, 145 impregnation, 93, 100 imprinting, xii, 118, 273, 274, 275, 276, 279, 280,
297 impurities, 180, 182, 183, 184, 185, 200, 223, 267 in vitro, 82, 84, 89, 90, 91, 119, 122, 123, 128, 150,
151, 158 in vivo, ix, 73, 82, 89, 90, 99, 119, 122, 123, 128,
135, 145, 146, 153 incidence, 264, 275, 277, 279, 282, 292, 293, 294,
295 inclusion, 50, 68, 98 indentation, xi, 243, 244, 245, 250, 251, 252, 253,
254, 255, 256, 258
independence, 47, 48 indices, 17, 20, 24 induction, 150 industry, 274, 302, 305, 306 inequality, 2, 23, 31, 42, 48, 49 infection, 82, 83, 94, 98, 130, 133, 136, 139, 141,
149 infinite, 47, 48, 51, 52, 53, 54, 55, 56, 57, 60, 61, 67,
68, 96, 236 inflammation, 82, 98, 122, 123, 127, 133, 135, 139 inflammatory cells, 122, 127 inflammatory responses, 159 information technology, 145 infrared spectroscopy, 86 inhibition, 82 inhibitor, 94 inhomogeneity, 46 initial state, 49, 56, 61, 66 initiation, 118 injections, 130 injury, iv, 82, 127, 137, 159 insight, ix, 164, 166, 200 instability, xi, 91, 169, 261, 262 insulin, 74, 128, 130 integrated circuits, xii, 273, 274, 303 integration, 24, 82, 119, 149, 168, 274, 292, 306, 331 integrin, 139 integrity, 250 intensity, 321, 326, 327, 332, 340, 346 interaction, 36, 42, 58, 77, 92, 105, 107, 110, 111,
112, 113, 118, 125, 139, 141, 158, 166, 236, 237, 238, 257, 304
interactions, 34, 105, 108, 109, 111, 113, 114, 123, 142, 235, 236, 237, 238, 239, 248, 287, 288
interface energy, 167, 177 interfacial adhesion, 275, 276 interval, 7, 12, 27, 39, 116 inversion, 324 ion adsorption, 215 ion exchangers, 212 ion-exchange, vii, x, 212, 233, 234 ions, vii, 83, 86, 89, 91, 98, 127, 150, 154, 197, 200,
205, 214, 216, 221, 227, 229, 230, 238 iron, 228, 237, 238 irradiation, 113, 143, 164, 169, 173, 175 isotherms, 215, 217, 223, 224
K
kidney, 83, 99 killing, 142 kinetic constants, 143 kinetic equations, 4, 5, 16, 34, 35, 36, 42 kinetic model, 141, 175
Index 361
kinetics, 27, 74, 83, 86, 93, 95, 96, 97, 102, 103, 104, 108, 125, 140, 141, 142, 176, 178, 183
L
lactic acid, 286 laminar, 75, 225 lasers, 93 lattice parameters, 204 lattices, 204, 207, 236 laws, 95 leaching, x, 142, 211, 212, 214, 215, 216, 217, 218,
219, 220, 221, 222, 223, 224, 225, 226, 227, 228, 229, 230, 231
leaks, 34 legend, 137 liberation, 201 lifetime, 180, 197, 268, 269, 287, 292, 303 ligand, 239 light emitting diode, 317, 321 light scattering, 248, 268 limitation, 127, 283, 322, 325, 328, 330, 331, 332,
336, 351 line, xii, 10, 62, 63, 136, 141, 206, 273, 274 linear dependence, 8, 13, 63, 111, 175 linear function, 40, 254 linear polymers, 280 linearity, 176 linkage, 106, 114, 115, 236, 237, 238, 287 liposomes, 74, 75, 145 liquid chromatography, 70 liquid phase, 177, 178 liquids, vii, xii, 1, 58, 248, 316 lithography, xii, 315, 316, 331, 332, 352 liver, 83, 99 low temperatures, 239 luminescence, 317, 325, 335, 340, 346, 351 lymph, 83 lymph node, 83 lysis, 122
M
macromolecules, 285 macrophages, 82, 122 macropores, 153, 220, 222, 330 macroporous materials, vii, 212 magnesium, 201, 212 magnet, 235, 236, 237 magnetic field, 95, 114, 142, 145, 186, 323, 325,
327, 328, 335, 342, 343, 351 magnetic materials, 235, 237, 238, 239 magnetic properties, x, 233, 235, 238 magnetic sensor, x, 233, 234, 235
magnetism, xi, 233, 234, 235, 238, 239 magnetization, 238 maintenance, 135 malignancy, 130 manipulation, 239 manufacturing, xii, 315, 316, 328, 331, 332, 335,
351, 352 marrow, 94, 120, 121, 134, 135, 139, 158 masking, xii, 315, 316, 331, 352 material surface, 83, 105 materials science, 145, 191 maturation, 89, 90 measurement, 6, 7, 8, 12, 40, 41, 63, 244, 245, 248,
350 mechanical properties, xi, 98, 165, 243, 244, 250,
251, 275, 276 medical care, 145 melting, 166, 169, 177, 178, 179, 185 melting temperature, 177, 178, 179 melts, 178, 179 membranes, 117, 120, 122, 123, 129, 130, 145, 156,
157, 158, 160, 212, 244, 317 memory, vii, viii, 1, 45, 46, 59, 74, 238, 239, 339 mercury, vii, 1, 58 mesenchymal stem cells, 138, 161 mesitylene, 80 metabolism, 74 metal oxides, 75 metal salts, 194 metals, vii, viii, xi, 1, 45, 98, 201, 233, 274 metal-semiconductor, 333 methanol, 236 methyl methacrylate, 114, 283, 285, 286 microcavity, 317 microelectronics, 274, 306, 317 microfabrication, 74, 75, 145 micrometer, 245 microorganism, 82 microporous materials, vii, 212 microscope, xi, 243, 244, 245, 246, 316, 348 microscopy, 122, 135, 137, 142, 143, 166, 287, 292,
301, 304, 306 microspheres, 91, 92 microstructure, 102, 194, 214, 222, 228, 246 microwave, 339 migration, 82, 123, 137 milk, 224, 231 minority, 180, 268, 269 missions, xii, 315, 331, 340 MMA, 286, 287 mobility, xii, 105, 107, 268, 269, 315, 338, 347 model, viii, xi, 4, 5, 16, 34, 38, 39, 40, 41, 45, 46, 53,
57, 59, 64, 68, 107, 110, 111, 123, 126, 127, 130,
Index 362
140, 142, 143, 156, 159, 164, 174, 178, 220, 243, 255, 269, 296, 300, 304, 317, 318, 319, 346
modeling, xi, 261, 269, 270 models, 166, 167, 186, 231, 280, 296, 300, 317 modules, 74, 270 modulus, ix, xi, 163, 165, 171, 174, 243, 244, 245,
246, 249, 250, 255, 258, 291 moisture, 250, 274, 277, 294 molar volume, 169 mole, 181 molecular dynamics, 166 molecular mobility, 276, 292, 305 molecular weight, 130, 277, 285, 290, 291 molybdenum, 233 momentum, 34 monolayer, 142, 143 moon, 208, 271, 310, 352 motion, 18, 46, 164, 165 moulding, 122 movement, 299
N
NaCl, 58, 103, 192, 195 nanocomposites, 152, 155 nanocrystals, ix, xii, 75, 115, 163, 164, 165, 167,
169, 177, 179, 180, 184, 315 nano-crystals, 316 nanodevices, 186 nanofibers, 75 nanoindentation, xi, 243, 244, 245, 249, 251, 255 nanomaterials, 116, 145, 244 nanomedicine, viii, 73, 74 nanometer scale, 93, 164, 166, 167, 177, 180, 185,
234, 276, 306 nanometers, 99, 125, 177, 192, 283, 288, 292 nanoparticles, xii, 74, 75, 93, 114, 115, 116, 151,
152, 155, 156, 165, 275, 276, 284, 285, 286, 305, 316, 347, 348, 349, 351, 352
nanorods, 151 nanoscale materials, 75 nanostructured materials, 192, 234 nanostructures, ix, 131, 156, 157, 163, 164, 165, 166,
177, 185, 186 nanotechnology, viii, 73, 74, 145, 160, 284 nanotube, 75, 130, 131, 132, 133, 135, 138, 140,
141, 142, 143, 144, 145, 146, 156, 160, 161, 165, 192
nanotube films, 133, 144 nanowires, 157 neovascularization, 82 neurotransmitter, 115 neutrophils, 82, 122 next generation, 74, 131, 137
nickel, 236 niobium, 161 nitrate, 348 nitrogen, 100, 217, 263, 276, 289, 290, 302, 303 noise, xii, 273, 274 nonoutflow, viii, 2, 46, 57, 58, 68 norbornene, 285 nucleation, 91, 164, 166, 174, 177, 180, 182, 183,
184 nuclei, 181 nucleic acid, 74 nucleus, 65, 114, 137, 181, 182, 183 nutrients, 82, 128, 130
O
observations, 164, 167, 171, 172, 180, 287 oil, 80, 223, 224, 231 oligomers, 105 operator, 27 optical properties, 248, 316, 317 optoelectronic devices, 352 optoelectronics, xi, 261, 262, 270, 317 ores, 15, 322, 325 organic compounds, viii, 45, 58 organic dielectrics, 305 organic polymers, 276, 305 organic solvents, 289 orientation, 167 osteomyelitis, 94, 139 oxidation, ix, xi, 145, 191, 192, 193, 197, 198, 199,
201, 204, 207, 261, 262, 320, 331 oxides, x, 191, 193, 196, 201, 204, 206, 207, 244 oxygen, 82, 105, 122, 128, 204, 205, 207, 218, 220,
237, 267
P
paclitaxel, 127, 140 parameter, 66, 139, 175, 213, 264, 265, 300 parameters, xii, 50, 58, 66, 68, 89, 93, 99, 100, 125,
131, 139, 195, 204, 213, 216, 239, 246, 263, 269, 270, 297, 298, 315, 316, 320
parathyroid, 155 parathyroid hormone, 155 parenchymal cell, 82 particle morphology, 81, 152, 218 passivation, 192, 269 passive, ix, xi, 191, 261, 262 pathways, 74, 82 patterning, 331 penetrability, 37 peptides, 84, 98, 111
Index 363
percolation, vii, 1, 2, 3, 4, 5, 7, 11, 12, 13, 15, 16, 17, 19, 20, 21, 22, 23, 24, 34, 36, 38, 39, 41, 47, 48, 51, 52, 56, 57, 59, 60, 61, 62, 67, 68
percolation cluster, 56, 59, 62, 68 percolation theory, 2, 15, 19, 34, 51, 57 periodicity, x, 211 periodontal, 94 peritoneal cavity, 123 peroxide, 143, 144 phagocyte, 159 phagocytosis, 122 pharmaceuticals, 93 pharmacokinetics, viii, 73, 74 phase transformation, 180, 193 phase transitions, 2 phenotype, 120 phonons, 199 phosphates, 236, 237 phospholipids, 123 phosphorous, 135 phosphorus, 83, 85, 120 photocatalysis, 130 photocatalysts, 142, 192 photodetectors, 317 photoelectron spectroscopy, 138 photoluminescence, xii, xiii, 262, 315, 316, 331, 340 photonic crystals, 317 photovoltaic devices, 340 physical properties, x, 164, 165, 166, 167, 180, 185,
233, 234 physicochemical properties, 136 physics, ix, 71, 163, 164 pitch, 244, 245 plants, 151 plasma, ix, 81, 95, 111, 119, 123, 125, 126, 127, 132,
133, 157, 159, 191, 192, 193, 197, 201, 202, 207, 274, 275
plasma membrane, 123 plasma proteins, 81, 111, 123 plasmid, 114 platinum, 78, 320, 341 PMMA, 280, 290, 291 point defects, 165 polarity, 101, 106, 112, 333 polarization, 201 pollutants, 192 pollution, 331 poly(methyl methacrylate), 280, 290 polycondensation, 229, 277, 279, 283, 286, 289 polyesters, 286 polyether, 276 polyimide, 276, 291 polyimides, 275, 276, 291, 303, 305
polymer composites, vii, viii, 1, 45 polymer films, 127, 159, 248 polymerization, 119, 132, 133, 157, 283, 284 polymers, 74, 113, 114, 119, 145, 275, 280, 283,
285, 286, 291 polyphosphates, 194 polystyrene, 114, 291 polyunsaturated fat, 224 polyunsaturated fatty acids, 224 polyurethane, 91 poor, viii, 73, 74, 129, 145, 275, 317, 321, 331, 340,
350, 351 population, 193 porous materials, x, 76, 145, 159, 212, 214, 225, 226,
229, 231, 234, 235, 236, 239, 300 positron, 292, 303, 304 positrons, 304 potassium, 201, 202, 206, 207, 214, 215, 216, 230 power, xii, xiii, 273, 274, 316, 333, 346, 348, 351,
352 precipitation, 215, 216, 230, 286 precursor cells, 136 probability, 14, 15, 19, 39, 48, 49, 50, 51, 52, 54, 61,
67 probe, 246, 302, 304 production, x, xii, 83, 98, 120, 121, 122, 127, 130,
135, 137, 192, 196, 212, 270, 273, 274, 275, 284, 305, 306, 348
program, 74 proliferation, 82, 84, 120, 121, 127, 135, 136, 137,
139, 140, 161 proportionality, 117 propylene, 276, 286, 287 prostheses, 98 prosthesis, 137 prosthetic device, 149 proteins, 74, 81, 84, 93, 94, 98, 99, 103, 104, 108,
111, 114, 130, 141, 142, 154, 158, 159 PSD, 222, 224, 228 PTFE, 275 pulse, 33, 34, 105 purification, 130 purity, 200, 274
Q
QMPS, xi, 261, 262, 263, 264, 265, 266, 267, 268, 269, 270
quantum confinement, 192, 269, 320, 339, 340, 346 quartz, 216, 223, 302
R
radiation, 143, 281, 292, 300, 304
Index 364
radical copolymerization, 286 radius of gyration, 277 random walk, 183, 319 reaction temperature, 80 reagents, 212 reality, 177 reason, 4, 15, 16, 20, 42, 90, 131, 137, 169, 177, 220,
226, 227, 306 receptors, 123 recognition, 155 recombination, 340 reconstruction, 97, 167 recrystallization, 193, 264, 266 rectification, 338 redistribution, 118 reduction, 348, 351, 352 refining, 223 reflectance spectra, 268 reflection, 248, 294, 300 reflectivity, 248, 287, 292, 300, 301 refractive index, 275, 282, 287, 288, 291, 295, 302 refractive indices, 279, 281, 284, 285, 287 regeneration, 82, 83, 84, 93, 97, 107, 111, 133, 150,
154 region, 167, 171, 176, 180, 183, 184, 185, 193, 197,
206, 245, 253, 262, 264, 299, 301, 325, 327, 328, 333, 334, 336, 343, 346
regulation, 130 rehydration, 236 relationship, 47, 50, 54, 56, 57, 58, 59, 60, 66, 67,
167, 175, 176, 178, 184, 185, 255, 333 relative size, 164, 167, 185 relaxation, 26, 36, 167, 238 relevance, 150 reliability, 244, 276, 302 remodelling, 82 repair, 82, 99, 107, 137, 153 reparation, 80 replication, 157 resistance, vii, xii, 1, 129, 140, 192, 195, 196, 220,
269, 274, 316, 345, 346, 347, 350, 351, 352 resolution, 154, 292, 300, 301, 349 restenosis, 123, 127, 137, 159, 160 retardation, 4, 34 retention, 111 rhenium, 161 rings, 287 risk, 130, 137 rods, 113 root-mean-square, 202 roughness, xii, 83, 119, 196, 202, 246, 266, 294, 300,
302, 316, 346 Royal Society, 148
rutile, 192, 193, 194, 195, 199, 200, 204
S
safety, 324 salt, vii, 1, 6, 58, 79, 200, 207 salts, viii, 45, 58, 59, 60, 79, 194 scale system, 146 scaling, 52, 274 scanning electron microscopy, 86, 292 scar tissue, 135, 136 scattering, 269, 275, 277, 279, 282, 286, 287, 292,
293, 294, 295, 296, 297, 298, 299, 300, 304, 338 scattering patterns, 298 scientific method, 166 search, x, 233 secrete, 82 secretion, 122, 130 seed, xi, 261, 262, 303 segregation, 6, 281 selecting, 118 selectivity, viii, 73, 74 self-assembly, 86, 91, 113, 244 self-ordering, 117, 130, 131, 160 self-organization, 156 semiconductor, 130, 165, 305, 306, 323, 333, 351 semiconductors, 165 sensing, 302 sensitivity, 6, 216, 300, 303 sensors, xi, 74, 93, 130, 239, 244, 261, 262, 317 separation, 116, 119, 131, 133, 192, 214, 277, 281,
286, 299 serum, 80, 81, 94, 103, 123, 140, 141, 154 serum albumin, 80, 81, 94, 103, 140, 141, 154 severe stress, 302 severity, 122 SFT, 347 sharing, 105 shock, 3 side effects, 74 signals, 130 signs, 59, 127 silane, 289 silanol groups, 83, 84, 90, 105, 106, 108, 111 silochromes, vii, viii, 1, 45, 65 silver, xii, 274, 316, 348 simulation, 35, 166, 269, 270 sintering, 120, 264, 275 skeleton, vii, 1, 5, 15 skin, 82, 165, 173, 174, 175, 178, 179, 183, 184,
185, 224 smooth muscle, 127, 137, 139, 161 sodium, 78, 79, 119, 131, 133, 153, 194, 195, 214 software, 255
Index 365
solar cells, xi, 93, 130, 192, 261, 262, 269, 270, 317 sol-gel, 85, 86, 119, 152, 153, 275, 286, 288, 291 solubility, viii, x, 73, 74, 96, 100, 166, 211, 214, 216,
227, 276, 284, 285, 348 solvent, 320, 323, 332, 341, 347, 348 sorption, 230 space, vii, 4, 14, 15, 16, 29, 35, 39, 47, 48, 58, 68,
77, 82, 87, 102, 105, 199, 262, 279, 281, 317, 338, 339
species, 77, 83, 94, 104, 109, 156, 157, 194, 196, 201, 207, 238
specific surface, viii, x, 5, 45, 54, 57, 68, 91, 145, 192, 212, 213, 215, 216, 217, 219, 220, 222, 223, 225, 228, 229
spectroscopy, 86, 105, 196, 207, 287, 292, 303, 304 spectrum, 26, 200, 204, 205, 206, 238, 270 speed, 118, 274 spin, xii, 237, 238, 273, 274, 275, 277, 286, 305 stability, viii, xi, 49, 73, 78, 145, 261, 275, 276, 277,
305, 306 staphylococci, 149 steady-state growth, 117 steel, 5, 81, 92, 127 stem cells, 138 stent, 123, 124, 127, 128, 137, 159 stimulus, 114, 119, 142, 164, 186 STM, 292, 301, 304 stomach, 94 storage, vii, x, 113, 116, 130, 155, 164, 192, 233,
234 strain, 33, 167, 169, 170, 171, 173, 174, 204, 255,
264, 265 strategies, 114, 118, 125, 146 strength, 33, 129, 165, 166, 174, 244, 250, 252, 294,
304, 351 stress, xi, 130, 165, 167, 169, 170, 204, 243, 244,
253, 254, 255, 256, 257, 274 stretching, 138 stromal cells, 134, 135, 158 structural changes, xi, 200, 243, 254 structural characteristics, 88, 90, 237, 281 structural dimension, 116 structural modifications, 86, 231 styrene, 285, 287 substitution, 97, 194, 213, 214, 218, 220, 229 substrates, 137, 158, 269, 286, 287, 294, 329 sulfur, 200 sulfuric acid, 156, 194, 195, 197, 199, 200, 207, 244 superconductivity, 235 supercritical carbon dioxide, 347 superimposition, 328, 335, 338, 340, 351 supply, 122 suppression, 350
surface chemistry, 75, 119, 124, 129, 132, 139, 145, 158, 159, 212
surface layer, 174, 322, 323, 328, 330, 345, 347 surface modification, 119, 123, 128, 131, 132, 144 surface properties, 153, 216, 245 surface region, 118, 204 surface structure, 167, 216 surface tension, 60, 168, 174, 181 surfactant, 75, 76, 79, 80, 81, 86, 91, 92, 105, 114,
148, 156, 225 suspensions, 91, 149 swelling, 79, 81, 303 switching, 235, 339 symbols, 296 symmetry, 101, 103, 170, 199, 238, 255 systems, 348
T
talc, x, 211, 212, 213, 214, 218, 219, 220, 221, 223, 229, 230, 231
tantalum, 161 tau, 30 technology, xiii, 316, 321, 328 temperature annealing, 266, 270 temperature dependence, 46, 47, 63, 64, 69 terminals, 333 tetraethoxysilane, 303 theory, 346 therapeutic agents, 74 therapeutic goal, 74 therapeutics, 93, 127, 146 therapy, 74, 94, 95, 98, 128, 130, 139, 144, 145 thermal activation, 176, 178, 216 thermal analysis, 58 thermal decomposition, 219, 277, 284, 291 thermal degradation, 276, 281, 282, 286, 288, 290,
299, 301, 305 thermal evaporation, 289 thermal expansion, 244, 300 thermal stability, ix, 78, 116, 164, 166, 185, 186,
214, 230, 239, 276, 294 thermal treatment, 165, 231, 277, 282, 286, 290 thermodynamic method, 166 thermodynamic properties, 68 thermodynamics, 47, 166, 167, 177, 180 thermolysis, 200, 291 thin films, 97, 192, 274, 275, 277, 284, 292, 293,
294, 297, 300, 302, 304, 305, 306 threshold, vii, viii, 1, 2, 3, 4, 7, 12, 13, 15, 20, 21, 22,
23, 24, 25, 34, 35, 36, 38, 41, 42, 45, 46, 47, 48, 52, 60, 61, 67, 91, 171
thrombosis, 137 thrombus, 127
Index 366
time, 332, 336, 339, 344, 345, 347 time periods, 30 time variables, 193 timing, 74 tin, 8, 12 tissue remodelling, 82 titania, viii, x, 73, 75, 130, 131, 132, 133, 135, 136,
137, 138, 139, 140, 141, 142, 144, 145, 153, 161, 191, 192, 198, 199, 200, 201
titanium, ix, x, 117, 131, 132, 134, 135, 136, 138, 140, 149, 160, 161, 191, 192, 193, 196, 197, 199, 200, 201, 202, 204, 205, 207
toluene, 302 topology, 102 total energy, 168 toxicity, viii, 73, 82 transducer, 91 transfection, 114 transformation, 9, 16, 57, 138, 170 transforming growth factor, 82 transition, vii, x, 1, 2, 3, 7, 11, 13, 15, 16, 24, 25, 31,
38, 51, 56, 58, 66, 75, 89, 90, 166, 177, 186, 233, 237, 238, 239, 300
transition metal, x, 233 transition metal ions, x, 233 transition temperature, 237, 238, 239 translation, 189 transmission, 78, 79, 244, 246, 292, 293, 294, 300 transmission electron microscopy, 292 transplantation, 130 transport, 89, 91, 96, 103, 109, 130, 156, 157, 164,
165, 269 trauma, 74 tricarboxylic acid, 104, 236 triggers, 115 tryptophan, 94, 111 tumor, 120, 143 tumor cells, 120, 143 tungsten, 92 tunneling, 166, 292
U
underlying mechanisms, 185 uniform, xii, 2, 16, 39, 76, 77, 78, 80, 105, 130, 197,
200, 202, 207, 214, 220, 222, 223, 273, 275, 285, 292, 333, 339, 351
unique features, 75, 93 uterus, 83 UV light, 113, 143, 334
V
vacancies, 164, 165, 166, 264
vacuum, 262, 264, 270, 275, 289, 293, 298, 302, 303 valence, x, 142, 191, 196, 205, 207 vanadium, 236 vancomycin, 94, 115, 140 vapor, 167, 169, 181, 185, 230, 267, 274, 289, 302,
320, 346 variation, 325, 334, 343, 344, 345 vascular prostheses, 137 vascular stents, ix, 73, 139, 145 vasculature, 119 vector, 293, 295 velocity, viii, 2, 37, 174, 175, 176, 177 vesicle, 78, 158 vessels, 82, 123, 127 vibration, 199 viral vectors, 75 viscosity, 4, 5, 12, 13, 18, 30, 36, 39, 41, 47, 276 vitamins, 145
W
water absorption, 286 waterways, 215 wave vector, 295 wavelengths, 113 weakness, 131, 304 web, 137 wettability, xi, 132, 139, 243, 248 wetting, vii, viii, 1, 3, 9, 16, 46, 47, 49, 156, 244,
245, 248, 258 wide band gap, 130 windows, 102, 103, 192 wires, 78, 117, 347 workers, 80, 113, 114, 123, 135, 165, 237 wound healing, 82, 149 wound infection, 82
X
XPS, 121, 205, 206, 207 X-ray diffraction, 207 X-ray diffraction (XRD), 207 X-ray photoelectron spectroscopy (XPS), 205 XRD, 138, 196, 199, 200, 204, 219, 264
Y
yield, xii, 315, 316, 348
Z
zeolites, vii, viii, 1, 45, 46, 59, 212