24
1 Nasdaq: MNRO Updated October 2016

1 Nasdaq: MNRO Updated October 2016

2
Statements contained in these materials regarding Monro’s
expectations with respect to future operations and other
information, which can be identified by the use of forward
looking terminology, such as “may,” “will,” “expect,” “project,”
“anticipate,” “estimate” or “continue” or the negative thereof or
variations thereon or comparable terminology, are forward
looking statements. Several factors, including certain risks and
uncertainties, could cause actual results to differ materially from
results referred to in forward looking statements. There can be
no assurance that Monro’s expectations regarding any of these
matters will be fulfilled.
Forward Looking Information

3
Who We Are

4
• Largest chain of
Company-operated
undercar care facilities
in the United States
• As of September 24,
2016, the Company
operated 1,097 stores in
26 states
• Through Car-X
acquisition in April
2015, the Company is
franchisor to 131
franchised locations in
10 states and operates 12
Car-X locations
Company Overview

5
Geographic Presence Service Tire
Stores Stores
Connecticut 36
Delaware 2 7
Florida 53
Georgia 12
Illinois 1 5
Indiana 10 29
Kentucky 33
Maine 15
Maryland 10 65
Massachusetts 39 10
Michigan 17
Missouri 22
New Hampshire 9 17
New Jersey 13 33
New York 118 35
North Carolina 32
Ohio 109 36
Pennsylvania 106 25
Rhode Island 8 2
South Carolina 1 17
Tennessee 3
Vermont 1 4
Virginia 11 59
West Virginia 7
Wisconsin 17
TOTAL 515 514
Total Company owned stores
as of March 26, 2016: 1,029
MAINTAINING DOMINANCE
IN THE NORTHEASTERN U.S.

6
Brakes Exhaust Steering Maintenance* Tires
*Includes state inspections, lube, oil, filter, engine cooling service, scheduled maintenance and other.
Note: Monro’s fiscal year end is March of each year.
FY16 – Q2
Service Mix
Gross Margin %
Brakes and Steering = +15
Maintenance and Exhaust = baseline company margin
Tires = -10
FY15
FY16 FY17 – Q2

7
Competitive Advantages
Operating Model
• Company-operated stores
– Faster, Better, Cheaper
– Centralized purchasing and distribution
– Efficient marketing (database mailing, email, direct mail
and internet)
– Superior customer service
• Pricing power and fixed cost leverage
– Low cost operator
8
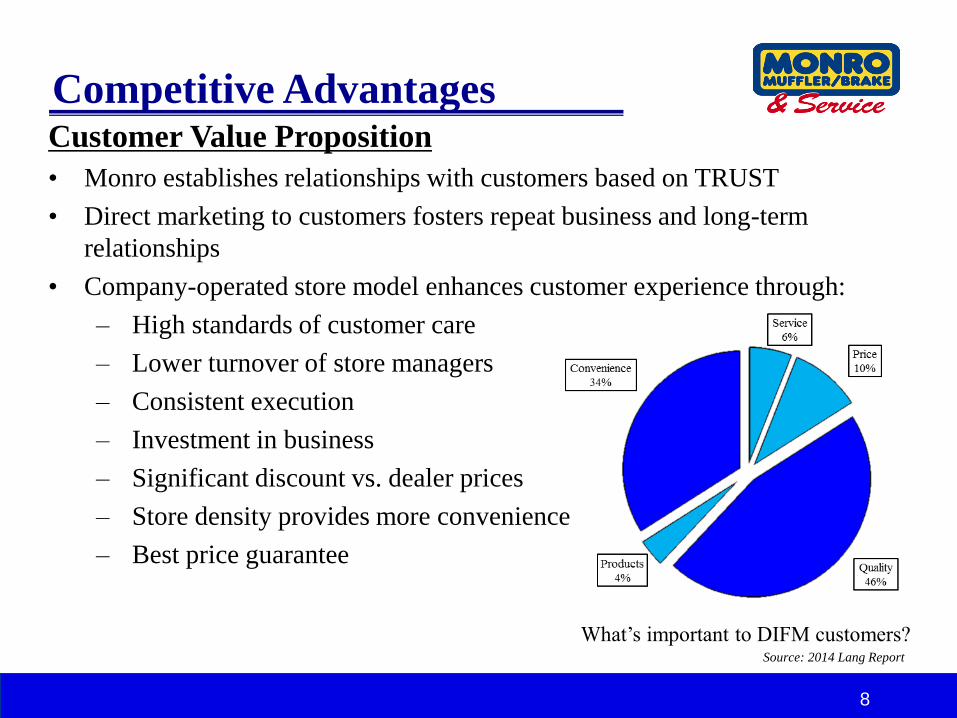
Customer Value Proposition
• Monro establishes relationships with customers based on TRUST
• Direct marketing to customers fosters repeat business and long-term
relationships
• Company-operated store model enhances customer experience through:
– High standards of customer care
– Lower turnover of store managers
– Consistent execution
– Investment in business
– Significant discount vs. dealer prices
– Store density provides more convenience
– Best price guarantee
Competitive Advantages
What’s important to DIFM customers? Source: 2014 Lang Report

9
High Customer Satisfaction
Monro Website Internet Paid Ads
•http://www.monro.com/Customer-Satisfaction-Rating

10
Monro operates in $197 billion “Do-It-For-Me*” segment of
$246 billion U.S. automotive aftermarket industry
* Includes Replacement Tire Segment.
Do-It-Yourself:
1999 - 25.7%
2009 - 22.0%
2014 - 20.5%
Do-It-For-Me:
1999 - 74.3%
2009 - 78.0%
2014 - 79.5%
Source: 2016 Lang Annual Report
Industry Overview
U.S. Automotive
Aftermarket Industry
Source: 2016 Lang Annual Report
Service Bay Population
Changes: 1999 – 2014
Total Bays / Mkt Share % (000’s)
2008
338/28.3
340/28.5
199/16.7
73/6.1
125/10.5
119/9.9
1,194/100
2014
349/29.8
287/24.5
222/18.9
82/7.0
127/10.8
106/9.0
1,173/100

11
US Light Vehicle in Operations (VIO)
Source: IHS Automotive
VIO is expected to increase 9.2% by 2020

12
258 million vehicles on road
Vehicles in operation projected to increase over 9% during 2015 - 2020
Increasing age of vehicles (12.0 years)
Number of vehicles 6 years and older to increase
Significant average annual miles driven per vehicle
Decreasing number of service outlets and bays
Increasing complexity of vehicles
Favorable demographics
Ability to raise prices
Headwinds : ― Consumer
Favorable Industry Trends

13
200
210
220
230
240
250
260
270
280
02 03 05 06 08 10 11 13 15 20F
232 236
244 246
252 250 250 250
258
282
Source: IHS Automotive.
Cars and Light Trucks in Service
.
Average Age of Car and Light Truck on the Road
Ag
e (
in y
ea
rs)
Source: 2012 Lang Report, Zacks.com, March 2015 The Lang Aftermarket iReport,
2016 Digital AutoCare Factbook.
.
U.S. Annual Light Vehicle Sales
Source: October 2012 Lang Report, September 2013 Lang Report , 2014 Lang Report,
2016 Lang Annual Report.
Vehicles per Service Bay
Favorable Industry Trends
Source: November 2012 Lang Report, 2012 Wall Street Journal, June 2014 Lang
Report and March and October 2015 and May 2016 The Lang Aftermarket iReport

14
% Change 178% 24% 17% 17% 22% 17% 12% (4)% 3% 20% 34% 35% 17% (22%) 27% 13% 6% 0%-5%
EPS Trends
•Adjusted for three-for-two stock split paid to shareholders of record as of October 21, 2003, September 21, 2007 and December 13, 2010.
•Note: Monro’s fiscal year end is March of each year.

15
Historical Financials
(Dollars in millions except per share data) 2nd
Quarter
2017
2nd
Quarter
2016
Fiscal Year
2016
Fiscal Year
2015
Sales $248.6 $239.2 $943.7 $894.5
Sales Growth (vs. prior year) 3.9% 8.1% 5.5% 7.6%
EBITDA * $ 42.6 $ 43.8 $160.7 $146.4
EBITDA Margin 17.1% 18.3% 17.0% 16.4%
Operating Income * $ 31.9 $ 34.1 $120.6 $109.8
Operating Income Margin 12.8% 14.3% 12.8% 12.3%
Net Income $ 17.5 $ 18.9 $ 66.8 $ 61.8
Net Income Margin 7.1% 7.9% 7.1% 6.9%
EPS (Diluted)
$ 0.53
$ 0.57
$ 2.00
$ 1.88
EPS Prior Year $ 0.57 $ 0.50 $ 1.88 $ 1.67
* Fiscal 2016 includes $3.6 million of due
diligence costs ($.07 EPS). Fiscal 2015
includes $1.7 million ($.03 EPS).

16
Balance Sheet Highlights
Fiscal Q/E
September 24, 2016
Fiscal Y/E
March 26, 2016
Current assets $ 200,998 $170,075
Property, plant & equipment, net 373,906 351,582
Other non-current assets 578,800 477,781
Total assets $1,153,704 $999,438
Current liabilities $ 180,000 $167,571
Capital leases and financing obligations
Other long-term debt
186,123
197,471
165,730
103,315
Other long-term liabilities 26,605 26,627
Total liabilities 590,199 463,243
Shareholders’ equity 563,505 536,195
Total liabilities and shareholders’ equity $1,153,704 $999,438
Debt-to-capital (includes capital leases) 41% 34%
Debt-to-capital (excludes capital leases) 26% 16%

17
Increase market share through same store sales growth
Acquire competitors cheaply
Continue new store openings in existing markets
– Approximately 20 to 40 stores per year
Growth Strategy

18
Building Tire Store Category
Combination of 40 acquisitions in the last 15 years
- 634 stores
- $800 million revenue
Could have up to 1,300 tire stores and 1,300 service stores in our 26 states
- Creates market dominance and pricing power
- Diversifies risk
- Expands pool of acquisition candidates at attractive prices
- Concept unique and difficult for competitors to replicate
Should afford opportunity to expand operating margins and further improve business model
- Share inventory
- Advertising, logistics, operations
- Gross margins lower but SG&A absorption better
Acquisitions and Opportunities

19
Kramer Tire (April 2012) Tire King (December 2012)
• 20 stores in Virginia • 9 stores in North Carolina
• 2011 sales - $25 million • 2011 sales - $11 million
• Purchased real estate for four locations Colony Tire (June 2012)
• 18 stores in North Carolina Curry’s Auto Service (August 2013)
• 2011 sales - $25 million • 10 stores in Virginia (9) and Maryland (1)
• 2012 sales - $18 million
Tuffy/Car-X (August 2012) • Purchased real estate for one location
• 17 stores in Wisconsin (13) and South Carolina (4)
• 2011 sales - $9 million S & S Firestone (November 2013) • 4 stores in Kentucky
Tire Barn (November 2012) • 2012 sales - $5 million
• 31 stores in Indiana (27), Tennessee (3) and Illinois (1) • Purchased real estate for three locations
• 2011 sales - $64 million
Carl King Tire (November 2013)
Ken Towery Tire and Auto Care (December 2012) • 6 stores in Delaware (5) and Maryland (1)
• 27 stores in Kentucky (24) and Indiana (3) and • 2012 sales - $10 million Wholesale operation
• 2011 sales - $54 million (including Wholesale) Lentz USA/Kan Rock Tire (June 2014)
• Distribution center located in Louisville, Kentucky • 19 stores in Michigan
• 2013 sales - $14 million
Enger Tire Center/Enger Auto Service (December 2012) • Purchased real estate for all locations
• 12 stores in Ohio
• 2011 sales - $9 million
• Purchased real estate for eight locations
Recent Acquisitions

20
The Tire Choice (August 2014) Kost Tire and Windsor Tire (NY, PA, MA)
• 35 stores in Florida (July/August 2015)
• 2013 sales - $48 million • 31 stores in central New York, Pennsylvania and
• Purchased real estate for five locations Massachusetts. Kost stores = 27 locations
• 2014 sales - $31 million
Wood & Fullerton (October 2014) • Breakeven to slightly accretive in first 12 months
• 9 stores in Georgia
• 2013 sales - $10 million McGee Auto Service & Tires (May 2016)
• 29 stores and one retread facility in Florida
Gold Coast Tire & Auto Centers (December 2014) • $50 million in annualized sales
• 9 stores in Florida • Breakeven in fiscal 2017
• 2013 sales - $9 million Excel Tire (July 2016)
Martino Tire (March 2015) • 4 stores in Minnesota
• 8 stores in Florida • 2015 sales - $3.4 million
• 2014 sales - $12 million
Clark Tire (September 2016)
Car-X (April 2015) • 26 stores, four wholesale locations and one retread
• Trade name and franchise rights to 146 franchise facility in North Carolina
locations in Illinois, Indiana, Kentucky, Missouri, Ohio, • $85 million in annualized sales
Tennessee, Wisconsin, Iowa, Minnesota and Texas • Slightly dilutive in FY17
• Slightly accretive in first 12 months
Recent Acquisitions

21
FY17 Earnings Assumptions
• Earnings estimate for FY17: $2.00 - $2.10 vs $2.00 in FY16
– Q1 – FY17: $.50 vs. $.57 Q1 FY16
– Q2 – FY17: $.53 vs. $.57 Q2 FY16
– Q3 – FY17: $.51 - $.55 vs. $.46 Q3 FY16
• Comparable Store Sales decrease of 2.5% to decrease of 1.5% for FY17;
‒ Q1 FY17: - 6.9%
‒ Q2 FY17: - 4.3%
‒ Q3 FY17: 1.0% to 2.5%
• Gross Sales approximately $1.03 billion - $1.04 billion
• Operating Margin down 65 basis points at midpoint of guidance
– Depends upon sales and retail pricing environment
– Tire costs declining, benefitting margins
– Expect to overcome inflation on flat comparable store sales due to lower anticipated material costs
(normally 2% - 2.5% required)
– Improve technician productivity (Sales per Man Hour)
– Improve store execution, customer experience and marketing to drive traffic and sales

22
• Interest Expense of $17 million
• $42 million depreciation and amortization
• EBITDA approximately $174 million
• $46 million of cap-ex
– $26 million in maintenance cap-ex
– $20 million for new stores
FY17 Other Assumptions

23
Acquisitions
Same or contiguous markets
Buy right
Accretive to earnings in a reasonable timeframe
Pay down debt
FY17 Cash Flow Priorities

24
Largest chain of Company-operated undercar care facilities in the U.S.
Wide breadth of product and service offerings
Superior customer service
Favorable industry trends
Leading market position in Northeast, Great Lakes and Mid-Atlantic with a presence in 26 states
Strong balance sheet and cash flow
Low cost operator with superior operating margins
13 years of consecutive sales increases
Significant growth opportunity through store expansion and acquisitions
Eleven dividend increases, in eleven years, since initiated
Investment Highlights


