1 National Diet and Nutrition Survey Rolling Programme Comparison Study A comparison of results by dietary assessment method: repeat 24-hour recall and four-day estimated diet diary April 2008 (updated September 2020*) Alison Stephen, Birgit Teucher, Les Bluck, Darren Cole, Emily Fitt, Adrian Mander, Rachel Woodward, Anthony Wright (MRC Human Nutrition Research) Beverley Bates, Claire Deverill, Helen Mackenzie, Caireen Roberts, (National Centre for Social Research) Jenny Mindell (Joint Surveys Team at University College London) *Edited for publication
Transcript
1
National Diet and Nutrition
Survey Rolling Programme
Comparison Study
A comparison of results by dietary
assessment method: repeat 24-hour recall
and four-day estimated diet diary
April 2008 (updated September 2020*)
Alison Stephen, Birgit Teucher, Les Bluck, Darren Cole, Emily Fitt, Adrian
Mander, Rachel Woodward, Anthony Wright (MRC Human Nutrition
Research)
Beverley Bates, Claire Deverill, Helen Mackenzie, Caireen Roberts,
(National Centre for Social Research)
Jenny Mindell (Joint Surveys Team at University College London)
*Edited for publication
2
CONTENTS
1 EXECUTIVE SUMMARY 6
2 INTRODUCTION 10
2.1 The NDNS rolling programme 10
2.2 Purpose and design of the Comparison Study 11 2.2.1 Aims of the Comparison Study 11 2.2.2 The Interviewer Visits 12 2.2.3 Tokens of appreciation 13 2.2.4 Ethical approval 13
CAPI modules:physical activity, sun exposure,eating habits in recall period
Give token of appreciation
Introduce DLW and ActiGraphTM if applicable
13
Additional interviewer visits were made to the sub-sample of respondents taking part in the
DLW/Actigraph sub-study. These visits involved administering the DLW dose, instructing respondents
how to wear the ActiGraphTM and showing them how to complete the paperwork associated with the
follow-up study. Interviewers then returned to the household to collect urine samples, physical activity
monitors and the accompanying paperwork.
2.2.3 Tokens of appreciation
In acknowledgement of the amount of time and effort respondents were asked to devote to this study,
we offered a token of appreciation to those who completed three or four 24-hour recalls or a diary for
three or four days (i.e. those defined as ‘fully productive’). The tokens were £40 in high street gift
vouchers for each respondent.
Those who took part in the DLW/ ActiGraphTM sub-study, and who provided at least one sample of
urine post-dosing and who wore the ActiGraphTM for at least one day received £30 in high street gift
vouchers. Any child aged 11-15 years who took part in the ActiGraphTM only sub-study, also received
£30 in high street gift vouchers.
2.2.4 Ethical approval
Research ethics approval for the NDNS Comparison Study was obtained from the Cambridge 4 Multi-
centre Research Ethics Committee (MREC), study reference no. 07/MRE05/11.
14
1 The mainstage sample will include Northern Ireland 2 The CU is the primary grouping for this study. It is a group of people “who eat food that is
bought and prepared for them (largely) as a group”. Occasionally a household will be found to
15
consist of more than one CU. Although people may share accommodation and even be related, they may not be in the same CU. For example, adult children sharing a house with their
16
parents may shop, cook and eat by themselves, in which case the parents would be in one CU and the children in another
3 The main NDNS will include individuals aged age 1.5 years and older.
17
3 Methods
3.1 Sample design
3.1.1 The sample
The sample was drawn from the publicly available Postcode Address File (Small Users) (PAF). The
sample consisted of 1,840 addresses in 80 postcode sectors (points) across England, Wales and
Scotland. Each point (assignment) had 23 issued addresses. Roughly half an assignment was
allocated at random to the 24-hour recall method and half to the diary method, to give interviewers
experience of both dietary methods.
An advance letter was sent to each address, introducing the study and explaining that the interviewer
would be calling. In Wales, a Welsh version of the letter was sent to all issued addresses, along with
the English version.
At each address, the interviewer enumerated the number of households and in cases where there
were two or more, selected one at random. Within each selected household the CUs were
enumerated and one randomly selected.
3.1.2 Respondent selection
In CUs containing at least one child aged four or older, interviewers selected one adult (aged 19+
years) and one child (aged 4-18 years) at random. In CUs with no such children, just one adult was
selected.
The selected respondents were asked to take part in the CAPI interview, the collection of dietary
information (through recall of four 24-hour periods or via a four-day diary) and have their height and
weight measured. If the adult selected was not the ‘Main Food Provider (MFP)’1, this person was also
invited to take part in a short CAPI interview.
A sub-sample of 160 respondents were recruited to a sub-study, to assess total daily energy
expenditure using the doubly labelled water method (DLW). This involved the respondent drinking a
glass of water labelled with the stable isotopes of hydrogen and oxygen, 2H and 18O, (tracer water)
and collecting spot urine samples, both before the dose of labelled water and on 10 consecutive days
after the dose. The DLW sub-sample, plus all children aged 11-15 years, were also asked to wear an
ActiGraphTM (physical activity monitor) for seven consecutive days.
18
3.2 CAPI data collection
The main interview for the Comparison Study was carried out using computer-assisted personal
interviewing (CAPI). The CAPI questionnaire had three elements:
• ‘Household Structure’ interview
• Main Food Provider (MFP) interview
• Individual interviews
The questionnaire was organised into a number of modules that could be accessed at different times
at the interviewer’s discretion.
The ‘Household Structure’ interview allowed the structure of the catering unit to be established, with
questions about:
• those living in the catering unit’s accommodation;
• the relationship of each person in the catering unit to everyone else;
• the ‘Household Reference Person’ (HRP);
• the ‘Main Food Provider’ (MFP);
• the individual respondent(s);
• the nature of tenure of the accommodation.
The Household interview also established each person’s sex, date of birth or age, relationship of
members of the catering unit to each other, work status and ethnicity.
The MFP questionnaire was divided into the following sections:
• Cooking facilities
• Shopping for food
• Free foods
• Barbecue use
• Food preparation
• Cooking skills
The individual questionnaire had two parts:
• CAPI 1, which was asked before the dietary data collection period; and
• CAPI 2, which was asked after the dietary data collection period.
The individual questionnaire was divided into a number of sections. Each section of CAPI 1 and CAPI
2 is shown in order below, and the intended respondent(s) are indicated:
19
CAPI 1 Sections Respondent
• Cooking Skills (Adult) All respondents 19+ years (or 16+ years and in full time
employment)
• Access to Food at School All respondents 4-18 years (unless if 16+ years and in full time
employment)
• Cooking Skills (Child) All respondents 4-18 years (unless if 16+ years and in full time
employment)
• Usual Eating Habits All respondents
• Education All respondents 19+ years (or 16+ years and no longer at school)
• Job/Income All respondents 19+ years (or 16+ years and in employment)
CAPI 2 Sections Respondent
• Eating Habits over the past 2 weeks All respondents in 24-hour recall sample
• Physical activity (Adult) All respondents 16+ years
• Physical activity (Child) Respondents 11-15 years
• Exposure outdoors All respondents
If a respondent was eligible for, and agreed to take part in, the DLW and/or ActiGraphTM part of the
study, there was a third part to the questionnaire, CAPI 3. CAPI 3 included administrative questions
about DLW and the ActiGraphTM, as well as re-administering the physical activity questionnaire.
3.3 Anthropometry
All respondents aged four and over were eligible to have their height and weight measurements taken
with the exception of pregnant or breastfeeding women. Heights and weights were measured during
the interviewer visit following the introduction of the diary or after the first 24-hour recall had been
completed.
3.3.1 Height
Height was measured using a portable stadiometer with a sliding head plate, a base plate and three
connecting rods marked with a metric measuring scale. The respondents were asked to remove their
shoes, stand facing forwards with their feet flat on the centre of the base plate, feet together and
heels against the rod. Respondents were asked to stretch to their maximum height with their head
positioned in the Frankfort plane. A maximum of three measurements were taken, the third required if
the difference between the first two measurements was greater than 0.5cm. The readings were
20
recorded to the nearest millimetre. An average of the two closest measurements was used for
analysis.
3.3.2 Weight
Weight was measured using Soehnle, Seca and Tanita electronic scales with a digital display.
Respondents were asked to remove shoes and any bulky items of clothing. A single measurement
was recorded to the nearest 100g. Respondents who weighed more than 130kg did not have a valid
measurement recorded because the scales are inaccurate above this level.
In the analysis of height and weight, data from those that interviewer considered to have unreliable
measurements were excluded from the analysis.
3.3.3 Body Mass Index
Body Mass Index (BMI) is a widely accepted measure of weight for height and is used to define
overweight or obesity. BMI is defined as weight (kg)/height2 (m). However BMI does not distinguish
between mass due to body fat or muscular physique, and does not take into account the distribution
of fat around the body.
BMI was calculated for all respondents for whom both a valid height and weight measurement was
recorded. Respondents aged 19+ years were categorised using the WHO classification into the
following groups:
BMI (kg/m2) Description
18.5 or less Underweight
Over 18.5-25 Desirable
Over 25-30 Overweight
Over 30 Obese
Overweight and obesity prevalence for children aged 2-18 years was estimated using the age and
sex-specific UK National BMI percentiles classification. Different growth patterns among boys and
girls at each age mean that a universal categorisation cannot be used to define childhood
overweight/obesity. The UK National BMI percentiles classification gives the BMI threshold for each
age above which a child is considered overweight or obese. The classification estimates were
produced by calculating the percentage of boys and girls who were over the 85th (overweight) or 95th
(obese) BMI percentiles of the 1990 reference population.
21
3.4 Energy Expenditure
3.4.1 Doubly-labelled water (DLW)
Study design
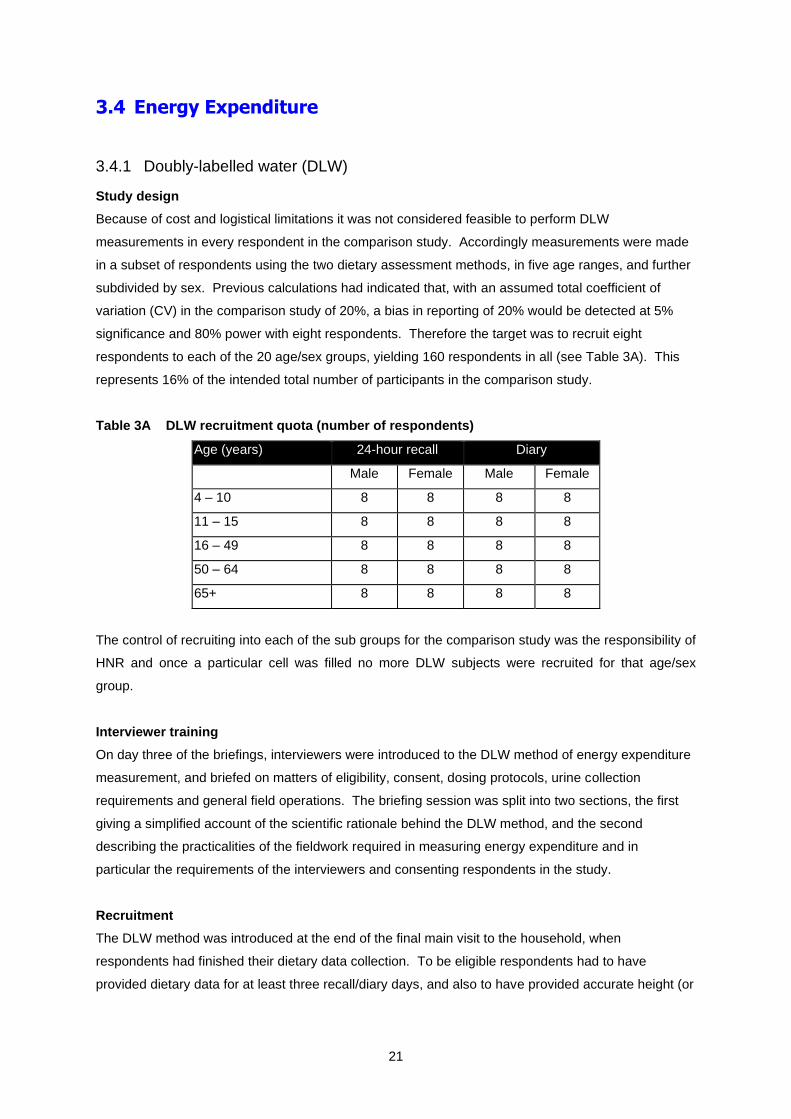
Because of cost and logistical limitations it was not considered feasible to perform DLW
measurements in every respondent in the comparison study. Accordingly measurements were made
in a subset of respondents using the two dietary assessment methods, in five age ranges, and further
subdivided by sex. Previous calculations had indicated that, with an assumed total coefficient of
variation (CV) in the comparison study of 20%, a bias in reporting of 20% would be detected at 5%
significance and 80% power with eight respondents. Therefore the target was to recruit eight
respondents to each of the 20 age/sex groups, yielding 160 respondents in all (see Table 3A). This
represents 16% of the intended total number of participants in the comparison study.
Table 3A DLW recruitment quota (number of respondents)
Age (years) 24-hour recall Diary
Male Female Male Female
4 – 10 8 8 8 8
11 – 15 8 8 8 8
16 – 49 8 8 8 8
50 – 64 8 8 8 8
65+ 8 8 8 8
The control of recruiting into each of the sub groups for the comparison study was the responsibility of
HNR and once a particular cell was filled no more DLW subjects were recruited for that age/sex
group.
Interviewer training
On day three of the briefings, interviewers were introduced to the DLW method of energy expenditure
measurement, and briefed on matters of eligibility, consent, dosing protocols, urine collection
requirements and general field operations. The briefing session was split into two sections, the first
giving a simplified account of the scientific rationale behind the DLW method, and the second
describing the practicalities of the fieldwork required in measuring energy expenditure and in
particular the requirements of the interviewers and consenting respondents in the study.
Recruitment
The DLW method was introduced at the end of the final main visit to the household, when
respondents had finished their dietary data collection. To be eligible respondents had to have
provided dietary data for at least three recall/diary days, and also to have provided accurate height (or
22
demi-span) and weight measurements. Respondents also had to agree to all of the requirements of te
DLW substudy.
Summary of field procedures for DLW
Once basic eligibility criteria had been established for the respondent to take part in the DLW study
and written consent had been obtained the following procedures were followed:
1. An instruction leaflet and pre-dose kit was given to the respondent
2. HNR was contacted with respondent details (serial number, age, sex, height and weight) and a
dose and sampling kit requested
3. The respondent was checked against the quota. If the respondent was not required, HNR informed
the interviewer, who relayed this to the respondent, and a £10 voucher was dispatched
4. If the respondent was required, details were logged and a custom-made dosing and sampling kit
(comprising the dose, drinking straw, ten pre-labelled sample bottles, a pen, and a returns bag) was
dispatched to the interviewer via a traceable delivery service.
5. The interviewer then revisited the respondent, and first ensured that the respondent was still willing
to continue with the study. If so, and once it was certain that a pre-dose urine sample had been
obtained, the respondent was asked to drink the dose using the straw provided. The bottle was then
refilled with tap water and the washings drunk again to ensure complete consumption of the dose.
The date and time of dosing was recorded.
6. The respondent was then instructed to supply daily urine samples (not the first void of the day) for a
period of ten days. Plastic cups were provided by the interviewer to aid collection, one clean cup for
each collection. When each urine sample was collected the respondent was required to note the date
and time on both their logging form and on the sample bottles themselves.
7. The respondent was asked to store the samples in a cool and preferably refrigerated place using all
the packing material provided until the end of the 10-day study period.
8. The interviewer was required to telephone each respondent half way through the collection period
to ensure correct compliance and to make sure no problems were being encountered. The
interviewer then returned after the end of the sampling period to collect the samples and dispatched
the full sampling kits back to HNR using a traceable delivery service.
9. On receipt of the samples at HNR the samples were logged into the sample reception system, and
frozen at –20oC until analysis.
Dose Preparation
The DLW dose was tailored according to each respondent’s body weight. An aliquot of water
containing the equivalent of 80mg/kg body weight 2H and 150mg/kg body weight 18O was cold filtered
into an autoclaved bottle with a tight fitting seal. The bottle was marked to indicate the level of filling,
so that the interviewer could detect gross spillage on delivery and request a replacement if necessary.
A sample of the dose was kept frozen at -20ºC for compositional analysis performed as part of the
mass spectrometric determinations.
23
Result computation
(a) Raw mass spectrometric data: Isotope ratios (2H/1H or 18O/16O) are measured in the both the
sample and also in a reference gas of arbitrary composition during each sample assay. Isotope ratios
are reported as fractional increments (‘delta values’) of the reference gas composition.
( )
ref
refsamp
refsampR
RR −=,
(b) Standardized mass spectrometric data: Included in every analysis batch are samples derived from
two waters, which have an isotopic composition traceable back to international standards. These
waters are selected to have isotopic compositions ref,1 , and ref,2 at either end of expected range of
enrichments. The international standard for this work is V-SMOW (Vienna Standard Mean Ocean
Water), and the delta values of these waters with respect to V-SMOW, SMOWV −,1 and SMOWV −,2 are
known. The raw data mass spectrometric data can then be standardized to the V-SMOW scale by
using:
( )( )
( )SMOWVSMOWVrefsamp
refref
SMOWVSMOWV
SMOWVsamp −−
−−
− +−−
−= ,1,1,
,1,2
,1,2
,
This is an implementation of the SMOW/SLAP correction often referred to in the literature
(c) Normalization of mass spectrometric data: A sample of the dose given is also analysed for isotopic
composition along with the urine samples. Since the enrichment of the dose exceeds the dynamic
range of the mass spectrometer it is first diluted by weighing out a small aliquot ( d ) into a known
volume (T ) of local tap water. Normalisation of the mass spectrometric data by the dose is then
achieved by:
( )( )refTrefd
SMOWVbasalSMOWVsamp
sampDT
d
,,
,,02.18
−
−=
−−
Where samp is the normalised enrichment, D the weight of the dose given, and the factor of 18.02 is
the relative molar mass of (unlabelled) water.
(d) Derivation of kinetic parameters from standardized mass spec. data: From the assumption of a
monocompartmental model of water distribution with elimination following first-order kinetics it follows
that the normalised enrichments should decay exponentially with time
}exp{1
)(
}exp{1
)(
tkN
t
tkN
t
O
O
O
H
H
H
−=
−=
Where the subscripts H and O denote hydrogen and oxygen isotopes respectively. Following Cole
and Coward.1 These equations are transformed by taking the logarithm of quotient and product
24
( )
( ) tkILntkkNN
LntPLn
tkILntkkN
NLntQLn
PPOH
OH
QQOH
O
H
−=+−=
−=−−
=
}{1
)}({
}{)}({
Linear regression is then be used to find QN , Qk , PN , and Pk , which are then combined to
transform back to the original variables
( )
( ) 2
2
1
QPO
PQQO
QPH
PQH
kkk
IIIN
kkk
IIN
−=
=
+=
=
(e) Calculation of CO2 Production: Carbon dioxide production is calculated from the kinetic
parameters obtained via
( )( )123
12
22 ffqf
ffFkNkNF sHHOO
CO−+
−−−=
In this equation SF represents the skin losses, which are fractionated, taken to be 27.3moles per day
for adults in a temperate climate, and q the fractionated respiratory losses expressed as a fraction of
CO2 production taken to be 1.1 under similar conditions. 941.01 =f , 991.02 =f , and 037.13 =f
are fractionation factors for 2H leaving the body as water vapour, 18O leaving via the same route, and
the exchange of 18O between carbon dioxide and water respectively.
(f) Calculation of total energy expenditure :Total energy expenditure is calculated from CO2 production
rate assuming that 12% of total energy is derived from protein oxidation2
( )2
550.5480.15 COFRQTEE +=
with the respiratory quotient RQ taken as 0.85
Quality control and assurance
(a) Quality Control applied to the batch of samples being analysed: In addition to the samples of
reference waters used in normalising the mass spectrometer results, other reference waters are
included in the sample batch. The analytical performance of the equipment was monitored using
these, and if an analysis was obtained which deviated by more than 2.5% of that expected then the
results from that batch were discarded.
25
(b) Quality Control applied to individual samples: Each sample was analysed in duplicate. In the
event of the duplicate analyses differing by more than 7‰ absolute or 1% relative (whichever is
greater) then the analysis was repeated.
(c) Quality control during kinetic analysis - Outlier identification: Since the model requires a logarithmic
relationship between normalised mass spectrometric data and time for both the 2H and the 18O
analytes, visual inspection of the semi-logarithmic plots of the experimental and fitted data were
routinely performed to identify outliers.
(d) Investigation of quotient and product plots: Short-term fluctuations in water turnover produce
covariant deviations from the model for the 2H and 18O. One of the advantages of the transformations
described is that this covariance can be observed visually. If severely non-covariant data were
observed then the samples were re-analysed.
Precision of the estimates of TEE.
With the procedures described the precision (calculated as described by Cole and Coward1 is
expected to be of the order of 5% (coefficient of variation). The method allows an individual estimate
of the precision of the DLW method to be obtained for each subject, for use in subsequent analysis.
Supplementary calculations
Total energy expenditure (TEE) is highly dependent on age and on the level of physical activity. It
can be considered to have two contributing terms: the basal metabolic rate (BMR), which is the
energy requirement to maintain life, and the energy, expended in activity (AEE). The BMR is
calculated from predictive equations3, according to the equations outlined in Table 3B.
Table 3B Equations used to calculate BMR
Age (years) Sex BMR MJ/d
3 – 10 Male 0.082W+0.545H+1.736
Female 0.071W+0.677H+1.553
10 – 18 Male 0.068W+0.574H+2.157
Female 0.035W+1.948H+0.837
18 – 30 Male 0.063W-0.042H+2.953
Female 0.057W+1.184H+0.411
30 – 60 Male 0.063W-0.042H+2.953
Female 0.034W+0.006H+3.530
60+ Male 0.038W+4.068H-3.491
Female 0.033W+1.917H+0.074
W is the subject’s weight (kg), and H height (m).
26
3.5 Dietary data collection
3.5.1 24-hour recall
Respondents in the 24-hour recall sample were asked by the interviewers to recall their food and
drink consumption over four non-consecutive 24-hour periods. The day before the first individual CAPI
interview was selected as the first ‘recall day’. Following that, the laptop randomly selected one day in
the week as the second, third and fourth ‘recall day’ ensuring that both weekend days had been
selected. Each of the four days was at least two days apart.
Interviewers were permitted to substitute days if necessary. The preferred type of flexibility was to
allocate as substitute the same day of the week as originally allocated, but one week later. At the very
least, if a non-weekend day had to be missed, another non-weekend day was substituted, and if a
weekend day was missed, another weekend day was substituted. If a CU contained two respondents,
both were assigned the same four recall days.
The 24-hour recall method used was the ‘triple pass’ method. Initially, respondents were asked to
provide a ‘quick list’ (first pass) of all the items that they ate or drank on the previous day (midnight to
midnight). This was done without interruption from the interviewer. Next the interviewer went through
the ‘quick list’ gathering details to identify fully each item of food and drink and to quantify the amount
consumed (second pass). Respondents (adults and children) could describe portion sizes using a) the
Photographic Atlas of Food Portion Sizes4 (‘the food atlas’), b) household measures when no
reference photograph was available in the food atlas or c) weights taken directly from packets (e.g.
yoghurts, confectionery, other convenience foods). The food atlas involved the respondent selecting
one of, on average, eight different portion sizes of an identical or a similar food to the one consumed.
Respondents were also asked separately about any leftovers. A ‘third pass’ consisted of the
interviewer probing for additional foods consumed at each occasion mentioned, as well as between
occasions. Each recall took approximately 35 minutes to complete.
For consistency, all interviewers followed a standard protocol telling them exactly what to say, the
order in which the recall should be carried out and when to refer to other materials such as
showcards.
Recalls for children aged 12 and under were conducted with the parent/carer responding as
necessary on the child’s behalf unless the child was able to provide the information for themselves.
Interviewers were permitted to conduct the third recall over the telephone if they felt it was appropriate
to do so. Telephone recalls were conducted in 31% of cases. Respondents aged 65 and over were
less likely to have a telephone recall.
27
Finally, interviewers completed a feedback questionnaire as soon as possible after each 24-hour
recall interview. This provided an indication of how complete or accurate they considered the
information given by the respondent to be.
3.5.2 Unweighed food intake diary
Respondents in the diary sample were asked to keep a record of all they ate or drank over a
consecutive four-day period including both weekend days. The laptop selected the four consecutive
days. If a CU contained two respondents, both respondents were assigned the same diary days.
Interviewers placed the diary with the respondent and then collected it as soon as possible after the
four-day dietary recording period had finished.
When placing the diary interviewers followed written instructions on how to explain it to the
respondent. Interviewers went through the different sections of the diary including an instruction page,
information on how respondents should describe their food and drink and how much they consumed,
and a completed example day. The information provided for the respondent covered a range of
different types of food and various descriptions of portion size. The diary provided photographs of 15
frequently consumed foods as small, medium and large portion sizes which respondents could use for
identical or similar foods. Otherwise they were asked to record portion sizes in household measures.
For packaged foods that were consumed as such, respondents were instructed to note the weight
consumed in the diary (e.g. yoghurts, confectionery, ready meals). Respondents were also asked to
collect the food label information/wrappers for any unusual foods and ready meals consumed to help
coders identify or clarify food and drink consumed.
Two versions of the diary were provided: an A5 diary for adults and a larger A4 diary for children. The
examples given for how to record food and drink were appropriate for age. For children aged 12
years and under, the parent/carer was asked to complete the four-day diary with help from the child
as appropriate. If necessary, additional detail and information was obtained from the MFP (if they
were not completing the diary on behalf of the child). Children over 12 years were asked to complete
the diary themselves but interviewers were expected to confirm details, where necessary, with the
MFP.
Respondents were asked to record food and drink consumed at home and away from home (e.g.
restaurant, friend’s house and school). Therefore, they were expected to take their diary with them
when they are away from home. For young children this meant another adult such as a teacher or
friend’s parent completing the diary for the child. The diary was collected at the second visit no later
than three days after the last diary day. Interviewers were instructed to review the diary with the
respondent present to identify and edit (in green pen) possible omissions and missing detail. An
interviewer checklist for guidance was provided.
28
As for the 24-hour recall, interviewers were asked to complete feedback on each diary, as soon as
possible after collecting it, to record how complete or accurate they felt the information recorded by
the respondent was.
3.6 Dietary data processing
3.6.1 DINO – Dietary assessment system for NDNS data processing
Data from the 24-hour recalls and diaries was entered into a modified version of HNR’s dietary
assessment system DINO (Diet In Nutrients Out).2 DINO, written in Microsoft Access, is an all-in-one
dietary recording and analysis system. Foods, food groups, and respective nutrient values were
imported from the Agency’s nutrient databank to ensure consistency (see section 3.6.3).
Within the DINO analysis program, total available carbohydrate has been calculated as starch plus
free sugars (glucose, fructose, sucrose, maltose and lactose) all expressed as monosaccharides.
Energy from carbohydrate was calculated as monosaccharide equivalents (grams) *3.75 kilocalories
and monosaccharide equivalents (grams)*16 kilojoules. In the Agency’s nutrient databank, total
sugars includes other sugars that are not generally considered to be available; these were therefore
subtracted from total sugars to arrive at a value for free sugars that was added to the value for the
starch as described above.
DINO holds a table of respondents containing the respondent serial number, date of birth and sex,
prided by NatCen. When coding a diet, the coder was required to enter these details, which were
validated against these data. This requirement prevented accidental input of diet against a wrong
respondent.
Where a respondent consumed a homemade recipe each individual food was flagged with the food
group of the recipe. DINO has the capability to report on these foods both at the recipe level and food
level, which will facilitate a clearer picture of consumption of components like meat, fish and
vegetables. This approach means that it has been possible to reduce the number of foods in the
nutrient databank by more than 4000, as it no longer needs to hold numerous variations of the same
dish. Having fewer food codes has improved coding efficiency and consistency.
3.6.2 Coding and editing
Summary of coding
The 24-hour recall booklets and diaries were returned by the interviewers to NatCen’s Operations
Department. The data entry was carried out by NatCen and HNR coders who were all trained by the
study nutritionists. Coders assigned a food code and a portion code from DINO to each item of food
and drink recorded in the 24-hour recall or diary. For composite items, which could be split into their
29
component parts, for example sandwiches, each individual component was assigned a code. Coders
could refer to questions in the diary and information collected from relevant sections of the face-to-
face interview regarding eating habits and food preparation to assist in coding. For the diary only,
wrappers and labels collected by respondents were useful when coding especially for weights of
items. If an item had been recorded and there was no suitable code in DINO or there was insufficient
detail to code the food, it was assigned an “unknown food” code. Coders did not code homemade
recipes or dietary supplements: the nutritionists coded these during the editing stage.
Within DINO, each food code was linked to appropriate portion size descriptors for that food, which
were then linked to the correct weight for that particular food. These descriptors were mainly
household measures (e.g. small portion, large glass, tablespoon). The option of coding a food
consumed as small, medium or large portion was based on the Agency’s reference book on Food
Portion Sizes (3rd edition)5. In addition, where portion size was described as a weight, the weight
could be entered directly in grams. However, for the 24-hour recall, there were no descriptors in DINO
corresponding to the eight photographs in the food atlas. Therefore, for data entry and method
comparison purposes (24-hour recall versus diary), these were either entered as weights or
categorised into small (photos 1 and 2), medium (photos 3 to 5) or large (photos 6 to 8) and entered
as such.
Additional information was entered for each food and drink item, such as food packaging, the place
where the food was consumed and with whom the food was consumed. Coders could flag any entry
so that it would be checked by the study nutritionists. After entering a diet record, coders could make
a comment on the overall quality and completeness of the recall or diary.
Food queries: type and rate by method
For a proportion of 24-hour recalls (33%) and diaries (35%), all of the entries flagged by coders were
categorised by the study nutritionists into eight query types and a record kept of the number of each
type for each of the two methods. The eight categories were:
A Food code not available in DINO.
B portion code not available in DINO.
C Food is a recipe (all recipes were entered by the nutritionists).
D missing/insufficient detail to code food: included foods eaten away from home where the
respondent wouldn't always be able to provide adequate detail.
E missing/insufficient detail to code portion.
F check requested by coder/nutritionist: included any food or portion that the coder was unsure about
that did not fall into categories A-E and where the nutritionists wished to manually QC the entry
(which was the case for a number of pictures in the Food Atlas).
G packaging.
H other: included queries related to non-nutrition fields such as place.
30
Overall, the average number of queries per respondent was very similar for both methods: 20.2 for the
24-hour recall and 19.6 for the diary. As shown in Table 3C, insufficient detail to code the food was
the most common query raised by coders for both methods, accounting for 30% of all queries for the
24-hour recall and 39% for the diary. However, no distinction was made between those foods where
details had not been recorded either by the interviewer or the respondent and where details may not
have been known (often the case when foods were consumed outside of the home). For the 24-hour
recall, the second highest proportion of queries was raised as a result of checks requested by the
nutritionists or the coders: 23% compared with only 7% for the diary. This was mainly because of the
checks needed when certain pictures in the Food Atlas were used. Insufficient detail to code the
portion made up 16-23% of all queries for both methods. Initial concerns that interviewers and
respondents would find describing packaging daunting and difficult meant that queries relating to
packaging warranted their own group. In the end, packaging queries accounted for only 1-2% of the
total. However, 16% of all food items coded were missing a packaging code because packaging type
was not specified by the interviewer in the 24-hour recall or the respondent in the diary. This was
particularly the case for the diary where 21% of all food items were missing a corresponding
packaging code.
31
Table 3C Type of query raised by coders, by dietary method
Query type 24-hour recall Diary
Food code not available Average number per respondent 2.0 2.1
% of all queries 10 11
Portion code not available Average number per respondent 1.9 1.9
% of all queries 10 10
Recipe Average number per respondent 1.4 1.3
% of all queries 7 6
Insufficient detail to code food Average number per respondent 6.0 7.6
% of all queries 30 39
Insufficient detail to code portion Average number per respondent 3.3 4.4
% of all queries 16 23
Check requested by
coder/nutritionist
Average number per respondent 4.7 1.4
% of all queries 23 7
Packaging Average number per respondent 0.3 0.4
% of all queries 1 2
Other Average number per respondent 0.8 0.5
% of all queries 4 3
Base 352 377
Editing and dealing with missing data
After data entry, the 24-hour recalls and diaries were passed onto the study nutritionists. The
nutritionists assigned appropriate codes for all flagged food and portion codes and checked any other
queries raised by the coders.
In general, where pertinent details for the coding of foods were missing, formally agreed default codes
were used by the study nutritionists. For example, milk in tea or coffee in a café or lasagne eaten at a
restaurant. Where portion sizes were missing, an estimate was made using (in order of preference)
the same weight if the food was consumed on another dietary day, or a portion size consistent with
32
the respondent’s usual consumption e.g. small, medium or large or an age-appropriate average
portion.
For new products not in DINO, the nutritionists visited supermarkets or contacted the manufacturer to
obtain information on nutrient content in order to decide whether a new food code was needed. This
decision was based on nutritional composition compared to that of existing codes and the frequency
of consumption and was made with advice from the Agency. If a new food code was required, the
nutrient content was entered into the databank (see section 3.6.3). If a portion was used but there
was no corresponding portion code on DINO, a new portion code was created using either a weight
from an equivalent food, or the food item was weighed and the weight entered into DINO for future
use.
For homemade dishes where a recipe had been recorded, the ingredients were entered individually using
the appropriate cooked food code. Furthermore, each individual food code that made up a recipe was
allocated a recipe food group. The weight of each cooked ingredient was calculated using the raw
weights recorded by the respondent, a weight loss for the whole dish (from a comparable recipe in
McCance and Widdowson’s The Composition of Foods series6-16 and the weight of the portion
consumed. Where the food was stated as homemade but there was no recipe given, a standard
homemade recipe food code was chosen.
In cases where the interviewer had recorded a missing meal or there was inadequate detail to code a
large part of the day’s intake, the whole day was deleted and analysis was carried out using the three
remaining dietary days.
Coding error rate
At the start of coding process, the nutritionists checked two entire 24-hour recalls and two diaries for
each coder and gave them individual feedback on the standard of their work. For a random 10% of all
diet records (5% for each method) the nutritionists undertook a further 100% full check of all food and
portion code entries. This ensured that error rates were contained for all the coders working on the
project and helped identify any coding issues.
3.6.3 NDNS databank modifications and additions
Intakes of nutrients were calculated from the records of food consumption using a specially adapted
nutrient databank. The nutrient databank was originally developed for the Ministry of Agriculture,
Fisheries and Food (MAFF) for the Dietary and Nutritional Survey of British Adults17. It was updated
for the National Diet and Nutrition Surveys of children aged 1½-4½ years18, people aged 65 years and
over19, and young people aged 4-18 years20. Further revisions and updates were carried out by the
Agency for the NDNS Survey of adults aged 19-64 years21 and for LIDNS22.
33
The nutrient databank was revised again by the Agency for the comparison study with many nutrient
values updated and some new codes added to accommodate new products that had become
available as well as additional standard homemade recipes. Specific food groups that were revised
included; bread, breakfast cereals, sausages, bacon and ham, cheese, baked beans, savoury snacks,
fast foods, ready meals, fish based products, potato products, sauces, canned pasta, flours and
grains. The databank now contains over 4000 foods and drinks, including manufactured products,
homemade recipe dishes and dietary supplements. Each food on the databank has values assigned
for 54 nutrients and energy (see below). Some foods have additional values for niacin, tryptophan/60
and selenium. The nutrient values assigned to the foods in the databank are based on data from the
Agency’s rolling programme of nutrient analysis of foods, which are also incorporated into McCance
and Widdowson’s The Composition of Foods series. Data obtained from food manufacturers were
also used in the databank, as was nutritional information given on labels. All data were carefully
evaluated before being incorporated into the databank.
In order to calculate the nutrient intakes from consumption data it is important that there are no
missing values on the databank. For some foods reliable information was not available for all
nutrients. Therefore it was necessary to estimate nutrient values for such foods by referring to similar
foods. For homemade dishes and manufactured products where no nutrient data were available,
nutrients were calculated from their constituents using a computer recipe program that allows
adjustments to be made for weight and vitamin losses on cooking.
The nutrients included in the analysis for this report and their units are given in table 3D.
Table 3D Nutrients used in report and their units
Nutrient Units
Energy kJ (17 x protein) + (37 x fat) + (16 x carbohydrate) + (29 x alcohol) 1
Energy kcal (4 x protein) + (9 x fat) + (3.75 x carbohydrate) + (7 x alcohol) 1
Carbohydrate g (sum of sugars plus starch, expressed as monosaccharide
equivalents) 1 and as % energy
Total sugars g (total sugars, expressed as monosaccharide equivalents) and as
% energy
Non-milk extrinsic sugars g (includes all sugars in fruit juices, table sugar, honey, sucrose,
glucose and glucose syrups added to food + 50% of the sugars in
canned, stewed, dried or preserved fruits) and as % energy
Fat g and as % energy
Protein g and as % energy
Non-starch polysaccharides
(NSP)
g (expressed as Englyst method)23,24
Alcohol g and as % energy
34
Calcium mg
Iron mg
Folate g
Vitamin C mg
1 In the databank, carbohydrate is calculated as the sum of free sugars (glucose, fructose, sucrose, maltose and lactose) and other sugars such as oligosaccharides plus starch. In this analysis, total available carbohydrate was calculated as starch plus glucose, fructose, sucrose, maltose and lactose only and did NOT include oligosaccharides. Energy from carbohydrate was calculated using the values for total available carbohydrate (see section 3.6.1)
3.7 Dietary feedback to respondents
Providing dietary feedback to respondents was considered a potential incentive for people to
participate and would therefore improve survey response rate. The aim was to provide results for
each respondent for selected nutrients and to compare these to the UK guidelines for nutrient intake.
It was acknowledged that it was not appropriate for the feedback to provide individually tailored
dietary advice, but directions to useful websites for healthy eating advice were provided.
3.7.1 Format of feedback
Feedback was provided within three to four months of participation in the study so that it was relevant
and would retain credibility as an incentive to take part. The format and content of the feedback itself
was therefore determined by the type of data that could practically be provided within three months. In
terms of data processing this limited the data available for feedback to information on nutrient intake
rather than types of foods consumed or their contribution to nutrient intake.
In deciding on the format and content of the feedback the following considerations were also taken
into account:
• Selection of nutrients that were likely to be of interest to respondents
• Format of presentation that could be automated and produced within the three-month time frame
• Graphical presentation of results that could be understood by a layperson
• Provision of additional information about a healthy diet that would be of interest to respondents
Every respondent was given the opportunity to request feedback on their reported diet. Three
different mail merge feedback templates were used depending on the age of the respondent. Each
template was tailored to the age ranges 4-10 years, 11-15 years and 16+ years. The feedback letter
informed the respondent about the intake of selected nutrients for the dietary informant provided, the
UK guideline and the range of intake for that nutrient, generally the Dietary Reference Value ( DRV)
derived from the Department of Health ( COMA) report on Dietary Reference Values for food energy
and nutrients for the United Kingdom25, and the range of intake observed in previous NDNS, the
particular survey use depending on the age of respondent. The following nutrients were selected for
feedback:
• Fat intake as % total energy
35
• Saturated fat as % total energy
• NMES as % total energy
• Non Starch Polysaccharide (NSP) g
• Vitamin C mg
• Folate μg
• Calcium mg
• Iron mg
• Energy intake kcal
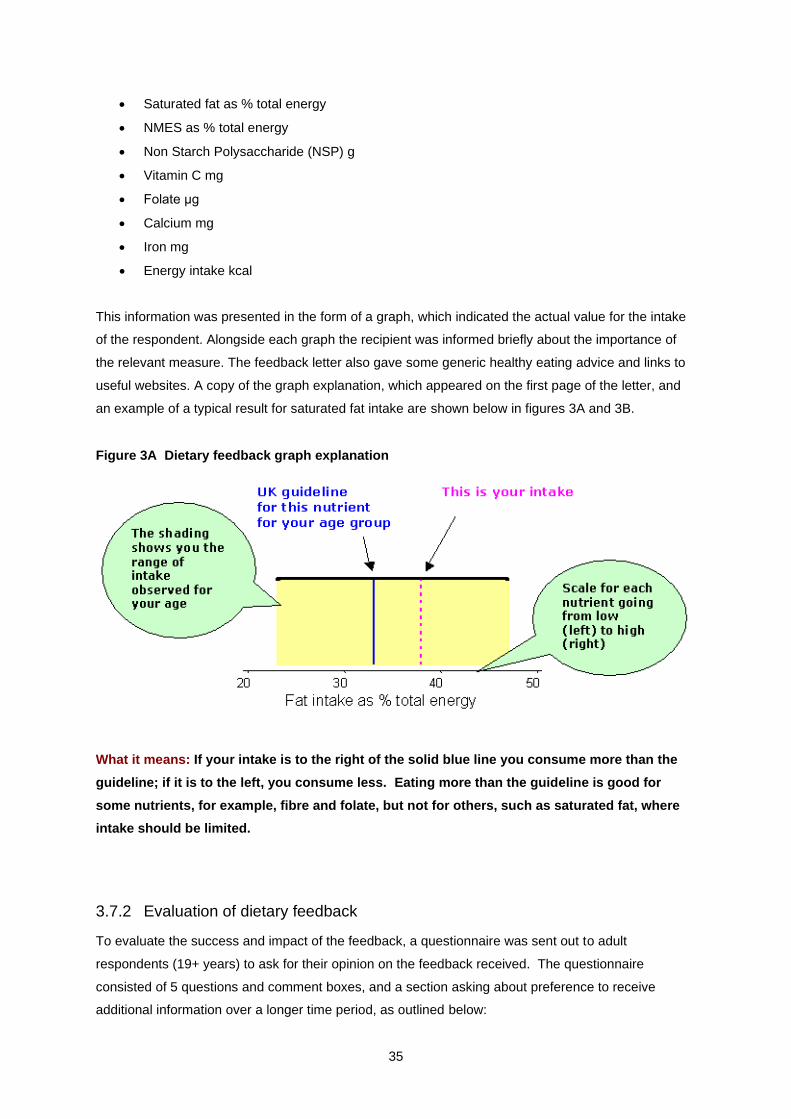
This information was presented in the form of a graph, which indicated the actual value for the intake
of the respondent. Alongside each graph the recipient was informed briefly about the importance of
the relevant measure. The feedback letter also gave some generic healthy eating advice and links to
useful websites. A copy of the graph explanation, which appeared on the first page of the letter, and
an example of a typical result for saturated fat intake are shown below in figures 3A and 3B.
Figure 3A Dietary feedback graph explanation
What it means: If your intake is to the right of the solid blue line you consume more than the
guideline; if it is to the left, you consume less. Eating more than the guideline is good for
some nutrients, for example, fibre and folate, but not for others, such as saturated fat, where
intake should be limited.
3.7.2 Evaluation of dietary feedback
To evaluate the success and impact of the feedback, a questionnaire was sent out to adult
respondents (19+ years) to ask for their opinion on the feedback received. The questionnaire
consisted of 5 questions and comment boxes, and a section asking about preference to receive
additional information over a longer time period, as outlined below:
36
1. Do you think that the graphs showing your results compared with UK guidelines for the
population are easy to understand?
2. Do you think comparing your results with UK guidelines is useful?
3. Is there any other information about your diet you would like to receive?
4. Would you be interested in a web page for NDNS participants that lists more information
about the survey (for example results as they emerge), updates on what the nation consumes
and nutrition information and advice?
5. Some additional information we could provide would take longer to produce e.g. The number
of portions of fruit and vegetable you consume
a. I would like to receive more information about my diet even if I have to wait
up to 12 months to receive it.
b. I am happy with the information provided which I receive within three months
after completion of the dietary assessment.
3.8 Statistical Analyses
Unless otherwise stated, all analyses were carried out by the following standard break variables:
• Dietary method (24-hour recall, diary)
• Sex (male, female)
• Age group (4-10 years, 11-15 years, 16-49 years, 50-64 years, 65+ years)
For the tables showing percentages all percentages are weighted even if the base number was small.
In all the tables, cumulative percentages in the row labelled `All’ are always shown as 100%. The
proportion of cases falling above the upper limit of the previous band can be calculated by subtracting
from 100 the proportion in the previous band. The base numbers are the number of people that
contributed to the calculations and are the number of respondents. The total column may include
cases from small subgroups not shown separately elsewhere on the tables, therefore the individual
column bases may not add to the base in the total column.
The “-“ symbol is used in the tables to signify no people and 0% is used to indicate percentages
smaller than 0.5%.
3.8.1 Weighting
The data for the Comparison Survey required a set of weights to address bias caused by unequal
selection probabilities and non-response; survey estimates from unweighted data are likely to be
biased. The aim was to provide a set of weights that would allow researchers to compare the
weighted survey estimates for each dietary collection method.
37
Two weights were produced, one for all analyses at household level and one for all analyses at
individual level. The individual level weight was also be used for analyses of the DLW and actigraph
data. Unless otherwise stated, all proportions and means presented in the tables in this report are
taken from weighted data.
The standard deviations for estimates of mean values are shown in the tables and have been
calculated using the weights and using the information about cluster (primary sampling units) and
stratification. Calculation of the standard deviation was done using the svy command in Stata version
10 and the Taylor-linearized variance estimation option was used.
Further information about the weighting method is provided in Appendix A.
3.8.2 The Mean Energy and Confidence interval tables
84% confidence intervals are calculated for the mean energy in each subgroup. In the absence of
multiplicity correction a pair of 84% confidence intervals that do not overlap is equivalent to a
“significant” difference with the p-value smaller than 0.05. If the number of comparisons made is
greater than 1 then a multiplicity correction is needed in any interpretation.
3.8.3 Bland-Altman Plots
Bland-Altman plots are used when comparing a test measurement against a gold standard
measurement. The difference between measurements were plotted against the average of the pairs
of measurements, 95% agreement limits were calculated using the variance of the paired differences.
The plots contained the mean bias which was calculated as the average difference between the pairs
of measurements.
38
1 The person in the CU with the main responsibility for shopping and preparing food. If these tasks are equally shared between two people, for example if one person does all the shopping and another person does all the cooking then either resident can be classified as the MFP.
39
4 Response rates and profile of respondents
4.1 Response rates
4.1.1 Introduction
The issued sample for the comparison study consisted of 1,840 addresses. The target response rate
for the study was for 55% of individuals in eligible CUs to complete three or four dietary days. This
chapter describes the response rates achieved in the comparison survey, overall and by dietary
method. It also describes response rates achieved for each dietary method by age group and sex.
Response rates are based on unweighted data.
An account of the response in the comparison study was provided in a response rate report submitted
to the Agency in August 2007. This earlier report was based on preliminary data; the response rates
in this report are based on edited data.
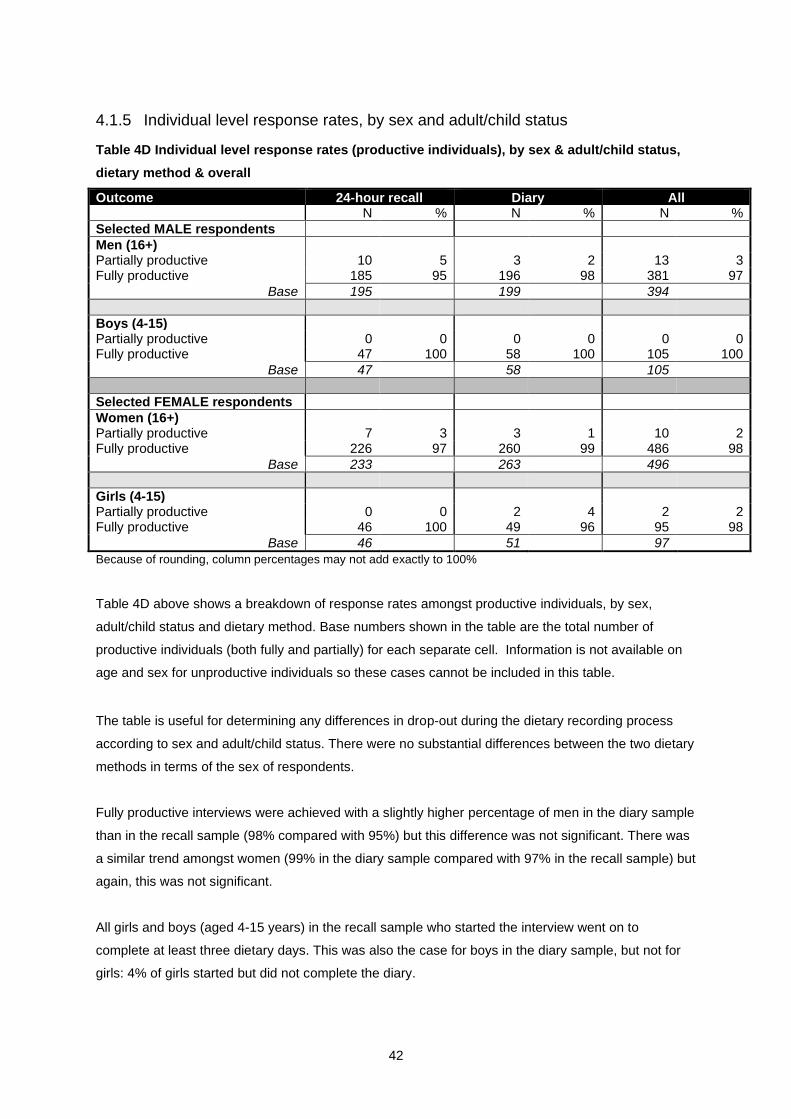
4.1.2 Summary response rates
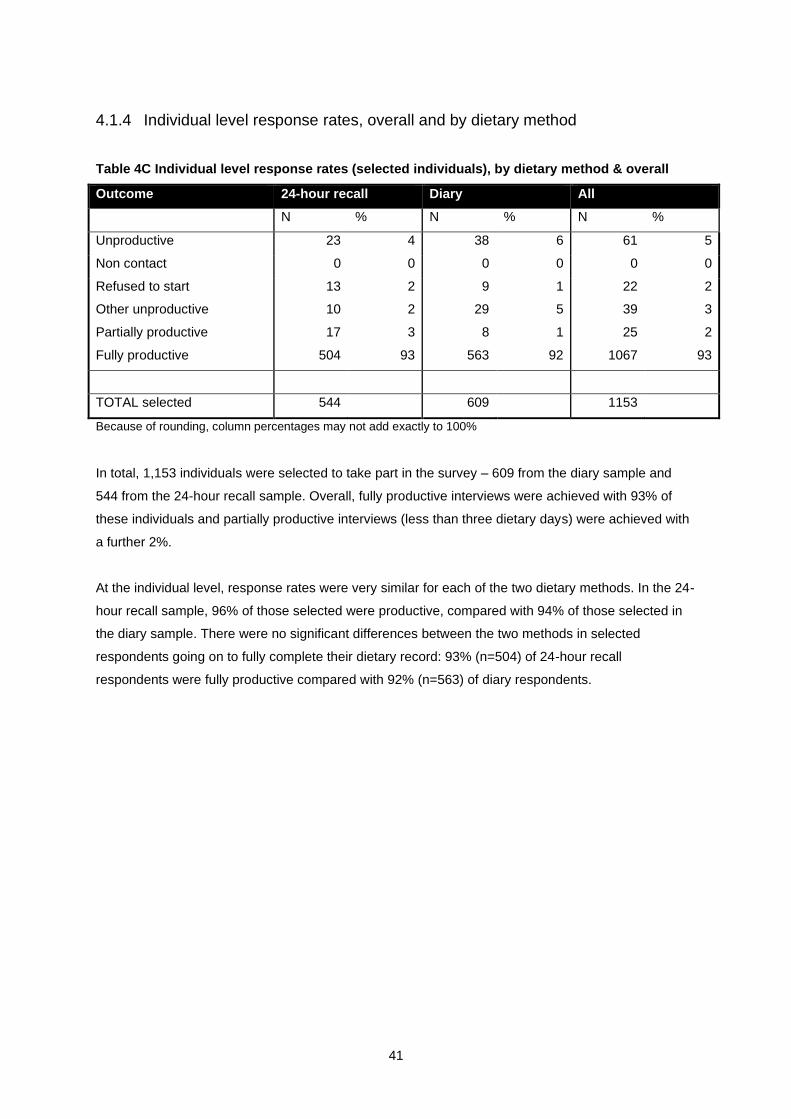
Table 4A Summary of achieved response rates, by dietary method & overall
Outcome 24-hour recall Diary All By stage Overall By stage Overall By stage Overall
% % % % % %
Catering Units (CUs) Eligible for CU selection (non-deadwood)
86 88 87
CU selected 86 74 88 77 87 75 Productive CUs (fully and partially)
the mean 0.74 0.78 0.77 1.08 0.41 0.49 0.53 0.66 0.67 0.30
Weighted Bases
Men 59 54 48 25 185 56 54 49 38 196
Women 53 52 48 38 191 56 66 51 42 215
* Aged 19 and over with both valid height and weight measurements
48
5 Results
5.1 Summary of interviewer and coder feedback
5.1.1 Summary of feedback
All interviewers and NatCen’s data coders were asked for their feedback on the two methods tested in
the comparison study.
All interviewers were asked to complete a questionnaire asking specifically about their experience of
each method and their perception of the respondents’ experience of the method allocated to them. In
addition, eight interviewers attended a full-day personal debrief. The debrief interviewers were
selected on the basis that they had gained good experience in both dietary methods. Further, these
interviewers had also worked in different types of area across England and Scotland including market
towns, urban areas, affluent and poorer areas.
All seven NatCen coders working on the comparison study attended a personal debrief lasting half a
day. Three of the coders had previously worked on LIDNS and so were very experienced in food
coding from 24-hour recalls although none of them had used the DINO program before.
Feedback on the 24-hour recall
The restrictive work pattern and burden was a key concern for the majority of interviewers. A
particular complaint concerned the need to make Sunday visits to recall consumption for the previous
day (Saturday). Interviewers commented that four visits could be daunting even for the most
committed respondent and that both respondents and interviewers found the visits incredibly time-
consuming and difficult to organise due to work and other commitments. Some interviewers felt this
reflected on the accuracy of the information, as respondents were eager for the recall to end. Some
drop-outs, particularly among those with busy or chaotic lifestyles, were attributed to the time-
commitment needed for the recalls.
Feedback on the diary
The main area of concern for the interviewers was respondents not fully grasping what was required
of them. It was also difficult to tell when placing the diary which respondents were likely to have
problems, and at the collection stage, it was too late. The format of the diaries was also problematic:
the adult diary had too small print and the child diary couldn’t easily be folded to put in a school bag
etc. Food labels and wrappers could be very useful when it came to coding. However, whilst some
49
respondents collected all their labels, even for the most basic foods, most did not collect any labels,
or, more frustratingly, cut off and discarded relevant details such as the nutritional information.
General comments
Some interviewers commented that respondents often found it hard to judge portion sizes regardless
of the dietary assessment method being used. This was particularly the case at parties, barbecues
and buffets. Other issues common to both methods were large gaps in information when foods were
consumed outside the home (especially school meals), children seeming to think they had eaten one
thing and their parents indicating something different and filling in the packaging information
(interviewers said they were often unsure about which packaging choice to record and therefore had
to guess).
Coders felt it was rare that there was enough information to sufficiently code the foods consumed and
this was the case with both methods. This is reflected in the query rate (see section 5.6.1). All coders
agreed that as long as the quality of recording was good, the method was almost irrelevant.
5.1.2 Modifications for the mainstage
As a result of the feedback received, several improvements have been made to the diaries
themselves, along with the introduction of supporting documents. There have also been changes to
the way the diaries are placed and checked and how the interviewers are trained.
At diary placement, respondents will be asked to fill in one recent eating occasion, ideally a main
meal, as a practice so that the level of detail required becomes clear and difficulties the respondent
might have can be identified. The A5 adult diary has been redesigned, increasing the size of the text,
and a larger A4 version made available for those adults who may experience difficulties with the
smaller diary. A separate instruction booklet allows easier reference to the instructions, description
prompts and examples whilst recording intake in the diary. For the A4 child version, the cardboard
cover has been removed so that it can fold in half. As the mainstage now includes the toddler age
group (1½ – 3 years old), a new version of the diary has been developed so that appropriate
examples and more guidance on portion sizes can be included. There is also more reliance on out-of-
home carers for this age group, so there is a “Carer pack” which includes a letter informing the
teacher/child-minder/friend’s parent about the child’s participation in the study and a form with space
for them to record any food or drink consumed whilst the child is in their care. All respondents are to
be given a card which shows what is useful in terms of information on wrappers and labels.
More emphasis will be placed at briefings on interviewers understanding the different concepts of
describing portion size (including the appropriate use of pictures of foods from the Food Atlas) and
that they instruct respondents to take into account leftovers especially children and when food is
eaten outside the home. Interviewers will try and obtain school menus so that they can probe for
50
missing detail. Where necessary, the nutritionists will follow up by contacting school caterers for
details on how food is prepared.
The collection of packaging details was considered too burdensome (21% of all food items entered for
the diary were missing a packaging code) and there was concern that detail about foods and portion
sizes would be sacrificed. In addition, packaging type required a separate column which it was felt
would be better used for collecting brand names. Therefore, this element of the data collection has
been dropped for the mainstage.
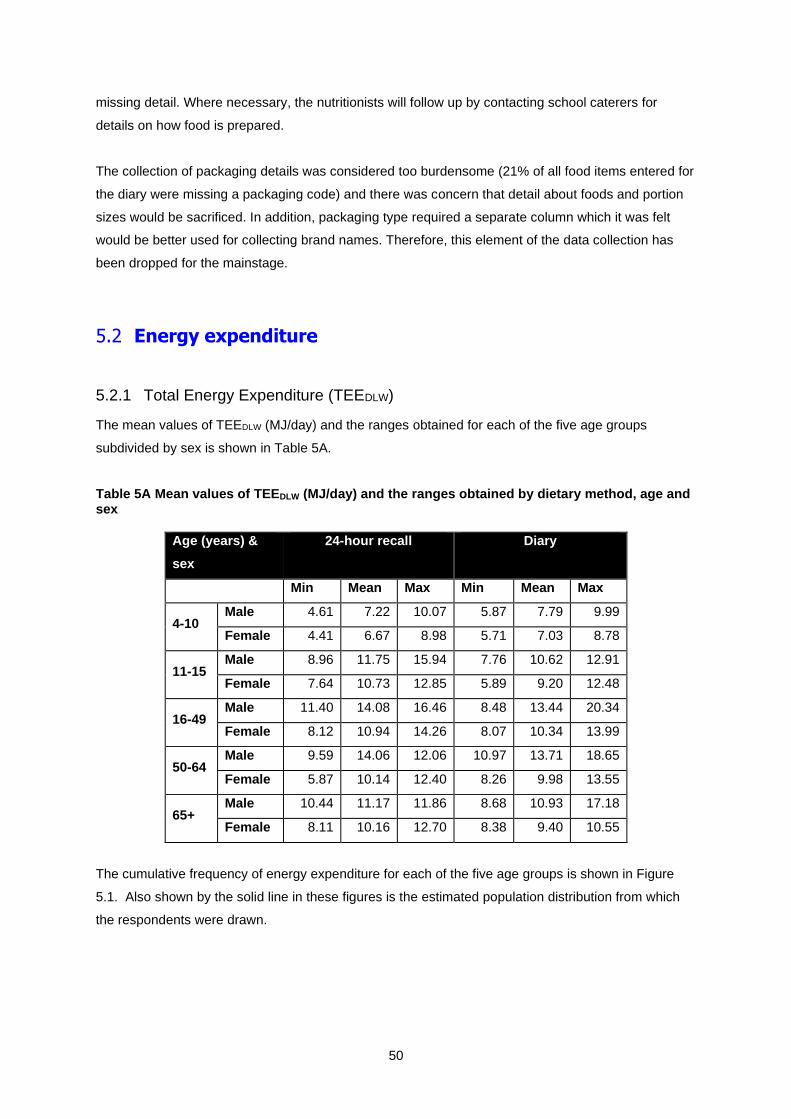
5.2 Energy expenditure
5.2.1 Total Energy Expenditure (TEEDLW)
The mean values of TEEDLW (MJ/day) and the ranges obtained for each of the five age groups
subdivided by sex is shown in Table 5A.
Table 5A Mean values of TEEDLW (MJ/day) and the ranges obtained by dietary method, age and sex
Age (years) &
sex
24-hour recall Diary
Min Mean Max Min Mean Max
4-10 Male 4.61 7.22 10.07 5.87 7.79 9.99
Female 4.41 6.67 8.98 5.71 7.03 8.78
11-15 Male 8.96 11.75 15.94 7.76 10.62 12.91
Female 7.64 10.73 12.85 5.89 9.20 12.48
16-49 Male 11.40 14.08 16.46 8.48 13.44 20.34
Female 8.12 10.94 14.26 8.07 10.34 13.99
50-64 Male 9.59 14.06 12.06 10.97 13.71 18.65
Female 5.87 10.14 12.40 8.26 9.98 13.55
65+ Male 10.44 11.17 11.86 8.68 10.93 17.18
Female 8.11 10.16 12.70 8.38 9.40 10.55
The cumulative frequency of energy expenditure for each of the five age groups is shown in Figure
5.1. Also shown by the solid line in these figures is the estimated population distribution from which
the respondents were drawn.
51
Figure 5.1 Cumulative frequency of TEE by dietary method, age and sex
52
5.3 Dietary feedback to respondents
Overall, 923 of the 1067 fully productive respondents (86%) requested dietary feedback. The high
uptake of the option to receive feedback is very encouraging and supports the introduction of the
feedback as a permanent feature of the NDNS rolling programme. The questionnaire was sent to
adults only and was returned by 20% of the 706 adults requesting feedback.
53
The completed questionnaires received are summarized in table 5B below. Based on the replies
received we can conclude that:
• the format of the feedback was well understood by respondents,
• approximately two thirds of respondents were satisfied with the information that is provided
within three months of taking part, and
• about half of all respondents were interested in a webpage for participants.
Table 5B Responses to questions in feedback questionnaire
Feedback question Responses
Question Yes %
No %
Not answered
%
1. Do you think that the graphs showing your results compared with UK guidelines for the population are easy to understand?
97 3 0
2. Do you think comparing your results with UK guidelines is useful? 98 2 0
3. Is there any other information about your diet you would like to receive? 26 68 6
5. Would you be interested in a web page for NDNS participants that lists more information about the survey (for example results as they emerge), updates on what the nation consumes and nutrition information and advice?
42 56 2
A %
B %
Not answered
%
4. Some additional information we could provide would take longer to produce e.g. The number of portions of fruit and vegetable you consume. A) I would like to receive more information about my diet even if I have to wait up to 12 months to receive it. B) I am happy with the information provided which I receive within 3 months after completion of the dietary assessment.
32 64 4
Some respondents filled in comments in the space provided and a selection of these is presented
below:
Selected comments to question 3
• “I would like to know how my diet reflects my overall health”
• “Alcohol intake should be included. Indications of ‘too much’ or ‘too little’ warnings”
54
• “The effect of the vitamin tablets I take”
• “Information of calories, fat, sugar, protein etc which is contained in each food”
• “Percentage calories from major food groups – fat, carbohydrate, protein as a pie chart. Number
of portions of fruit and veg, protein foods, carbohydrate foods and dairy foods as in food pyramid.
Information on salt intake, fluid and omega 3”
Selected comments to questions 4 or 5
• “I enjoyed taking part and it has changed my views about food portion sizes. I take more notice
about what I consume and try to take more exercise and drink more water”
• “I have enjoyed taking part in this survey and these results have made me think about my diet and
where I need to make adjustments. It’s been a big help. Thank you!”
• “The survey was a useful examination of diet and helped me realise how poor my diet was. I’ve
since started to exercise twice weekly and tried to improve my diet”
▪ “The survey was very interesting to do and the results well presented easy for anyone to
understand”
▪ “I was very impressed with the info returned and am very appreciative of the extra time put on
to produce this feedback”
▪ “I found this info very informative and useful for adjusting my sons diet. He is taking this info
into school to discuss with his classmates”
55
6 Nutrient intake from foods
6.1 Introduction
In this section, data are presented for the intakes of energy, macronutrients and selected
micronutrients for respondents in the comparison study who reported at least three days of 24-hour
recall or prospective record by estimated diary. Tables can be found here. As indicated in earlier
sections, all dietary data from the entire sample were weighted to compensate for the differential
probabilities of selection and non-response. Since the main purpose of the comparison study was to
determine the intake of energy by each method and the degree of underreporting, statistical analysis
has only been carried out for the results on energy intake. For other nutrients, comments have been
made about the mean intakes for all respondents and for age and sex differences, but these have not
undergone statistical comparisons. It should also been borne in mind that for some age groups, the
small number of individuals surveyed was small. Results have been presented and described in
usual units for each nutrient as outlined in the introduction to each nutrient. They have also been
compared to the Dietary Reference Values (DRVs) and recommended intakes of each nutrient,
expressed in relation to the usual measure used for that nutrient as outlined in the Report of the
Committee on Medical Aspects of Food Policy (COMA) on Dietary Reference Values for Food Energy
and Nutrients for the United Kingdom, published by the Department of Health in 199125. In some
cases, where the COMA report did not outline a recommendation for a nutrient, or for a particular age
group, another guide has been used for comparison and this is described for those nutrients.
Comparison has also been made to previous NDNS reports, to enable the results of the comparison
study to be put into context. Results for all nutrients are presented as the daily intake resulting from
the average of the days recorded.
Results for nutrients have been described for the age and sex groups used in previous NDNS
surveys, to provide continuity and to enable comparisons to be made with past surveys. For example,
there is no grouping of 16-34 years from any previous survey and hence 19-34 years was used.
6.2 Energy
6.2.1 Introduction
This section outlines intakes of energy, expressed both in MJ and kcal for the two dietary methods
compared. Previous NDNS reports have also provided data on intakes of food energy alone (without
alcohol) but this has not been done for the comparison study. Results have also been compared to
4. Nelson M, Atkinson M, Meyer J. (2002) A photographic atlas of food portion sizes.
London: Food Standards Agency.
5. Food Standards Agency (2008) Food portion sizes. Third edition. London: The
Stationery Office.
6. Chan W, Brown J & Buss DH (1994) Miscellaneous foods. Fourth supplement to the
fifth edition of McCance and Widdowson's The Composition of Foods. London: Royal
Society of Chemistry/Ministry of Agriculture, Fisheries and Food.
7. Chan W, Brown J, Church SM & Buss DH (1996) Meat products and dishes. .Sixth
supplement to the fifth edition of McCance and Widdowson's The Composition of
Foods. London: Royal Society of Chemistry/Ministry of Agriculture, Fisheries and
Food.
8. Chan W, Brown J, Lee SM & Buss DH (1995) Meat, poultry and game. Fifth
supplement to the fifth edition of McCance and Widdowson's The Composition of
Foods. London: Royal Society of Chemistry/Ministry of Agriculture, Fisheries and
Food.
9. Food Standards Agency (2002) McCance and Widdowson's The Composition of
Foods, Sixth summary edition. Cambridge: Royal Society of Chemistry.
10. Holland B, Unwin ID & Buss DH (1988) Cereals and Cereal Products. Third
supplement to McCance and Widdowson's The Composition of Foods. London: Royal
Society of Chemistry/Ministry of Agriculture, Fisheries and Food.
11. Holland B, Unwin ID, & Buss DH (1989) Milk products and eggs. Fourth supplement
to McCance and Widdowson's The Composition of Foods. London: Royal Society of
Chemistry/Ministry of Agriculture, Fisheries and Food.
12. Holland B, Unwin ID & Buss DH (1991) Vegetables, Herbs and Spices. Fifth
supplement to the fourth edition of McCance and Widdowson's The Composition of
Foods. London: Royal Society of Chemistry/Ministry of Agriculture, Fisheries and
Food.
113
13. Holland B, Unwin ID & Buss DH (1992) Fruit and Nuts. Fifth supplement to the fifth
edition of McCance and Widdowson's The Composition of Foods. London: Royal
Society of Chemistry/Ministry of Agriculture, Fisheries and Food.
14. Holland B, Welch A & Buss DH (1992) Vegetable dishes. Second supplement to the
fifth edition of McCance and Widdowson's The Composition of Foods. London: Royal
Society of Chemistry/Ministry of Agriculture, Fisheries and Food.
15. Holland B, Brown J, & Buss DH (1993) Fish and Fish products. Third supplement to
the fifth edition of McCance and Widdowson's The Composition of Foods. London:
Royal Society of Chemistry/Ministry of Agriculture, Fisheries and Food.
16. Ministry of Agriculture, Fisheries and Food (1998) Fatty acids. Seventh supplement to
the fifth edition of McCance and Widdowson's The Composition of Foods. London:
Royal Society of Chemistry/Ministry of Agriculture, Fisheries and Food.
17. Gregory J, Foster K, Tyler H, Wiseman M. Dietary and Nutritional Survey of British
Adults. London: HMSO, 1990.
18. Gregory JR, Collins DL, Davies PSW, Hughes JM, Clarke PC. National Diet and
Nutrition Survey: children aged 1.5 to 4.5 years. Volume 1: Report of the diet and
nutrition survey. London: HMSO, 1995
19. Finch S, Doyle W, Lowe C, et al. National Diet and Nutrition Survey: People Aged 65
Years and Over. Vol. 1: Report of the Diet and Nutrition Survey. London: The
Stationery Office, 1998.
20. Gregory J, Lowe S, Bates CJ, et al. National Diet and Nutrition Survey: young people
aged 4 to 18 years. Volume 1: Report of the diet and nutrition survey. London: The
Stationery Office, 2000.
21. Henderson L, Gregory J, Irving K, Swan G. The National Diet & Nutrition Survey:
adults aged 19 to 64 years. Volume 2: Energy, protein, carbohydrate, fat and alcohol
intake. London: The Stationery Office, 2003.
22. Nelson M, Erens B, Bates B, Church S, Brosher T. 2007. Low Income Diet and
Nutrition Survey. Food Consumption. Nutrient intake. London, The Stationery
Ofiice.
23. Englyst HN and Cummings JH. An improved method for the measurement of dietary
fibreas the non-starch polysaccharides in plant foods. J Assoc Off Anal Chem
1988;71:808-814.
24. Englyst HN, Quigley ME and Hudson JG. Determination of dietary fiber as nonstarch
polysaccharides with gas-liquid-chromatographic, high performance liquid-
chromatographic or spectrophotometric measurement of constituent sugars. Analyst
1994;119:1497-1509.
25. Department of Health. 1991. Dietary Reference Values for Food Energy and
Nutrients for the United Kingdom. Report of the panel of Dietary Reference Values of
the Committee on Medical Aspects of Food Policy. Report on Health and Social
Subjects 41. HMSO: London.
114
26. Nishida C, Nocito, FM and Mann J. 2007. Joint FAO/WHO Scientific update on
carbohydrates in Human Nutrition. Eur J Clin Nutr 61:Suppl 1 S1-S137.
27. Food and Agriculture Organisation. (1998). Carbohydrates in human nutrition. Report
of the Expert Panel meeting Rome April 1997 Rome. FAO, Rome.
28. IGD. Report of the IGD/PIC Technical Working Group on Guideline Daily Amounts
(GDAs). Review of existing and development of new GDAs: Decisions and
Rationale. June 2005
29. Williams CL. (1995) Importance of dietary fiber in childhood. J Am Diet Assoc.
95:1140-6, 1149.
30. Altman DG. (1991). Practical Statistics for Medical Research. London: Chapman and
Hall.
31. Black AE. (2000) Critical evaluation of energy intake using the Goldberg cut-off for
energy intake: basal metabolic rate. A practical guide to its calculation, use and
limitations. Int J Obes Relat Metab Disord. 24:1119-30
115
Appendix A
A.1 Introduction
The sample was drawn from the ‘small user’ Postcode Address File (PAF), a list of all addresses in
Britain. 1,840 addresses were drawn in two stages; at the first stage 80 Primary Sampling Units1
(PSUs) were drawn with probability proportional to the number of addresses within them. In each
selected PSU 23 addresses were then selected at random.
This design gives each address the same probability of selection and address selection weights are
not needed. Once selected the addresses were each allocated to one of two sub-samples. The
method used to collect dietary data varied according to which sub-sample the address had been
allocated to.
A.2 Weighting scheme
The data was weighted separately by sub-group. In effect each sub-group has been treated as a
separate sample, which has then been weighted back to the population. The weighting design used
here is the design we propose to use for the main stage of the NDNS, hence we are in effect showing
what the weighted estimates would be for each sub-sample had that particular dietary collection
method been used on the main stage NDNS. This allows us to make comparisons between the two
methods. It also removes any differences between the two sub-groups in the age/sex or Government
Office Region (GOR) distributions, which means any differences in the food estimates by sub-group
cannot be attributed to differences in these variables.
Once generated, the weights were then scaled separately so the mean of the weights was equal to 1
and the sum of the weights equalled the number of respondents. This allowed the weights to be
combined to give a set of weights that permit analyses to be carried out on the whole sample. The
different stages of weighting are described in more detail below, the following method was carried out
separately for each sub-group.
A.2.1 Dwelling Unit selection weight
Some addresses contain more than one Dwelling Unit (DU). At each selected address the interviewer
enumerated the number of DUs and selected one at random. A DU selection weight is required to
prevent DUs at addresses containing multiple DUs being under represented in the sample. The DU
weight is equivalent to the number of DUs at the address. Large weights are trimmed to a maximum
value of 3 to avoid inflating standard errors.
116
A.2.2 Household selection weight
Within each selected DU the interviewer counts the number of households and selects one at random.
These households require a selection weight as households in DUs with multiple households will
otherwise be under-represented. The household weight is equivalent to the number of households at
the selected DU. As before large weights will be trimmed to a maximum of three.
The composite household selection weight (w1) is the product of the DU and household selection
weights.
A.2.3 Household non-response weight
Calibration weighting was used to generate weights for the households that participated in the NDNS
Comparison Study. Calibration is used to generate a set of weights that make the distribution of the
(weighted) sample match that of the population for a set of key variables. The achieved household
sample was calibrated so that the distributions for age/sex and GOR of all household members
matched the 2005 mid-year household population estimates2 produced by the Office of National
Statistics and General Register Office for Scotland. Using this method the calibration weight
generated for a particular household depends upon the age/sex profile of the household members
(i.e. the household type) and the Region in which it is situated3.
The aim of the calibration weighting was to reduce non-response bias resulting from differential non-
response at the household level. The calibration weights generated (w2) were re-scaled so that the
sum of the weights equalled the number of participating households in the sub-group. The scaled
weights are the household weights (wt_hhld). Any analyses carried out at household level should be
weighted by wt_hhld. This weight can be used for sub-group comparisons as well as analyses of the
combined sample. The distribution for unweighted and weighted samples and the population is given
in Table A1 below.
A.2.4 Individual selection weight
Within each household/CU one adult aged 19+ and (where applicable) one child aged 4-18 was
selected for the diary/24-hour recalls. Individual selection weights (w3) are needed to prevent
individuals from larger households being under- represented in the sample. Individual selection
weights are equal to the number of eligible individuals in the household. For adults this is the number
of eligible adults aged 19 or over in the household. For children this is the number of eligible children
aged 4-18 in the household. Large weights were trimmed to a maximum of four.
117
A.2.5 Individual non-response
Individuals needed to complete at least three dietary recall/diary days to be counted as fully
responding. Households were counted as responding if at least one selected individual had fully
responded. There were 847 responding households, containing 1,112 selected individuals. Of these,
1,067 individuals (96%) went on to be fully productive respondents. Despite the high level of
participation a further adjustment was made to the responding individuals to ensure the distribution of
the final sample matched the population of persons aged four and older in terms of age, sex and
region. This adjustment takes account of any biases due to natural variation caused by the selection
procedure or non-response. The distribution of the population and sample is given in Table A2.
As before, the sample was calibrated to age/sex and GOR4. The resulting weight was scaled so that
the sum of the weights equalled the number of fully responding individuals in the sub-group. This
weight was used for all analyses at the individual level, sub-group and combined.
A.2.6 DLW/ ActiGraphTM
The DLW/ ActiGraphTM sub-sample is a quota sample to which fully responding individuals were
purposively allocated according to their age, sex and dietary collection method. The sub-sample is
relatively small. Whilst individuals were asked to do both activities, differential response means the
ActiGraphTM sample contains 154 respondents and the DLW sample contains 157. Similarly eligible
respondents replaced those that refused to participate. As such additional non-response weights are
not appropriate for the DLW/ ActiGraphTM sub-sample; the individual weight (wt_ind) was used for
analyses.
In addition to the DLW sample all fully productive11-15 year olds that completed the physical activity
module were also asked to wear an ActiGraphTM. The responding sample of 1,067 individuals
contained 81 eligible 11-15 year olds. Of these 39 (48%) provided complete ActiGraphTM data. This
sub-sample does not necessitate additional non-response weights due to its small size. The individual
weight (wt_ind) was used during analysis of these respondents.
A.3 Effective sample size
The effect of the sample design on the precision of survey estimates is indicated by the effective
sample size (neff). The effective sample size measures the size of an (unweighted) simple random
sample needed to provide the same precision (standard error) as the design being implemented. If the
effective sample size is close to the actual sample size then we have an efficient design with a good
level of precision. The lower the effective sample size is the lower the level of precision. The efficiency
of a sample is given by the ratio of the effective sample size to the actual sample size. Samples that
select one person per household tend to have lower efficiency than samples that select all household
118
members, as do smaller samples. The effective sample size of this sample is 713, with an efficiency
of 67%. The distribution of the weights is given in Table A3.
119
Table A1 Distribution of the Population and all individuals in responding
households by GOR and age/sex
Population Sample (all
individuals
in
responding
households)
Sample (all
individuals in
responding
households)
unweighted weighted by
household
weight
% % %
North East 4.4 5.0 4.4
North West 11.7 11.9 11.7
Yorks and Humber 8.7 9.7 8.7
East Mids 7.4 9.0 7.4
West Mids 9.2 10.6 9.2
East of Eng 9.5 9.3 9.5
London 12.9 10.0 12.9
South East 13.9 13.5 13.9
South West 8.6 9.1 8.6
Wales 5.1 2.5 5.1
Scotland 8.7 9.3 8.7
Male 49.0 48.0 49.0
Female 51.0 52.0 51.0
Male aged 0-10 6.7 7.3 6.7
Male aged 11-18 5.3 6.6 5.3
Male aged 19-29 6.8 4.8 6.9
Male aged 30-39 7.3 6.3 7.3
Male aged 40-49 7.2 7.5 7.2
Male aged 50-59 6.3 6.4 6.3
Male aged 60-69 4.8 4.7 4.8
Male aged 70 + 4.7 4.4 4.7
Female aged 0-10 6.3 8.1 6.3
Female aged 11-18 5.0 5.5 5.0
Female aged 19-29 6.8 5.7 6.8
120
Female aged 30-39 7.5 8.0 7.5
Female aged 40-49 7.4 7.5 7.4
Female aged 50-59 6.5 7.1 6.5
Female aged 60-69 5.1 5.4 5.1
Female aged 70 + 6.4 4.7 6.4
Total (unweighted) 57,406,392 2,024 2,024
121
Table A2 Distribution of the Population and all responding individuals by GOR and age/sex
Population
aged 4+
All individuals
aged 4+ in
responding
households
All responding
individuals
All responding
individuals
Unweighted Weighted by
household
weight
Weighted by
hhold and
trimmed
selection wt
Weighted by
final calibrated
individual
weight
% % % %
North East 4.4 4.5 4.4 4.4
North West 11.7 11.8 11.9 11.7
Yorks and Humber 8.7 8.7 8.9 8.7
East Mids 7.4 7.5 7.8 7.4
West Mids 9.2 9.4 9.7 9.2
East of Eng 9.5 9.6 9.5 9.5
London 12.9 12.5 11.0 12.9
South East 13.9 13.8 14.1 13.9
South West 8.6 8.5 8.6 8.6
Wales 5.1 4.9 5.1 5.1
Scotland 8.8 8.8 9.0 8.7
Male 48.9 48.9 47.0 48.9
Female 51.1 51.1 53.0 51.1
Male aged 4-10 4.5 4.3 4.8 4.5
Male aged 11-18 5.5 5.6 5.6 5.5
Male aged 19-29 7.2 7.2 6.5 7.2
Male aged 30-39 7.7 7.7 7.4 7.7
Male aged 40-49 7.5 7.6 6.6 7.5
Male aged 50-59 6.6 6.6 6.5 6.6
Male aged 60-69 5.0 5.0 5.2 5.0
Male aged 70+ 4.9 4.9 4.2 4.9
Female aged 4-10 4.3 4.1 3.7 4.3
Female aged 11-18 5.3 5.3 4.8 5.3
Female aged 19-29 7.2 7.2 6.2 7.2
Female aged 30-39 7.8 7.9 8.1 7.8
Female aged 40-49 7.7 7.8 9.2 7.7
Female aged 50-59 6.8 6.8 7.2 6.8
122
Female aged 60-69 5.3 5.3 6.2 5.3
Female aged 70+ 6.7 6.7 7.4 6.7
Total (unweighted) 54,734,928 1,112 1,067 1,067
Table A3 Distribution of the weights
Minimum
weight
Maximum
weight
Mean
weight
Actual
sample
size
Effective
sample
size
Efficiency
Final calibrated
individual weight (wt_ind)
0.10 10.17 1.00 1067 713 67%
Household and individual
selection weight
0.11 8.90 1.00 1067 733 69%
Household weight
(wt_hld)
0.18 3.62 1.00 847 704 83%
123
1 PSUs are postcode sectors or groups of postcode sectors. 2 Unable to use 2006 as data for Scotland is not yet available.
124
3 The weights are generated in SAS using a package called CALMAR. The procedure works by taking an initial weight (in this instance the composite CU selection weights (w1)) and adjusting it to produce a final weight that makes the weighted distribution of the sample match the
125
population. The criteria for the adjustment is that the initial and final weight be as close as possible.
126
4 The starting weight was the product of the household weight and the individual selection weight: wt_hhld x w3. This weight was then adjusted by the calibration procedure to produce the final individual weight.
127
Appendix B Development and cognitive testing of the new questionnaires
B.1.1 Overview
Full details of the development procedure and pre testing of the new physical activity questionnaires
are given in the cognitive report of findings provided to the Agency in August 2006.1 This section
therefore gives a brief overview of the changes to the questionnaire, the questionnaire sources and
rationale for inclusion.
B.1.2 Adults
The NDNS questionnaire was developed from scratch but it used elements from other
questionnaires.1 Table B1 summarises the main features of the NDNS physical activity questionnaire
for adults.
Table B1 Main features of the NDNS physical activity questionnaire for adults
Questionnaire item Rationale Source
Occupational activity
questions
These questions were adapted from the
English version of the long IPAQ (International
physical activity questionnaire).
www.ipaq.ki.se/ipaq.htm
Housework and
Gardening
Adapted from the Health Survey for England
(HSE) questionnaire
Walking questions Adapted from the HSE questionnaire, but
included bouts lasting 5 minutes or more
Sports and organised
activities - duration
Adapted from the HSE questionnaire, but
included bouts lasting 5 minutes or more
Sedentary activity
questions
No such questions included in the NDNS
questionnaire
128
B.1.3 Children
The table below (B2) documents the broad question areas developed for the new children’s physical
activity module, briefly describes the rationale for inclusion and, where appropriate, details original
source material.
Table B2 Main features of the NDNS physical activity questionnaire for children
Questionnaire item Rationale Source
School time-related
activities
School breaks and transportation to school
offer important opportunities for children to
be active.
Travel to and from
school
A new set of questions were developed to
look at active transportation to and from
school to capture this data. This has policy
importance in that it captures both domain
information (activity for transportation) and
is a useful recall technique by breaking
down potential periods of activity by linking
it specifically to a particular purpose or time
period.
New questions developed as
we did not locate any
questionnaires for children
that were appropriate for
NDNS
Active during school
breaks
The rationale for this is the same as for
transportational activity in that it offers
important opportunities for children to be
active and this information has not been
captured by any existing questionnaires.
New questions as we did not
locate any questionnaires for
children that were appropriate
for NDNS
Active play It is widely recognised that play activities
contribute to overall activity levels.
New questions as we did not
locate any questionnaires for
children that were appropriate
for NDNS
Non-school based,
formal, sports
activities
Again, the distinction between this grouping
of activities and active play activities has
been widely recognised to be important and
has been made on most child/adolescent
physical activity questionnaires.
Modelled after adults’ HSE
sports section but tailored for
children’s activities
Sedentary activity
questions
No such questions for NDNS
129
1 MacKenzie H, Collins D, Kitchen S. National Diet and Nutrition Survey. Development of physical activity and sun exposure questions: findings from cognitive interviews. London: NatCen, 2006.