Neighborhood Profile: Manhattan’s Chinatown Asian American Federation of New York Census Information Center Major Chinatown Census Statistics at a Glance Bayard Street in Manhattan’s Chinatown Population 2000 Total Population 84,840 2000 Asian Population 54,650 Asian Population as a Percentage of the Total Population 66% Immigration 2000 Total Foreign-Born Population 50,141 Foreign-Born Percentage of General Population 59% 2000 Asian Foreign-Born Population 44,583 Educational Attainment (Adults 25 and Older) Number of Adults Without a High School Diploma 35,721 Percentage of Adults Without a High School Diploma 60% Number of Asian Adults Without a High School Diploma 27,189 Percentage of Asian Adults Without a High School Diploma 70% Limited English Proficiency (Speaks English “Well,” “Not Well,” or “Not at All”) Age 18-64 31,858 65 and Older 9,475 Household Income Number of Households Earning Less Than $20,000 13,544 Percentage of Households Earning Less Than $20,000 45% Number of Households Earning More Than $100,000 1,950 Percentage of Households Earning More Than $100,000 6% Poverty Number of Individuals Living in Poverty 25,755 Percentage of Total Population Living in Poverty 31% Number of Elderly (Over the Age of 65) Living in Poverty 4,573 Percent of Elderly Living in Poverty 35% Number of Children (Under 18) Living in Poverty 6,025 Percent of Children Living in Poverty 40% Introduction This document provides a socioeconomic profile of Manhattan’s Chinatown. 1 Using data from the 1990 and 2000 U.S. censuses, it describes the neighborhood in terms of geography, population size and composition, immigration, citizenship, education, English abilities, income, poverty, and housing. 2 Census indicators portray a unique community with higher levels of vulnerability and need than New York City as a whole in 2000. Because Asian Americans comprise a majority of Chinatown residents, special references to the neighborhood’s Asian population will be made in many categories. 3 Asians were also the only racial group large enough to provide complete data sets for all Chinatown census tracts in 2000 due to U.S. Census Bureau confidentiality rules. For broader context, Chinatown’s demographic patterns and statistics will be compared with those for the general New York City and Manhattan populations. 4 This document offers background for understanding Chinatown’s characteristics and needs following the further weakening of its economic, social and physical infrastructure as a result of the events of September 11, 2001. The Asian American Federation documented these effects, including severe job, wage and business losses, as well as parking and transportation disruption, in research reports titled Chinatown After September 11 th : An Economic Impact Study and Chinatown One Year After September 11 th : An Economic Impact Study (which can be viewed at www.aafny.org). Drawing on census data and on extensive primary and secondary research, these Federation reports depicted a neighborhood that was extremely sensitive to the economic and physical damage wrought by September 11 th . Population Chinatown in 2000 had a total population of 84,840, reflecting a 3 percent increase from 82,065 in 1990. Of the 2000 population, the majority (64 percent, or 54,650) were of Asian descent compared with the city’s overall Asian composition of 10 percent. 5 Within Chinatown’s Asian population, the two largest subgroups were Chinese (96 percent, or 53,479) and Asian Indian (1.5 percent, or 801). 6 At 13,900 (16
Transcript
Neighborhood Profile: Manhattan’s Chinatown Asian American Federation of New York Census Information Center
Major Chinatown Census Statistics at a Glance
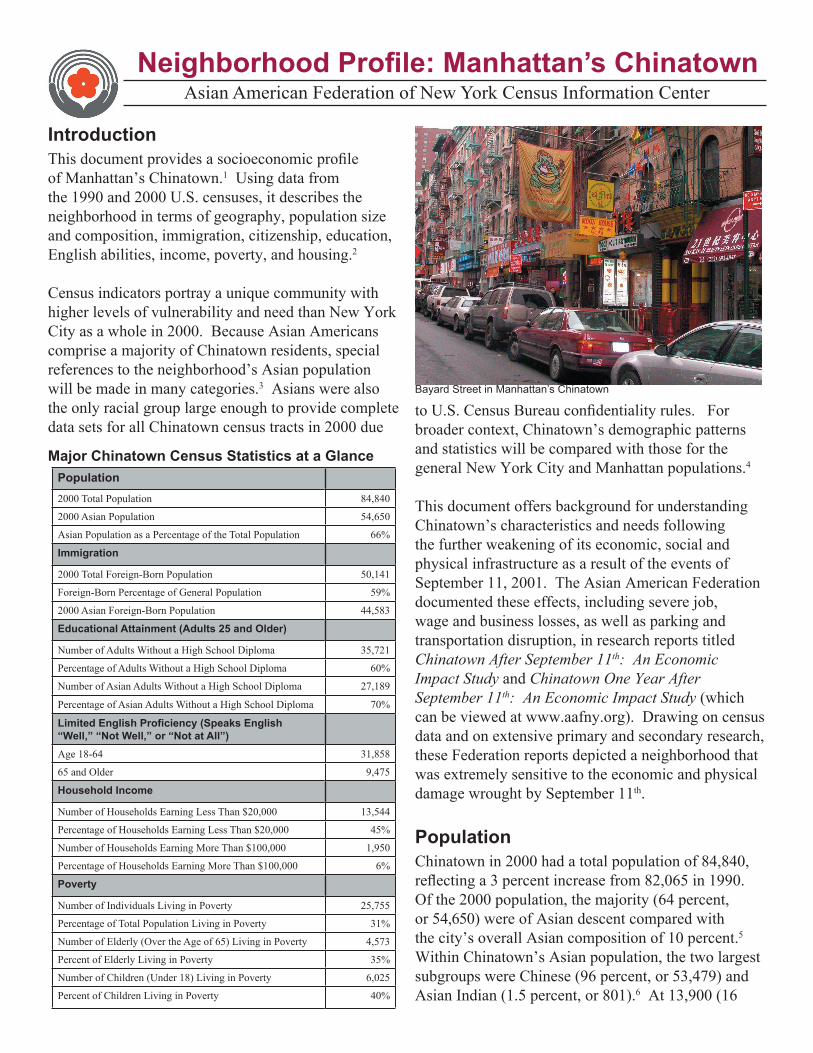
Bayard Street in Manhattan’s Chinatown
Population2000 Total Population 84,840
2000 Asian Population 54,650
Asian Population as a Percentage of the Total Population 66%
Immigration
2000 Total Foreign-Born Population 50,141
Foreign-Born Percentage of General Population 59%
2000 Asian Foreign-Born Population 44,583
Educational Attainment (Adults 25 and Older)
Number of Adults Without a High School Diploma 35,721
Percentage of Adults Without a High School Diploma 60%
Number of Asian Adults Without a High School Diploma 27,189
Percentage of Asian Adults Without a High School Diploma 70%
Limited English Proficiency (Speaks English “Well,” “Not Well,” or “Not at All”)Age 18-64 31,858
65 and Older 9,475
Household Income
Number of Households Earning Less Than $20,000 13,544
Percentage of Households Earning Less Than $20,000 45%
Number of Households Earning More Than $100,000 1,950
Percentage of Households Earning More Than $100,000 6%
Poverty
Number of Individuals Living in Poverty 25,755
Percentage of Total Population Living in Poverty 31%
Number of Elderly (Over the Age of 65) Living in Poverty 4,573
Percent of Elderly Living in Poverty 35%
Number of Children (Under 18) Living in Poverty 6,025
Percent of Children Living in Poverty 40%
IntroductionThis document provides a socioeconomic profile of Manhattan’s Chinatown.1 Using data from the 1990 and 2000 U.S. censuses, it describes the neighborhood in terms of geography, population size and composition, immigration, citizenship, education, English abilities, income, poverty, and housing.2
Census indicators portray a unique community with higher levels of vulnerability and need than New York City as a whole in 2000. Because Asian Americans comprise a majority of Chinatown residents, special references to the neighborhood’s Asian population will be made in many categories.3 Asians were also the only racial group large enough to provide complete data sets for all Chinatown census tracts in 2000 due
to U.S. Census Bureau confidentiality rules. For broader context, Chinatown’s demographic patterns and statistics will be compared with those for the general New York City and Manhattan populations.4
This document offers background for understanding Chinatown’s characteristics and needs following the further weakening of its economic, social and physical infrastructure as a result of the events of September 11, 2001. The Asian American Federation documented these effects, including severe job, wage and business losses, as well as parking and transportation disruption, in research reports titled Chinatown After September 11th: An Economic Impact Study and Chinatown One Year After September 11th: An Economic Impact Study (which can be viewed at www.aafny.org). Drawing on census data and on extensive primary and secondary research, these Federation reports depicted a neighborhood that was extremely sensitive to the economic and physical damage wrought by September 11th.
PopulationChinatown in 2000 had a total population of 84,840, reflecting a 3 percent increase from 82,065 in 1990. Of the 2000 population, the majority (64 percent, or 54,650) were of Asian descent compared with the city’s overall Asian composition of 10 percent.5 Within Chinatown’s Asian population, the two largest subgroups were Chinese (96 percent, or 53,479) and Asian Indian (1.5 percent, or 801).6 At 13,900 (16
71 percent of the Elderly in Chinatown had Limited English
Proficiency
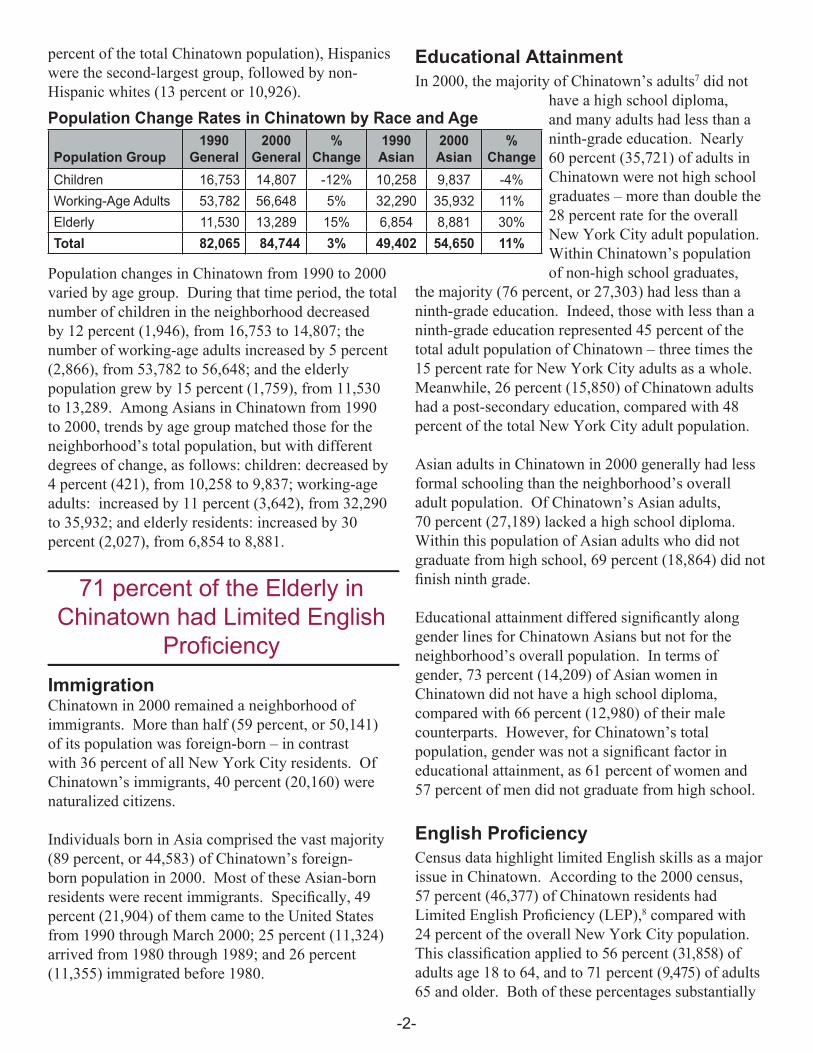
Population Change Rates in Chinatown by Race and Age
percent of the total Chinatown population), Hispanics were the second-largest group, followed by non-Hispanic whites (13 percent or 10,926).
Population changes in Chinatown from 1990 to 2000 varied by age group. During that time period, the total number of children in the neighborhood decreased by 12 percent (1,946), from 16,753 to 14,807; the number of working-age adults increased by 5 percent (2,866), from 53,782 to 56,648; and the elderly population grew by 15 percent (1,759), from 11,530 to 13,289. Among Asians in Chinatown from 1990 to 2000, trends by age group matched those for the neighborhood’s total population, but with different degrees of change, as follows: children: decreased by 4 percent (421), from 10,258 to 9,837; working-age adults: increased by 11 percent (3,642), from 32,290 to 35,932; and elderly residents: increased by 30 percent (2,027), from 6,854 to 8,881.
Immigration Chinatown in 2000 remained a neighborhood of immigrants. More than half (59 percent, or 50,141) of its population was foreign-born – in contrast with 36 percent of all New York City residents. Of Chinatown’s immigrants, 40 percent (20,160) were naturalized citizens.
Individuals born in Asia comprised the vast majority (89 percent, or 44,583) of Chinatown’s foreign-born population in 2000. Most of these Asian-born residents were recent immigrants. Specifically, 49 percent (21,904) of them came to the United States from 1990 through March 2000; 25 percent (11,324) arrived from 1980 through 1989; and 26 percent (11,355) immigrated before 1980.
Educational AttainmentIn 2000, the majority of Chinatown’s adults7 did not
have a high school diploma, and many adults had less than a ninth-grade education. Nearly 60 percent (35,721) of adults in Chinatown were not high school graduates – more than double the 28 percent rate for the overall New York City adult population. Within Chinatown’s population of non-high school graduates,
the majority (76 percent, or 27,303) had less than a ninth-grade education. Indeed, those with less than a ninth-grade education represented 45 percent of the total adult population of Chinatown – three times the 15 percent rate for New York City adults as a whole. Meanwhile, 26 percent (15,850) of Chinatown adults had a post-secondary education, compared with 48 percent of the total New York City adult population.
Asian adults in Chinatown in 2000 generally had less formal schooling than the neighborhood’s overall adult population. Of Chinatown’s Asian adults, 70 percent (27,189) lacked a high school diploma. Within this population of Asian adults who did not graduate from high school, 69 percent (18,864) did not finish ninth grade.
Educational attainment differed significantly along gender lines for Chinatown Asians but not for the neighborhood’s overall population. In terms of gender, 73 percent (14,209) of Asian women in Chinatown did not have a high school diploma, compared with 66 percent (12,980) of their male counterparts. However, for Chinatown’s total population, gender was not a significant factor in educational attainment, as 61 percent of women and 57 percent of men did not graduate from high school. English ProficiencyCensus data highlight limited English skills as a major issue in Chinatown. According to the 2000 census, 57 percent (46,377) of Chinatown residents had Limited English Proficiency (LEP),8 compared with 24 percent of the overall New York City population. This classification applied to 56 percent (31,858) of adults age 18 to 64, and to 71 percent (9,475) of adults 65 and older. Both of these percentages substantially
-2-
Almost one-third of Chinatown residents live below the
poverty line.
exceeded those for the same age groups within the general city population: 25 percent and 27 percent, respectively. The vast majority of adults in Chinatown (81 percent) with LEP in 2000 spoke an Asian or Pacific Island language.
Household IncomeCensus information portrays Chinatown as a low-income neighborhood, particularly for Manhattan and for Asians in Manhattan. According to the 2000 census, 45 percent (13,544) of all Chinatown households earned $20,000 or less a year, compared with 25 percent of all Manhattan households. Meanwhile, at the other end of the income scale, 6 percent (1,950) of all households in Chinatown earned more than $100,000, compared with 24 percent of Manhattan households.
In relationship to the total Asian American population in Manhattan, Chinatown contains a large percentage of low-income households. Nearly half (49 percent, or 8,481) of all Asian households in Chinatown earned less than $20,000 a year, compared with 36 percent of
all Asian households in Manhattan. At the other end of the spectrum, 5 percent (794) of all Asian households in Chinatown earned more than $100,000, compared with 19 percent of all Asian households in Manhattan.
Poverty Poverty was much more common in Chinatown than in New York City as a whole, with poverty rates particularly high for children and the elderly, according to 2000 census figures.9 Of all Chinatown residents, almost one-third (31 percent, or 25,755) lived below the poverty level, compared with 21 percent of all city residents.
However, poverty rates for Chinatown residents were higher for certain age groups. About 40 percent (6,025) of children and 35 percent (4,573) of senior
-3-
68 percent of Chinatown households that paid more
than 40 percent of income to rent earned less than $15,000
a year.
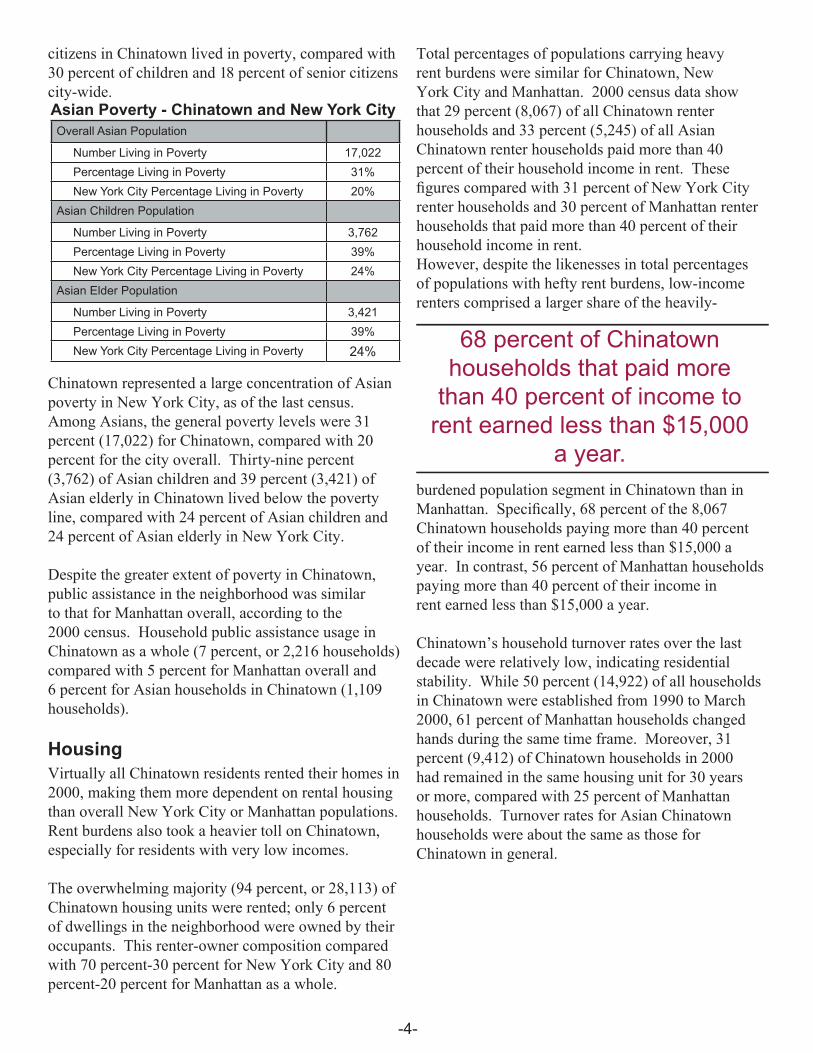
Asian Poverty - Chinatown and New York CityOverall Asian Population
Number Living in Poverty 17,022 Percentage Living in Poverty 31% New York City Percentage Living in Poverty 20%Asian Children Population
Number Living in Poverty 3,762 Percentage Living in Poverty 39% New York City Percentage Living in Poverty 24%Asian Elder Population
Number Living in Poverty 3,421 Percentage Living in Poverty 39% New York City Percentage Living in Poverty 24%
citizens in Chinatown lived in poverty, compared with 30 percent of children and 18 percent of senior citizens city-wide.
Chinatown represented a large concentration of Asian poverty in New York City, as of the last census. Among Asians, the general poverty levels were 31 percent (17,022) for Chinatown, compared with 20 percent for the city overall. Thirty-nine percent (3,762) of Asian children and 39 percent (3,421) of Asian elderly in Chinatown lived below the poverty line, compared with 24 percent of Asian children and 24 percent of Asian elderly in New York City.
Despite the greater extent of poverty in Chinatown, public assistance in the neighborhood was similar to that for Manhattan overall, according to the 2000 census. Household public assistance usage in Chinatown as a whole (7 percent, or 2,216 households) compared with 5 percent for Manhattan overall and 6 percent for Asian households in Chinatown (1,109 households).
HousingVirtually all Chinatown residents rented their homes in 2000, making them more dependent on rental housing than overall New York City or Manhattan populations. Rent burdens also took a heavier toll on Chinatown, especially for residents with very low incomes.
The overwhelming majority (94 percent, or 28,113) of Chinatown housing units were rented; only 6 percent of dwellings in the neighborhood were owned by their occupants. This renter-owner composition compared with 70 percent-30 percent for New York City and 80 percent-20 percent for Manhattan as a whole.
Total percentages of populations carrying heavy rent burdens were similar for Chinatown, New York City and Manhattan. 2000 census data show that 29 percent (8,067) of all Chinatown renter households and 33 percent (5,245) of all Asian Chinatown renter households paid more than 40 percent of their household income in rent. These figures compared with 31 percent of New York City renter households and 30 percent of Manhattan renter households that paid more than 40 percent of their household income in rent. However, despite the likenesses in total percentages of populations with hefty rent burdens, low-income renters comprised a larger share of the heavily-
burdened population segment in Chinatown than in Manhattan. Specifically, 68 percent of the 8,067 Chinatown households paying more than 40 percent of their income in rent earned less than $15,000 a year. In contrast, 56 percent of Manhattan households paying more than 40 percent of their income in rent earned less than $15,000 a year. Chinatown’s household turnover rates over the last decade were relatively low, indicating residential stability. While 50 percent (14,922) of all households in Chinatown were established from 1990 to March 2000, 61 percent of Manhattan households changed hands during the same time frame. Moreover, 31 percent (9,412) of Chinatown households in 2000 had remained in the same housing unit for 30 years or more, compared with 25 percent of Manhattan households. Turnover rates for Asian Chinatown households were about the same as those for Chinatown in general.
-4-
Chinatown’s garment industry lost an estimated $490 million in the year after September 11th.
The Impact of September 11th Building on Census data, the Federation conducted two economic analyses of Chinatown in the aftermath of September 11th. Designed to measure the impact of the disaster on Chinatown’s businesses and workers in particular, these two studies – published eight months and one year after the tragedy – provided detailed data to compliment census information.
The Federation gathered and assessed government, business and relief-agency information, along with data reflecting more than 10,000 workers’ experiences. The Federation’s reports documented a commercial hub of 3,855 Chinese-owned and -operated businesses, including 1,423 retail stores and 241 wholesale outlets. Among the retail establishments were more than 250 restaurants, as well as 500 specialty stores, such as jewelry, gift and apparel shops. In addition, the Federation counted 35 bank branches in the neighborhood, with total deposits exceeding $5.44 billion. Chinatown on the eve of September 11th also had 246 garment factories, representing one-fifth of all garment shops in Manhattan and employing nearly 14,000 workers.
The Federation’s research showed acute, pervasive and persistent economic impacts of the tragedy on Chinatown. For example, Chinatown’s garment industry lost an estimated $490 million and more than one-fourth of the neighborhood’s clothing factories closed in the year after September 11th. A year later, many retail businesses had shut their doors, and, of those remaining, many reported revenue decreases averaging 20 percent.
As a consequence of business hardships, the studies found, nearly three-quarters of Chinatown workers were laid off after September 11th, and one-quarter of the neighborhood’s employees (close to 8,000 workers) were still jobless three months later. The Federation determined that a year after the disaster, unemployment remained common, particularly for female garment workers age 41 to 54, who relied on the local economy for their livelihoods and had limited work skills and LEP. Furthermore, 60 percent of garment workers and 30 percent of restaurant
employees who held jobs a year after September 11th were working reduced hours.
Implications Analysis of 2000 census data together with results of the Federation’s economic studies of Chinatown indicates that before September 11th, the community was both a neighborhood of immigrants and a busy commercial hub that provided employment for many residents. Chinatown’s population faced a number of social development challenges, indicated by a low percentage of high school graduates, low levels of English proficiency, and high levels of child and senior-citizen poverty. These factors created a pre-existing sensitivity to any economic shifts in New York City and especially, in Lower Manhattan.
Against this backdrop and given its location (less than ten blocks from Ground Zero), Chinatown suffered inordinate economic, social and physical damage in the wake of September 11th. The initial shock waves of the tragedy hit Chinatown particularly hard, exacerbating vulnerabilities and needs. In addition, the demographic factors described in this document have hindered the neighborhood’s recovery. Thus, the quality of life for Chinatown residents has fallen sharply from the already-low levels reflected in 2000 census data.
Chinatown’s former business vitality and the prolonged effects of commercial decline point to a need for economic policies and programs that support business development in the neighborhood while also enhancing economic conditions for residents. Job creation, work-force development, wage protection and affordable housing are among the priorities for improving living conditions for Chinatown’s population and simultaneously strengthening the local business community.
The high rates of child and senior-citizen poverty raise social policy concerns. Ensuring adequate family support, health-care access, social services, and educational enrichment are necessary policy considerations in order not to leave any child in Chinatown behind. The growing immigrant elderly population that is confronted with severe poverty suggests a need to improve retirement protections, as well as expand the availability of housing, health care and social services for seniors.
-5-
Language access also is a critical issue for Chinatown’s population of primarily recent immigrants. More English as a Second Language (ESL) classes are needed to overcome Chinatown’s limited English ability, which affects close to half of the neighborhood’s working-age adults and more than half of its elderly residents. Chinatown residents need to acquire better English skills and, in the transition, more widely available in-language information and services to raise their quality of life, better protect their civil rights and increase their civic participation.
Footnotes1 Unless otherwise specified, all numbers are from Summary Files One, Two and Three of the 2000 U.S. Census. 2 Please note that each data section rates and percentages are derived from its own data universe. Therefore, population tallies for one particular topic will not necessarily correspond with those for another topic.3 In a significant policy change effective with the 2000 census, the U.S. Census Bureau allowed respondents to give more than one answer in the racial identification section. The direct consequence of this change was the creation of two major reporting groups: “Alone,” and “Alone or in Any Combination.” Where possible, this profile uses the latter category to be as inclusive as possible. For further information, please refer to the Technical Notes at the end of this profile.4 New York City is defined as all five boroughs.5 Based on the tabulation of the Public Law 94-171 Summary File of all individuals who identified themselves as either entirely or partially Asian. Based on those who identified themselves exclusively as Asian and from only one Asian group, the Asian population in Chinatown in 2000 was 54,650, or 64 percent of the neighborhood’s total population. 6 When using “Alone” numbers, Chinese were the largest Asian group in Chinatown, with 52,182 people, or 93 percent of Chinatown’s Asian population, followed by Asian Indian, with 652 people, or 1 percent of that population. 7 The Census Bureau defines adults in this context as residents age 25 and older. 8 “Limited English Proficiency,” as used in the profile, refers to individuals who spoke English “well,” “not well,” or “not at all” as of Census 2000. 9 Families and persons are classified as below poverty level if their total family income or unrelated individual income was less than the poverty threshold specified for the applicable family size, age of householder, and number of related children under 18 living at home in 1999. For these thresholds, please see http://www.census.gov/hhes/poverty/threshld/thresh99.html.
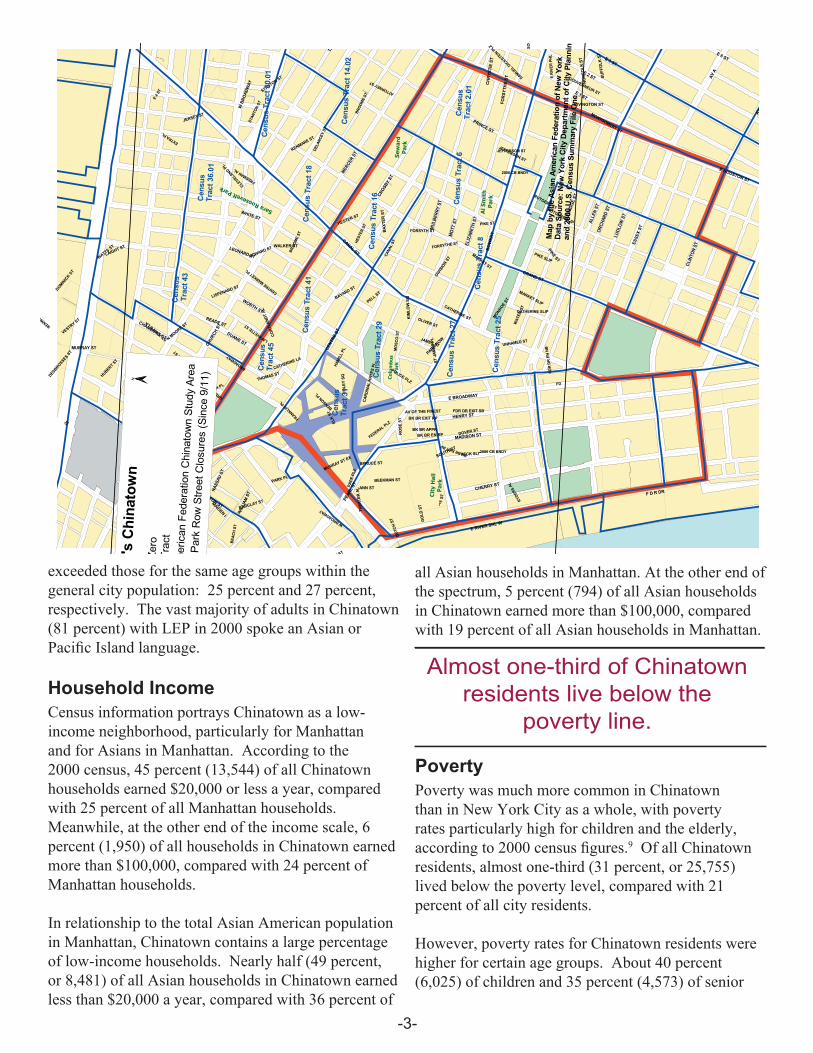
Technical NotesGeographyChinatown as discussed in this profile is a residential and business area that is defined by the presence of Asian American residents, workers, and Chinese-owned and -operated businesses in Lower Manhattan. The Chinatown study area is bounded roughly by Houston Street to the north, Broadway to the west, Montgomery and Ridge streets to the east, and South Street to the south. These boundaries contain a group of census tracts with a population greater than 500 Asian individuals or an Asian population comprising more than 25 percent of the total population in a tract. The census tracts that fell within these parameters were 2.01, 6, 8, 14.02, 16, 18, 25, 27, 29, 30.01, 36.01, 41 and 43. Two additional tracts, 31 and 45, failed to meet these population criteria, but were included in the definition of Chinatown because they contain a number of Chinese-owned garment manufacturers, the largest source of employment in
Chinatown. However, these two tracts were not included in population tabulations due to the small number of Asian residents in these tracts. Race CategoriesThe 2000 census was the first decennial census in which respondents were allowed to mark more than one race. As a consequence, Census 2000 race information is far more complicated than such data from previous censuses. For example, 2000 data include results for single-race as well as multiple-race responses. “Asian Alone” corresponds to the respondents who reported exactly one Asian group and no other race category. “Alone” should be considered the minimum population size in any analysis that uses Census 2000 data. To be as inclusive as possible, this profile uses “Asian Alone or in Any Combination” numbers.
“Alone or in Any Combination” corresponds to the responses (not respondents) that included the selected Asian group, either alone or in any combination with other Asian groups or other race categories. If a respondent selected an Asian group and another racial group (e.g., Korean and black), that individual, while excluded from the “Asian Alone” count, was tallied in the “Alone or in Any Combination” count for the Asian group and the other racial group. Hence, some overlap in the “In Combination” numbers occurred. “Alone or in Any Combination” should be considered the maximum population size in any analysis that uses Census 2000 data.
About This ProfileThis is one of a series of neighborhood and Asian American population profiles prepared by the Asian American Federation of New York’s Census Information Center (CIC) to increase understanding of the rapidly growing and diverse Asian American population in New York City.
The Asian American Federation of New York is a nonprofit leadership organization that works collaboratively to meet the critical needs of Asian Americans in the New York metropolitan area. The Federation strengthens community-based health and social services capacity by supporting its 35 member agencies and other grassroots organizations; amplifies the Asian American civic voice by defining, analyzing, and advocating for policies to address key community issues; and encourages strategic, high-impact philanthropy within the Asian American community by increasing opportunities for connecting time, talent and financial resources with pressing community needs. For more information, visit www.aafny.org.
Data citations from this profile should include the following acknowledgment: “Data derived from analysis by the Asian American Federation Census Information Center.”
For More InformationFor more information regarding this profile, please contact the Asian American Federation of New York Census Information Center, at (212) 344-5878 x19 or [email protected], or visit www.aafny.org/cic/.
Funding support for this profile series has been provided generously by the Citigroup Foundation and the C.J. Huang Foundation.
Asian American Federation of New York120 Wall Street, 3rd Floor, New York, NY 10005Tel: (212) 344-5878 | Fax (212) 344-5636E-mail: [email protected] | Website: www.aafny.org